 An official website of the United States government
 Supplemental Tables
Number
Title
Download
View
NumberSTAL-1
STAL-1
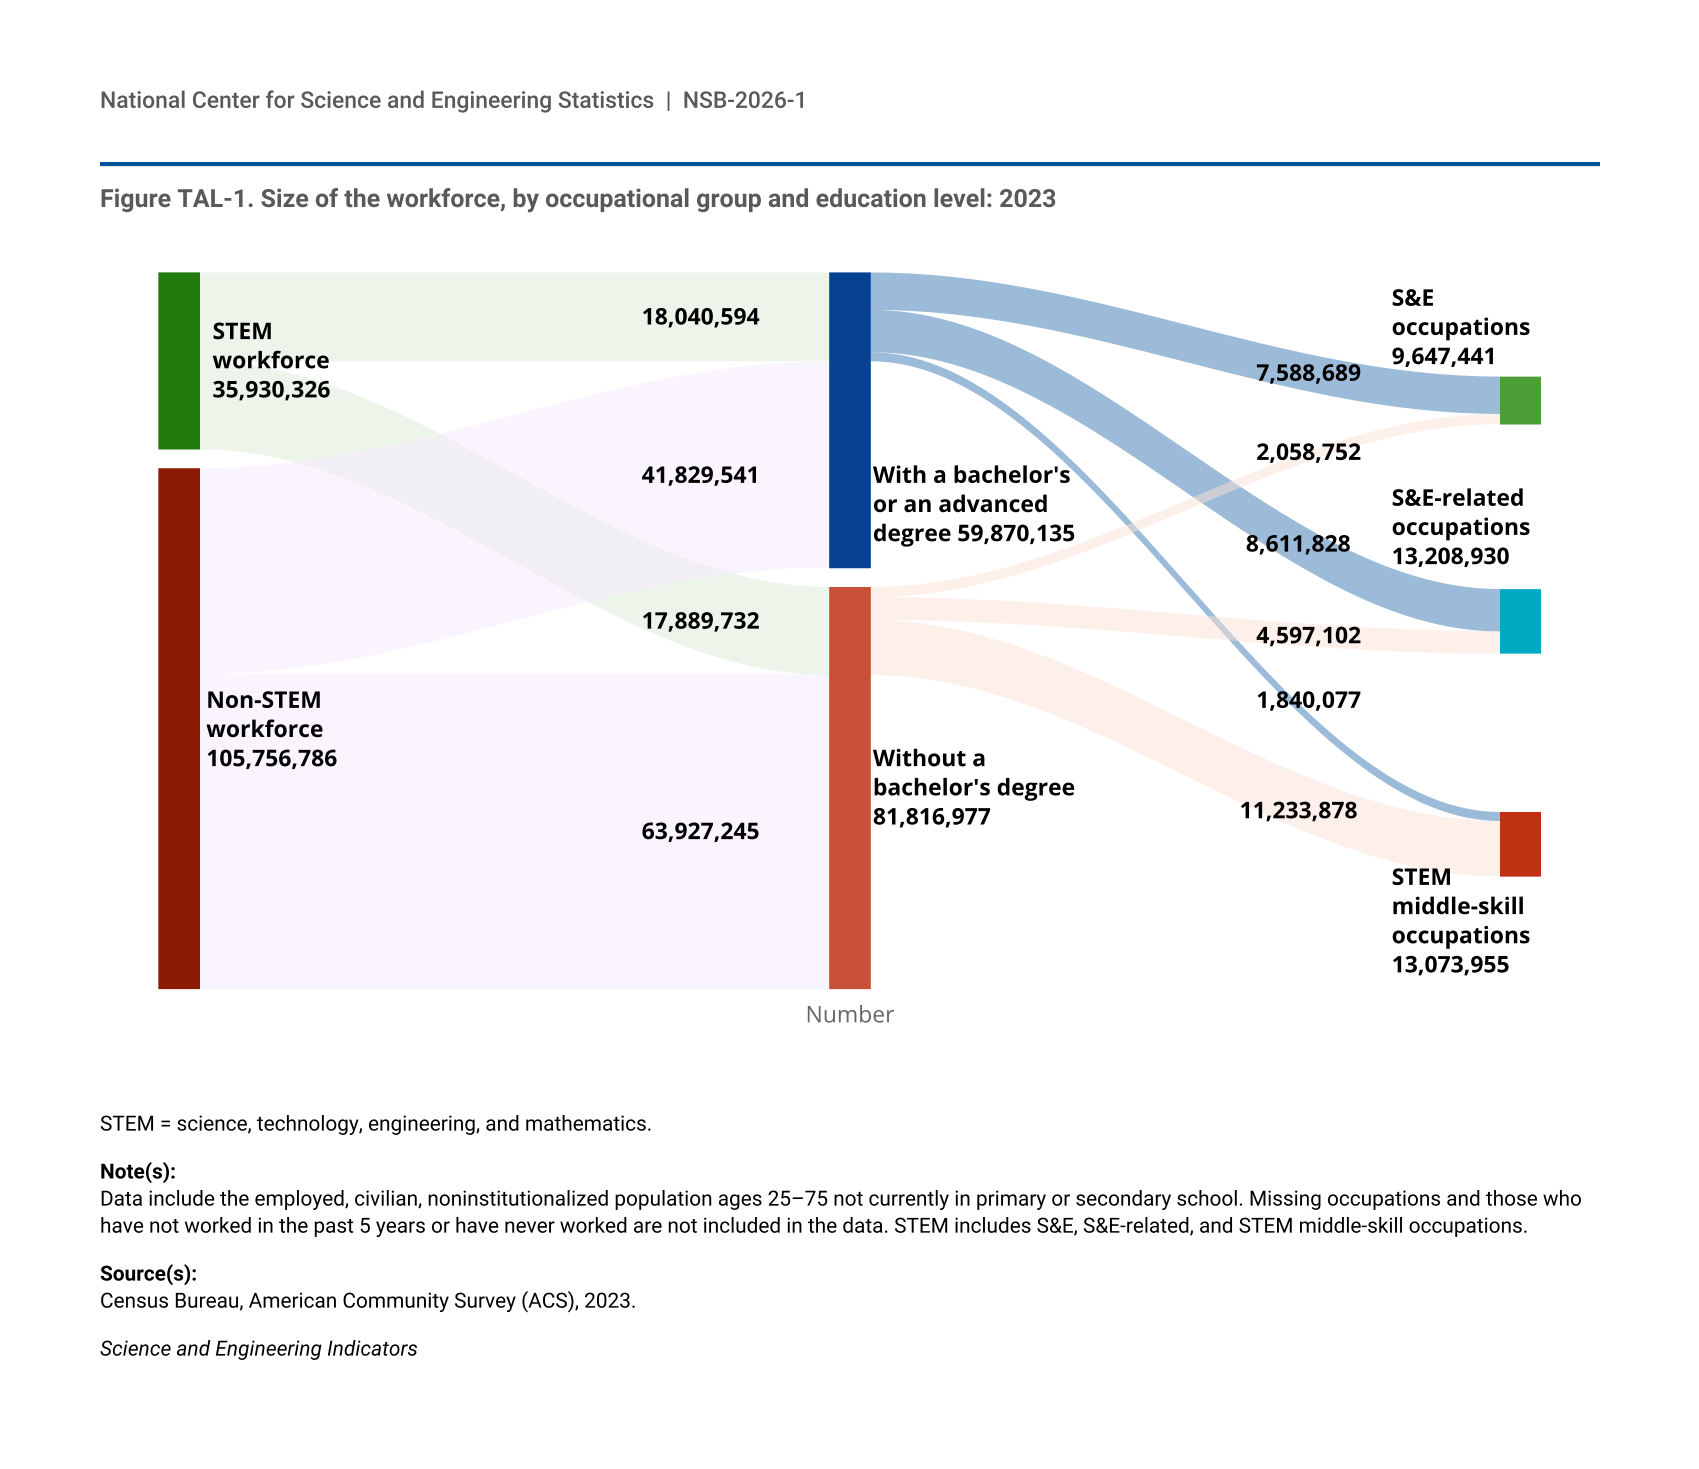
Workers, by occupational group, race and ethnicity, educational attainment, geography, and major industries: 2023
TitleWorkers, by occupational group, race and ethnicity, educational attainment, geography, and major industries: 2023
NumberSTAL-2
STAL-2
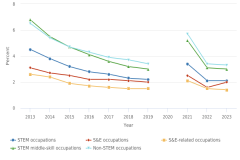
Working-age individuals, by occupational group and employment status: 2013–23
TitleWorking-age individuals, by occupational group and employment status: 2013–23
NumberSTAL-3
STAL-3
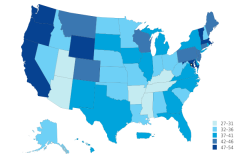
Representation of STEM workers, by occupational group, across states: 2023
TitleRepresentation of STEM workers, by occupational group, across states: 2023
NumberSTAL-4
STAL-4
Workers, by state, occupational group, and educational attainment: 2023
TitleWorkers, by state, occupational group, and educational attainment: 2023
NumberSTAL-5
STAL-5
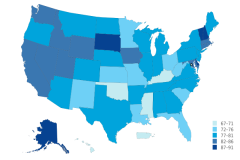
Participation in the workforce, by state and occupational group: 2023
TitleParticipation in the workforce, by state and occupational group: 2023
NumberSTAL-6
STAL-6
STEM workforce, by state, occupational group, and education level: 2023
TitleSTEM workforce, by state, occupational group, and education level: 2023
NumberSTAL-7
STAL-7
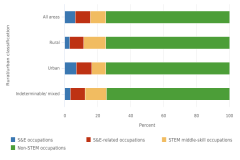
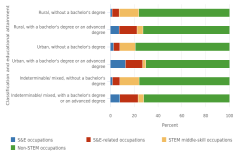
Workers, by rural-urban classification, occupational group, and educational attainment: Five-year sample, 2019–23
TitleWorkers, by rural-urban classification, occupational group, and educational attainment: Five-year sample, 2019–23
NumberSTAL-8
STAL-8
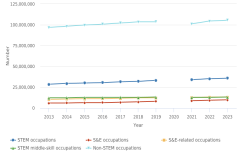
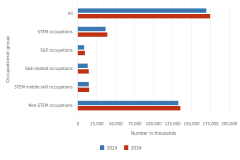
Workers, by state and occupational group: 2013–23
TitleWorkers, by state and occupational group: 2013–23
NumberSTAL-10
STAL-10
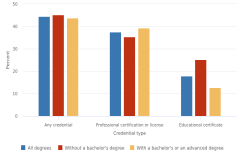
STEM workers, by occupational group, credential type, credential attainment, and educational attainment: 2024
TitleSTEM workers, by occupational group, credential type, credential attainment, and educational attainment: 2024
NumberSTAL-11
STAL-11
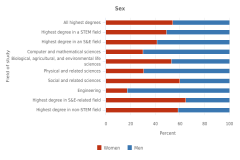
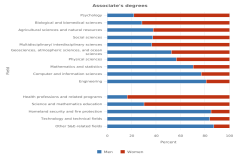
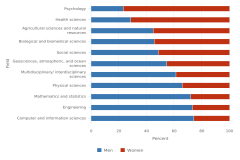
Measures of population with a bachelor's or an advanced degree, by field of study, race and ethnicity, and sex: 2023
TitleMeasures of population with a bachelor's or an advanced degree, by field of study, race and ethnicity, and sex: 2023
NumberSTAL-12
STAL-12
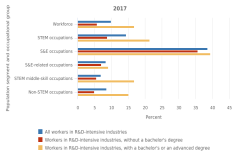
Workforce, STEM workforce by place of birth, and the educational attainment and citizenship status of the foreign-born STEM workforce, by major industry: 2023
TitleWorkforce, STEM workforce by place of birth, and the educational attainment and citizenship status of the foreign-born STEM workforce, by major industry: 2023
NumberSTAL-13
STAL-13
Industries with R&D intensity higher than the average across industries: 2022
TitleIndustries with R&D intensity higher than the average across industries: 2022
NumberSTAL-14
STAL-14
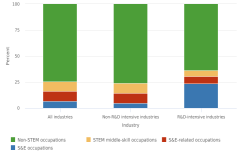
Workers, by occupational group, educational level, and industry: 2017 and 2022
TitleWorkers, by occupational group, educational level, and industry: 2017 and 2022
NumberSTAL-15
STAL-15
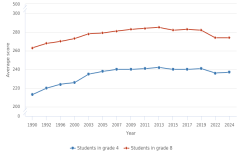
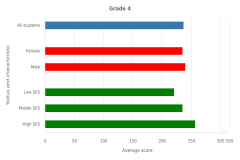
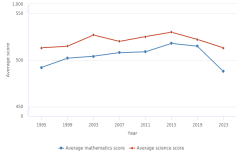
Average scores of students in grades 4 and 8 on the NAEP mathematics assessment, by student grade and characteristic: 1990–2024
TitleAverage scores of students in grades 4 and 8 on the NAEP mathematics assessment, by student grade and characteristic: 1990–2024
NumberSTAL-16
STAL-16
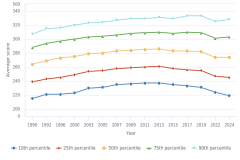
Percentile scores of students in grades 4, 8, and 12 on the NAEP mathematics assessment: 1990–2024
TitlePercentile scores of students in grades 4, 8, and 12 on the NAEP mathematics assessment: 1990–2024
NumberSTAL-17
STAL-17
Average scores of students in grade 8 on the main NAEP mathematics assessment, by school enrichment offerings: 2024
TitleAverage scores of students in grade 8 on the main NAEP mathematics assessment, by school enrichment offerings: 2024
NumberSTAL-18
STAL-18
Average scores of students in grades 4 and 8 on the NAEP mathematics assessment, by region and school location: 2003–24
TitleAverage scores of students in grades 4 and 8 on the NAEP mathematics assessment, by region and school location: 2003–24
NumberSTAL-19
STAL-19
Average scores of students in grade 12 on the NAEP mathematics assessment, by student characteristic: 2005–24
TitleAverage scores of students in grade 12 on the NAEP mathematics assessment, by student characteristic: 2005–24
NumberSTAL-20
STAL-20
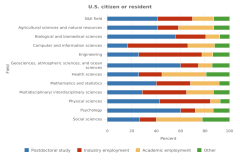
Degrees awarded, by degree level, citizenship status, and field: 2023
TitleDegrees awarded, by degree level, citizenship status, and field: 2023
NumberSTAL-21
STAL-21
Among fall 2009 ninth graders who enrolled in a postsecondary major by December 2017, number who completed a STEM degree, non-STEM degree or no degree: June 2021
TitleAmong fall 2009 ninth graders who enrolled in a postsecondary major by December 2017, number who completed a STEM degree, non-STEM degree or no degree: June 2021
NumberSTAL-22
STAL-22
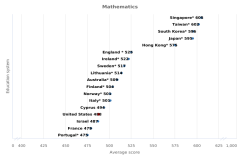
Average scores of 15-year-old students on the PISA mathematics and science literacy scales, by OECD education system: 2022
TitleAverage scores of 15-year-old students on the PISA mathematics and science literacy scales, by OECD education system: 2022
NumberSTAL-23
STAL-23
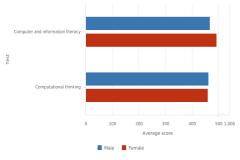
Average CIL and CT scores of students in grade 8 on the ICILS computer science assessment, by education system: 2023
TitleAverage CIL and CT scores of students in grade 8 on the ICILS computer science assessment, by education system: 2023
NumberSTAL-24
STAL-24
Average scores of students in grade 8 on the TIMSS mathematics and science scales among participating economies, by education system: 2023
TitleAverage scores of students in grade 8 on the TIMSS mathematics and science scales among participating economies, by education system: 2023
