|
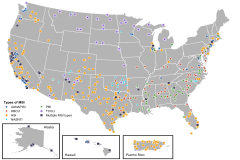
Figure HED-1
|
Minority-serving institutions, by location and type: 2021 |
National Center for Education Statistics
|
Integrated Postsecondary Education Data System (IPEDS), Institutional Characteristics
|
|
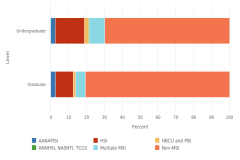
Figure HED-2
|
Minority-serving institutions' enrollment, by type and level: 2015–16 |
National Center for Education Statistics
|
National Postsecondary Student Aid Study
|
|
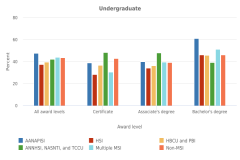
Figure HED-3
|
S&E and S&E-related program enrollment, by award level and type of MSI: 2015–16 |
National Center for Education Statistics
|
National Postsecondary Student Aid Study
|
|
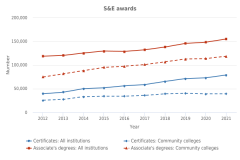
Figure HED-4
|
S&E and S&E-related certificates and associate's degrees awarded, by institution type: 2012–21 |
National Center for Education Statistics
|
Integrated Postsecondary Education Data System (IPEDS), Completions Survey
|
|
Figure HED-5
|
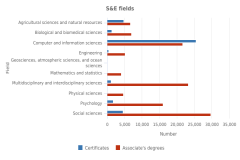
Broad field for S&E certificates and associate's degrees awarded by community colleges: 2021 |
National Center for Education Statistics
|
Integrated Postsecondary Education Data System (IPEDS), Completions Survey
|
|
Figure HED-6
|
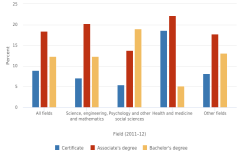
Awards earned by 2011–12 first-time postsecondary students who began postsecondary education in community colleges, by award level and 2011–12 field of study: 2017 |
National Center for Education Statistics
|
Beginning Postsecondary Students Longitudinal Study
|
|
Figure HED-7
|
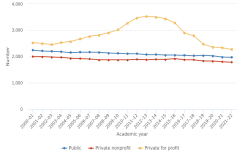
Postsecondary institutions, by institutional control: 2000–22 |
National Center for Education Statistics
|
Integrated Postsecondary Education Data System (IPEDS), Institutional Characteristics
|
|
Figure HED-8
|
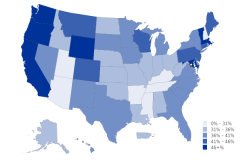
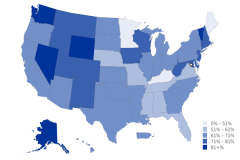
Share of bachelor's degrees awarded in S&E fields, by state: 2021 |
National Center for Education Statistics
|
Integrated Postsecondary Education Data System (IPEDS), Completions Survey
|
|
Figure HED-9
|
Share of doctoral degrees awarded in S&E fields, by state: 2021 |
National Center for Education Statistics
|
Integrated Postsecondary Education Data System (IPEDS), Completions Survey
|
|
Figure HED-10
|
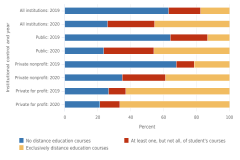
Students enrolled in degree-granting postsecondary institutions, by distance education participation and institutional control: Fall 2019 and fall 2020 |
National Center for Education Statistics
|
Integrated Postsecondary Education Data System (IPEDS), Fall Enrollment
|
|
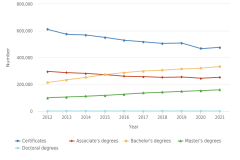
Figure HED-11
|
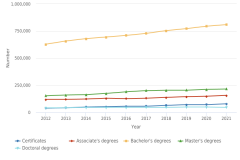
S&E awards conferred, by award level: 2012–21 |
National Center for Education Statistics
|
Integrated Postsecondary Education Data System (IPEDS), Completions Survey
|
|
Figure HED-12
|
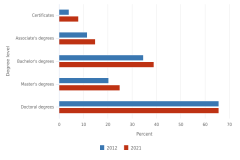
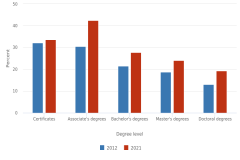
S&E degrees as a percentage of total degrees awarded: 2012 and 2021 |
National Center for Education Statistics
|
Integrated Postsecondary Education Data System (IPEDS), Completions Survey
|
|
Figure HED-13
|
S&E certificates awarded, by field: 2012 and 2021 |
National Center for Education Statistics
|
Integrated Postsecondary Education Data System (IPEDS), Completions Survey
|
|
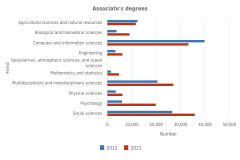
Figure HED-14
|
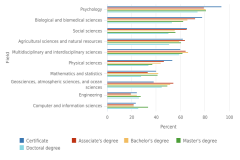
S&E undergraduate degrees awarded, by field: 2012 and 2021 |
National Center for Education Statistics
|
Integrated Postsecondary Education Data System (IPEDS), Completions Survey
|
|
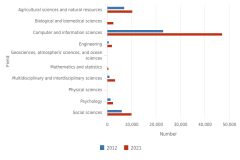
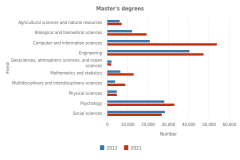
Figure HED-15
|
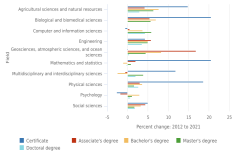
S&E graduate degrees awarded, by field: 2012 and 2021 |
National Center for Education Statistics
|
Integrated Postsecondary Education Data System (IPEDS), Completions Survey
|
|
Figure HED-16
|
S&E-related awards conferred, by award level: 2012–21 |
National Center for Education Statistics
|
Integrated Postsecondary Education Data System (IPEDS), Completions Survey
|
|
Figure HED-17
|
S&E degrees awarded to women, by field and degree level: 2021 |
National Center for Education Statistics
|
Integrated Postsecondary Education Data System (IPEDS), Completions Survey
|
|
Figure HED-18
|
S&E degrees awarded to women, by field and degree level: 2012 and 2021 |
National Center for Education Statistics
|
Integrated Postsecondary Education Data System (IPEDS), Completions Survey
|
|
Figure HED-19
|
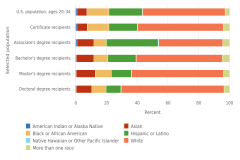
Race and ethnicity of U.S. population ages 20–34 and S&E award recipients, by degree level: 2021 |
National Center for Education Statistics
|
Integrated Postsecondary Education Data System (IPEDS), Completions Survey
|
|
Figure HED-19
|
Race and ethnicity of U.S. population ages 20–34 and S&E award recipients, by degree level: 2021
|
U.S. Census Bureau
|
Population Estimates Program
|
|
Figure HED-20
|
S&E degrees awarded to American Indian or Alaska Native, Black or African American, or Hispanic or Latino students, by degree level: 2012 and 2021 |
National Center for Education Statistics
|
Integrated Postsecondary Education Data System (IPEDS), Completions Survey
|
|
Figure HED-21
|
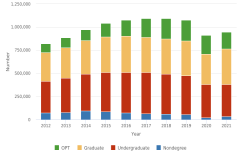
International students enrolled in coursework at U.S. higher education institutions or on optional practical training, by type of student: 2012–21 |
Institute of International Education
|
Open Doors
|
|
Figure HED-22
|
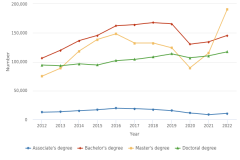
International S&E students on visas enrolled in U.S. higher education institutions, by level of enrollment: 2012–22 |
U.S. Department of Homeland Security, U.S. Immigration and Customs Enforcement
|
Student and Exchange Visitor Information System (SEVIS)
|
|
Figure HED-23
|
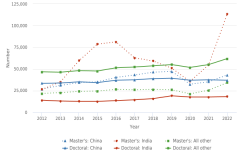
International S&E graduate students on visas enrolled in U.S. higher education institutions, by level and selected country of origin: 2012–22 |
U.S. Department of Homeland Security, U.S. Immigration and Customs Enforcement
|
Student and Exchange Visitor Information System (SEVIS)
|
|
Figure HED-24
|
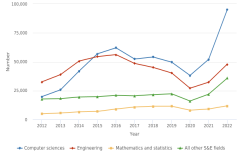
International S&E master's students on visas enrolled in U.S. higher education institutions, by selected field: 2012–22 |
U.S. Department of Homeland Security, U.S. Immigration and Customs Enforcement
|
Student and Exchange Visitor Information System (SEVIS)
|
|
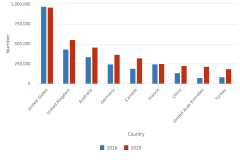
Figure HED-25
|
Internationally mobile students enrolled in tertiary education, by selected country of destination: 2016 and 2020 |
UNESCO Institute for Statistics
|
UIS.Stat database
|
|
Figure HED-26
|
Share of S&E degrees awarded to temporary visa holders, by degree level: 2012–21 |
National Center for Education Statistics
|
Integrated Postsecondary Education Data System (IPEDS), Completions Survey
|
|
Figure HED-27
|
U.S. S&E research doctorate recipients on temporary visas, by selected country or economy of origin: 2012–21 |
National Center for Science and Engineering Statistics
|
Survey of Earned Doctorates
|
|
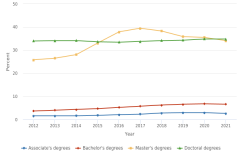
Figure HED-28
|
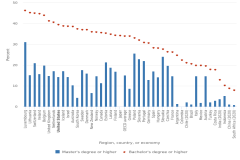
Educational attainment of the 25- to 64-year-old population, by level of education and region, country, or economy: 2021 |
Organisation for Economic Co-operation and Development
|
Education at a Glance
|
|
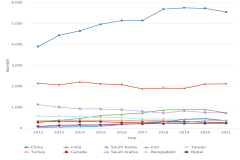
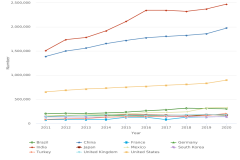
Figure HED-29
|
S&E first university degrees awarded, by selected country: 2011–20 |
Government of India, Ministry of Education, Department of Higher Education
|
All India Survey on Higher Education
|
|
Figure HED-29
|
S&E first university degrees awarded, by selected country: 2011–20
|
Ministry of Education, People's Republic of China
|
Higher Education Data
|
|
Figure HED-29
|
S&E first university degrees awarded, by selected country: 2011–20
|
National Bureau of Statistics of China
|
China Statistical Yearbook
|
|
Figure HED-29
|
S&E first university degrees awarded, by selected country: 2011–20
|
Organisation for Economic Co-operation and Development
|
Education at a Glance
|
|
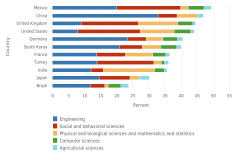
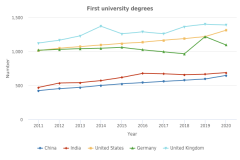
Figure HED-30
|
First university degrees awarded, by S&E field and selected country: 2020 |
Government of India, Ministry of Education, Department of Higher Education
|
All India Survey on Higher Education
|
|
Figure HED-30
|
First university degrees awarded, by S&E field and selected country: 2020
|
Ministry of Education, People's Republic of China
|
Higher Education Data
|
|
Figure HED-30
|
First university degrees awarded, by S&E field and selected country: 2020
|
Organisation for Economic Co-operation and Development
|
Education at a Glance
|
|
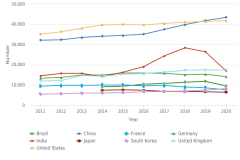
Figure HED-31
|
S&E doctoral degrees awarded, by selected country: 2011–20 |
Government of India, Ministry of Education, Department of Higher Education
|
All India Survey on Higher Education
|
|
Figure HED-31
|
S&E doctoral degrees awarded, by selected country: 2011–20
|
Ministry of Education, People's Republic of China
|
Higher Education Data
|
|
Figure HED-31
|
S&E doctoral degrees awarded, by selected country: 2011–20
|
National Bureau of Statistics of China
|
China Statistical Yearbook
|
|
Figure HED-31
|
S&E doctoral degrees awarded, by selected country: 2011–20
|
Organisation for Economic Co-operation and Development
|
Education at a Glance
|
|
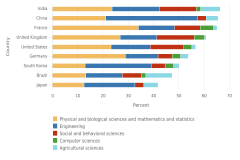
Figure HED-32
|
Doctoral degrees awarded, by S&E field and selected country: 2020 |
Government of India, Ministry of Education, Department of Higher Education
|
All India Survey on Higher Education
|
|
Figure HED-32
|
Doctoral degrees awarded, by S&E field and selected country: 2020
|
Ministry of Education, People's Republic of China
|
Higher Education Data
|
|
Figure HED-32
|
Doctoral degrees awarded, by S&E field and selected country: 2020
|
National Bureau of Statistics of China
|
China Statistical Yearbook
|
|
Figure HED-32
|
Doctoral degrees awarded, by S&E field and selected country: 2020
|
Organisation for Economic Co-operation and Development
|
Education at a Glance
|
|
Figure HED-33
|
S&E degrees awarded per 100,000 of the 20- to 34-year-old population, by selected country: 2011–20 |
Government of India, Ministry of Education, Department of Higher Education
|
All India Survey on Higher Education
|
|
Figure HED-33
|
S&E degrees awarded per 100,000 of the 20- to 34-year-old population, by selected country: 2011–20
|
Ministry of Education, People's Republic of China
|
Higher Education Data
|
|
Figure HED-33
|
S&E degrees awarded per 100,000 of the 20- to 34-year-old population, by selected country: 2011–20
|
National Bureau of Statistics of China
|
China Statistical Yearbook
|
|
Figure HED-33
|
S&E degrees awarded per 100,000 of the 20- to 34-year-old population, by selected country: 2011–20
|
Organisation for Economic Co-operation and Development
|
Education at a Glance
|
|
Figure HED-33
|
S&E degrees awarded per 100,000 of the 20- to 34-year-old population, by selected country: 2011–20
|
United Nations, Department of Economic and Social Affairs, Population Division
|
World Population Prospects
|
|
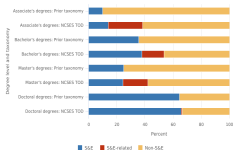
Figure HED-A
|
Degrees awarded, by field, level of degree, and taxonomy: 2019 |
National Center for Education Statistics
|
Integrated Postsecondary Education Data System (IPEDS), Completions Survey
|
|
Table HED-1
|
Institutions, by control and highest award conferred: 2021–22 |
National Center for Education Statistics
|
Integrated Postsecondary Education Data System (IPEDS), Institutional Characteristics
|
|
Table HED-2
|
Total fall enrollment in postsecondary institutions, by institutional control: Selected years, 2000–21 |
National Center for Education Statistics
|
Integrated Postsecondary Education Data System (IPEDS), Fall Enrollment
|
|
Table HED-3
|
Trends in for-profit institution awards, by degree level and field: 2000–21 |
National Center for Education Statistics
|
Integrated Postsecondary Education Data System (IPEDS), Completions Survey
|
|
Table HED-4
|
S&E-related degrees awarded, by degree level and field: 2012 and 2021 |
National Center for Education Statistics
|
Integrated Postsecondary Education Data System (IPEDS), Completions Survey
|
|
Table HED-5
|
S&E degrees awarded to U.S. citizens and permanent residents, by degree level, race, and ethnicity: 2012 and 2021 |
National Center for Education Statistics
|
Integrated Postsecondary Education Data System (IPEDS), Completions Survey
|
|
Table HED-6
|
First-time, full-time undergraduates awarded financial aid, by type of financial aid and institutional control and level: Academic year 2019–20 |
National Center for Education Statistics
|
Digest of Education Statistics
|
|
Table HED-7
|
Borrowing, debt, repayment, and repayment amount among 2015–16 bachelor's degree recipients who borrowed to pay for undergraduate or graduate education: 2020 |
National Center for Education Statistics
|
Baccalaureate and Beyond Longitudinal Study
|
|
Table SAHED-1
|
Crosswalk of S&E fields for international higher education data, by selected region, country, or economy and field |
Government of India, Ministry of Education, Department of Higher Education
|
All India Survey on Higher Education
|
|
Table SAHED-1
|
Crosswalk of S&E fields for international higher education data, by selected region, country, or economy and field
|
Ministry of Education, People's Republic of China
|
Higher Education Data
|
|
Table SAHED-1
|
Crosswalk of S&E fields for international higher education data, by selected region, country, or economy and field
|
National Bureau of Statistics of China
|
China Statistical Yearbook
|
|
Table SAHED-1
|
Crosswalk of S&E fields for international higher education data, by selected region, country, or economy and field
|
Organisation for Economic Co-operation and Development
|
Education at a Glance
|
|
Table SHED-1
|
Minority-serving institutions, by type, institutional control, and highest award conferred: 2021 |
National Center for Education Statistics
|
Integrated Postsecondary Education Data System (IPEDS), Institutional Characteristics
|
|
Table SHED-2
|
Enrollment in minority-serving institutions, by MSI type, degree program level, and whether majoring in S&E and S&E-related fields: 2016 |
National Center for Education Statistics
|
National Postsecondary Student Aid Study
|
|
Table SHED-3
|
Community college awards, by award level and field: 2012–21 |
National Center for Education Statistics
|
Integrated Postsecondary Education Data System (IPEDS), Completions Survey
|
|
Table SHED-4
|
Persistence and attainment among 2011–12 first-time postsecondary students who began postsecondary education in community colleges, by field: 2014 and 2017 |
National Center for Education Statistics
|
Beginning Postsecondary Students Longitudinal Study
|
|
Table SHED-5
|
Bachelor's degree recipients who began postsecondary education at a community college, by field: 2015–16 |
National Center for Education Statistics
|
Beginning Postsecondary Students Longitudinal Study
|
|
Table SHED-6
|
U.S. citizen and permanent resident doctorate recipients who had earned an associate's degree, by sex, race, ethnicity, and historical doctoral field: 2017–21 |
National Center for Science and Engineering Statistics
|
Survey of Earned Doctorates
|
|
Table SHED-7
|
Share of awards in S&E fields, by award level and state: 2021 |
National Center for Education Statistics
|
Integrated Postsecondary Education Data System (IPEDS), Completions Survey
|
|
Table SHED-8
|
Students who had any classes that were taught entirely online, by program level and field: 2012 and 2016 |
National Center for Education Statistics
|
National Postsecondary Student Aid Study
|
|
Table SHED-9
|
Students whose degree program was taught entirely online, by program level and field: 2012 and 2016 |
National Center for Education Statistics
|
National Postsecondary Student Aid Study
|
|
Table SHED-10
|
Certificates awarded, by field, sex, citizenship, race, and ethnicity: 2012–21 |
National Center for Education Statistics
|
Integrated Postsecondary Education Data System (IPEDS), Completions Survey
|
|
Table SHED-11
|
Associate's degrees awarded, by field, sex, citizenship, race, and ethnicity: 2012–21 |
National Center for Education Statistics
|
Integrated Postsecondary Education Data System (IPEDS), Completions Survey
|
|
Table SHED-12
|
Bachelor's degrees awarded, by field, sex, citizenship, race, and ethnicity: 2012–21 |
National Center for Education Statistics
|
Integrated Postsecondary Education Data System (IPEDS), Completions Survey
|
|
Table SHED-13
|
Master's degrees awarded, by field, sex, citizenship, race, and ethnicity: 2012–21 |
National Center for Education Statistics
|
Integrated Postsecondary Education Data System (IPEDS), Completions Survey
|
|
Table SHED-14
|
Doctoral degrees awarded, by field, sex, citizenship, race, and ethnicity: 2012–21 |
National Center for Education Statistics
|
Integrated Postsecondary Education Data System (IPEDS), Completions Survey
|
|
Table SHED-15
|
S&E bachelor's degrees awarded to American Indian or Alaska Native, Black or African American, and Hispanic or Latino students, by field: 2012 and 2021 |
National Center for Education Statistics
|
Integrated Postsecondary Education Data System (IPEDS), Completions Survey
|
|
Table SHED-16
|
International master's students on visas who are enrolled in U.S. universities, by field and selected regions, countries, or economies of origin: 2022 |
U.S. Department of Homeland Security, U.S. Immigration and Customs Enforcement
|
Student and Exchange Visitor Information System (SEVIS)
|
|
Table SHED-17
|
International doctoral students on visas who are enrolled in U.S. universities, by field and selected regions, countries, or economies of origin: 2022 |
U.S. Department of Homeland Security, U.S. Immigration and Customs Enforcement
|
Student and Exchange Visitor Information System (SEVIS)
|
 An official website of the United States government