 An official website of the United States government
 Data
Tables
Select "VIEW" to see the table. PDF and Excel are available for download.
Figures
Data Sources
DOWNLOAD DATA SOURCES| Item | Title | Provider | Product |
|---|---|---|---|
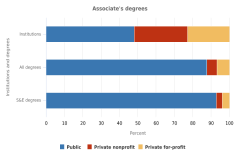
| Figure HED-1 | Institutions and degrees, by level of degree and control: 2019 | National Center for Education Statistics | Integrated Postsecondary Education Data System (IPEDS), Completions Survey |
| Figure HED-1 | Institutions and degrees, by level of degree and control: 2019 | National Center for Education Statistics | Integrated Postsecondary Education Data System (IPEDS), Institutional Characteristics |
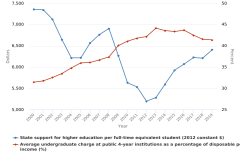
| Figure HED-2 | Average undergraduate charge at public 4-year institutions as a percentage of disposable personal income and state support for higher education per full-time equivalent student: 2000–19 | National Center for Education Statistics | Digest of Education Statistics |
| Figure HED-2 | Average undergraduate charge at public 4-year institutions as a percentage of disposable personal income and state support for higher education per full-time equivalent student: 2000–19 | State Higher Education Executive Officers Association | State Higher Education Finance |
| Figure HED-2 | Average undergraduate charge at public 4-year institutions as a percentage of disposable personal income and state support for higher education per full-time equivalent student: 2000–19 | U.S. Bureau of Economic Analysis | Regional Economic Accounts |
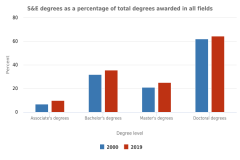
| Figure HED-3 | S&E degrees awarded, by degree level: 2000 and 2019 | National Center for Education Statistics | Integrated Postsecondary Education Data System (IPEDS), Completions Survey |
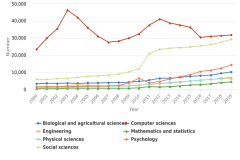
| Figure HED-4 | S&E associate's degrees awarded, by field: 2000–19 | National Center for Education Statistics | Integrated Postsecondary Education Data System (IPEDS), Completions Survey |
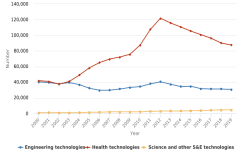
| Figure HED-5 | S&E technologies associate's degrees awarded, by field: 2000–19 | National Center for Education Statistics | Integrated Postsecondary Education Data System (IPEDS), Completions Survey |
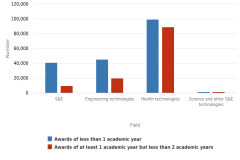
| Figure HED-6 | Certificates awarded for selected levels, by field: 2019 | National Center for Education Statistics | Integrated Postsecondary Education Data System (IPEDS), Completions Survey |
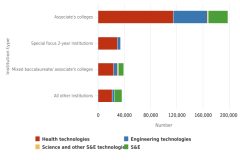
| Figure HED-7 | Certificates awarded for selected levels and fields, by institution type: 2019 | National Center for Education Statistics | Integrated Postsecondary Education Data System (IPEDS), Completions Survey |
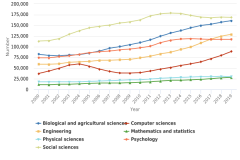
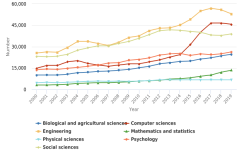
| Figure HED-8 | S&E bachelor's degrees awarded, by field: 2000–19 | National Center for Education Statistics | Integrated Postsecondary Education Data System (IPEDS), Completions Survey |
| Figure HED-9 | S&E master's degrees awarded, by field: 2000–19 | National Center for Education Statistics | Integrated Postsecondary Education Data System (IPEDS), Completions Survey |
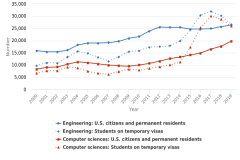
| Figure HED-10 | S&E master's degrees awarded, by citizenship and selected field: 2000–19 | National Center for Education Statistics | Integrated Postsecondary Education Data System (IPEDS), Completions Survey |
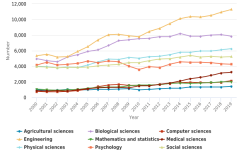
| Figure HED-11 | S&E doctoral degrees awarded, by selected field: 2000–19 | National Center for Education Statistics | Integrated Postsecondary Education Data System (IPEDS), Completions Survey |
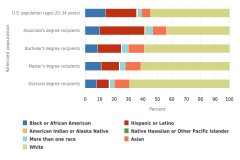
| Figure HED-12 | Representation of racial and ethnic groups in the U.S. population and among U.S. citizen and permanent resident S&E degree recipients: 2019 | National Center for Education Statistics | Integrated Postsecondary Education Data System (IPEDS), Completions Survey |
| Figure HED-12 | Representation of racial and ethnic groups in the U.S. population and among U.S. citizen and permanent resident S&E degree recipients: 2019 | U.S. Census Bureau | Population Estimates Program |
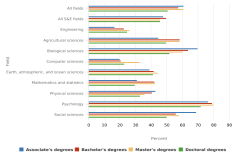
| Figure HED-13 | S&E degrees awarded to women, by degree level and field: 2019 | National Center for Education Statistics | Integrated Postsecondary Education Data System (IPEDS), Completions Survey |
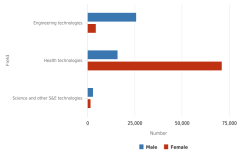
| Figure HED-14 | Associate's degrees in S&E technologies awarded to U.S. citizen and permanent residents, by sex and field: 2019 | National Center for Education Statistics | Integrated Postsecondary Education Data System (IPEDS), Completions Survey |
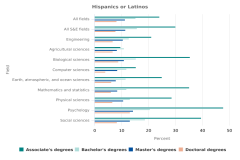
| Figure HED-15 | S&E degrees awarded to Hispanics or Latinos and Blacks or African Americans, by degree level and field: 2019 | National Center for Education Statistics | Integrated Postsecondary Education Data System (IPEDS), Completions Survey |
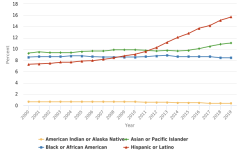
| Figure HED-16 | Share of S&E bachelor's degrees awarded to U.S. citizens and permanent residents, by selected race or ethnicity: 2000–19 | National Center for Education Statistics | Integrated Postsecondary Education Data System (IPEDS), Completions Survey |
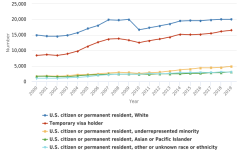
| Figure HED-17 | S&E doctoral degrees awarded, by race, ethnicity, and citizenship: 2000–19 | National Center for Education Statistics | Integrated Postsecondary Education Data System (IPEDS), Completions Survey |
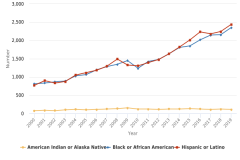
| Figure HED-18 | S&E doctoral degrees awarded to U.S. citizen and permanent resident underrepresented minorities, by race or ethnicity: 2000–19 | National Center for Education Statistics | Integrated Postsecondary Education Data System (IPEDS), Completions Survey |
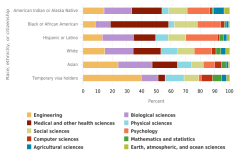
| Figure HED-19 | S&E doctoral degrees earned, by field, citizenship, and selected race or ethnicity: 2019 | National Center for Education Statistics | Integrated Postsecondary Education Data System (IPEDS), Completions Survey |
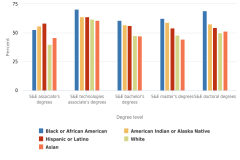
| Figure HED-20 | Women's share of S&E degrees, by degree level and selected race or ethnicity: 2019 | National Center for Education Statistics | Integrated Postsecondary Education Data System (IPEDS), Completions Survey |
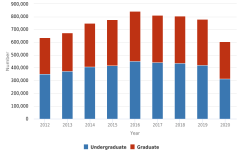
| Figure HED-21 | International students enrolled in U.S. higher education institutions, by level of enrollment: 2012–20 | U.S. Department of Homeland Security, U.S. Immigration and Customs Enforcement | Student and Exchange Visitor Information System (SEVIS) |
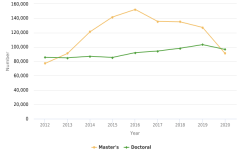
| Figure HED-22 | International S&E graduate students enrolled in U.S. higher education institutions, by level of enrollment: 2012–20 | U.S. Department of Homeland Security, U.S. Immigration and Customs Enforcement | Student and Exchange Visitor Information System (SEVIS) |
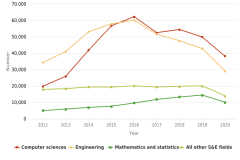
| Figure HED-23 | International S&E master's students enrolled in U.S. higher education institutions, by selected field: 2012–20 | U.S. Department of Homeland Security, U.S. Immigration and Customs Enforcement | Student and Exchange Visitor Information System (SEVIS) |
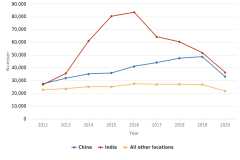
| Figure HED-24 | International S&E master's students enrolled in U.S. higher education institutions, by selected country of origin: 2012–20 | U.S. Department of Homeland Security, U.S. Immigration and Customs Enforcement | Student and Exchange Visitor Information System (SEVIS) |
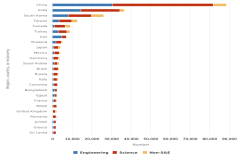
| Figure HED-25 | Top 25 regions, countries, or economies of origin of U.S. doctorate recipients on temporary visas, by broad field: 2001–20 | National Center for Science and Engineering Statistics | Survey of Earned Doctorates |
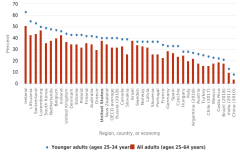
| Figure HED-26 | Attainment of a bachelor's degree or higher, by region, country, or economy and age group: 2019 or most recent year | Organisation for Economic Co-operation and Development | Education at a Glance |
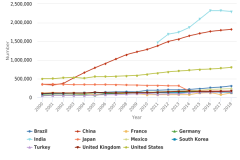
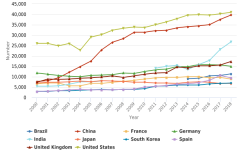
| Figure HED-27 | S&E first-university degrees, by selected region, country, or economy: 2000–18 | Eurostat | Education and training database |
| Figure HED-27 | S&E first-university degrees, by selected region, country, or economy: 2000–18 | Government of India, Ministry of Education, Department of Higher Education | All India Survey on Higher Education |
| Figure HED-27 | S&E first-university degrees, by selected region, country, or economy: 2000–18 | Ministry of Education, Culture, Sports, Science and Technology (Japan) | Survey of Education |
| Figure HED-27 | S&E first-university degrees, by selected region, country, or economy: 2000–18 | Ministry of Education, People's Republic of China | Higher Education Data |
| Figure HED-27 | S&E first-university degrees, by selected region, country, or economy: 2000–18 | National Bureau of Statistics of China | China Statistical Yearbook |
| Figure HED-27 | S&E first-university degrees, by selected region, country, or economy: 2000–18 | Organisation for Economic Co-operation and Development | Education at a Glance |
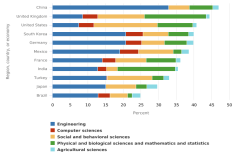
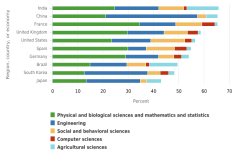
| Figure HED-28 | First-university degrees by S&E field, by selected region, country, or economy: 2018 | Eurostat | Education and training database |
| Figure HED-28 | First-university degrees by S&E field, by selected region, country, or economy: 2018 | Government of India, Ministry of Education, Department of Higher Education | All India Survey on Higher Education |
| Figure HED-28 | First-university degrees by S&E field, by selected region, country, or economy: 2018 | Ministry of Education, People's Republic of China | Higher Education Data |
| Figure HED-28 | First-university degrees by S&E field, by selected region, country, or economy: 2018 | Organisation for Economic Co-operation and Development | Education at a Glance |
| Figure HED-29 | S&E doctoral degrees, by selected region, country, or economy: 2000–18 | Eurostat | Education and training database |
| Figure HED-29 | S&E doctoral degrees, by selected region, country, or economy: 2000–18 | Government of India, Ministry of Education, Department of Higher Education | All India Survey on Higher Education |
| Figure HED-29 | S&E doctoral degrees, by selected region, country, or economy: 2000–18 | Ministry of Education, Culture, Sports, Science and Technology (Japan) | Survey of Education |
| Figure HED-29 | S&E doctoral degrees, by selected region, country, or economy: 2000–18 | Ministry of Education, People's Republic of China | Higher Education Data |
| Figure HED-29 | S&E doctoral degrees, by selected region, country, or economy: 2000–18 | National Bureau of Statistics of China | China Statistical Yearbook |
| Figure HED-29 | S&E doctoral degrees, by selected region, country, or economy: 2000–18 | Organisation for Economic Co-operation and Development | Education at a Glance |
| Figure HED-30 | Doctoral degrees by broad area of study, by selected region, country, or economy: 2018 | Eurostat | Education and training database |
| Figure HED-30 | Doctoral degrees by broad area of study, by selected region, country, or economy: 2018 | Government of India, Ministry of Education, Department of Higher Education | All India Survey on Higher Education |
| Figure HED-30 | Doctoral degrees by broad area of study, by selected region, country, or economy: 2018 | Ministry of Education, People's Republic of China | Higher Education Data |
| Figure HED-30 | Doctoral degrees by broad area of study, by selected region, country, or economy: 2018 | Organisation for Economic Co-operation and Development | Education at a Glance |
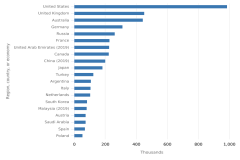
| Figure HED-31 | Internationally mobile students enrolled in tertiary education, by selected region, country, or economy: 2018 or most recent year | UNESCO Institute for Statistics | UIS.Stat database |
| Table HED-1 | Degree-granting institutions, by control and highest degree awarded: 2019–20 | National Center for Education Statistics | Integrated Postsecondary Education Data System (IPEDS), Institutional Characteristics |
| Table HED-2 | Certificates awarded in S&E technologies for selected levels, by field: 2019 | National Center for Education Statistics | Integrated Postsecondary Education Data System (IPEDS), Completions Survey |
| Table HED-3 | Women's share of S&E bachelor's degrees in selected fields for U.S. citizens and permanent residents, by race and ethnicity: 2019 | National Center for Education Statistics | Integrated Postsecondary Education Data System (IPEDS), Completions Survey |
| Table HED-4 | International students enrolled in U.S. higher education institutions, by broad field and academic level: 2012–20 | U.S. Department of Homeland Security, U.S. Immigration and Customs Enforcement | Student and Exchange Visitor Information System (SEVIS) |
| Table HED-5 | Top 25 countries of origin of U.S. doctorate recipients on temporary visas, by broad doctoral field: 2001–20 | National Center for Science and Engineering Statistics | Survey of Earned Doctorates |
| Table SAHED-1 | Crosswalk of S&E fields for international higher education data, by selected region, country, or economy and field | Eurostat | Education and training database |
| Table SAHED-1 | Crosswalk of S&E fields for international higher education data, by selected region, country, or economy and field | Government of India, Ministry of Education, Department of Higher Education | All India Survey on Higher Education |
| Table SAHED-1 | Crosswalk of S&E fields for international higher education data, by selected region, country, or economy and field | Ministry of Education, People's Republic of China | Higher Education Data |
| Table SAHED-1 | Crosswalk of S&E fields for international higher education data, by selected region, country, or economy and field | Ministry of Education, Republic of China (Taiwan) | Educational Statistics of the Republic of China (Taiwan) |
| Table SAHED-1 | Crosswalk of S&E fields for international higher education data, by selected region, country, or economy and field | National Bureau of Statistics of China | China Statistical Yearbook |
| Table SAHED-1 | Crosswalk of S&E fields for international higher education data, by selected region, country, or economy and field | Organisation for Economic Co-operation and Development | Education at a Glance |
| Table SAHED-2 | Example OECD first degree data reporting: Degrees awarded by Russia, by level and category of education: 2013–18 | Organisation for Economic Co-operation and Development | Education at a Glance |
| Table SHED-1 | S&E degrees awarded, by degree level, Carnegie institution type, and field: 2019 | National Center for Education Statistics | Integrated Postsecondary Education Data System (IPEDS), Completions Survey |
| Table SHED-2 | U.S. citizen and permanent resident doctorate recipients who earned an associate's degree, by sex, race, ethnicity, and broad doctoral field: 2020 | National Center for Science and Engineering Statistics | Survey of Earned Doctorates |
| Table SHED-3 | Associate's degrees awarded, by sex, citizenship, race, ethnicity, and field: 2011–19 | National Center for Education Statistics | Integrated Postsecondary Education Data System (IPEDS), Completions Survey |
| Table SHED-4 | Certificates awarded for selected levels, by institutional Carnegie Classification and field: 2019 | National Center for Education Statistics | Integrated Postsecondary Education Data System (IPEDS), Completions Survey |
| Table SHED-5 | Bachelor's degrees awarded, by sex, citizenship, race, ethnicity, and field: 2011–19 | National Center for Education Statistics | Integrated Postsecondary Education Data System (IPEDS), Completions Survey |
| Table SHED-6 | Master's degrees awarded, by sex, citizenship, race, ethnicity, and field: 2011–19 | National Center for Education Statistics | Integrated Postsecondary Education Data System (IPEDS), Completions Survey |
| Table SHED-7 | Doctoral degrees awarded, by sex, citizenship, race, ethnicity, and field: 2011–19 | National Center for Education Statistics | Integrated Postsecondary Education Data System (IPEDS), Completions Survey |
| Table SHED-8 | Associate's degrees in S&E technologies awarded to U.S. citizens and permanent residents, by sex, race, ethnicity, and field: 2019 | National Center for Education Statistics | Integrated Postsecondary Education Data System (IPEDS), Completions Survey |
| Table SHED-9 | International undergraduate student enrollment in U.S. universities, by field and selected regions, countries, or economies of origin: 2019–20 | U.S. Department of Homeland Security, U.S. Immigration and Customs Enforcement | Student and Exchange Visitor Information System (SEVIS) |
| Table SHED-10 | International graduate student enrollment in U.S. universities, by field and selected regions, countries, or economies of origin: 2019–20 | U.S. Department of Homeland Security, U.S. Immigration and Customs Enforcement | Student and Exchange Visitor Information System (SEVIS) |
| Table SHED-11 | S&E first university degrees, by selected region, country, or economy and field: 2010–18 | Eurostat | Education and training database |
| Table SHED-11 | S&E first university degrees, by selected region, country, or economy and field: 2010–18 | Government of India, Ministry of Education, Department of Higher Education | All India Survey on Higher Education |
| Table SHED-11 | S&E first university degrees, by selected region, country, or economy and field: 2010–18 | Ministry of Education, Culture, Sports, Science and Technology (Japan) | Survey of Education |
| Table SHED-11 | S&E first university degrees, by selected region, country, or economy and field: 2010–18 | Ministry of Education, People's Republic of China | Higher Education Data |
| Table SHED-11 | S&E first university degrees, by selected region, country, or economy and field: 2010–18 | Ministry of Education, Republic of China (Taiwan) | Educational Statistics of the Republic of China (Taiwan) |
| Table SHED-11 | S&E first university degrees, by selected region, country, or economy and field: 2010–18 | National Bureau of Statistics of China | China Statistical Yearbook |
| Table SHED-11 | S&E first university degrees, by selected region, country, or economy and field: 2010–18 | Organisation for Economic Co-operation and Development | Education at a Glance |
| Table SHED-12 | S&E doctoral degrees, by selected region, country, or economy and field: 2010–18 | Eurostat | Education and training database |
| Table SHED-12 | S&E doctoral degrees, by selected region, country, or economy and field: 2010–18 | Government of India, Ministry of Education, Department of Higher Education | All India Survey on Higher Education |
| Table SHED-12 | S&E doctoral degrees, by selected region, country, or economy and field: 2010–18 | Ministry of Education, Culture, Sports, Science and Technology (Japan) | Survey of Education |
| Table SHED-12 | S&E doctoral degrees, by selected region, country, or economy and field: 2010–18 | Ministry of Education, People's Republic of China | Higher Education Data |
| Table SHED-12 | S&E doctoral degrees, by selected region, country, or economy and field: 2010–18 | Ministry of Education, Republic of China (Taiwan) | Educational Statistics of the Republic of China (Taiwan) |
| Table SHED-12 | S&E doctoral degrees, by selected region, country, or economy and field: 2010–18 | National Bureau of Statistics of China | China Statistical Yearbook |
| Table SHED-12 | S&E doctoral degrees, by selected region, country, or economy and field: 2010–18 | Organisation for Economic Co-operation and Development | Education at a Glance |