 An official website of the United States government
 U.S. Institutions Providing S&E Higher Education
Institutions in S&E Higher Education
The U.S. higher education system consists of academic institutions that vary in mission; public, private nonprofit, or private for-profit status; degrees offered; learning environment; selectivity level; religious affiliation; cost; and other characteristics (McFarland et al. 2019). This institutional diversity is often regarded as a strength of the U.S. higher education system (Harris 2013), allowing it to serve a range of students and meet many societal goals.
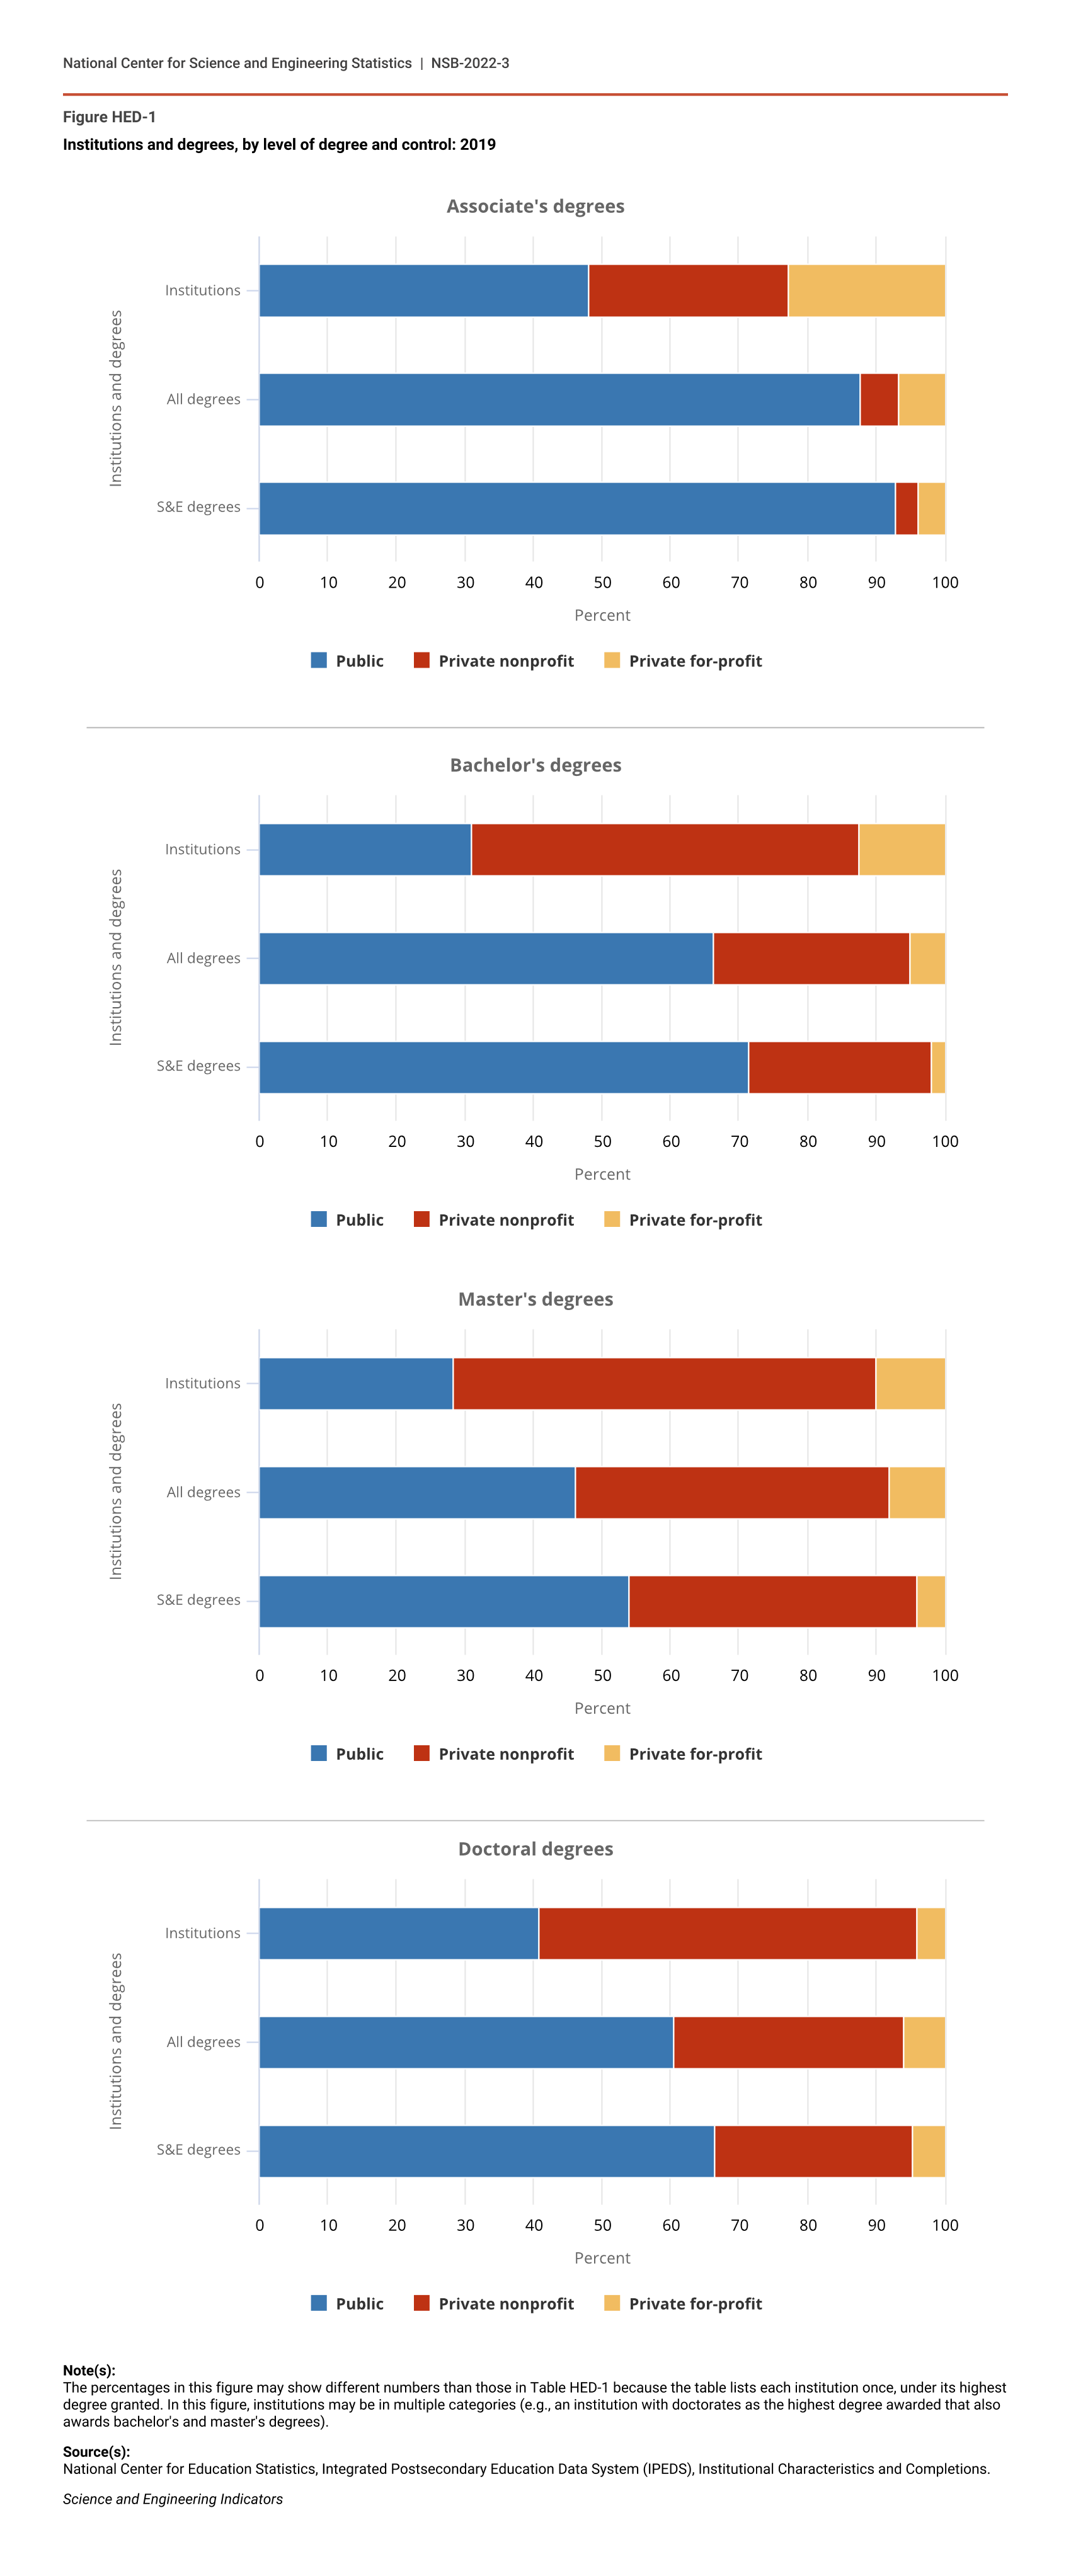
During the 2019–20 academic year, there were approximately 4,150 postsecondary degree-granting institutions in the United States, of which about 41% were public, 41% were private nonprofit, and 17% were private for-profit (Table HED-1)., Public institutions awarded over two-thirds of all degrees and 70% of S&E degrees overall (Figure HED-1).
Degree-granting institutions, by control and highest degree awarded: 2019–20
Note(s):
Control refers to whether an institution is operated by publicly elected or appointed officials (public control) or by privately elected or appointed officials and derives its major source of funds from private sources (private control).
Source(s):
National Center for Education Statistics, Integrated Postsecondary Education Data System (IPEDS), Institutional Characteristics.
Science and Engineering Indicators
Institutions and degrees, by level of degree and control: 2019
| Institutions and degrees | Public | Private nonprofit | Private for-profit |
|---|---|---|---|
| Institutions | 48.1 | 29.1 | 22.8 |
| All degrees | 87.8 | 5.5 | 6.7 |
| S&E degrees | 92.9 | 3.2 | 3.9 |
| Institutions and degrees | Public | Private nonprofit | Private for-profit |
|---|---|---|---|
| Institutions | 31.0 | 56.5 | 12.5 |
| All degrees | 66.3 | 28.8 | 4.9 |
| S&E degrees | 71.5 | 26.6 | 1.9 |
| Institutions and degrees | Public | Private nonprofit | Private for-profit |
|---|---|---|---|
| Institutions | 28.3 | 61.8 | 9.9 |
| All degrees | 46.1 | 45.9 | 8.0 |
| S&E degrees | 54.1 | 41.9 | 4.1 |
| Institutions and degrees | Public | Private nonprofit | Private for-profit |
|---|---|---|---|
| Institutions | 40.7 | 55.2 | 4.0 |
| All degrees | 60.6 | 33.4 | 6.0 |
| S&E degrees | 66.4 | 29.0 | 4.6 |
Note(s):
The percentages in this figure may show different numbers than those in Table HED-1 because the table lists each institution once, under its highest degree granted. In this figure, institutions may be in multiple categories (e.g., an institution with doctorates as the highest degree awarded that also awards bachelor's and master's degrees).
Source(s):
National Center for Education Statistics, Integrated Postsecondary Education Data System (IPEDS), Institutional Characteristics and Completions.
Science and Engineering Indicators
Rather than provide a comprehensive overview of the entire system, this section of the report discusses several types of institutions that contribute to education and training in S&E fields. These types of institutions are not mutually exclusive, and some institutions fit multiple categories. Institutions of higher education, particularly some of the types of institutions discussed in this report, are not distributed evenly across states and regions of the country (e.g., see the Integrated Postsecondary Education Data System [IPEDS] CollegeMap for overall distribution; a map of historically Black colleges and universities [HBCUs] is provided here). This section also provides information on distance and online education and the finances of higher education.
Research Universities
Institutions of higher education can be classified in ways beyond the split among public, private nonprofit, and private for-profit. The Carnegie Classification of Institutions of Higher Education is widely used to characterize differences in academic institutions. The 131 Carnegie-classified very high research activity doctoral universities play a key role in producing S&E degrees in the United States (Table SHED-1) and also perform a significant portion (about three-quarters) of total academic research and development (R&D). For more detail on the contribution of research universities, especially in the realm of S&E graduate education, see the Indicators 2022 report “Academic Research and Development.”
Minority-Serving Institutions
There are more than 700 MSIs of seven types (NASEM 2019). MSIs may be defined by legislation (or historically defined) or by the percentage of minority student enrollment and other characteristics of the student body (or enrollment defined) (Li 2007; NASEM 2019). HBCUs and tribal colleges or universities are historically defined. High-Hispanic-enrollment institutions (HHEs), in contrast, are one example of enrollment-defined MSIs. Some institutions may qualify as more than one type of MSI, and there is substantial diversity in institutional characteristics between different MSIs (NASEM 2019). The number of institutions in historically defined MSI categories are more or less fixed, whereas the numbers of institutions included in enrollment-defined MSI categories may change. This has implications for interpreting trends over time.
MSIs enroll a substantial fraction of underrepresented minority undergraduates. The number of Blacks earning S&E bachelor’s degrees from HBCUs has remained roughly constant, likely reflecting the capacity of these institutions. Overall, across all institutions, the number of S&E bachelor’s degrees earned by Blacks is increasing (NCSES WMPD 2021: Table 5-4). In 2018, S&E fields accounted for 32% of the bachelor’s degrees that Blacks earned at HBCUs and 30% of the bachelor’s degrees that Blacks earned across all institutions.
The number of Hispanics earning S&E bachelor’s degrees from HHEs has increased (NCSES WMPD 2021: Table 5-5). This reflects increasing numbers of Hispanics earning S&E bachelor’s degrees at HHEs and at other types of institutions. In 2018, S&E fields accounted for 34% of the bachelor’s degrees that Hispanics earned at HHEs and 36% of the bachelor’s degrees that Hispanics earned across all institutions.
MSIs also play an important role in training underrepresented minority students for doctoral-level study in S&E fields, and some award doctorate degrees themselves. A considerable share of Black and Hispanic S&E doctoral recipients received their bachelor’s degree from an MSI. Around 25% of Black S&E doctoral recipients from 2015 to 2019 earned a bachelor’s degree from an HBCU (NCSES 2021c). Likewise, around 38% of Hispanic S&E doctoral recipients from 2015 to 2019 earned a bachelor’s degree from an HHE (NCSES 2021c). The percentages of Black and Hispanic S&E doctoral recipients whose baccalaureate origins were HBCUs and HHEs, respectively, have been relatively stable for several decades (see NSB Indicators 2020). More data on the importance of these institutions as baccalaureate origin institutions are available in Burrelli and Rapoport (2008) and Fiegener and Proudfoot (2013) as well as in Hrabowski and Henderson (2017, 2019), who emphasize the role that predominantly White institutions must also play in preparing underrepresented minority students for S&E doctoral training.
Community Colleges
Community colleges (also known as public 2-year colleges or associate’s colleges) play a key role in providing broad access to higher education. Community colleges prepare students to enter the workforce with certificates or associate’s degrees or to transition to 4-year institutions (frequently without earning associate’s degrees). Many students do not take a linear path but rather move between institutions and employers as they pursue educational and career objectives, with some returning to community colleges to augment their skills (e.g., Bahr 2017). The Community College Research Center, using Department of Education data, reports that nearly 40% of undergraduates in 2018–19 attended public 2-year colleges. Of students who earned bachelor’s degrees in any field from 2008 to 2017, more than half (52%) had done some coursework at a community college, and one-fourth (25%) earned associate’s degrees. The figures were 47% and 17%, respectively, among S&E degree recipients. Community colleges also provide a pathway that ultimately leads some students to earn doctoral degrees. About 20% of students receiving S&E doctoral degrees in 2020 reported having attended a community or 2-year college (NCSES SED 2020: Table 30), and about 6% had previously earned an associate’s degree (Table SHED-2).
Community college attendance, however, varies across degree fields and among demographic groups. The percentage of 2020 doctorate recipients with associate’s degrees ranged from around 3% among engineering doctorates to over 11% among medical and other health sciences doctorates; percentages having attended community college at all were higher (NCSES SED 2020: Table 30). Among racial categories, Black S&E doctoral degree recipients had the largest percentage to have earned an associate’s degree (10%); Asians (3%) had the lowest percentage. In addition, among the civilian college graduate population in the United States, a greater proportion of military veterans than nonveterans attended community college and earned associate’s degrees (Milan 2018).
For-Profit Institutions
In 2019–20, there were 722 degree-granting private for-profit higher education institutions in the United States. About half of these institutions award only associate’s degrees; the remainder award higher degrees, including around 8% that award doctoral degrees (Table HED-1). Degrees awarded by for-profit institutions rose dramatically throughout the 2000s but declined each year from 2011 to 2019.
For-profit academic institutions produce less than 3% of S&E degrees (Figure HED-1). The S&E degrees they award cluster in a few fields: 76% of S&E bachelor’s degrees awarded by for-profits in 2019 were in computer sciences, psychology, or political science and public administration; at the doctoral level, 86% of S&E degrees were in psychology, medical sciences, or political science and public administration. A larger proportion of Blacks than other groups earned S&E doctorates at for-profit institutions (25% in 2019, compared with 7% of Hispanics, 5% of Whites, and 3% of Asians).
Distance and Online Education
Distance education is learning where the teacher and student are separated by time or space (Miller, Topper, and Richardson 2017). Distance education has been around for more than 100 years, whereas online education is a relatively new phenomenon, mirroring the growth of technologies such as the personal computer and the Internet (Miller, Topper, and Richardson 2017; Perna et al. 2014). Distance education offerings can be delivered through a range of technologies and in a variety of modes: completely distance education, traditional or in-person instruction, and a combination often referred to as hybrid or blended instruction (RTI International 2017). Distance education may occur synchronously (live) or asynchronously (prerecorded) in time, and online courses may be offered to students living on campus, without any physical distance from the instructor (RTI International 2017).
Since the start of the COVID-19 pandemic, distance education in higher education has become much more common, with implications for learning, student experience, instructional quality, and cost. Data on distance education are available through the IPEDS through the 2018–19 academic year. These data include instances in which instructional content is delivered exclusively through distance education (i.e., hybrid or blended courses are not included). While this information does not yet incorporate the effects of COVID-19, it can serve as a comparison point when new data become available. For more information on distance education and other impacts on higher education during COVID-19, see sidebar COVID-19 and Higher Education.
In 2018–19, most colleges and universities (56%) offered both distance education courses and distance education programs (NCES 2021b). Such programs and courses were most common at public colleges and universities and least common at private 2-year institutions, though these account for a small percentage of colleges, and many are special focus or technical institutions. In fall 2018, around 35% of total enrolled students were enrolled in distance education courses.
Enrollment of undergraduate and graduate students in distance education increased each year from 2012 to 2018, except for enrollment at for-profit institutions, which declined (de Brey et al. Digest of Education Statistics 2019: Table 311.15). This occurred during a period of overall decline in total enrollment (NCES 2021b). Public universities account for most students taking these courses.
In 2018, most students enrolled at public institutions who took only distance education courses lived in the same state as their institution (82%). At private institutions, both nonprofit and for-profit, most students lived in another state (63% for nonprofit, and 81% for for-profit) (NCES 2021b).
A more detailed analysis and review of distance and online education is available in the prior release of this report (see NSB Indicators 2020).
S&E Higher Education: Cost, Debt, and Financial Aid
Earning a college degree commands a substantial wage premium (Carnevale, Cheah, and Hanson 2015) and provides additional benefits to individuals and society (Ma, Pender, and Welch 2016). For these reasons, many students and their families invest in higher education. Increases in published prices over time have far exceeded inflation or increases in average family income, contributing to concerns about affordability of higher education (Archibald and Feldman 2012; U.S. Congress Joint Economic Committee 2017). Additionally, state support for higher education per student is proportionately lower than it was through most of the 2000s. However, at the undergraduate level, published tuition and fees have also increased far more than the actual price students or their families pay to cover a year of educational expenses.
Although the level of undergraduate debt varies by type of institution, the frequency and amount of borrowing have increased little over the past 5 years. Among graduate students, master’s students are largely self-supporting, whereas doctoral students rely on multiple funding sources and mechanisms to support their education (see the Indicators 2022 report “Academic Research and Development”). The percentage of bachelor’s and doctorate recipients holding debt related to their education has declined slightly over the last 10 years.
Cost of Undergraduate Education
College pricing is complex, and institutions operate at different prices. For example, during the 2020–21 academic year, average published tuition and fees were $3,770 at in-district public 2-year institutions, $10,560 at in-state public 4-year institutions, $27,020 at out-of-state public 4-year institutions, and $37,650 at private nonprofit 4-year institutions. Published tuition and fees have greatly increased over the last 30 years (College Board Trends in College Pricing and Student Aid 2020: Figure CP-3). Net price, defined by the College Board as “what the student and/or family must cover after grant aid and savings from tax credits and deductions are subtracted,” is more relevant for students than published price.
Across institution types, net prices rose much more slowly than published prices over the past 15 years (College Board Trends in College Pricing and Student Aid 2020: Figure CP-8, Figure CP-9, Figure CP-10). Net price and published price vary based on family income and other factors, such as whether students attend an institution in their own state or in another state.
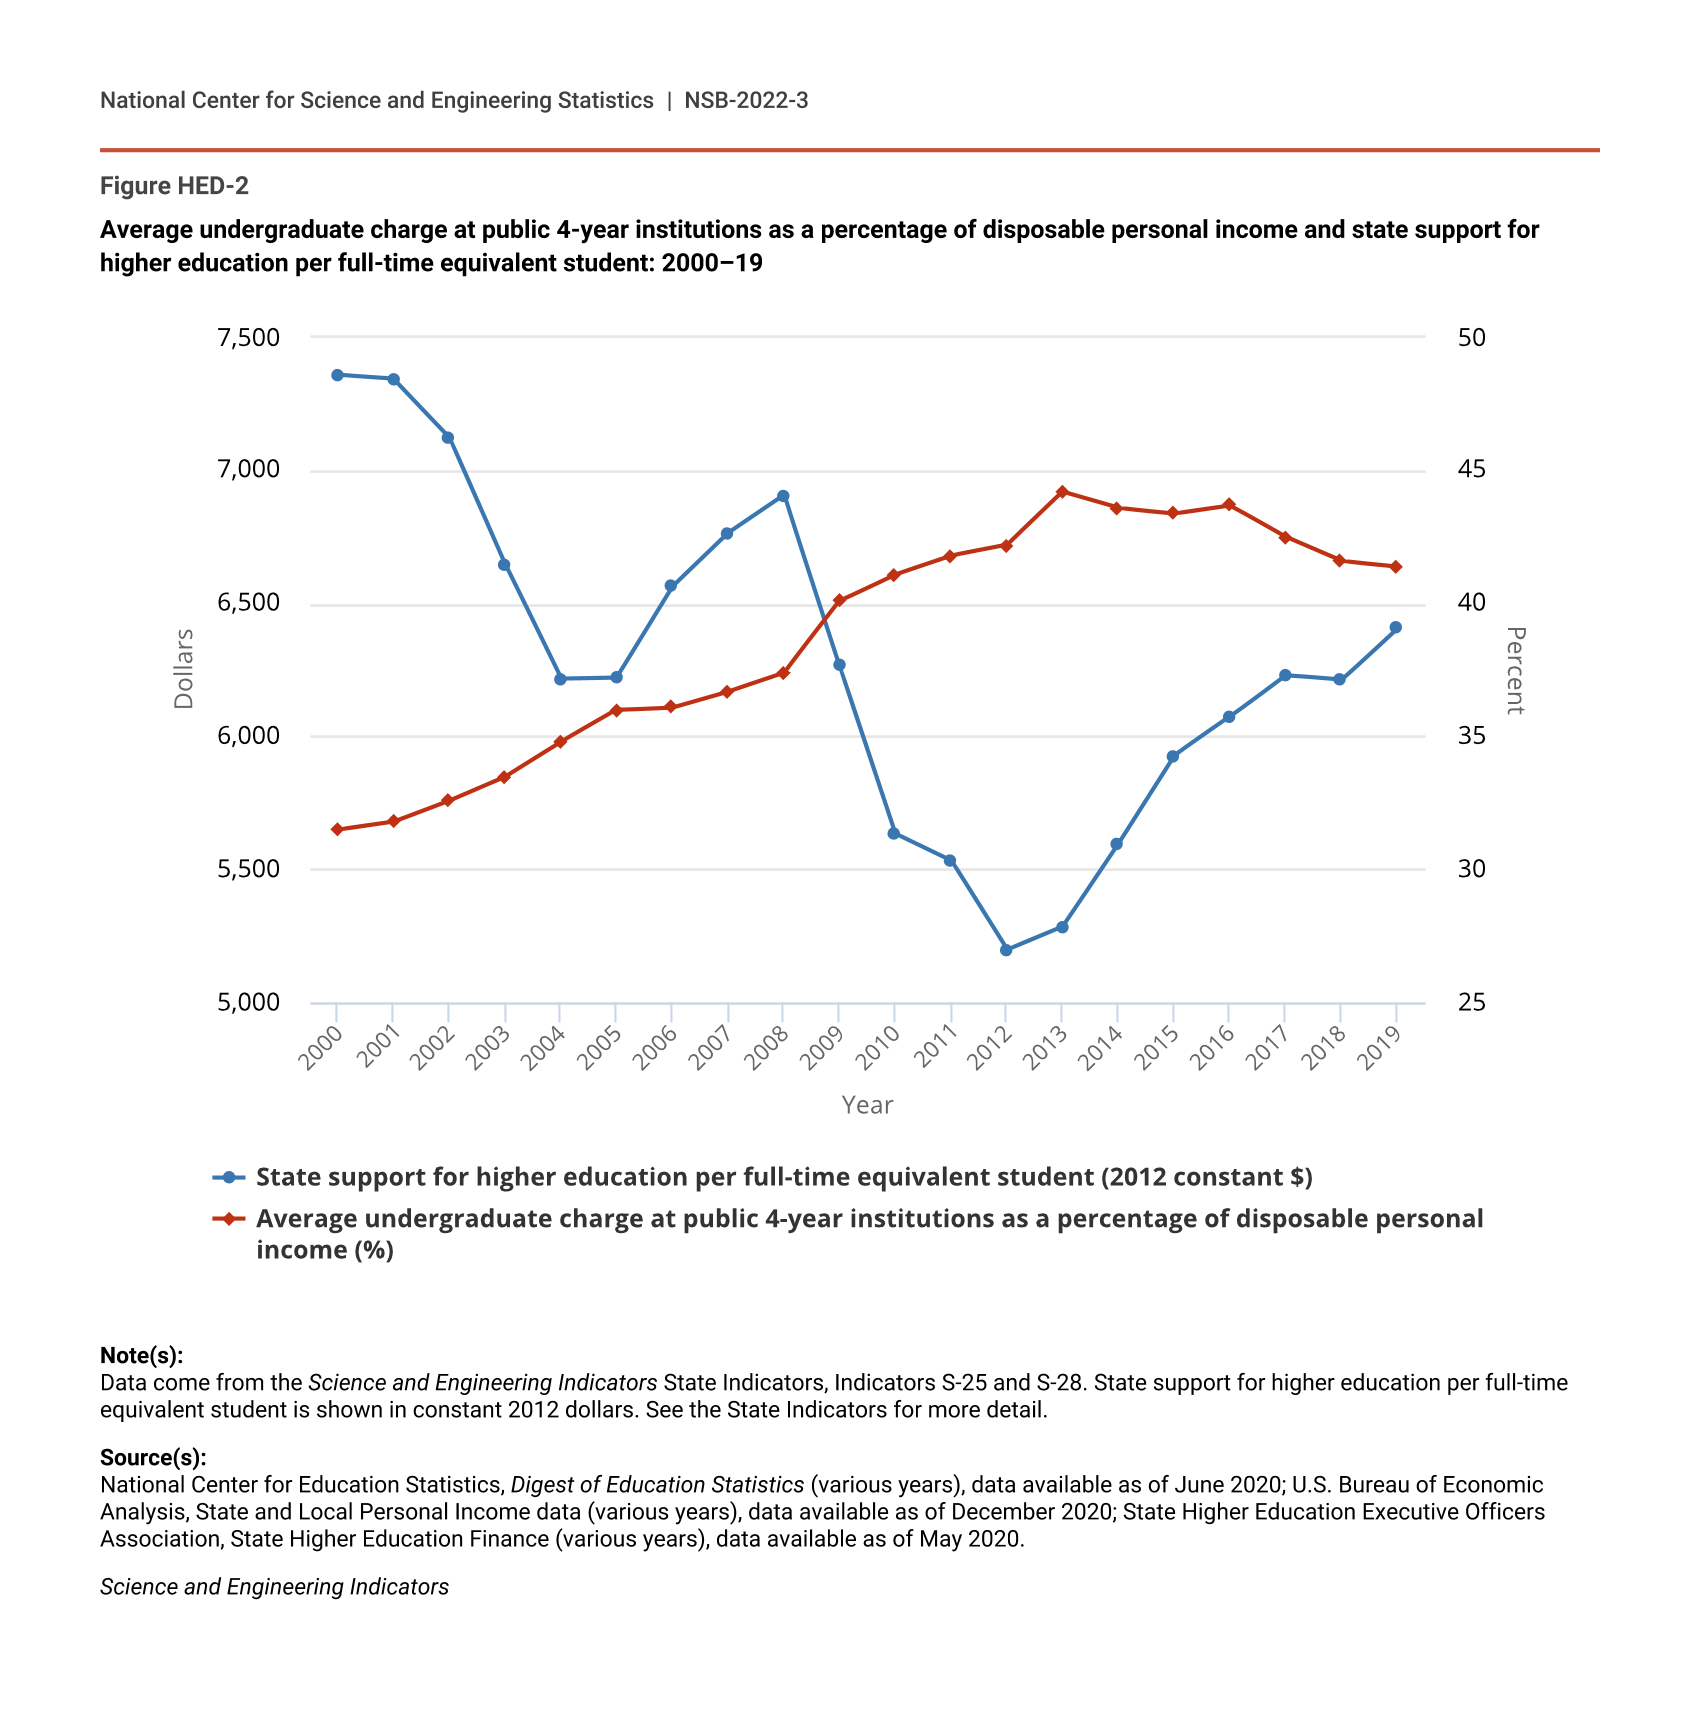
College affordability remains a concern for many. The average undergraduate charge at public 4-year institutions as a percentage of per capita disposable personal income increased from around 33% in the early 2000s to 41% in 2019, though it peaked at around 44% in 2013 and has declined since then (Figure HED-2; NSB State Indicator S-25: see hyperlink for definitions and calculation). Since 1994, this measure has increased in every state and, in 2019, ranged from a low of 26% in Wyoming to a high of 58% in Vermont, with eight states over 50% (NSB 2021b).
Average undergraduate charge at public 4-year institutions as a percentage of disposable personal income and state support for higher education per full-time equivalent student: 2000–19
| Year | State support for higher education per full-time equivalent student (2012 constant $) | Average undergraduate charge at public 4-year institutions as a percentage of disposable personal income (%) |
|---|---|---|
| 2000 | 7,360 | 31.5 |
| 2001 | 7,346 | 31.8 |
| 2002 | 7,126 | 32.6 |
| 2003 | 6,648 | 33.5 |
| 2004 | 6,218 | 34.8 |
| 2005 | 6,222 | 36.0 |
| 2006 | 6,565 | 36.1 |
| 2007 | 6,766 | 36.7 |
| 2008 | 6,908 | 37.4 |
| 2009 | 6,266 | 40.1 |
| 2010 | 5,634 | 41.1 |
| 2011 | 5,533 | 41.8 |
| 2012 | 5,198 | 42.2 |
| 2013 | 5,285 | 44.2 |
| 2014 | 5,598 | 43.6 |
| 2015 | 5,928 | 43.4 |
| 2016 | 6,073 | 43.7 |
| 2017 | 6,230 | 42.5 |
| 2018 | 6,212 | 41.6 |
| 2019 | 6,407 | 41.4 |
Note(s):
Data come from the Science and Engineering Indicators State Indicators, Indicators S-25 and S-28. State support for higher education per full-time equivalent student is shown in constant 2012 dollars. See the State Indicators for more detail.
Source(s):
National Center for Education Statistics, Digest of Education Statistics (various years), data available as of June 2020; U.S. Bureau of Economic Analysis, State and Local Personal Income data (various years), data available as of December 2020; State Higher Education Executive Officers Association, State Higher Education Finance (various years), data available as of May 2020.
Science and Engineering Indicators
While it has increased most years since 2012, state support for higher education per full-time equivalent student remains lower in constant dollars than it was during most of the 2000s, at $6,407 in 2019 (Figure HED-2; NSB State Indicator S-28) (NSB 2021d). Since 2001, state support has also declined as a percentage of state gross domestic product in all but three states: Connecticut, Hawaii, and Wyoming (NSB State Indicator S-26) (NSB 2021a).
Undergraduate Debt
Level of undergraduate debt varies by time to degree and type of institution, but the amount of borrowing among those who graduate has remained stable over the past 5 years. At the same time, the percentage of students who borrow has declined. At public and private nonprofit 4-year institutions, 56% of 2018–19 graduates graduated with debt, holding an average debt level of $28,800 compared to 61% of 2013–14 graduates with an average debt level of $28,900 in 2019 dollars (College Board Trends in College Pricing and Student Aid 2020: Figure SA-14 and accompanying text). A higher percentage of students who graduate from private for-profit institutions than from public or private nonprofit institutions borrow money and borrow in larger amounts (College Board Trends in Student Aid 2018: Figure 16). Debt level also varies by state (Institute for College Access & Success 2020; see Interactive Map).
Doctorate Recipient Debt
Debt levels are an indicator of external financial support for doctoral training, with some fields receiving more support than others. The percentage of doctorate recipients holding any debt related to their graduate education (around 30%) has declined slightly in the last 10 years (NCSES SED 2020: Table 39).
A greater percentage of doctorate recipients in non-S&E fields (46%) reported graduate debt than those in S&E fields (26%) (NCSES SED 2020: Table 38 and Table 39). Levels of debt also vary among S&E fields. For instance, a larger proportion of doctorate recipients in psychology and social sciences hold graduate debt (44% hold debt, with an average of over $31,000) than do those in physical and earth sciences (15% hold debt, with an average of about $5,000) (NCSES SED 2020: Table 38).
A larger proportion of women than men accumulate higher amounts of graduate debt, which may be attributed to variability in debt levels across fields of study (NCSES SED 2020: Table 40). Across fields, a larger proportion of Black doctorate recipients than Asians, Whites, or Hispanics hold more than $30,000 in graduate school debt (NCSES SED 2020: Table 41).
Other factors potentially influencing debt include time to degree, marital and dependent status, and highest level of parental education. Many potential factors leading to greater indebtedness are related. For instance, a greater proportion of Black doctorate recipients possess other characteristics related to higher indebtedness: many are female, attend for-profit institutions, and earn degrees in non-S&E fields or S&E fields like psychology and social sciences, which have lower levels of external financial support (see section Demographic Attributes of S&E Degree Recipients and Scott-Clayton and Li 2016).
Financial Aid for Undergraduate and Graduate Students
In 2019–20, undergraduate students received $184 billion in federal, state, institutional, and other aid (excluding nonfederal loans), down from $218 billion in 2010–11 (College Board Trends in College Pricing and Student Aid 2020: Figure SA-3). Institutional grant aid increased by 72% ($23 billion in 2019 dollars) during this time. Average total aid per undergraduate student declined by only 1% because enrollment decreased by 7%.
Graduate students received $58 billion in federal, state, institutional, and other aid (excluding nonfederal loans) in 2019–20 (College Board Trends in College Pricing and Student Aid 2020: Figure SA-4). As with undergraduates, federal financial aid constituted the majority of graduate student aid over the past 10 years. Federal aid was around 68% ($40 billion) of total aid in 2019–20. Loans were the main component of federal aid: 92% ($37 billion in 2019–20); the remainder consisted of veterans’ benefits, education tax benefits, and work-study programs.