 An official website of the United States government
 Trends in Undergraduate and Graduate S&E Degree Awards
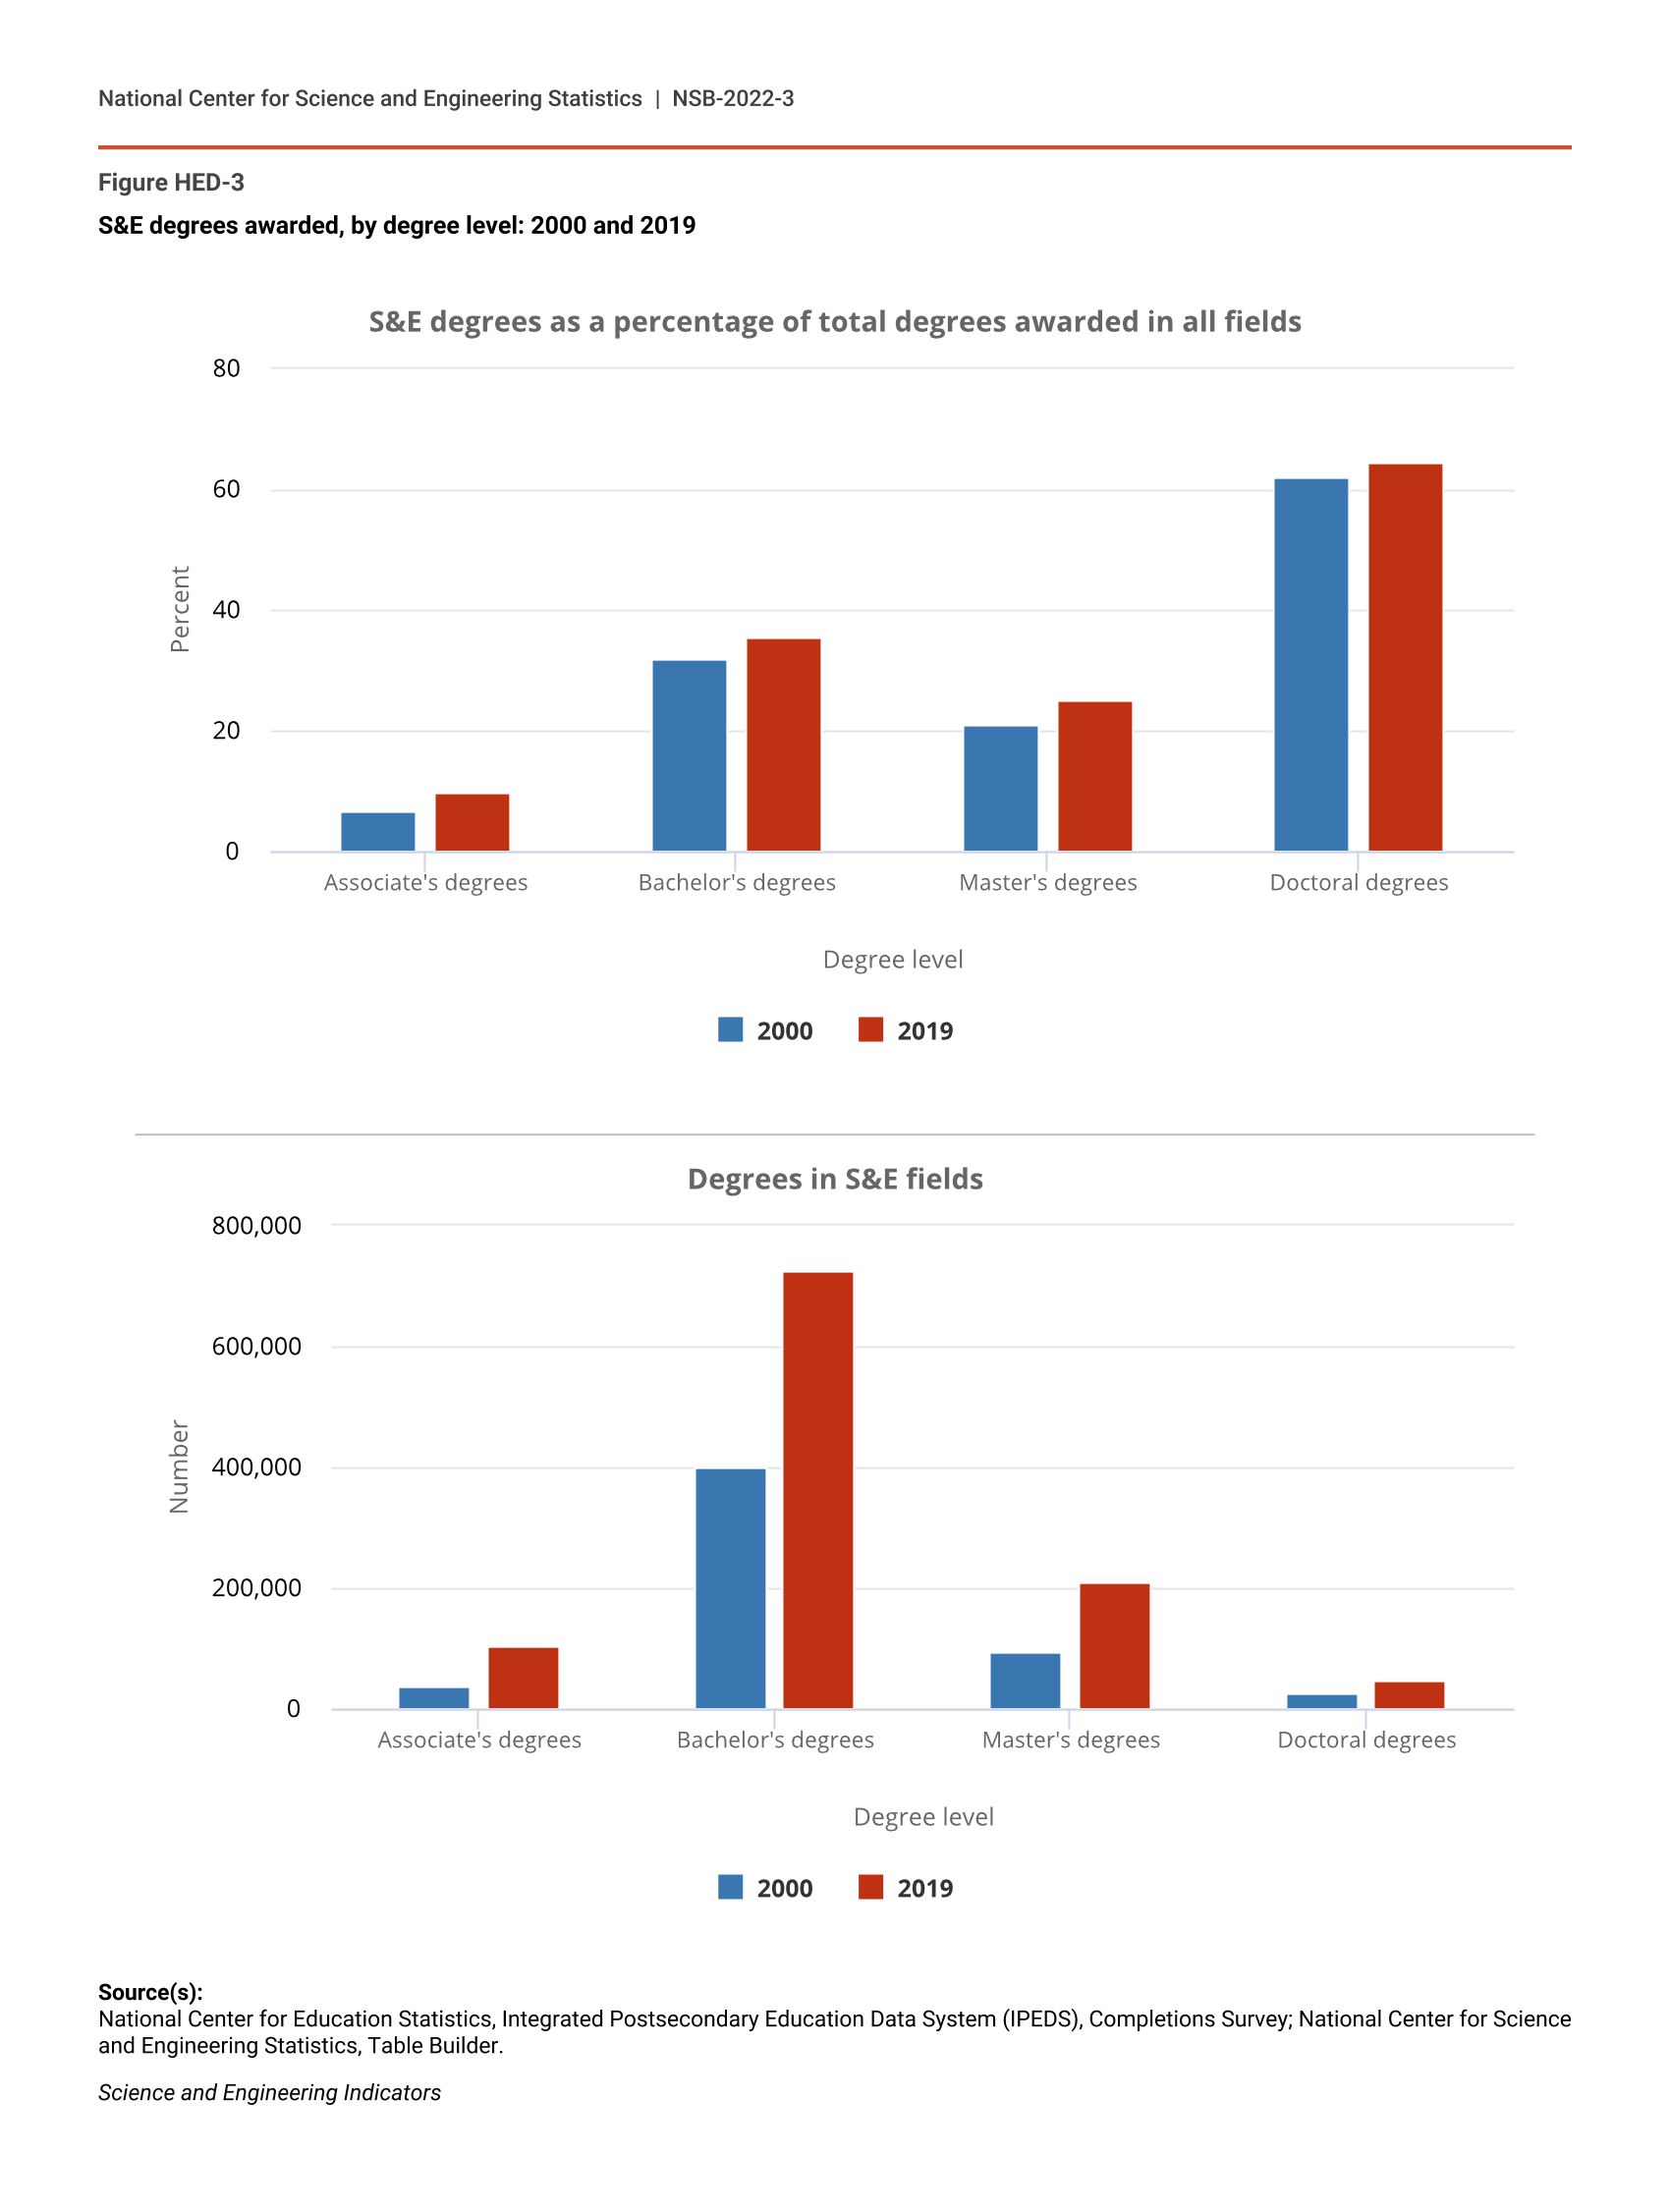
The number of S&E degrees awarded has increased at all levels and across many fields. In numbers and as a percentage of total degrees, S&E degrees increased at the associate’s, bachelor’s, master’s, and doctoral levels from 2000 to 2019 (Figure HED-3). State-level data on S&E degrees as a percentage of higher education degrees conferred are available in NSB State Indicator S-20 (NSB 2021c).
S&E degrees awarded, by degree level: 2000 and 2019
| Degree level | 2000 | 2019 |
|---|---|---|
| Associate's degrees | 6.7 | 10.0 |
| Bachelor's degrees | 31.8 | 35.6 |
| Master's degrees | 20.9 | 25.0 |
| Doctoral degrees | 62.0 | 64.5 |
| Degree level | 2000 | 2019 |
|---|---|---|
| Associate's degrees | 38,434 | 104,435 |
| Bachelor's degrees | 398,602 | 724,947 |
| Master's degrees | 96,230 | 209,566 |
| Doctoral degrees | 27,862 | 47,753 |
Source(s):
National Center for Education Statistics, Integrated Postsecondary Education Data System (IPEDS), Completions Survey; National Center for Science and Engineering Statistics, Table Builder.
Science and Engineering Indicators
Undergraduate Degree Awards
S&E coursework at the undergraduate level prepares knowledgeable citizens in a society increasingly reliant on science and technology. Over the past 20 years, the number of undergraduate degrees awarded by U.S. academic institutions has increased in both S&E and non-S&E fields. According to the U.S. Department of Education, the number of associate’s degrees awarded is projected to increase by 1%, and the number of bachelor’s degrees awarded should increase by 3% over the period spanning 2017–29 (Hussar and Bailey 2020).
S&E Associate’s Degrees
Associate’s degrees are the final degree earned by some students, whereas others continue their education at 4-year colleges or universities and earn higher degrees. Many who transfer from community colleges to baccalaureate-granting institutions do not earn associate’s degrees before transferring; they may be able to transfer credit for specific courses.
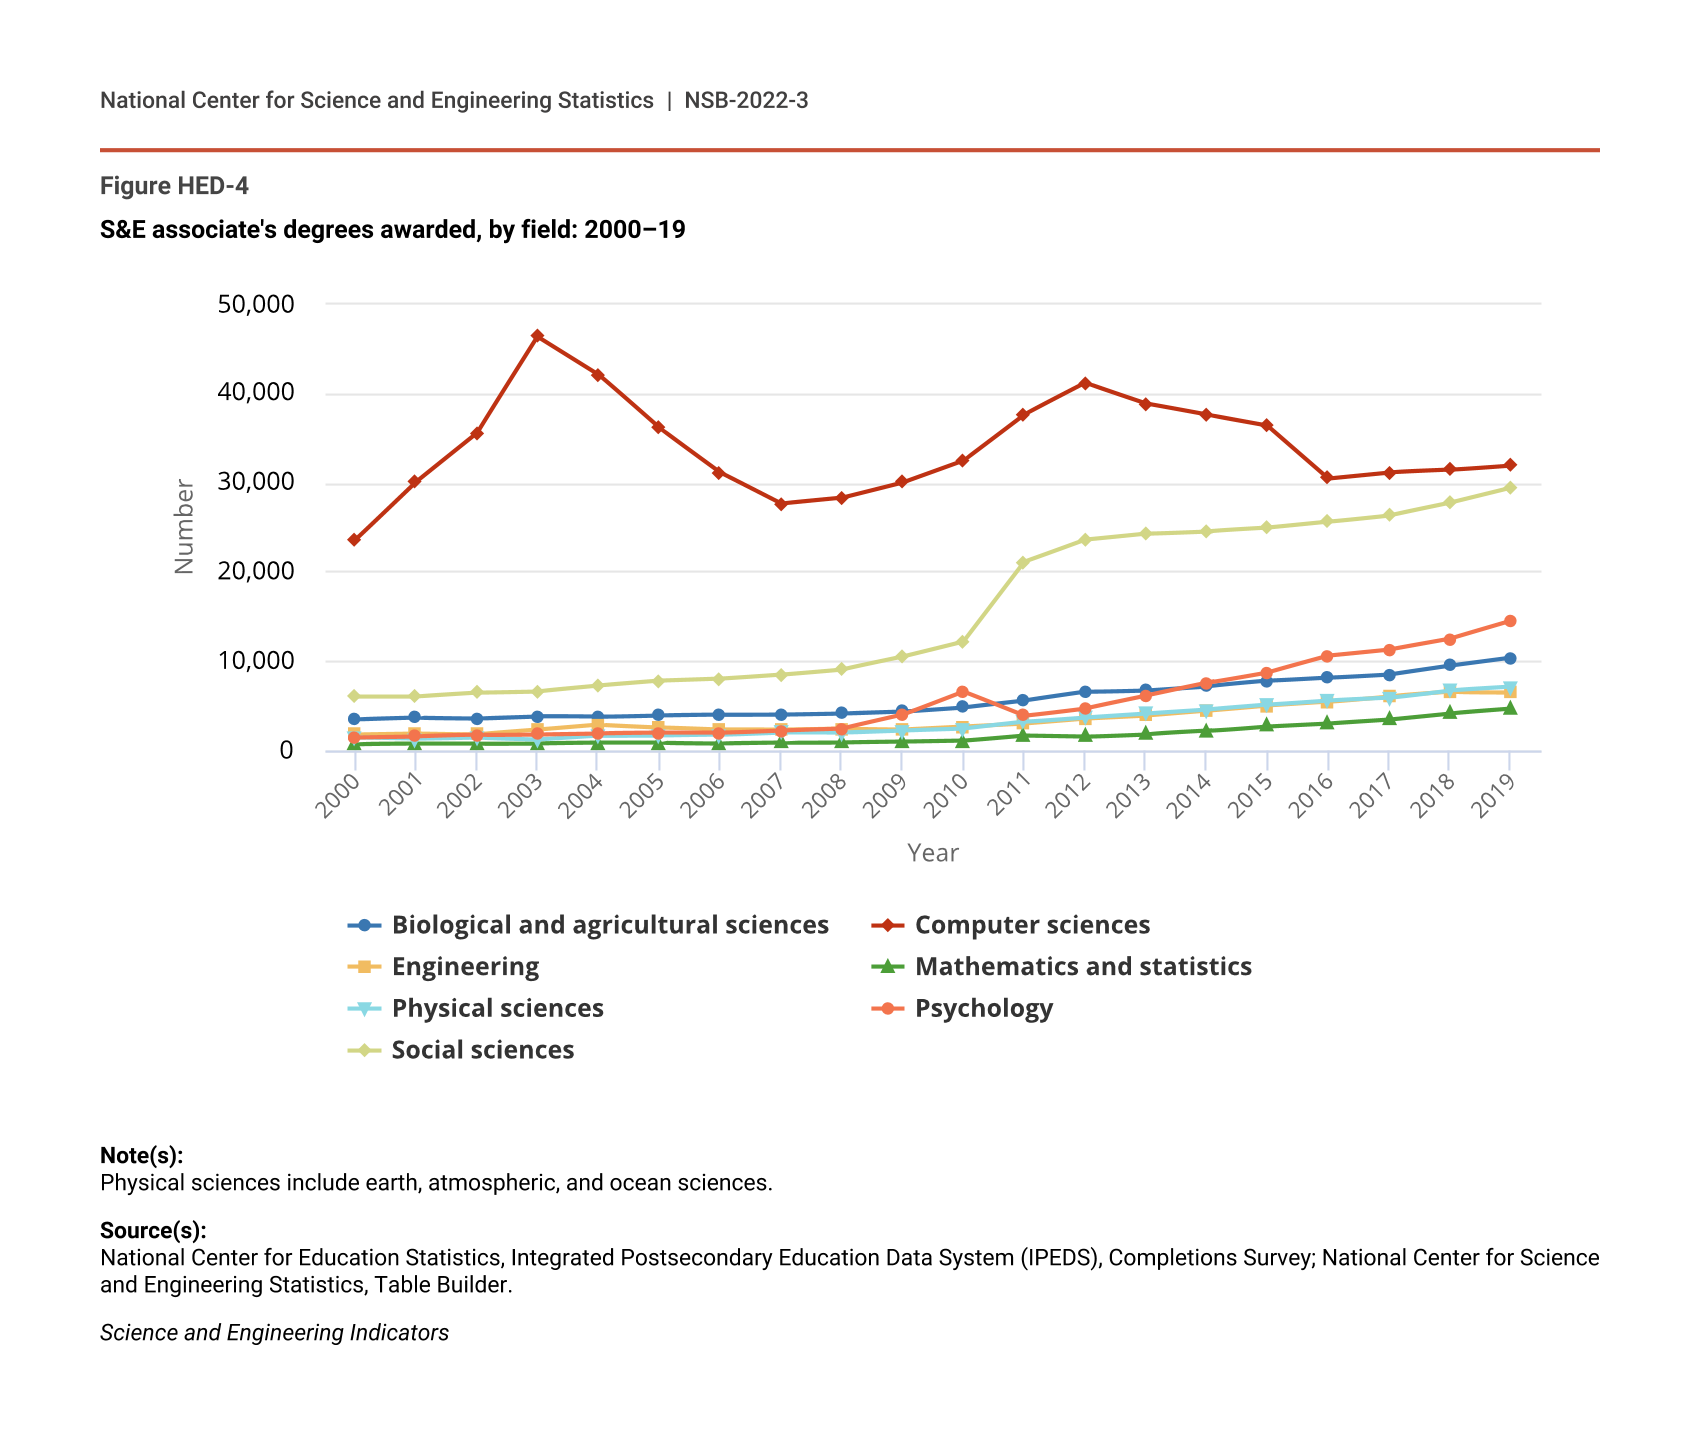
Relatively few associate’s degrees are awarded in S&E fields. In 2019, 104,000 out of more than 1 million associate’s degrees (10%) were in S&E fields (see NSB Indicators 2020: Table S2-4; Table SHED-3). The total number of S&E associate’s degrees awarded declined from 2003 to 2007 but has risen in almost all years since then. Until 2012, the overall trend mirrored the pattern in computer sciences, which account for a large portion (nearly 50% in 2012 and 31% in 2019) of S&E associate’s degrees (Figure HED-4). Since 2012, the total number of S&E associate’s degrees has continued to increase despite a decline in the number of computer sciences degrees.
S&E associate's degrees awarded, by field: 2000–19
| Year | Biological and agricultural sciences | Computer sciences | Engineering | Mathematics and statistics | Physical sciences | Psychology | Social sciences |
|---|---|---|---|---|---|---|---|
| 2000 | 3,460 | 23,576 | 1,794 | 675 | 1,419 | 1,454 | 6,056 |
| 2001 | 3,642 | 30,113 | 1,898 | 696 | 1,267 | 1,553 | 6,057 |
| 2002 | 3,578 | 35,578 | 1,781 | 686 | 1,401 | 1,704 | 6,466 |
| 2003 | 3,804 | 46,400 | 2,278 | 735 | 1,191 | 1,785 | 6,612 |
| 2004 | 3,719 | 42,153 | 2,843 | 802 | 1,615 | 1,887 | 7,227 |
| 2005 | 3,887 | 36,140 | 2,557 | 807 | 1,660 | 1,942 | 7,757 |
| 2006 | 3,962 | 31,170 | 2,291 | 753 | 1,737 | 1,944 | 7,993 |
| 2007 | 4,014 | 27,680 | 2,272 | 827 | 2,015 | 2,213 | 8,464 |
| 2008 | 4,141 | 28,327 | 2,403 | 855 | 1,976 | 2,412 | 9,052 |
| 2009 | 4,357 | 30,050 | 2,329 | 930 | 2,199 | 3,949 | 10,470 |
| 2010 | 4,833 | 32,514 | 2,665 | 1,051 | 2,403 | 6,582 | 12,163 |
| 2011 | 5,578 | 37,675 | 2,994 | 1,645 | 3,163 | 3,866 | 21,100 |
| 2012 | 6,554 | 41,190 | 3,537 | 1,529 | 3,670 | 4,713 | 23,592 |
| 2013 | 6,732 | 38,897 | 3,871 | 1,802 | 4,104 | 6,118 | 24,274 |
| 2014 | 7,173 | 37,643 | 4,409 | 2,140 | 4,535 | 7,529 | 24,547 |
| 2015 | 7,749 | 36,421 | 5,004 | 2,697 | 5,062 | 8,736 | 24,920 |
| 2016 | 8,134 | 30,512 | 5,414 | 3,029 | 5,542 | 10,602 | 25,599 |
| 2017 | 8,518 | 31,179 | 6,048 | 3,454 | 5,850 | 11,282 | 26,319 |
| 2018 | 9,500 | 31,434 | 6,526 | 4,135 | 6,707 | 12,488 | 27,723 |
| 2019 | 10,393 | 31,939 | 6,492 | 4,631 | 7,099 | 14,481 | 29,400 |
Note(s):
Physical sciences include earth, atmospheric, and ocean sciences.
Source(s):
National Center for Education Statistics, Integrated Postsecondary Education Data System (IPEDS), Completions Survey; National Center for Science and Engineering Statistics, Table Builder.
Science and Engineering Indicators
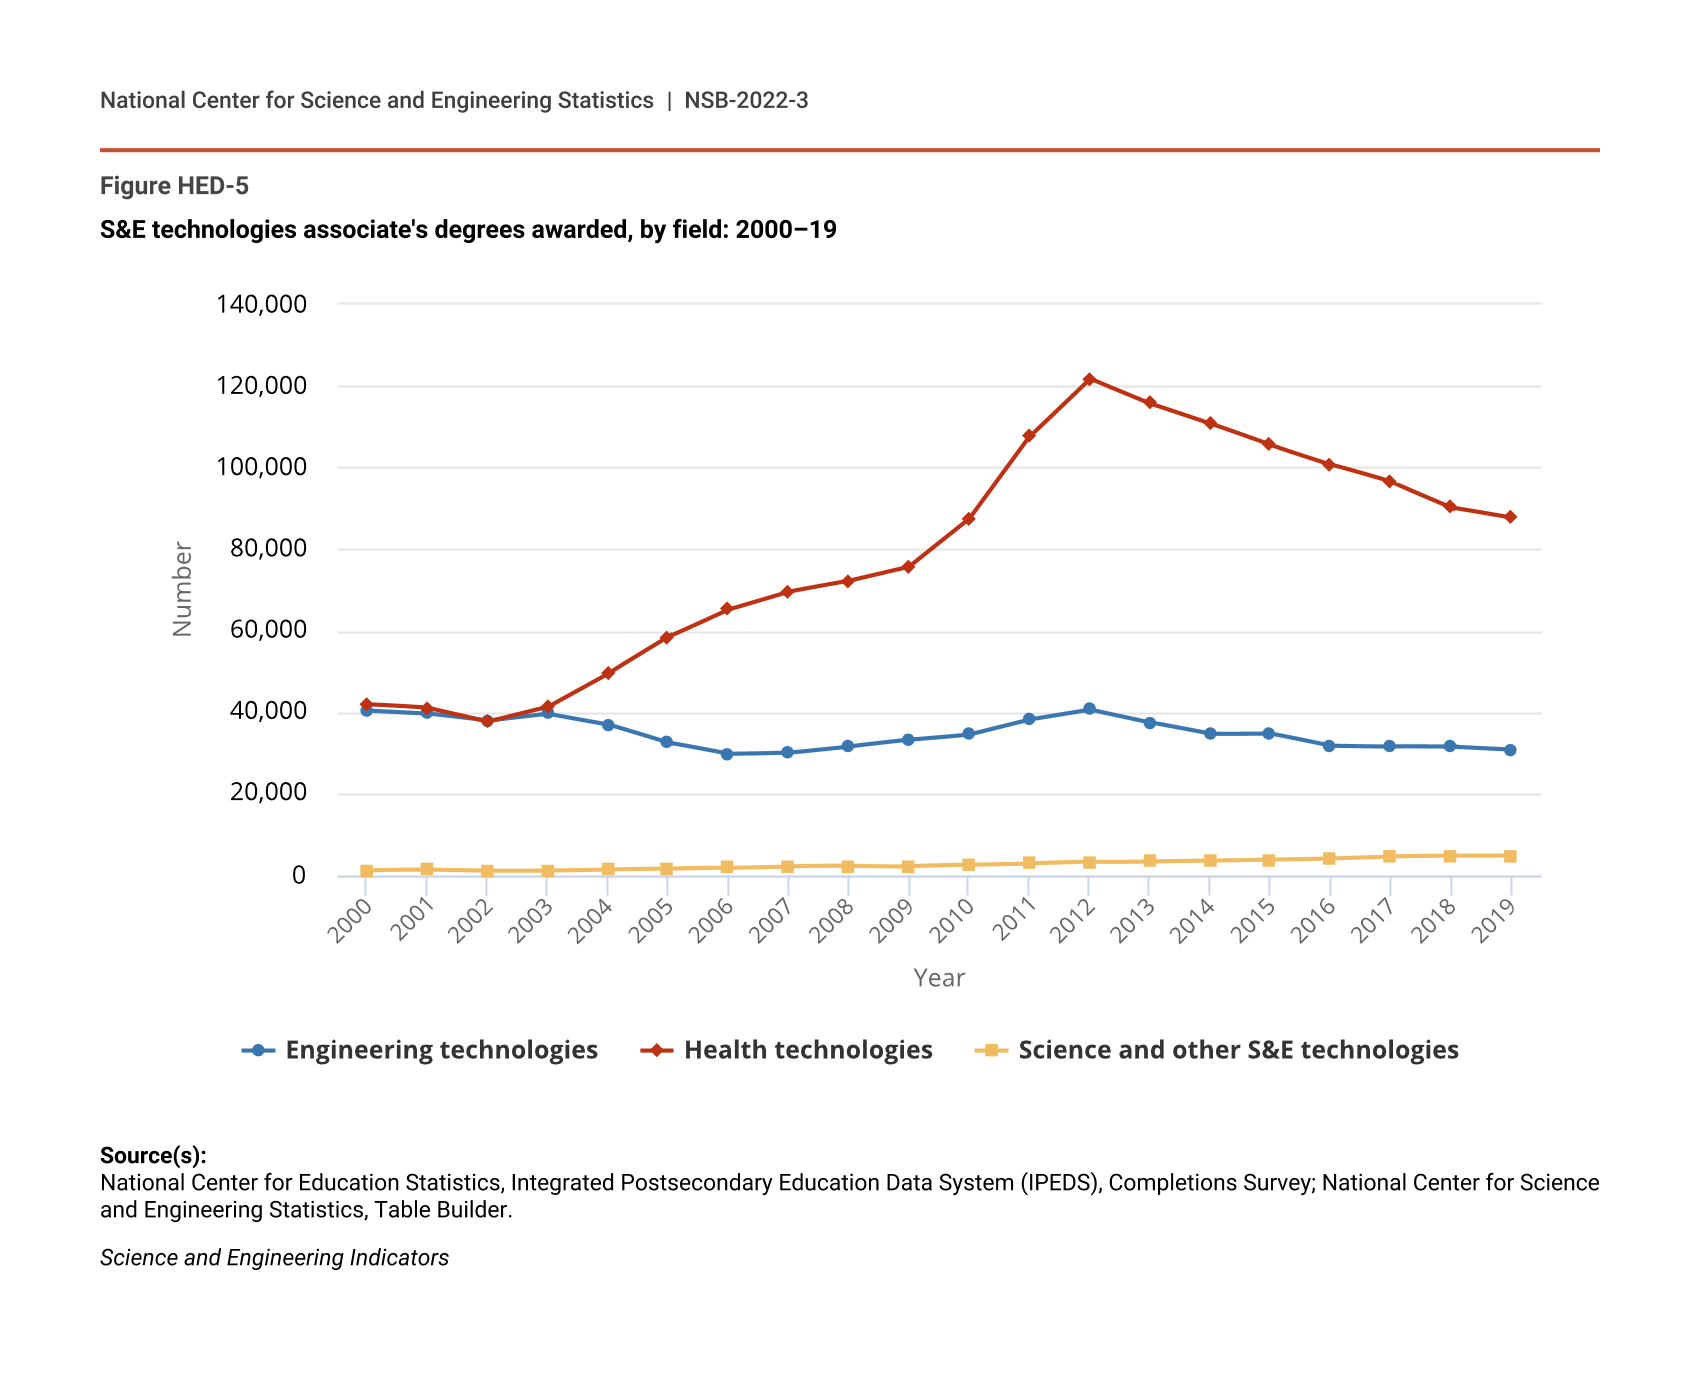
In 2019, community colleges awarded 123,000 associate’s degrees in S&E technologies—more degrees than in S&E fields, which is a long-standing trend. S&E technologies have a more applied focus and include technician programs in engineering, health sciences, and other S&E fields (Table SHED-3). Health technologies constitute the large majority of degrees in S&E technologies (71% in 2019), followed by engineering technologies (25% in 2019), with only 4% in other fields. Degrees in S&E technologies prepare students to enter skilled technical professions directly, without the greater investment of time and money associated with obtaining a bachelor’s or advanced degree. For more data on the STW, see the Indicators 2022 report “The STEM Labor Force of Today: Scientists, Engineers, and Skilled Technical Workers.” For data on state-level variation in associate’s degrees in technology, see NSB State Indicator S-17.
The number of associate’s degrees awarded in S&E technologies peaked at 166,000 in 2012; since then, it has declined for engineering technologies (from 41,000 to 31,000) and health technologies (from 122,000 to 88,000) (Figure HED-5).
S&E technologies associate's degrees awarded, by field: 2000–19
| Year | Engineering technologies | Health technologies | Science and other S&E technologies |
|---|---|---|---|
| 2000 | 40,470 | 41,959 | 1,224 |
| 2001 | 39,732 | 41,013 | 1,310 |
| 2002 | 37,901 | 37,687 | 1,089 |
| 2003 | 39,600 | 41,353 | 1,180 |
| 2004 | 37,020 | 49,497 | 1,426 |
| 2005 | 32,488 | 58,432 | 1,601 |
| 2006 | 29,710 | 65,227 | 1,835 |
| 2007 | 30,097 | 69,591 | 2,210 |
| 2008 | 31,643 | 72,241 | 2,299 |
| 2009 | 33,243 | 75,734 | 2,195 |
| 2010 | 34,553 | 87,437 | 2,486 |
| 2011 | 38,222 | 107,577 | 2,837 |
| 2012 | 40,630 | 121,786 | 3,216 |
| 2013 | 37,475 | 115,739 | 3,359 |
| 2014 | 34,638 | 110,779 | 3,549 |
| 2015 | 34,764 | 105,513 | 3,821 |
| 2016 | 31,704 | 100,796 | 4,080 |
| 2017 | 31,561 | 96,480 | 4,540 |
| 2018 | 31,438 | 90,269 | 4,702 |
| 2019 | 30,731 | 87,707 | 4,744 |
Source(s):
National Center for Education Statistics, Integrated Postsecondary Education Data System (IPEDS), Completions Survey; National Center for Science and Engineering Statistics, Table Builder.
Science and Engineering Indicators
Certificates in S&E Technologies
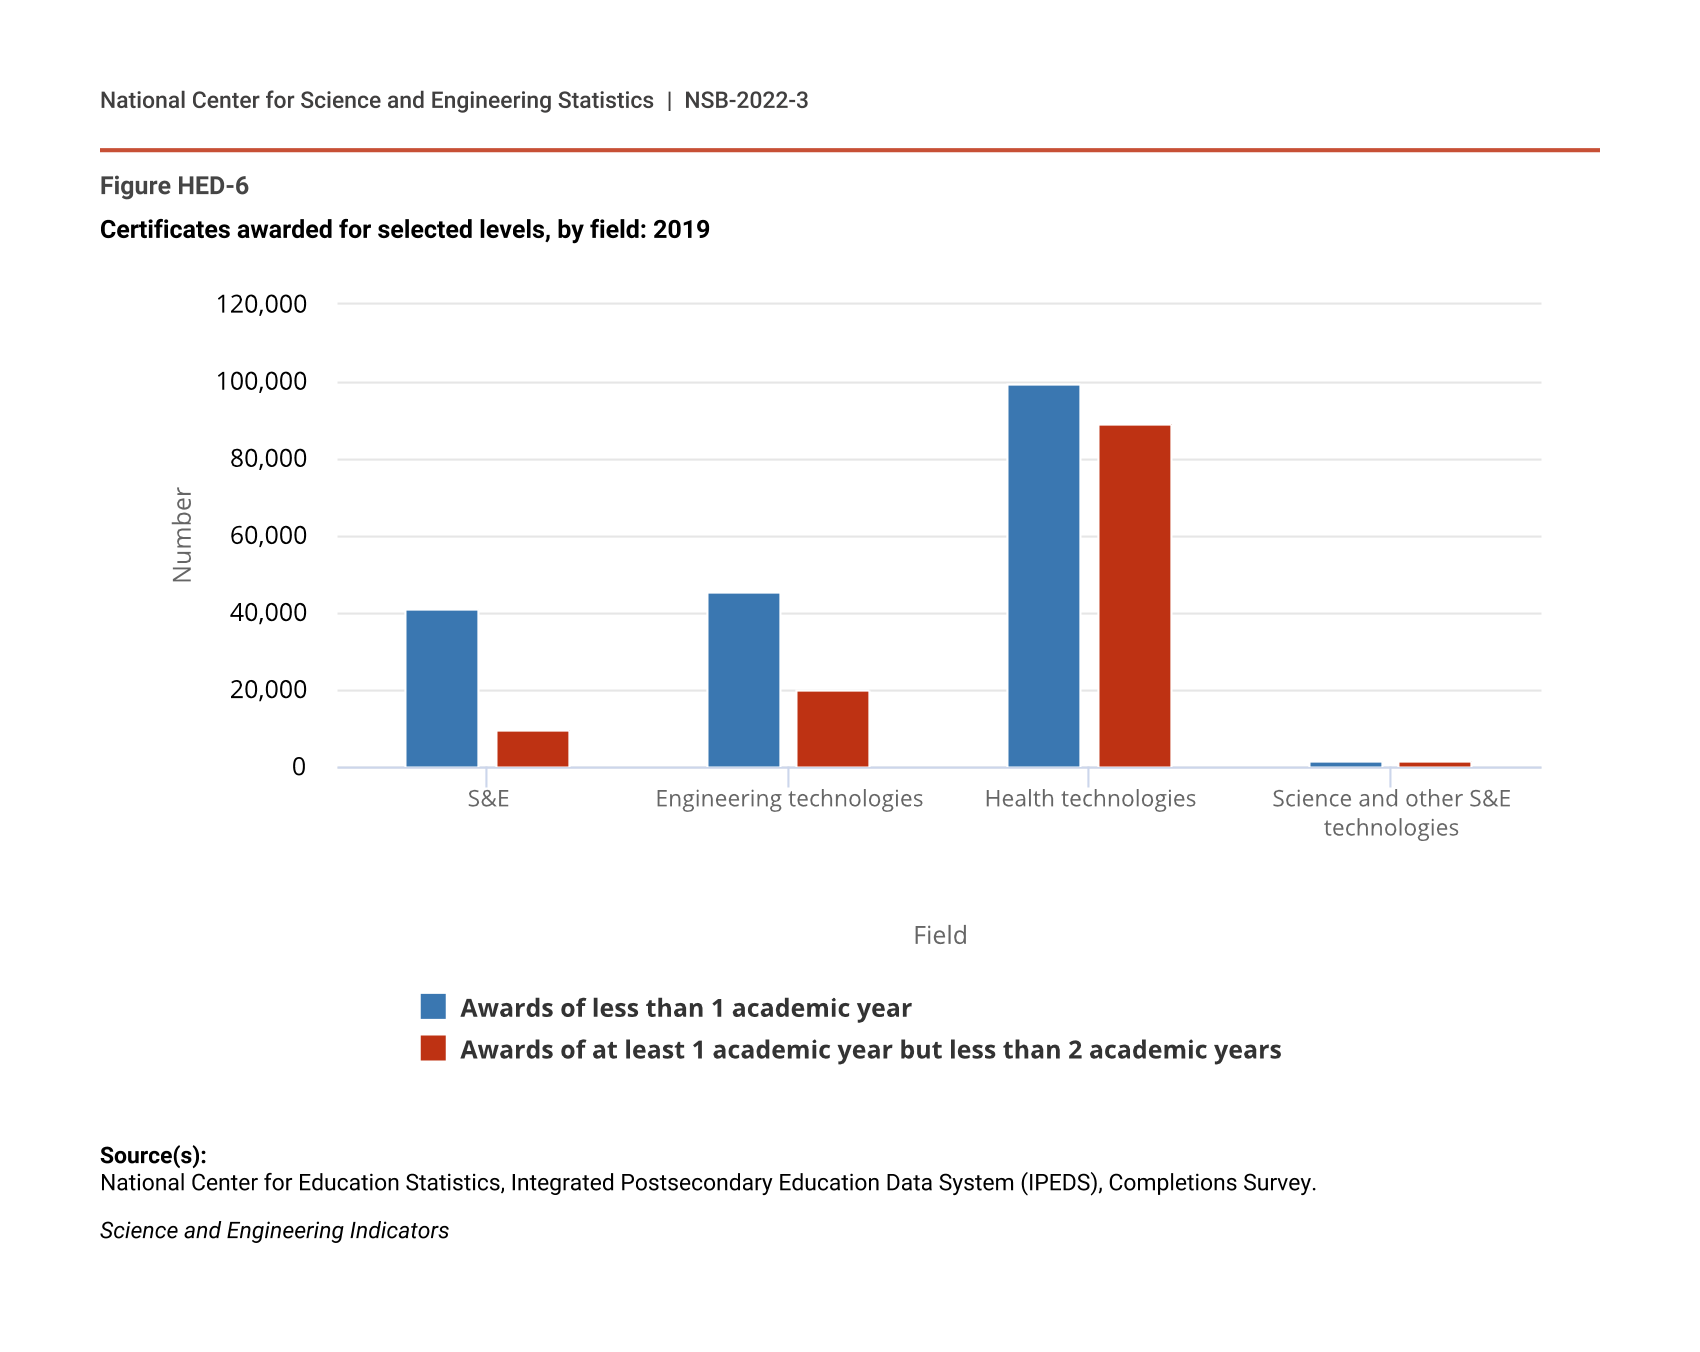
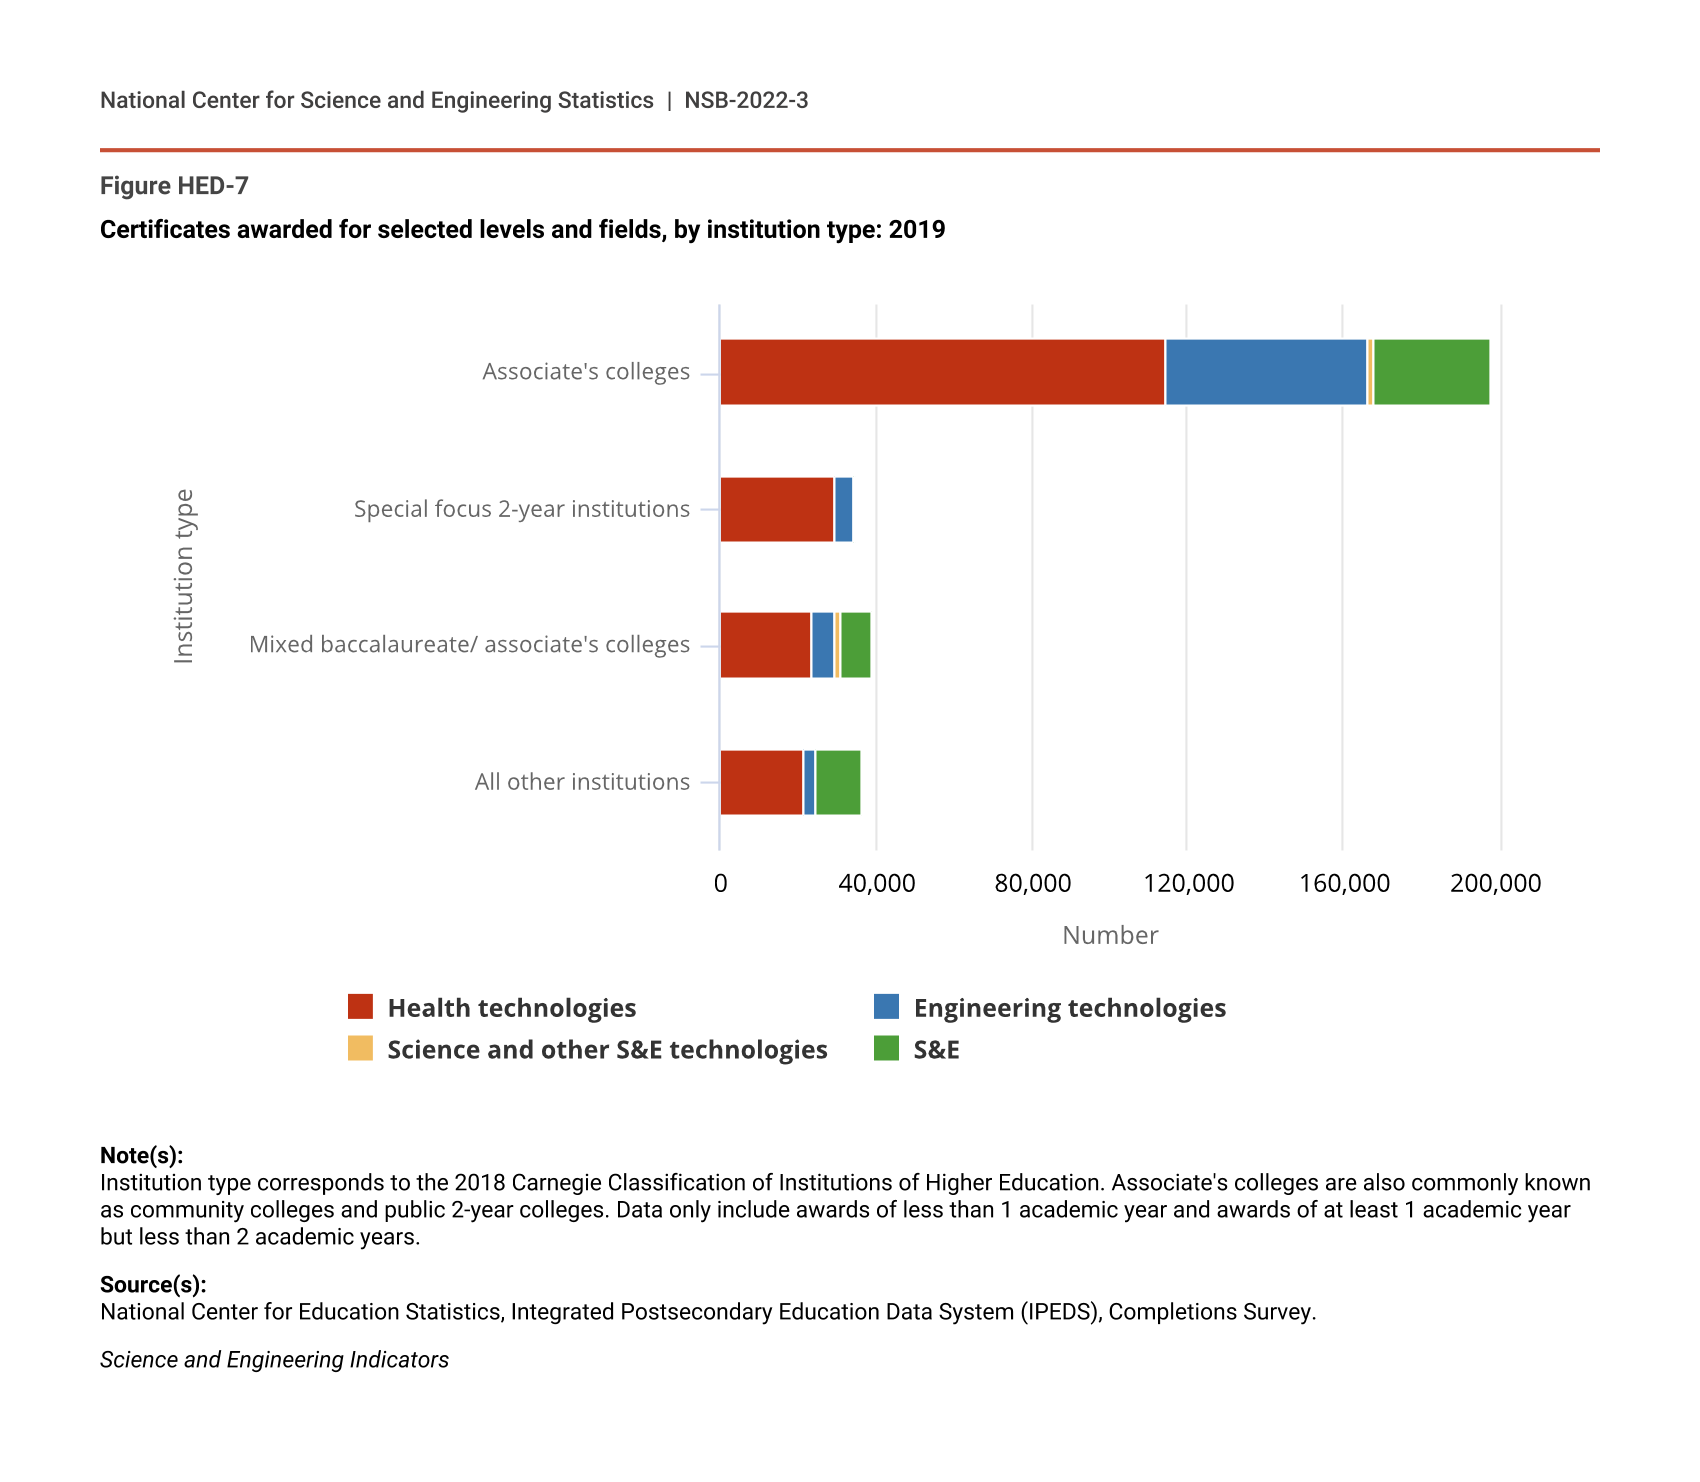
This report includes data on certificate awards of less than 1 academic year and awards of at least 1 but less than 2 academic years. In 2019, universities and colleges awarded roughly twice as many certificates in S&E technologies (258,000) as associate’s degrees in S&E technologies (123,000) (Table HED-2 and Table SHED-3). However, this does not mean that 258,000 students earned certificates because students often earn one or more certificates alongside or instead of a degree. As with associate’s degrees in S&E technologies, most certificates in S&E technologies were in health, followed by engineering, with few in other S&E technology fields (Figure HED-6; Table HED-2). Certificate programs are offered at a wide range of institution types, but the large majority are provided by community colleges (Figure HED-7; Table SHED-4). They enable people with or without a higher education degree to gain competency in technical skills needed in today’s marketplace. Among respondents to the Adult Training and Education Survey who were employed in the STW in 2016, around two-thirds reported that their certificate was very useful in improving their skills, around 60% found it very useful in getting a job, and just under 40% said their certificate helped increase their pay (NCES 2021a). In terms of career pathways, women frequently use their certificate to become a health care practitioner, and men often use it for jobs in installation, maintenance, and repair (Lancaster 2020).
Certificates awarded in S&E technologies for selected levels, by field: 2019
Note(s):
Awards at the detailed field level in this table will not match other tables and figures in this report due to the allocation of all Industrial production technologies/technicians awards under Engineering technologies. Data only include awards of less than 1 academic year and awards of at least 1 but less than 2 academic years.
Source(s):
National Center for Education Statistics, Integrated Postsecondary Education Data System (IPEDS), Completions Survey.
Science and Engineering Indicators
Certificates awarded for selected levels, by field: 2019
| Field | Awards of less than 1 academic year | Awards of at least 1 academic year but less than 2 academic years |
|---|---|---|
| S&E | 40,829 | 9,534 |
| Engineering technologies | 45,507 | 19,987 |
| Health technologies | 99,679 | 89,321 |
| Science and other S&E technologies | 1,823 | 1,465 |
Source(s):
National Center for Education Statistics, Integrated Postsecondary Education Data System (IPEDS), Completions Survey.
Science and Engineering Indicators
Certificates awarded for selected levels and fields, by institution type: 2019
| Institution type | Health technologies | Engineering technologies | Science and other S&E technologies | S&E |
|---|---|---|---|---|
| Associate's colleges | 114,561 | 51,841 | 1,646 | 29,766 |
| Special focus 2-year institutions | 29,651 | 4,625 | 51 | 374 |
| Mixed baccalaureate/ associate's colleges | 23,297 | 5,996 | 1,536 | 8,215 |
| All other institutions | 21,491 | 3,032 | 55 | 12,008 |
Note(s):
Institution type corresponds to the 2018 Carnegie Classification of Institutions of Higher Education. Associate's colleges are also commonly known as community colleges and public 2-year colleges. Data only include awards of less than 1 academic year and awards of at least 1 academic year but less than 2 academic years.
Source(s):
National Center for Education Statistics, Integrated Postsecondary Education Data System (IPEDS), Completions Survey.
Science and Engineering Indicators
S&E Bachelor’s Degrees
The baccalaureate accounts for nearly 70% of all S&E degrees awarded. The number of S&E bachelor’s degrees received rose steadily from about 400,000 in 2000 to just under 725,000 in 2019 (see NSB Indicators 2020: Table S2-6; Table SHED-5). As a share of total bachelor’s degrees awarded, S&E degrees have increased slightly over this period, rising from 32% to 36%. State-level data on bachelor’s degrees and bachelor’s degrees in S&E fields are available in NSB State Indicator S-18 and NSB State Indicator S-19, respectively.
Growth in S&E bachelor’s degrees conferred varied by field (Figure HED-8; Table SHED-5), with most degrees awarded in social sciences, followed by biological and agricultural sciences. Large public universities have long dominated degree conferral in all fields, including S&E. Additionally, in 2019, the very high research activity doctoral universities, as per the Carnegie Classification, awarded 44% of total U.S. S&E bachelor’s degrees, though they awarded only 32% of total bachelor’s degrees (Table SHED-1). The large contribution of these institutions to producing S&E bachelor’s degrees is also a long-standing pattern.
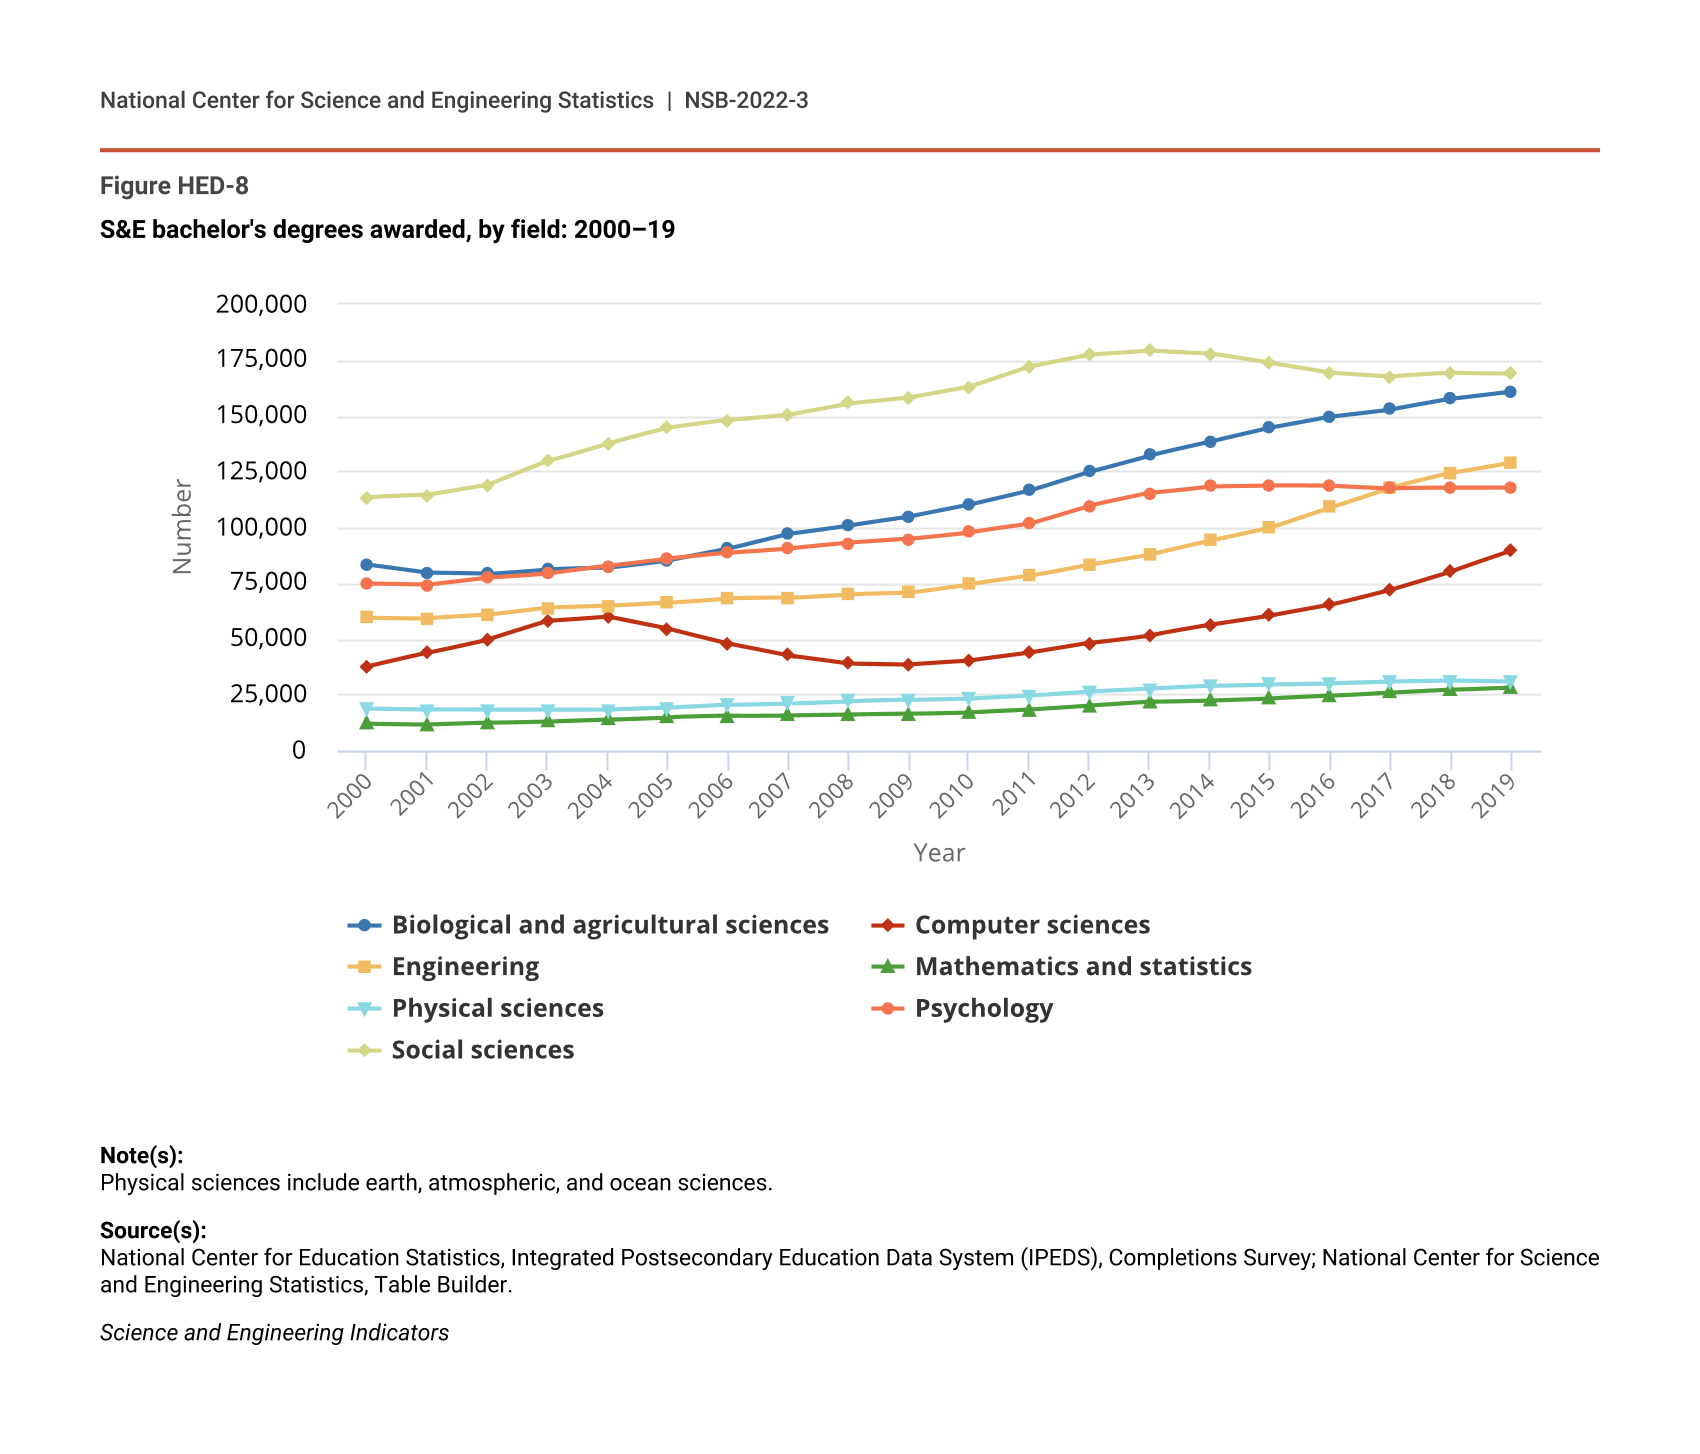
S&E bachelor's degrees awarded, by field: 2000–19
| Year | Biological and agricultural sciences | Computer sciences | Engineering | Mathematics and statistics | Physical sciences | Psychology | Social sciences |
|---|---|---|---|---|---|---|---|
| 2000 | 83,132 | 37,519 | 59,487 | 11,714 | 18,597 | 74,656 | 113,497 |
| 2001 | 79,475 | 43,597 | 59,214 | 11,437 | 18,114 | 74,124 | 114,474 |
| 2002 | 79,034 | 49,706 | 60,605 | 12,254 | 17,981 | 77,297 | 119,106 |
| 2003 | 81,220 | 57,926 | 63,789 | 12,863 | 18,059 | 79,163 | 129,735 |
| 2004 | 81,808 | 59,968 | 64,680 | 13,735 | 18,122 | 82,606 | 137,739 |
| 2005 | 85,092 | 54,588 | 66,152 | 14,816 | 18,964 | 86,031 | 144,571 |
| 2006 | 90,279 | 48,000 | 68,227 | 15,310 | 20,377 | 88,551 | 148,114 |
| 2007 | 97,044 | 42,596 | 68,274 | 15,551 | 21,084 | 90,498 | 150,725 |
| 2008 | 100,872 | 38,922 | 69,908 | 15,841 | 21,966 | 92,989 | 155,670 |
| 2009 | 104,726 | 38,496 | 70,600 | 16,208 | 22,484 | 94,743 | 158,178 |
| 2010 | 110,015 | 40,107 | 74,399 | 16,832 | 23,204 | 97,746 | 163,071 |
| 2011 | 116,413 | 43,586 | 78,099 | 18,021 | 24,497 | 101,568 | 172,181 |
| 2012 | 124,954 | 48,034 | 83,263 | 19,819 | 26,286 | 109,782 | 177,429 |
| 2013 | 132,312 | 51,586 | 87,812 | 21,567 | 27,567 | 115,373 | 179,258 |
| 2014 | 138,316 | 56,130 | 93,950 | 22,226 | 28,952 | 118,405 | 177,936 |
| 2015 | 144,584 | 60,309 | 99,906 | 23,136 | 29,636 | 118,768 | 173,718 |
| 2016 | 149,613 | 65,186 | 108,976 | 24,293 | 30,029 | 118,646 | 169,414 |
| 2017 | 152,831 | 72,129 | 117,927 | 25,808 | 30,730 | 117,441 | 167,691 |
| 2018 | 157,530 | 80,271 | 124,328 | 27,161 | 31,087 | 117,574 | 169,207 |
| 2019 | 160,887 | 89,421 | 129,185 | 28,252 | 30,559 | 117,638 | 169,005 |
Note(s):
Physical sciences include earth, atmospheric, and ocean sciences.
Source(s):
National Center for Education Statistics, Integrated Postsecondary Education Data System (IPEDS), Completions Survey; National Center for Science and Engineering Statistics, Table Builder.
Science and Engineering Indicators
Graduate Degree Awards
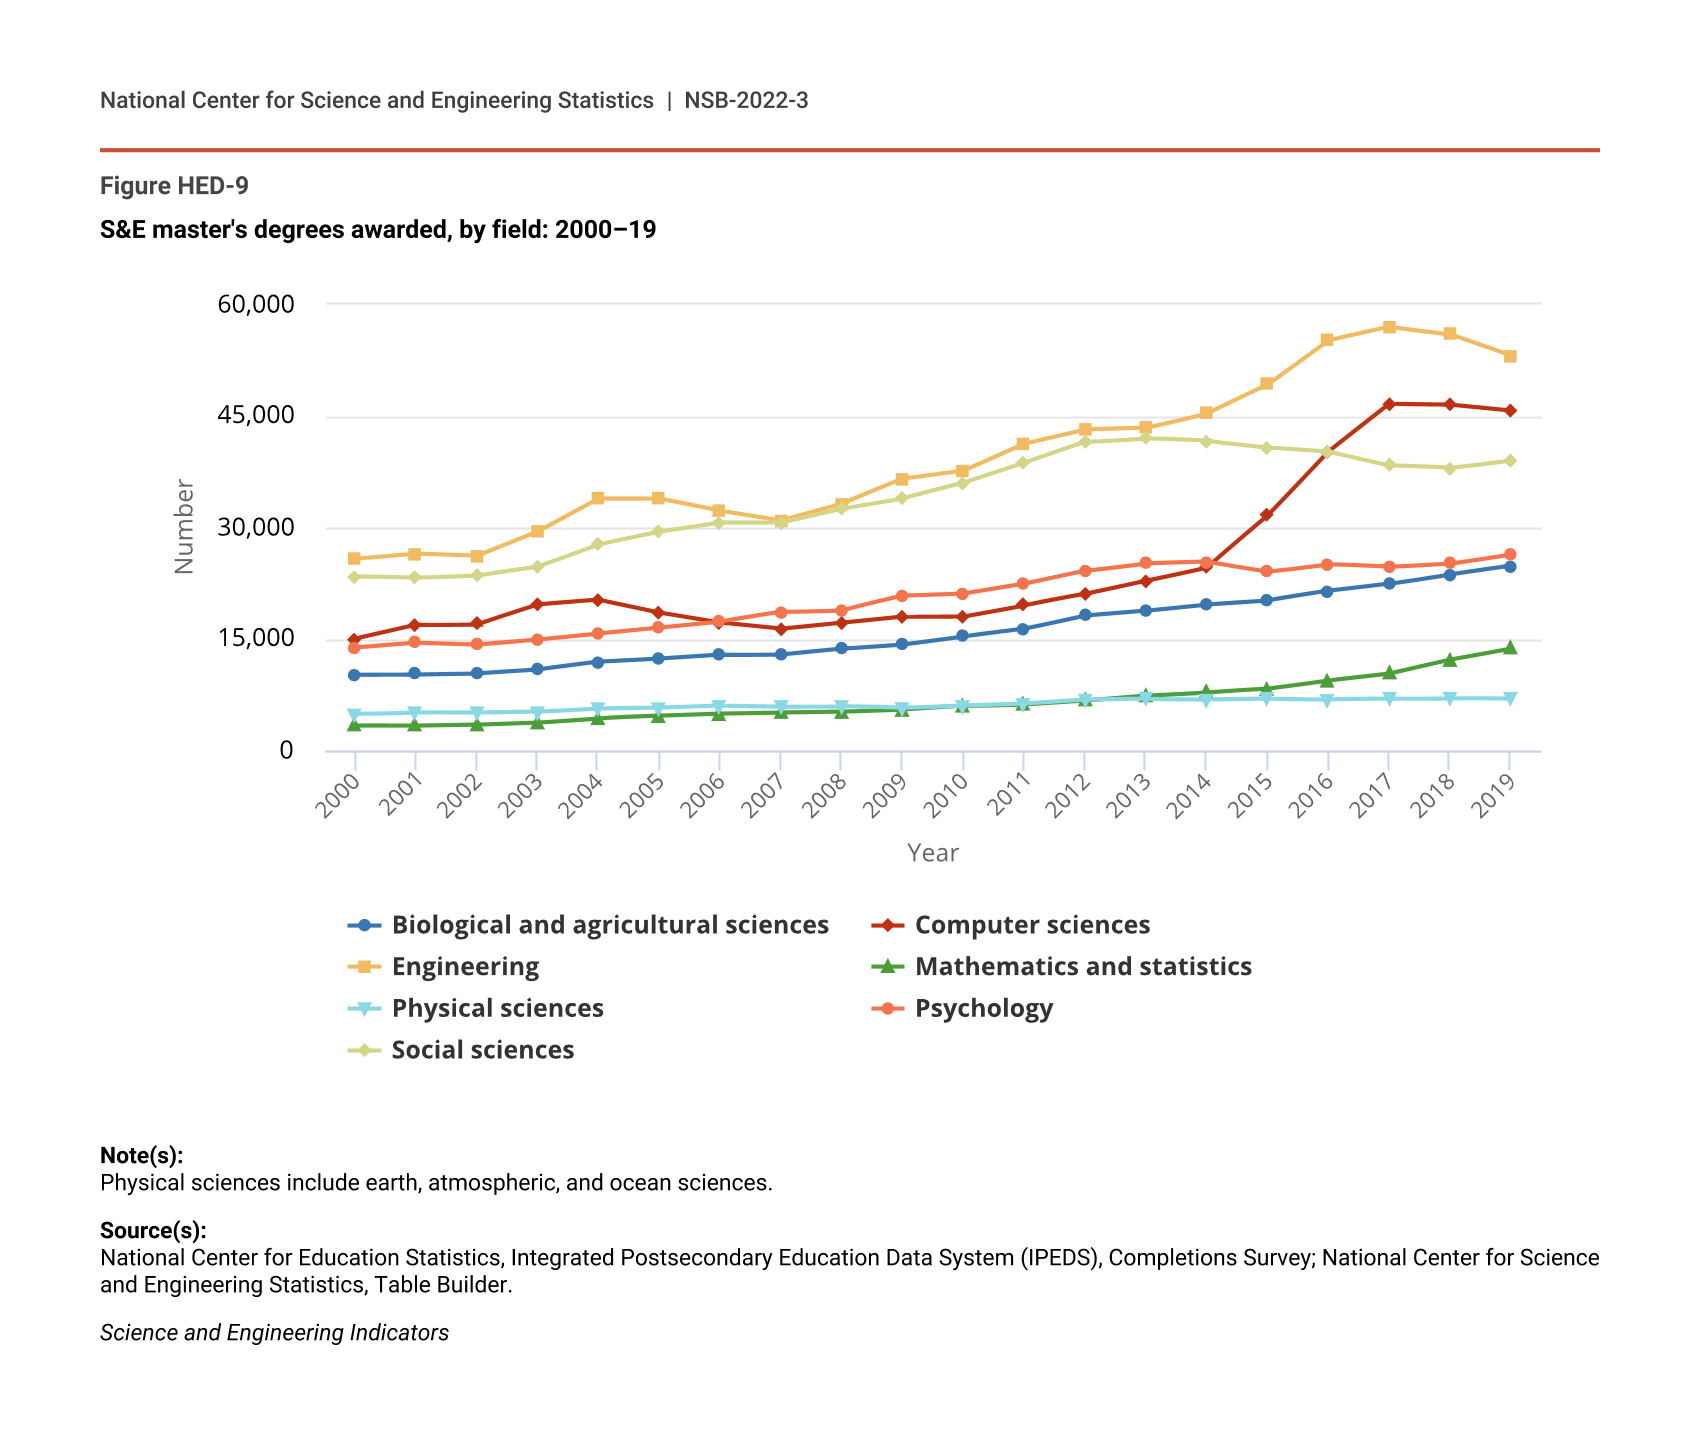
S&E Master’s Degrees
Master’s degrees may fully prepare students for established career tracks in some S&E fields. In others, they primarily mark a step toward doctoral degrees. From 2000 to 2019, master’s degrees awarded in S&E fields more than doubled from about 96,000 to about 210,000 (see NSB Indicators 2020: Table S2-8; Table SHED-6). According to the U.S. Department of Education, this increase is projected to continue at least through 2028 (Hussar and Bailey 2020). S&E master’s degrees as a percentage of master’s degrees in all fields increased from 21% in 2000 to 25% in 2019.
Increases occurred in most major fields but were most pronounced in computer sciences and engineering (Figure HED-9). Growth in these two fields was driven largely by more students on temporary visas earning degrees, especially since 2014, as shown in Figure HED-10 and discussed in more detail in the report section International S&E Higher Education.
S&E master's degrees awarded, by field: 2000–19
| Year | Biological and agricultural sciences | Computer sciences | Engineering | Mathematics and statistics | Physical sciences | Psychology | Social sciences |
|---|---|---|---|---|---|---|---|
| 2000 | 10,187 | 14,986 | 25,738 | 3,295 | 4,858 | 13,806 | 23,360 |
| 2001 | 10,239 | 16,852 | 26,436 | 3,280 | 5,100 | 14,449 | 23,172 |
| 2002 | 10,360 | 16,965 | 26,180 | 3,424 | 5,031 | 14,204 | 23,486 |
| 2003 | 10,838 | 19,590 | 29,472 | 3,721 | 5,151 | 14,885 | 24,698 |
| 2004 | 11,865 | 20,208 | 33,922 | 4,297 | 5,600 | 15,700 | 27,704 |
| 2005 | 12,291 | 18,489 | 33,899 | 4,597 | 5,701 | 16,478 | 29,415 |
| 2006 | 12,818 | 17,138 | 32,263 | 4,890 | 5,962 | 17,302 | 30,626 |
| 2007 | 12,920 | 16,314 | 30,936 | 5,035 | 5,875 | 18,594 | 30,604 |
| 2008 | 13,685 | 17,151 | 33,177 | 5,152 | 5,926 | 18,836 | 32,477 |
| 2009 | 14,270 | 17,988 | 36,510 | 5,459 | 5,680 | 20,744 | 33,866 |
| 2010 | 15,352 | 18,021 | 37,614 | 5,958 | 6,000 | 21,032 | 35,949 |
| 2011 | 16,362 | 19,519 | 41,282 | 6,203 | 6,262 | 22,363 | 38,662 |
| 2012 | 18,156 | 21,015 | 43,175 | 6,684 | 6,758 | 24,121 | 41,463 |
| 2013 | 18,805 | 22,833 | 43,388 | 7,346 | 6,889 | 25,140 | 41,996 |
| 2014 | 19,647 | 24,635 | 45,362 | 7,784 | 6,842 | 25,332 | 41,626 |
| 2015 | 20,162 | 31,552 | 49,207 | 8,269 | 6,956 | 24,029 | 40,780 |
| 2016 | 21,413 | 40,211 | 55,166 | 9,390 | 6,869 | 25,041 | 40,202 |
| 2017 | 22,372 | 46,615 | 56,971 | 10,294 | 6,939 | 24,653 | 38,328 |
| 2018 | 23,666 | 46,548 | 55,982 | 12,153 | 6,983 | 25,128 | 37,967 |
| 2019 | 24,808 | 45,754 | 53,075 | 13,639 | 6,899 | 26,388 | 39,003 |
Note(s):
Physical sciences include earth, atmospheric, and ocean sciences.
Source(s):
National Center for Education Statistics, Integrated Postsecondary Education Data System (IPEDS), Completions Survey; National Center for Science and Engineering Statistics, Table Builder.
Science and Engineering Indicators
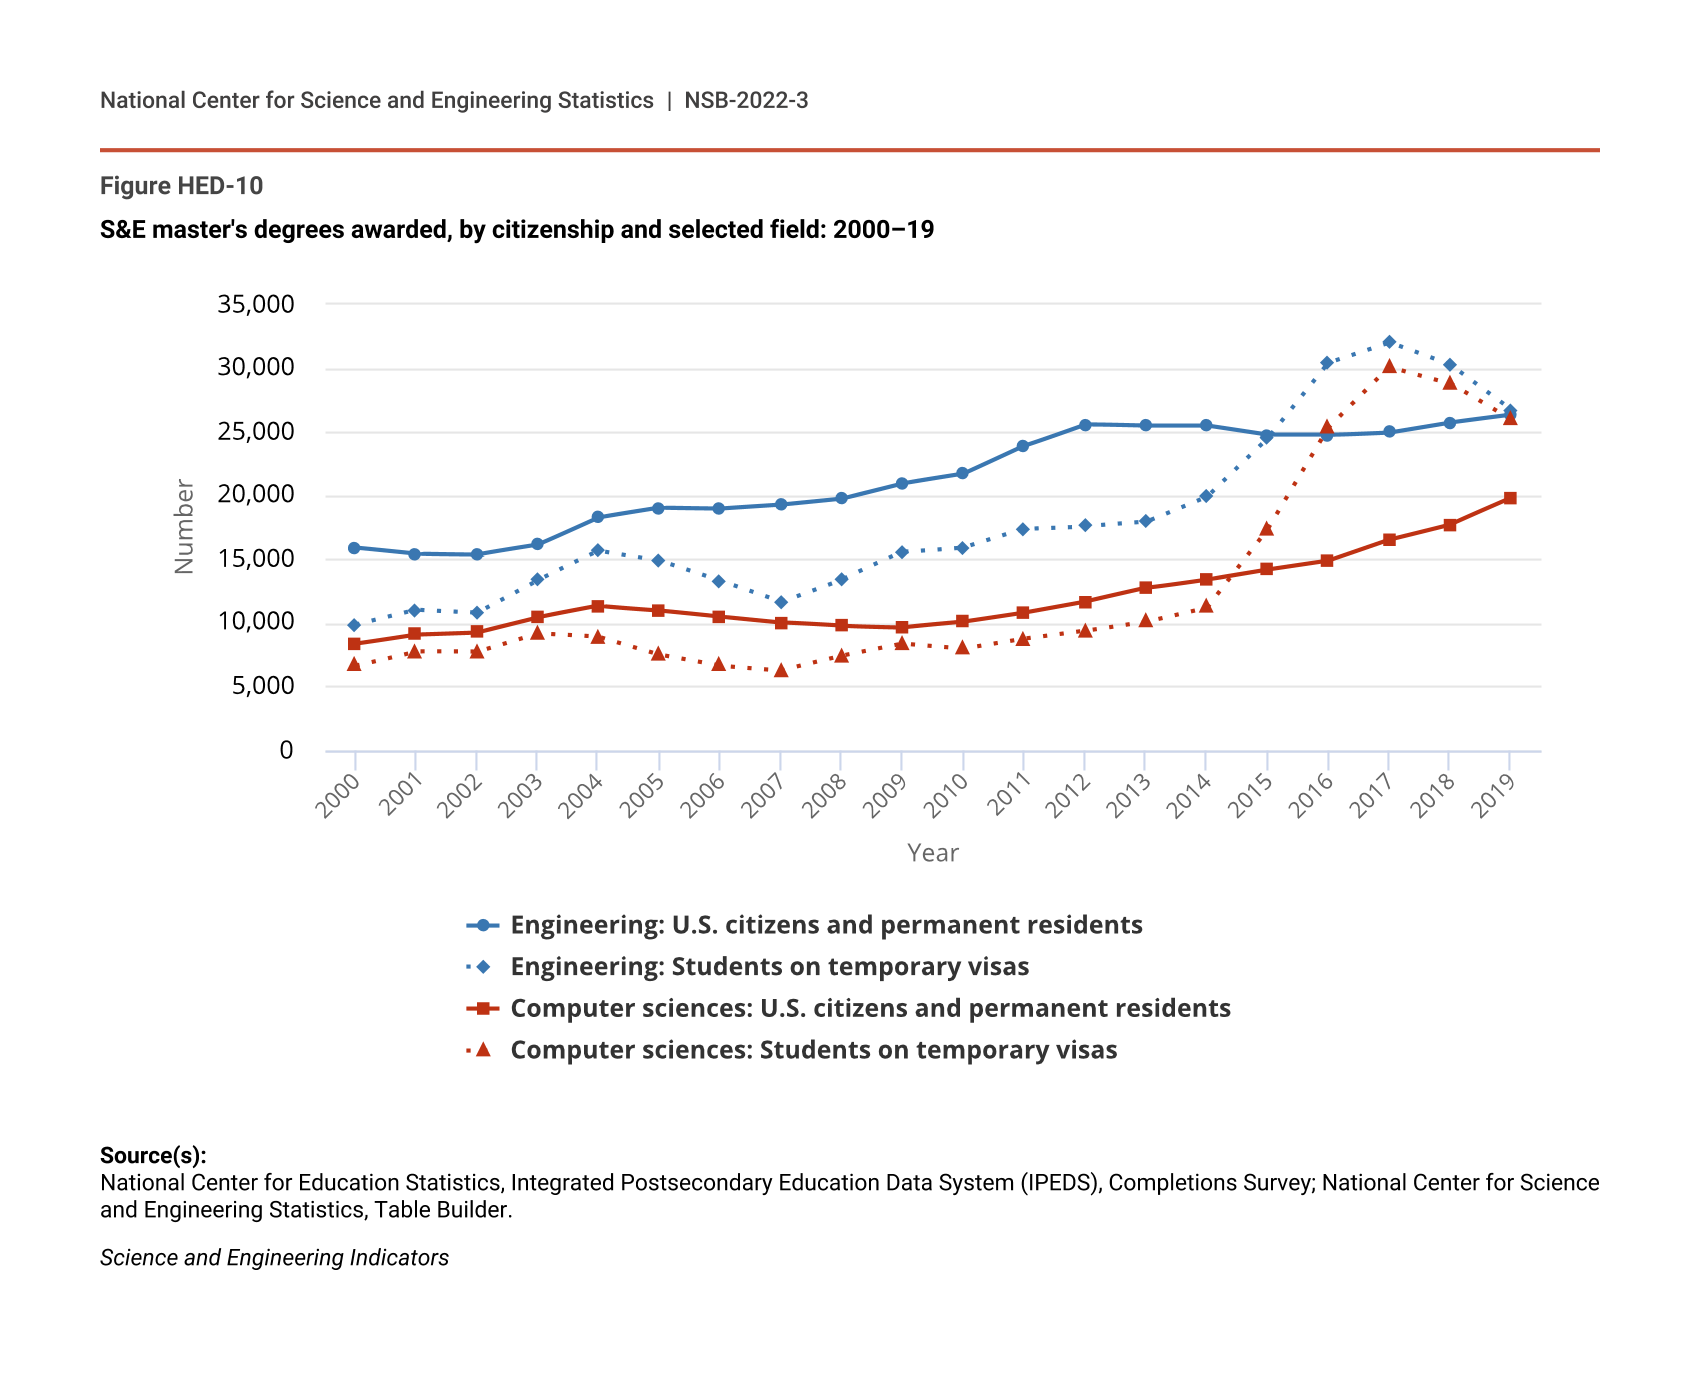
S&E master's degrees awarded, by citizenship and selected field: 2000–19
| Year | Engineering: U.S. citizens and permanent residents | Engineering: Students on temporary visas | Computer sciences: U.S. citizens and permanent residents | Computer sciences: Students on temporary visas |
|---|---|---|---|---|
| 2000 | 15,914 | 9,824 | 8,362 | 6,624 |
| 2001 | 15,434 | 11,002 | 9,091 | 7,761 |
| 2002 | 15,380 | 10,800 | 9,252 | 7,713 |
| 2003 | 16,125 | 13,347 | 10,423 | 9,167 |
| 2004 | 18,282 | 15,640 | 11,312 | 8,896 |
| 2005 | 19,034 | 14,865 | 10,975 | 7,514 |
| 2006 | 18,972 | 13,291 | 10,489 | 6,649 |
| 2007 | 19,276 | 11,660 | 10,027 | 6,287 |
| 2008 | 19,749 | 13,428 | 9,746 | 7,405 |
| 2009 | 20,940 | 15,570 | 9,641 | 8,347 |
| 2010 | 21,685 | 15,929 | 10,066 | 7,955 |
| 2011 | 23,895 | 17,387 | 10,786 | 8,733 |
| 2012 | 25,591 | 17,584 | 11,650 | 9,365 |
| 2013 | 25,469 | 17,919 | 12,725 | 10,108 |
| 2014 | 25,471 | 19,891 | 13,409 | 11,226 |
| 2015 | 24,747 | 24,460 | 14,199 | 17,353 |
| 2016 | 24,742 | 30,424 | 14,900 | 25,311 |
| 2017 | 24,958 | 32,013 | 16,542 | 30,073 |
| 2018 | 25,745 | 30,237 | 17,731 | 28,817 |
| 2019 | 26,351 | 26,724 | 19,799 | 25,955 |
Source(s):
National Center for Education Statistics, Integrated Postsecondary Education Data System (IPEDS), Completions Survey; National Center for Science and Engineering Statistics, Table Builder.
Science and Engineering Indicators
S&E Doctoral Degrees
Doctoral education in the United States generates new knowledge by closely linking specialized education and research experience. The results are important for U.S. competitiveness in a global knowledge-based economy and for society as a whole. Doctoral education prepares a new generation of researchers and a highly skilled workforce for academia, industry, government, and nonprofit organizations. Data on financial support for doctoral education and its linkage to R&D performance at colleges and universities are available in the Indicators 2022 report “Academic Research and Development.”
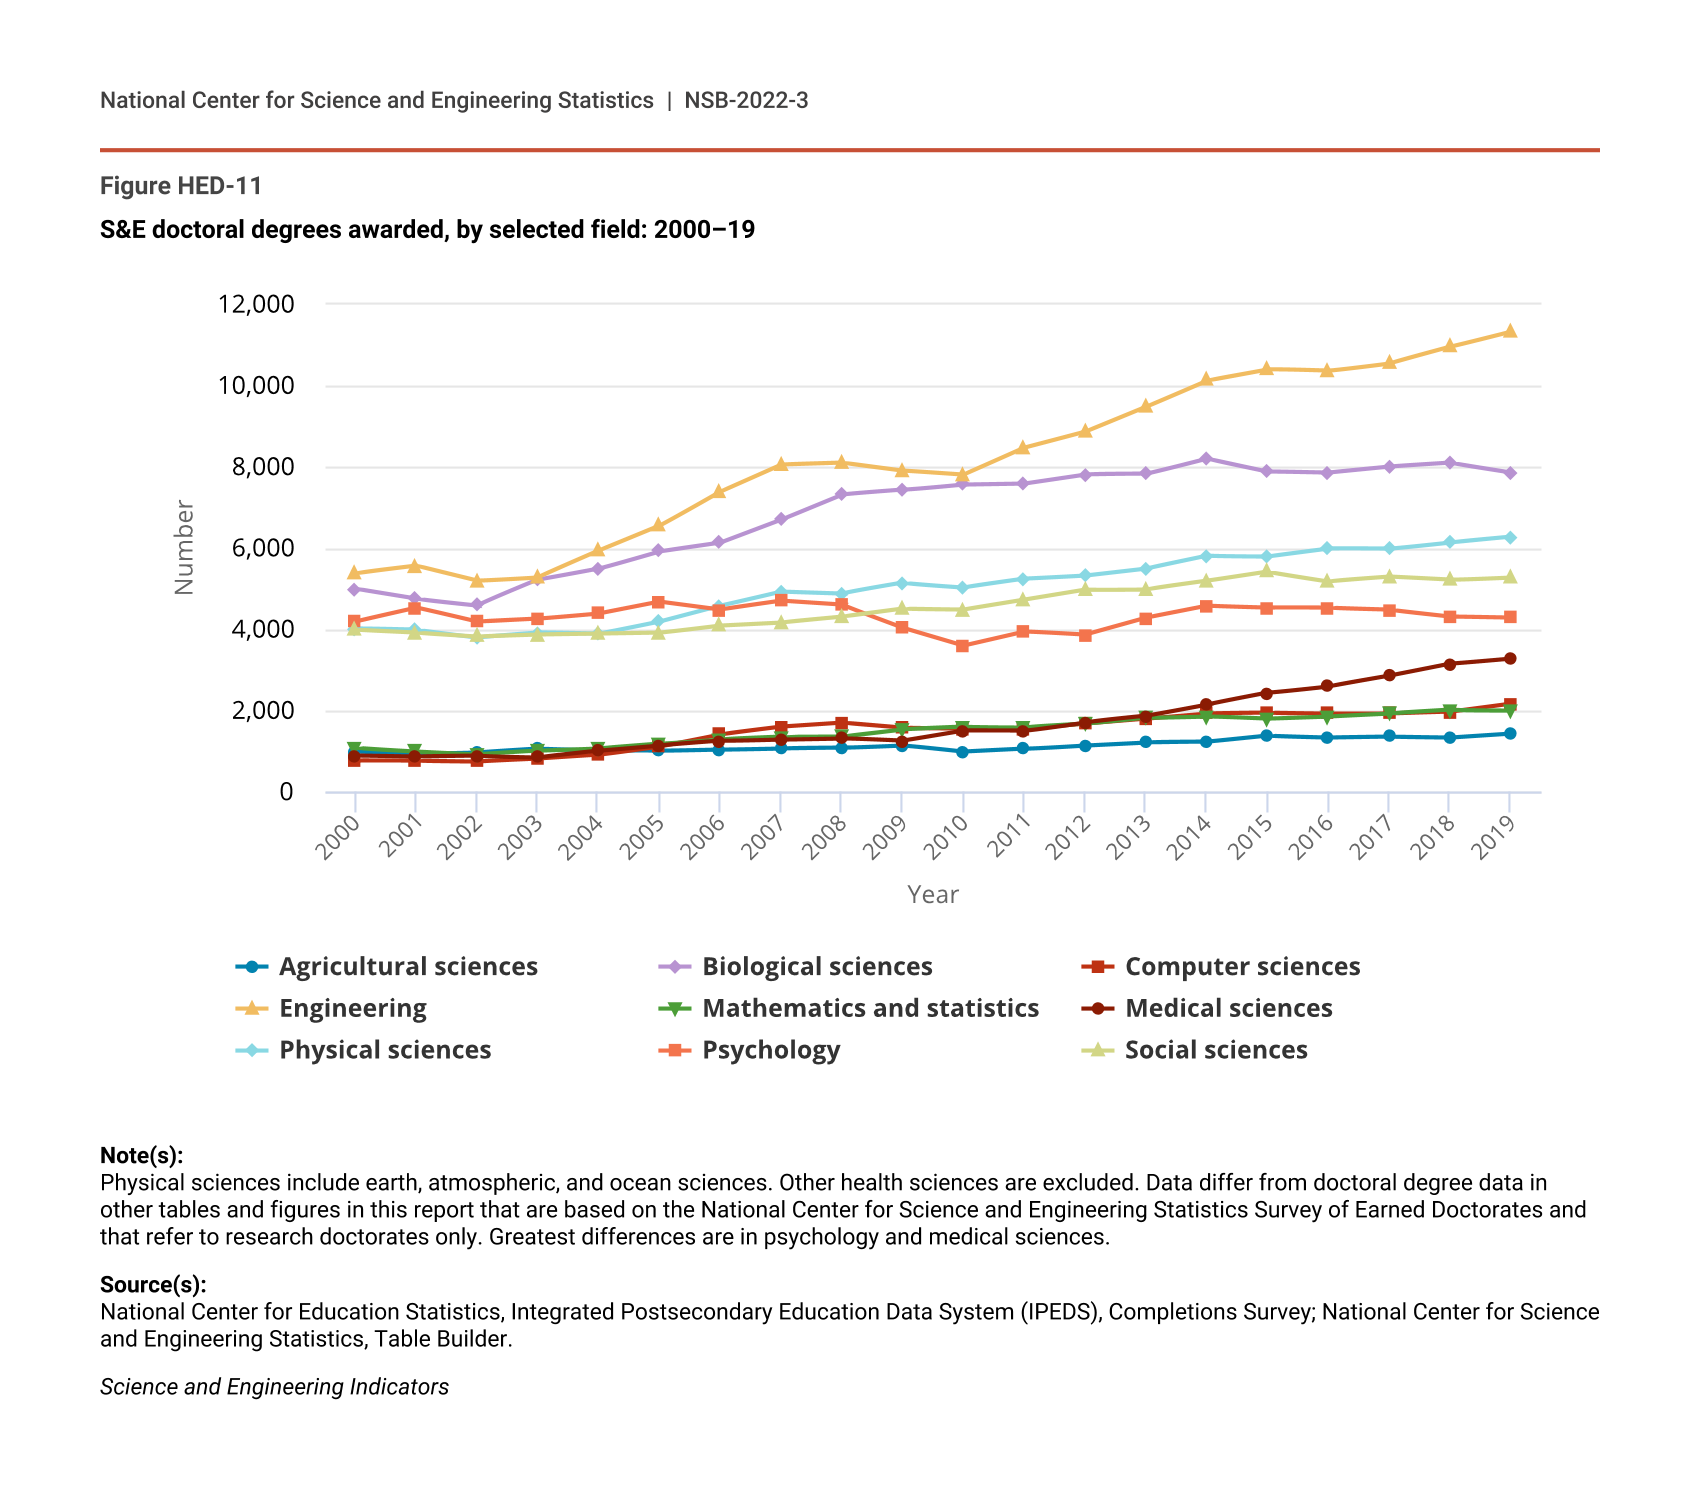
S&E fields accounted for the majority (65%) of doctorates conferred by U.S. universities in 2019. During 2000–19, the number of U.S. S&E doctorates conferred annually increased from around 28,000 to 48,000, faster than the rise in total doctorate awards (from nearly 45,000 in 2000 to 74,000 in 2019) (see NSB Indicators 2020: Table S2-10; Table SHED-7). The number of doctoral degrees awarded is projected to continue increasing at least through 2028 (Hussar and Bailey 2020). Across fields, the biggest percentage increases since 2000 occurred in engineering, computer sciences, and medical sciences (Figure HED-11). The dramatic increases in master’s degrees awarded to students on temporary visas is not seen at the doctoral level; as discussed later in the report, however, students on temporary visas earn the majority of U.S. doctorates in several fields.
S&E doctoral degrees awarded, by selected field: 2000–19
| Year | Agricultural sciences | Biological sciences | Computer sciences | Engineering | Mathematics and statistics | Medical sciences | Physical sciences | Psychology | Social sciences |
|---|---|---|---|---|---|---|---|---|---|
| 2000 | 984 | 4,992 | 777 | 5,384 | 1,081 | 893 | 4,023 | 4,200 | 3,982 |
| 2001 | 934 | 4,750 | 768 | 5,561 | 1,001 | 864 | 3,988 | 4,538 | 3,913 |
| 2002 | 969 | 4,596 | 750 | 5,196 | 927 | 882 | 3,809 | 4,185 | 3,822 |
| 2003 | 1,060 | 5,212 | 816 | 5,282 | 1,009 | 850 | 3,922 | 4,258 | 3,866 |
| 2004 | 1,016 | 5,491 | 910 | 5,931 | 1,065 | 1,010 | 3,885 | 4,389 | 3,886 |
| 2005 | 1,004 | 5,925 | 1,121 | 6,548 | 1,180 | 1,144 | 4,192 | 4,681 | 3,910 |
| 2006 | 1,037 | 6,138 | 1,416 | 7,402 | 1,297 | 1,252 | 4,586 | 4,484 | 4,092 |
| 2007 | 1,068 | 6,703 | 1,597 | 8,066 | 1,356 | 1,293 | 4,936 | 4,696 | 4,166 |
| 2008 | 1,080 | 7,319 | 1,696 | 8,110 | 1,362 | 1,320 | 4,888 | 4,600 | 4,304 |
| 2009 | 1,143 | 7,429 | 1,574 | 7,915 | 1,536 | 1,254 | 5,140 | 4,046 | 4,501 |
| 2010 | 982 | 7,571 | 1,561 | 7,812 | 1,594 | 1,506 | 5,039 | 3,606 | 4,484 |
| 2011 | 1,053 | 7,596 | 1,562 | 8,478 | 1,590 | 1,497 | 5,247 | 3,952 | 4,727 |
| 2012 | 1,144 | 7,817 | 1,690 | 8,873 | 1,670 | 1,716 | 5,326 | 3,867 | 4,972 |
| 2013 | 1,218 | 7,825 | 1,809 | 9,489 | 1,824 | 1,867 | 5,497 | 4,280 | 4,986 |
| 2014 | 1,228 | 8,207 | 1,935 | 10,135 | 1,864 | 2,148 | 5,808 | 4,574 | 5,188 |
| 2015 | 1,381 | 7,890 | 1,951 | 10,406 | 1,802 | 2,433 | 5,798 | 4,533 | 5,417 |
| 2016 | 1,343 | 7,858 | 1,936 | 10,358 | 1,855 | 2,597 | 5,990 | 4,526 | 5,187 |
| 2017 | 1,364 | 8,003 | 1,934 | 10,547 | 1,925 | 2,853 | 5,976 | 4,486 | 5,293 |
| 2018 | 1,345 | 8,096 | 1,974 | 10,951 | 2,013 | 3,150 | 6,137 | 4,325 | 5,216 |
| 2019 | 1,442 | 7,863 | 2,174 | 11,330 | 2,009 | 3,281 | 6,274 | 4,297 | 5,281 |
Note(s):
Physical sciences include earth, atmospheric, and ocean sciences. Other health sciences are excluded. Data differ from doctoral degree data in other tables and figures in this report that are based on the National Center for Science and Engineering Statistics Survey of Earned Doctorates and that refer to research doctorates only. Greatest differences are in psychology and medical sciences.
Source(s):
National Center for Education Statistics, Integrated Postsecondary Education Data System (IPEDS), Completions Survey; National Center for Science and Engineering Statistics, Table Builder.
Science and Engineering Indicators
Since 2000, public universities experienced large increases in doctoral degree awards and in 2019 awarded most of the U.S. doctoral degrees in S&E fields (66%) and in all fields (61%). The 131 highest research activity doctoral universities award most of the U.S. doctoral degrees across virtually all fields of study (Table SHED-1). In 2019, these institutions awarded over 48,000 total doctorates (65% of all doctorates) and nearly 36,000 S&E doctorates (74% of all S&E doctorates). Although still small, the number of S&E doctorates awarded by for-profit institutions (across all classification types) increased fivefold from 2000 to 2019, from about 400 to over 2,000 (or 5% of S&E doctorates).
Time to Doctoral Degree Completion
The time required to earn a doctoral degree has important implications for those pursuing a degree, the universities awarding the degree, and the agencies and organizations funding doctoral study. Median time to degree (as measured by time from graduate school entry to doctorate receipt) varies across fields. For 2020, in S&E broad fields, the median ranged from 6.3 years for physical sciences and earth sciences to 7.9 years in psychology and social sciences (NCSES SED 2020: Table 31). Times in non-S&E fields are longer. Median time to degree varies by demographic group (NCSES SED 2020: Table 32), but these variations largely reflect differences among broad fields of study.