 An official website of the United States government
 International S&E Higher Education
This section provides data on international students in U.S. institutions (enrollment and degrees earned) and the U.S. position in higher education within a global context. The data show a decline in overall international student enrollment in U.S. institutions in fall 2020, exacerbated by the COVID-19 pandemic. Data on degree awards, however, show that increasing numbers of foreign students continue to earn U.S. S&E degrees at most degree levels (pre-COVID-19). Foreign students on temporary visas earn a substantial proportion of U.S. doctoral degrees in S&E fields such as engineering, computer sciences, and economics. The global emphasis on building S&E capabilities is evident in international data; China and India have seen rapid increases in S&E degree production over time, compared with a more moderate rise in the United States and most European nations.
International Students in U.S. Higher Education: Enrollment
International Student Enrollment During the COVID-19 Pandemic
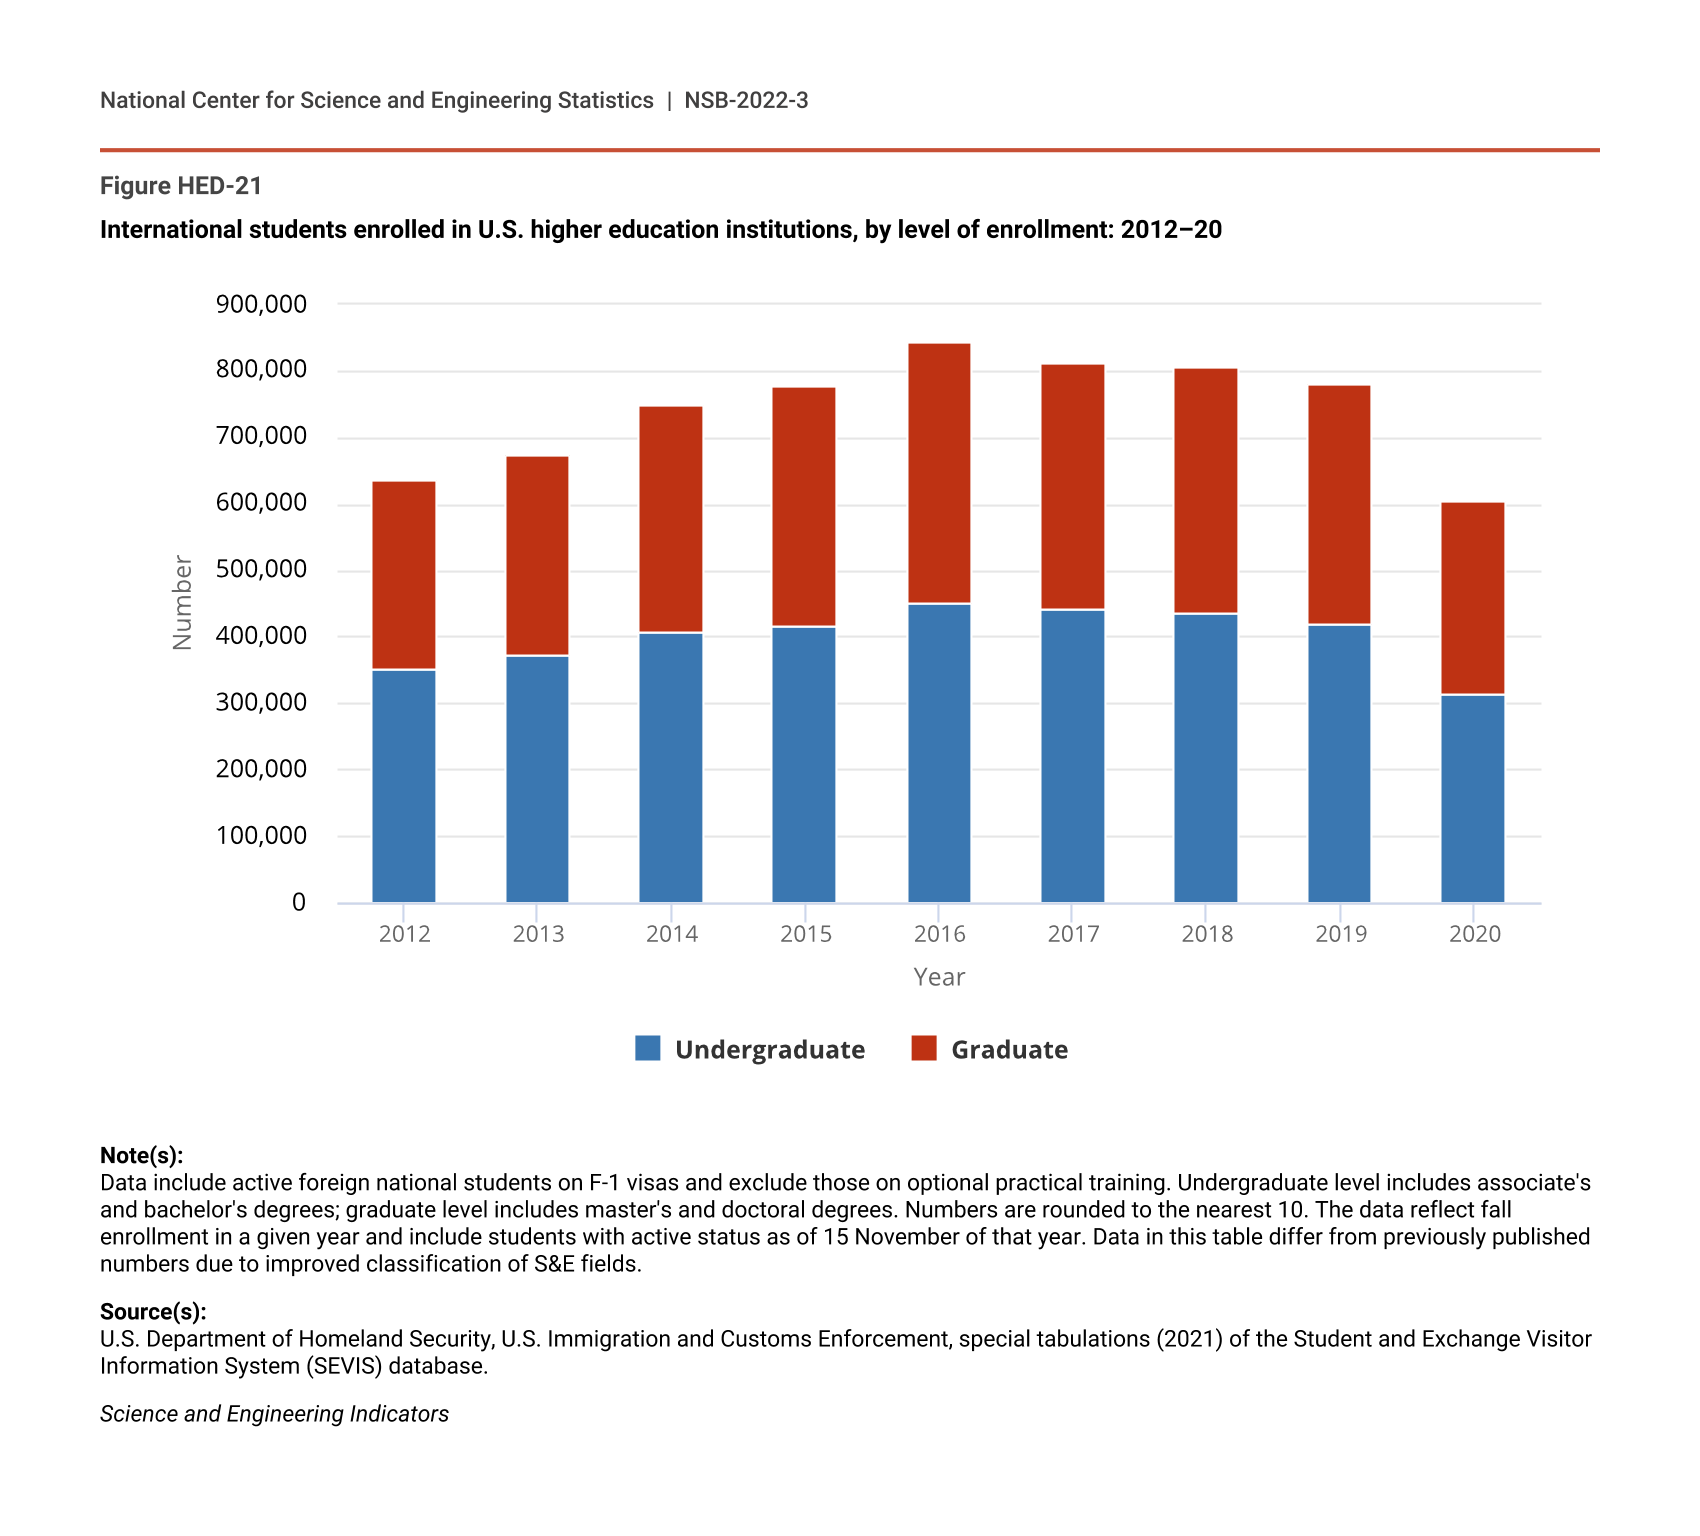
In fall 2020, about 605,000 international students enrolled in degree programs in U.S. higher education institutions (Figure HED-21; Table HED-4). This represents a decline of almost 23% (177,000 students) from 2019, much larger than the declines in the previous 3 years, and reflects impacts of COVID-19 on international student mobility. The decline was proportionately larger for undergraduates (who declined from 419,000 in 2019 to 315,000 in 2020, around 25%) than for graduate students (who declined from 363,000 to 290,000, around 20%). It was also larger for students studying non-S&E fields (from 376,000 to 279,000, around 26%) than for those studying S&E fields (from 406,000 to 326,000 in 2020, around 20%). Though not captured in the data reported here, other sources indicate that declines may have been especially large for first-time enrollments (Baer and Martel 2020; Zhou and Gao 2021).
International students enrolled in U.S. higher education institutions, by level of enrollment: 2012–20
| Year | Undergraduate | Graduate |
|---|---|---|
| 2012 | 350,550 | 284,570 |
| 2013 | 373,120 | 302,490 |
| 2014 | 407,100 | 342,480 |
| 2015 | 417,530 | 361,380 |
| 2016 | 452,180 | 390,300 |
| 2017 | 442,210 | 368,890 |
| 2018 | 435,270 | 369,150 |
| 2019 | 418,660 | 363,290 |
| 2020 | 314,560 | 290,140 |
Note(s):
Data include active foreign national students on F-1 visas and exclude those on optional practical training. Undergraduate level includes associate's and bachelor's degrees; graduate level includes master's and doctoral degrees. Numbers are rounded to the nearest 10. The data reflect fall enrollment in a given year and include students with active status as of 15 November of that year. Data in this table differ from previously published numbers due to improved classification of S&E fields.
Source(s):
U.S. Department of Homeland Security, U.S. Immigration and Customs Enforcement, special tabulations (2021) of the Student and Exchange Visitor Information System (SEVIS) database.
Science and Engineering Indicators
International students enrolled in U.S. higher education institutions, by broad field and academic level: 2012–20
Note(s):
Data include active foreign national students on F-1 visas and exclude those on optional practical training. Undergraduate level includes associate's and bachelor's degrees; graduate level includes master's and doctoral degrees. Numbers are rounded to the nearest 10. Detail may not add to total because of rounding and the inclusion of a small number of students who could not be classified according to field of study. The data reflect fall enrollment in a given year and include students with active status as of 15 November of that year. Data in this table differ from previously published numbers due to improved classification of S&E fields.
Source(s):
U.S. Department of Homeland Security, U.S. Immigration and Customs Enforcement, special tabulations (2021) of the Student and Exchange Visitor Information System (SEVIS) database.
Science and Engineering Indicators
Despite this significant reduction in numbers, there was little change in relative international student enrollment either in terms of country of origin or field of study. At the undergraduate level, China remained the largest sender (around 35%) of S&E students. India sent around 8%, and other countries each sent 4% or less (Table SHED-9). Likewise, at the graduate level, China remains the top sender of S&E students (36%), followed by India (28%), with other countries each sending 3% or less (Table SHED-10).
Undergraduate S&E students on temporary visas still predominantly studied engineering (27% of enrolled international students), followed by computer sciences (24%) and social sciences (17%), with other fields at 10% or less. S&E graduate students on temporary visas studied engineering (35% of enrolled international students) and computer sciences (27%), with other fields at 9% or less.
Trends in S&E Graduate Degrees by Level
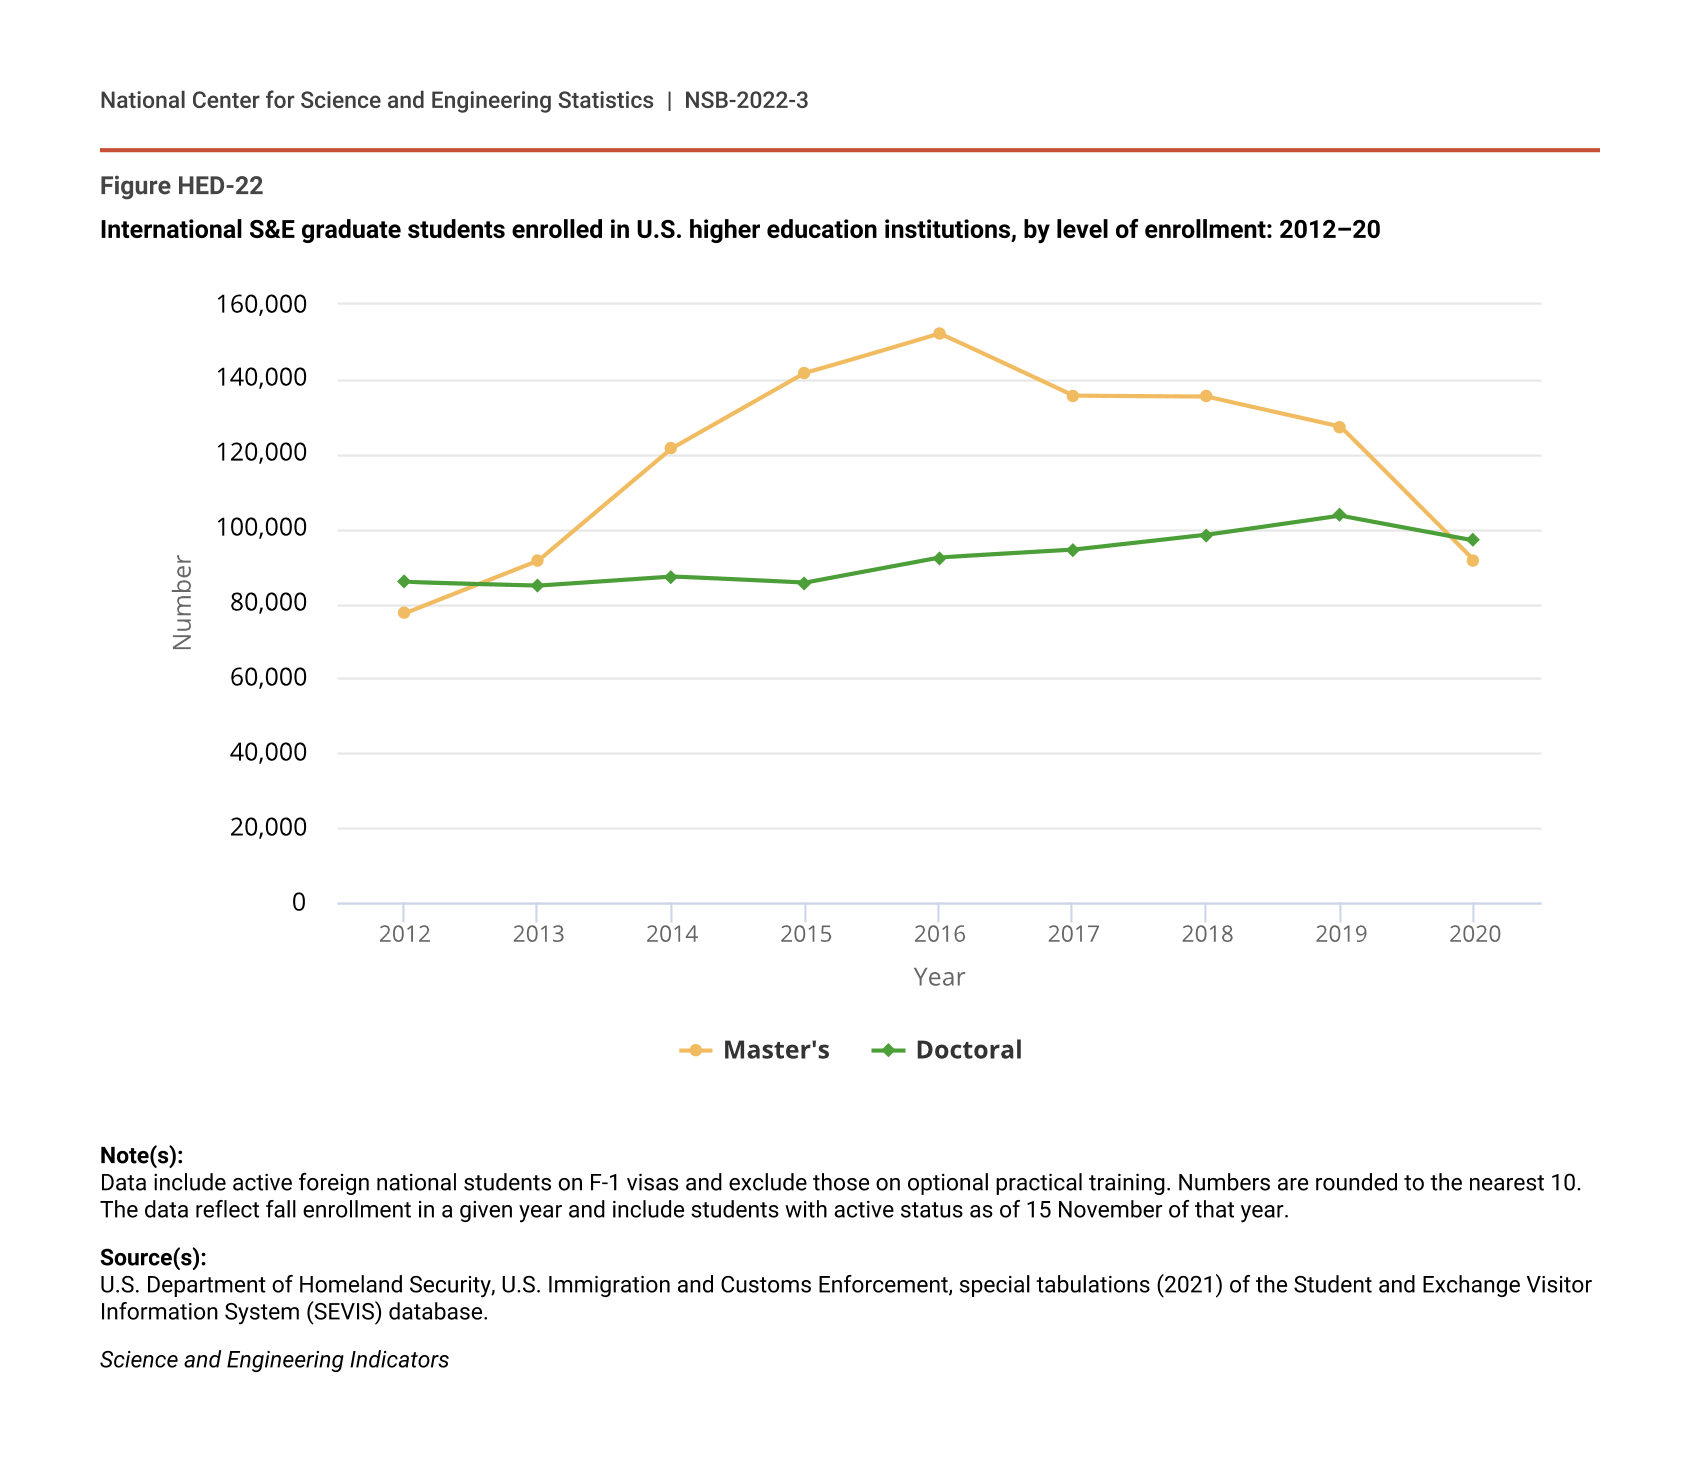
For the first time in this report, we present data on international students enrolled in S&E graduate programs at U.S. institutions of higher education disaggregated by master’s and doctoral students. International students in S&E master’s and doctoral programs show different patterns, and that includes declines due to the first year of the COVID-19 pandemic. While international S&E master’s students declined from 127,000 to 91,000 (28%) from 2019 to 2020, international doctoral students declined only from 103,000 to 97,000 (around 6.5%) (Figure HED-22).
International S&E graduate students enrolled in U.S. higher education institutions, by level of enrollment: 2012–20
| Year | Master's | Doctoral |
|---|---|---|
| 2012 | 77,230 | 85,680 |
| 2013 | 91,300 | 84,800 |
| 2014 | 121,390 | 87,240 |
| 2015 | 141,660 | 85,540 |
| 2016 | 152,310 | 92,200 |
| 2017 | 135,520 | 94,250 |
| 2018 | 135,300 | 98,300 |
| 2019 | 127,300 | 103,470 |
| 2020 | 91,360 | 96,840 |
Note(s):
Data include active foreign national students on F-1 visas and exclude those on optional practical training. Numbers are rounded to the nearest 10. The data reflect fall enrollment in a given year and include students with active status as of 15 November of that year.
Source(s):
U.S. Department of Homeland Security, U.S. Immigration and Customs Enforcement, special tabulations (2021) of the Student and Exchange Visitor Information System (SEVIS) database.
Science and Engineering Indicators
The decline in S&E master’s students from 2019 to 2020, while more dramatic, represents the continuation of a trend since 2016, when the number of these students peaked at around 152,000. Prior to 2016, numbers had climbed even more precipitously than they have fallen since. Numbers of S&E doctoral students, by contrast, have remained far more stable. According to the Council of Graduate Schools, first-time enrollment of international graduate students in the United States declined by 43% for master’s students and 26% for doctoral students (Zhou and Gao 2021).
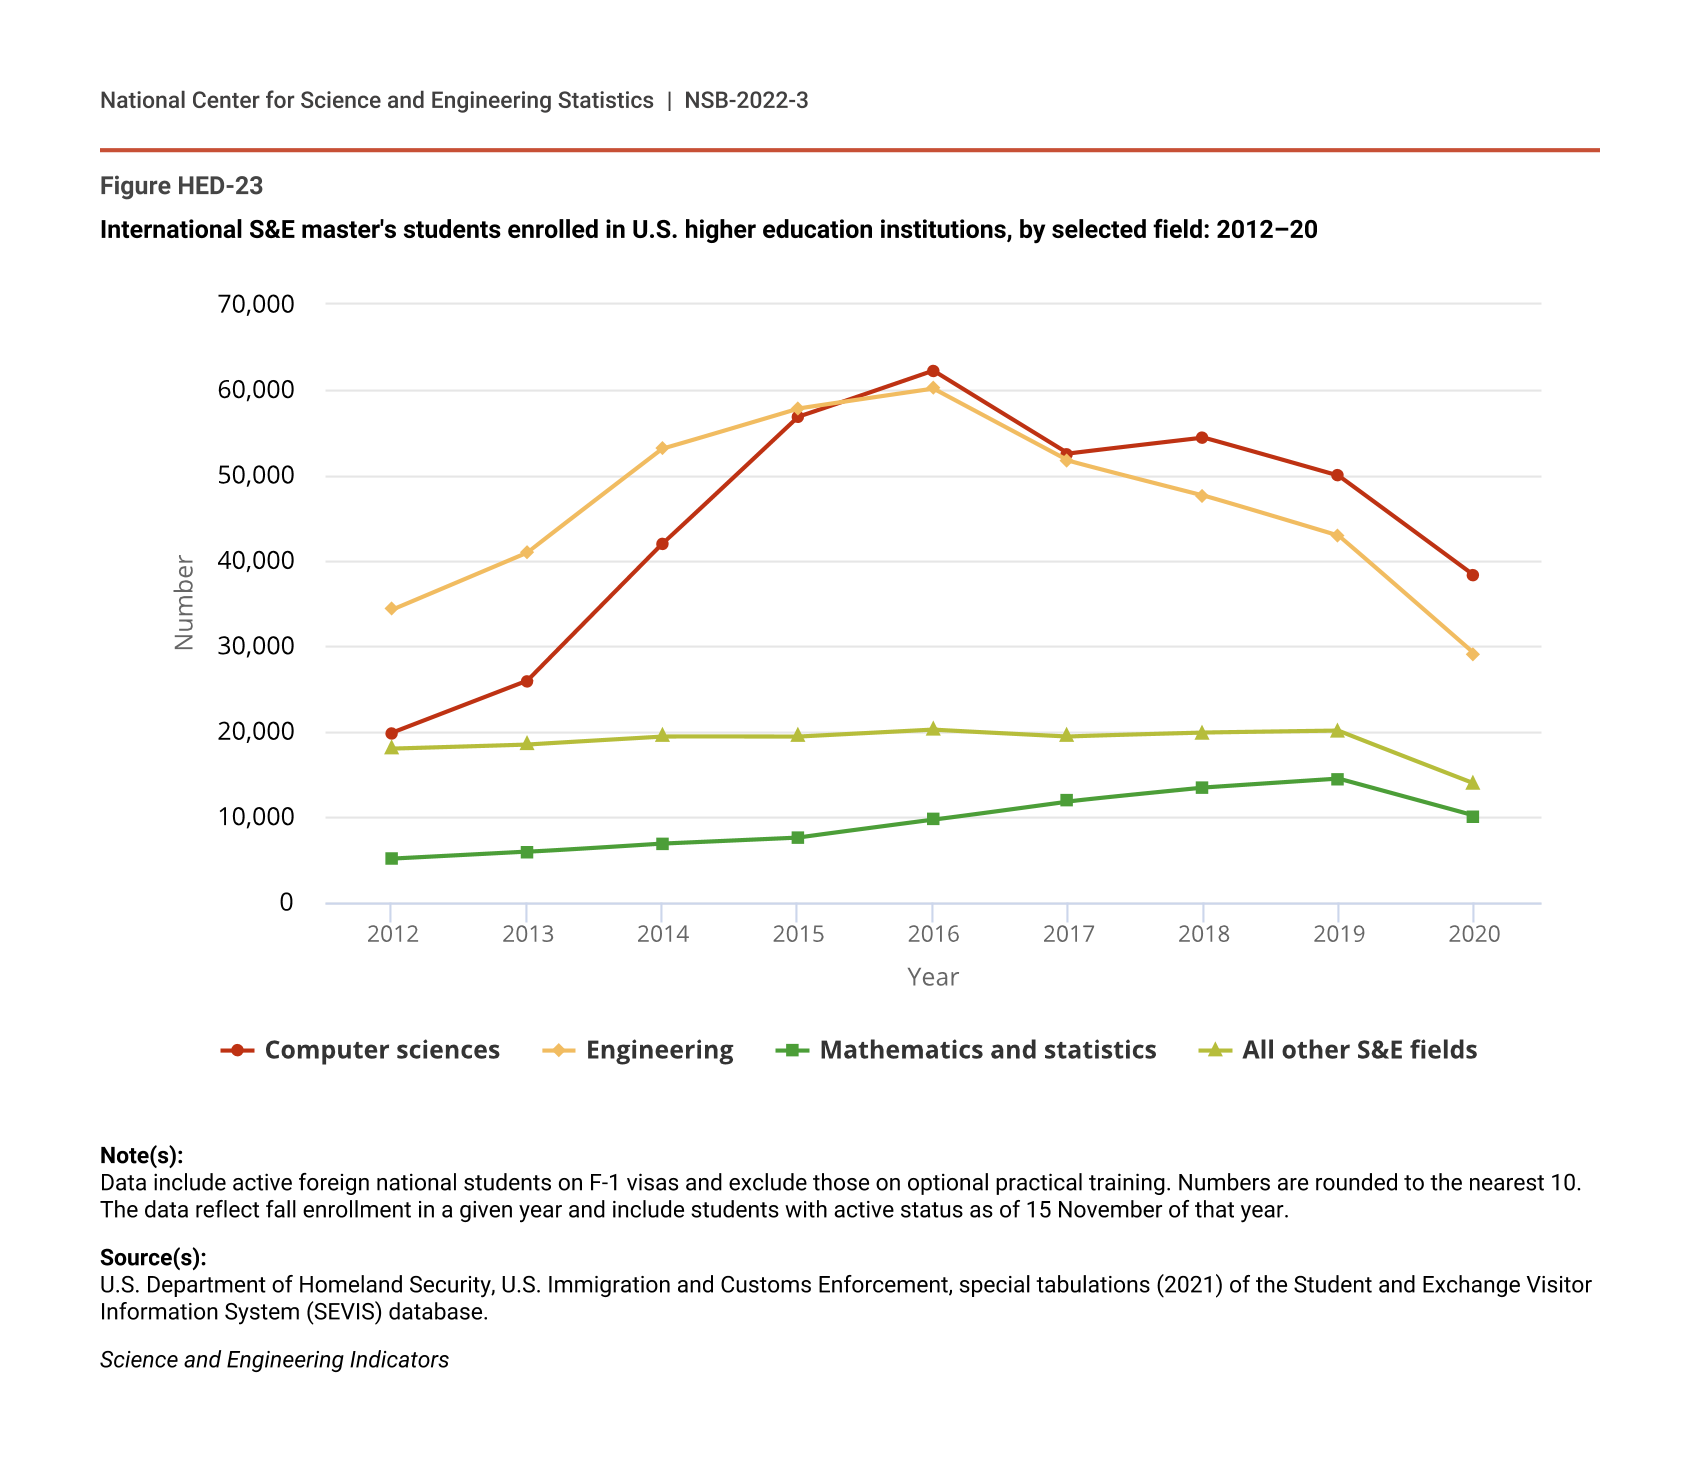
Disaggregating these trends by field reveals that most of the growth, and subsequent decline, in master’s enrollment was in engineering and computer sciences, with other fields remaining relatively stable prior to 2020 (Figure HED-23).
International S&E master's students enrolled in U.S. higher education institutions, by selected field: 2012–20
| Year | Computer sciences | Engineering | Mathematics and statistics | All other S&E fields |
|---|---|---|---|---|
| 2012 | 19,830 | 34,290 | 5,070 | 18,030 |
| 2013 | 25,920 | 40,980 | 5,900 | 18,510 |
| 2014 | 41,950 | 53,100 | 6,910 | 19,430 |
| 2015 | 56,820 | 57,820 | 7,620 | 19,400 |
| 2016 | 62,270 | 60,130 | 9,690 | 20,220 |
| 2017 | 52,560 | 51,690 | 11,840 | 19,430 |
| 2018 | 54,400 | 47,660 | 13,400 | 19,850 |
| 2019 | 49,900 | 42,890 | 14,440 | 20,070 |
| 2020 | 38,230 | 29,060 | 10,120 | 13,950 |
Note(s):
Data include active foreign national students on F-1 visas and exclude those on optional practical training. Numbers are rounded to the nearest 10. The data reflect fall enrollment in a given year and include students with active status as of 15 November of that year.
Source(s):
U.S. Department of Homeland Security, U.S. Immigration and Customs Enforcement, special tabulations (2021) of the Student and Exchange Visitor Information System (SEVIS) database.
Science and Engineering Indicators
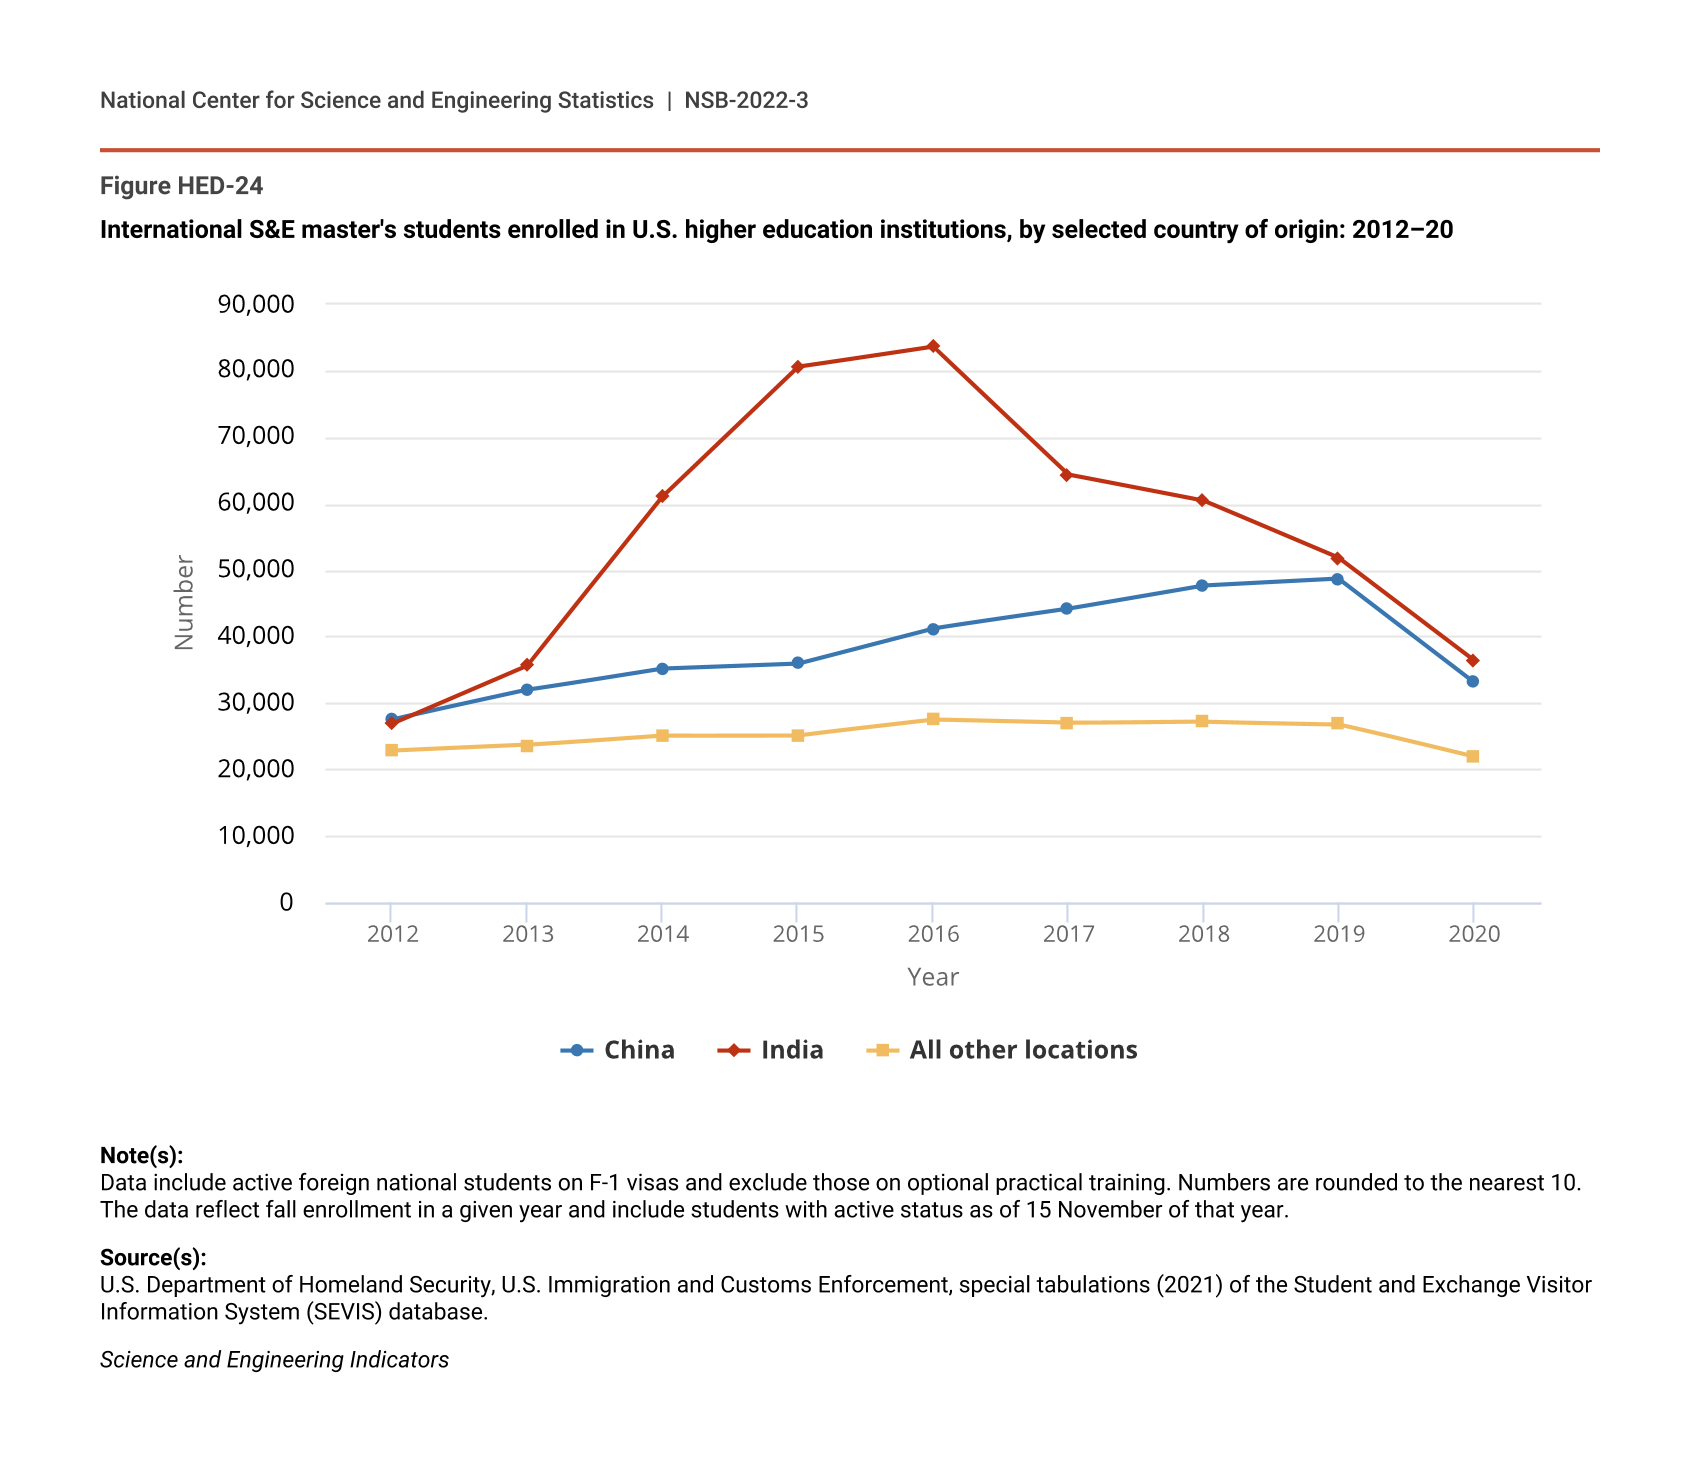
These trends may also be disaggregated by country of origin, which shows that they were driven primarily by students from India (Figure HED-24); their numbers peaked in 2016 and have declined each year since. Numbers of Chinese S&E master’s students rose more slowly but continued to rise through 2019 before dropping in 2020 during the pandemic.
International S&E master's students enrolled in U.S. higher education institutions, by selected country of origin: 2012–20
| Year | China | India | All other locations |
|---|---|---|---|
| 2012 | 27,520 | 26,930 | 22,780 |
| 2013 | 31,950 | 35,680 | 23,670 |
| 2014 | 35,200 | 61,070 | 25,120 |
| 2015 | 35,950 | 80,560 | 25,150 |
| 2016 | 41,230 | 83,610 | 27,470 |
| 2017 | 44,150 | 64,380 | 26,990 |
| 2018 | 47,640 | 60,440 | 27,210 |
| 2019 | 48,670 | 51,810 | 26,820 |
| 2020 | 33,110 | 36,380 | 21,880 |
Note(s):
Data include active foreign national students on F-1 visas and exclude those on optional practical training. Numbers are rounded to the nearest 10. The data reflect fall enrollment in a given year and include students with active status as of 15 November of that year.
Source(s):
U.S. Department of Homeland Security, U.S. Immigration and Customs Enforcement, special tabulations (2021) of the Student and Exchange Visitor Information System (SEVIS) database.
Science and Engineering Indicators
International Students in U.S. Higher Education: Degrees Earned
S&E Bachelor’s Degrees
Students in the United States on temporary visas have consistently earned a small share (around 4%–7%) of S&E bachelor’s degrees, although their total number more than doubled from 21,000 in 2011 to nearly 50,000 in 2019 (Table SHED-5). In 2019, temporary visa holders earned the largest shares of bachelor’s degrees awarded in economics (19%), mathematics and statistics (19%), engineering (11%), and physics (10%). S&E fields accounted for nearly half (49%) of the bachelor’s degrees earned by students on temporary visas.
S&E Graduate Degrees
Students on temporary visas are earning increasing shares of U.S. S&E master’s degrees—36% in 2019 compared with 26% in 2011—as their total numbers increased from about 39,000 to nearly 75,000 during this period (Table SHED-6). During this interval, the biggest increases were in engineering and computer sciences, though these trends have stabilized over the past 3 years. Similar to bachelor’s degrees, a considerable proportion of the master’s degrees earned by students on temporary visas are in S&E fields (54% in 2019, up from 46% in 2011).
Trends at the doctoral level have remained stable for a longer time (Table SHED-7). In 2019, students on temporary visas earned about 35% of S&E doctorates, around the same as in 2011. This relatively stable trend is observed across all broad S&E fields: the shares of doctorates awarded to temporary visa holders did not change much since 2011. During this time, the numbers of S&E doctoral recipients on temporary visas increased from around 13,200 to around 16,600.
Temporary visa holders earn half or more of U.S. doctoral degrees in certain S&E fields. In 2019, temporary visa holders earned 62% of doctorates in economics. They also earned more than half of doctorates in computer sciences (59%), engineering (58%), and mathematics and statistics (51%). For postgraduation information on U.S.-trained S&E doctorate recipients on temporary visas at the time of graduation, see the report “The STEM Labor Force of Today: Scientists, Engineers, and Skilled Technical Workers” section Stay Rates of Noncitizen U.S.-Trained S&E Doctorates.
Countries of Origin for Doctorate Recipients
Top Countries and Fields
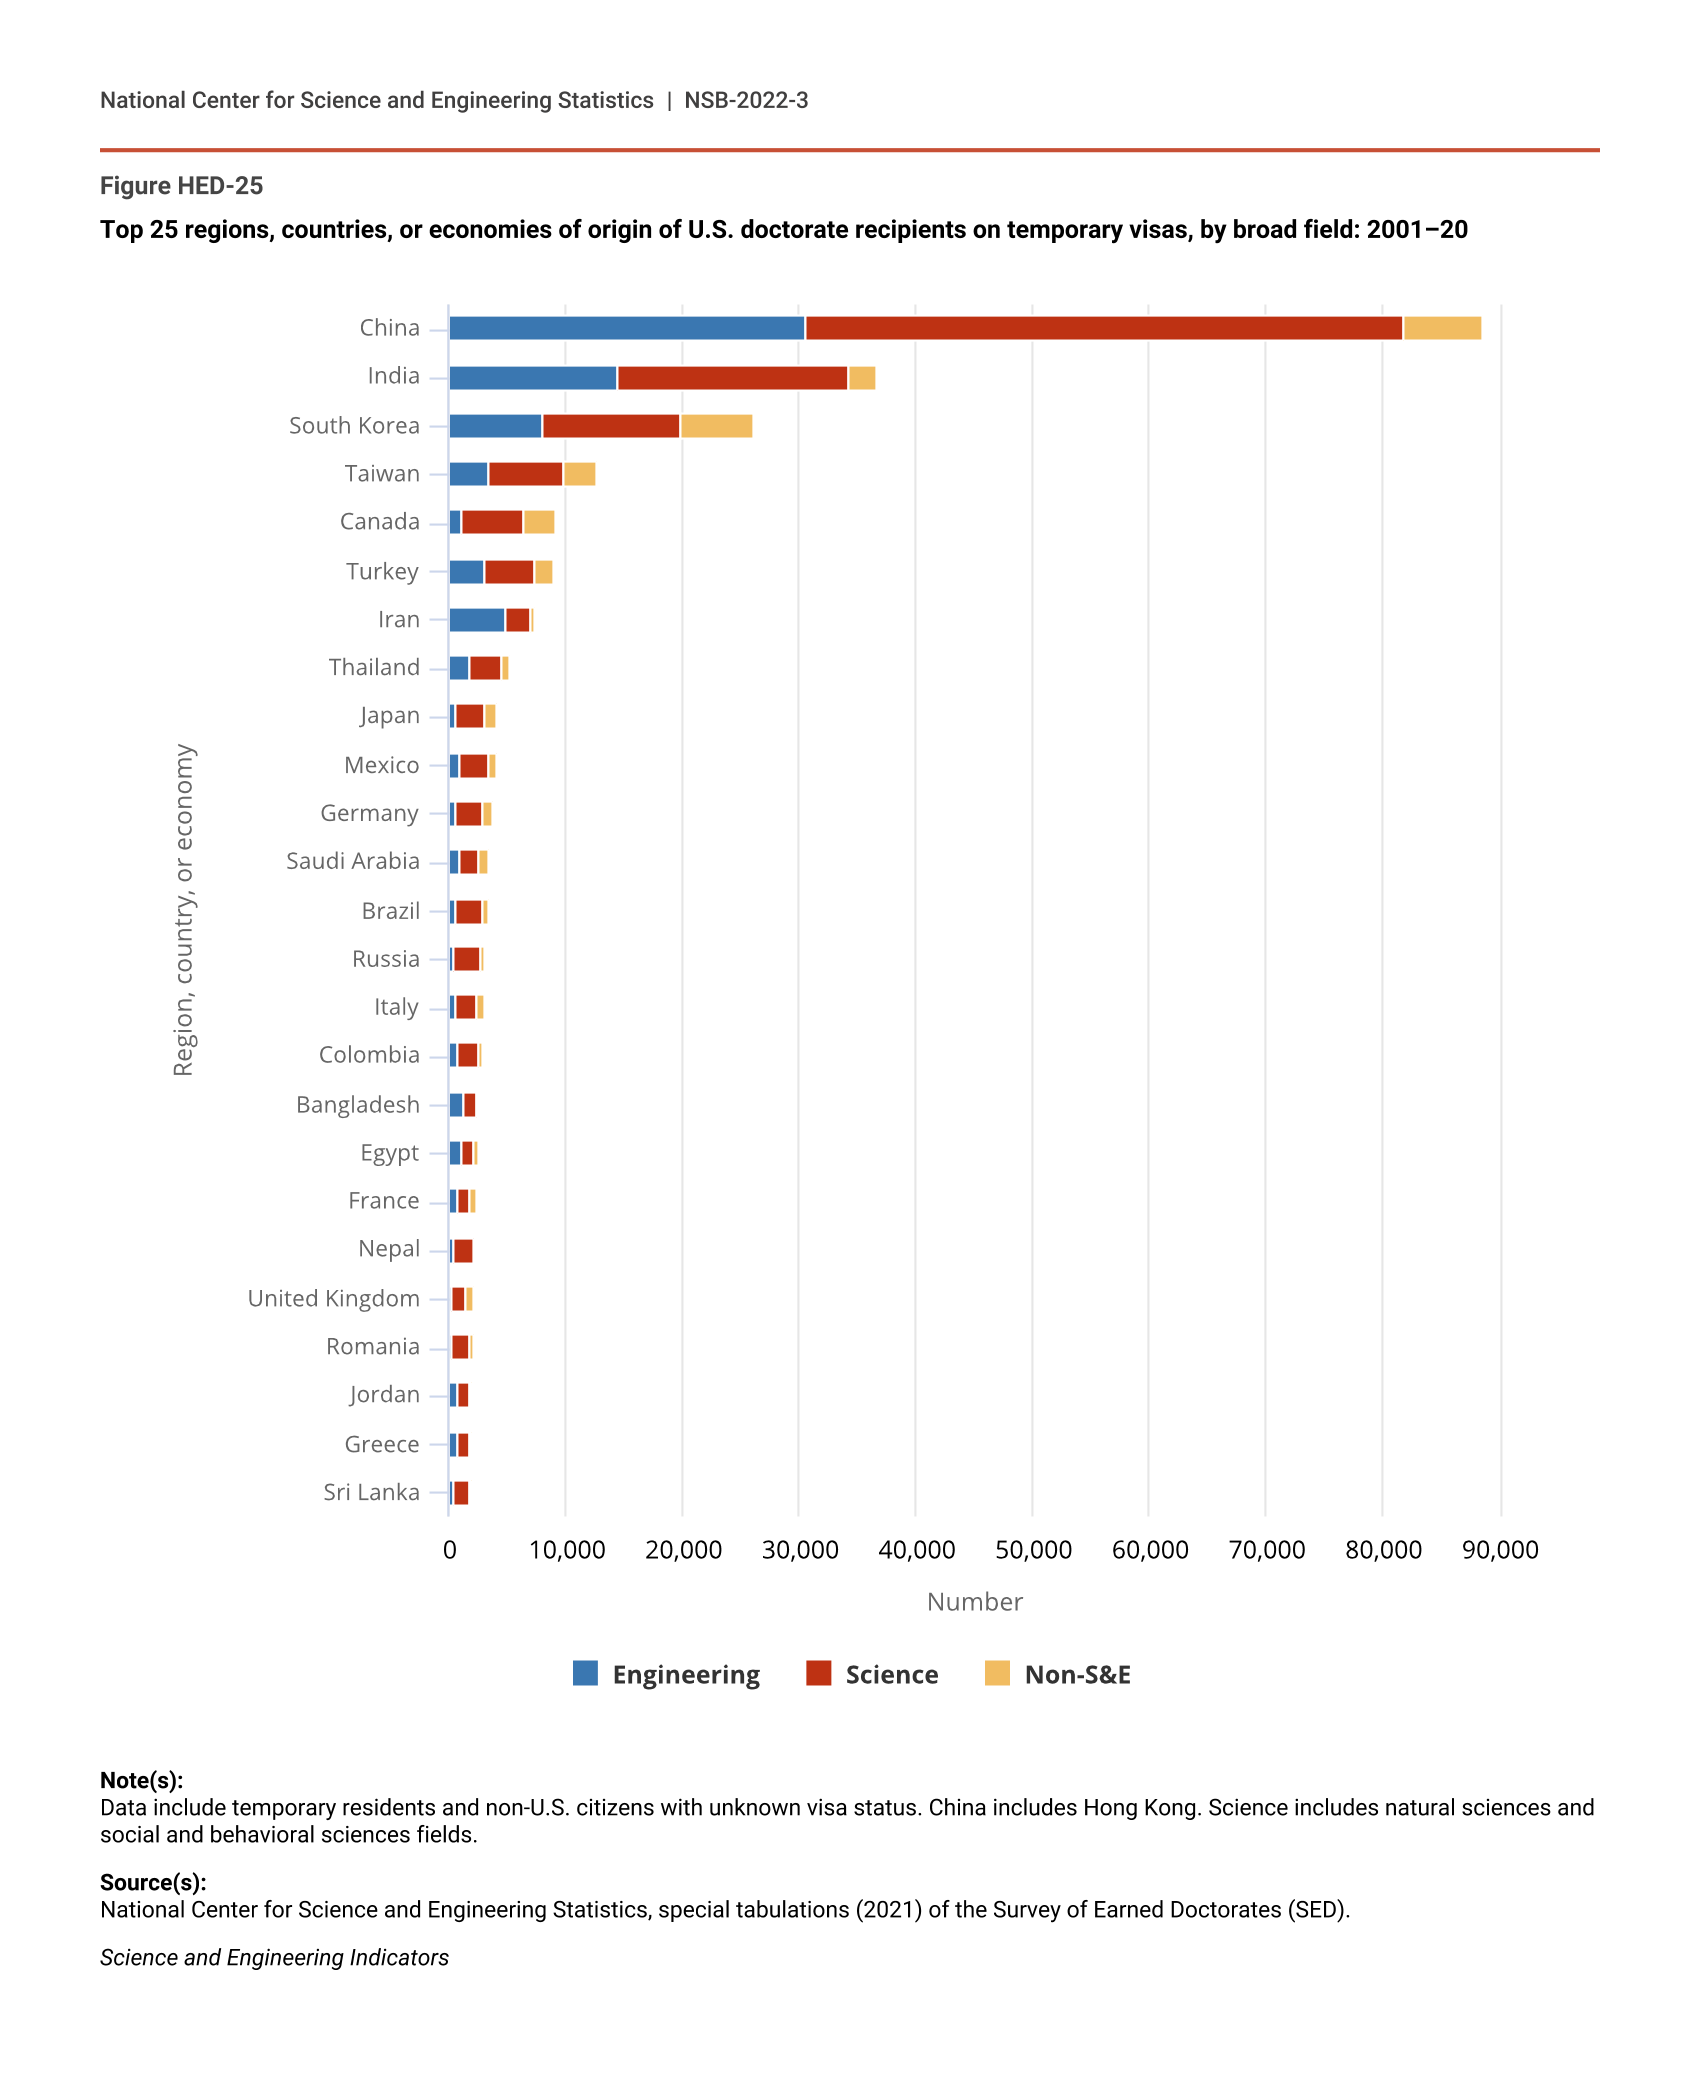
Since 2000, U.S. universities have awarded over 290,000 doctorates to temporary visa holders, with the vast majority (nearly 250,000, or 86%) in S&E fields. Over that time, the top three countries—China, India, and South Korea—accounted for 55% (136,000) of all international recipients of S&E doctoral degrees, and the top 25 countries accounted for nearly 85% (210,000) (see Figure HED-25; Table HED-5). For 22 of the top 25 countries, 75% or more of the students who earn doctorates in the United States did so in S&E fields. For 15 of the top 25 countries, engineering is the most popular S&E field; for example, engineering doctorates constitute 35% of total doctoral degrees earned by Chinese students at U.S. universities. For India, the figure is nearly 40%, and for Iran, it is 66%.
Top 25 regions, countries, or economies of origin of U.S. doctorate recipients on temporary visas, by broad field: 2001–20
| Region, country, or economy | Engineering | Science | Non-S&E |
|---|---|---|---|
| China | 30,599 | 51,204 | 6,709 |
| India | 14,397 | 19,844 | 2,324 |
| South Korea | 8,023 | 11,758 | 6,213 |
| Taiwan | 3,418 | 6,347 | 2,883 |
| Canada | 1,060 | 5,339 | 2,628 |
| Turkey | 3,104 | 4,268 | 1,515 |
| Iran | 4,834 | 2,115 | 389 |
| Thailand | 1,701 | 2,793 | 672 |
| Japan | 479 | 2,621 | 1,021 |
| Mexico | 912 | 2,539 | 638 |
| Germany | 494 | 2,411 | 854 |
| Saudi Arabia | 872 | 1,652 | 902 |
| Brazil | 534 | 2,347 | 534 |
| Russia | 395 | 2,257 | 382 |
| Italy | 596 | 1,675 | 702 |
| Colombia | 783 | 1,688 | 473 |
| Bangladesh | 1,189 | 1,201 | 163 |
| Egypt | 1,116 | 1,096 | 225 |
| France | 635 | 1,232 | 459 |
| Nepal | 388 | 1,677 | 123 |
| United Kingdom | 147 | 1,312 | 638 |
| Romania | 243 | 1,537 | 283 |
| Jordan | 747 | 968 | 235 |
| Greece | 643 | 1,062 | 219 |
| Sri Lanka | 286 | 1,559 | 61 |
Note(s):
Data include temporary residents and non-U.S. citizens with unknown visa status. China includes Hong Kong. Science includes natural sciences and social and behavioral sciences fields.
Source(s):
National Center for Science and Engineering Statistics, special tabulations (2021) of the Survey of Earned Doctorates (SED).
Science and Engineering Indicators
Top 25 countries of origin of U.S. doctorate recipients on temporary visas, by broad doctoral field: 2001–20
s = suppressed for reasons of confidentiality and/or reliability.
a Excludes cases with unknown country of origin.
b China includes Hong Kong.
Note(s):
Data include temporary residents and non-U.S. citizens with unknown visa status. Rank is based on total number of doctorates.
Source(s):
National Center for Science and Engineering Statistics, special tabulations (2021) of the 2020 Survey of Earned Doctorates (SED).
Science and Engineering Indicators
Although students from South Korea earned less than a third of the number of doctorates earned by students from China from 2000 to 2019, they earned almost the same number of non-S&E doctorates (about 6,200 vs. 6,700).
Canada and Mexico are among the top 10 countries sending students who earn doctorates in the United States. For Canadian students earning doctorates in the United States, the most popular S&E fields are biological sciences and social sciences; for Mexican students, the most popular fields are engineering and social sciences.
Although 8 of the top 25 countries are European, the top 10 is dominated by countries in Asia. More than 30% of students from the United Kingdom earned doctorates in non-S&E fields. This is the highest percentage of any of the top 25 countries.
Trends
From 2000 to 2008, the number of students earning S&E doctorates at U.S. universities doubled to about 4,100 for China and nearly tripled to 2,200 for India. Since 2008, patterns for these two countries have diverged. Numbers of Chinese doctorate recipients have increased to more than 5,700 in 2019. Numbers of Indian doctorate recipients have stayed relatively flat, with a slight decline over the last several years to about 1,900. South Korea saw an increase from about 700 students earning S&E doctorates in the United States in 2000 to about 1,150 in 2008. Since then, numbers have slowly declined to about 800 in 2019. One other notable trend is an increase in the number of doctorate recipients from Iran, rising steadily from about 150 in 2010 to 960 in 2020 (see NCSES SED 2020: Table 26 and, for older trend data, NCSES SED 2010: Table 25 and Table 26).
U.S. Position in Global S&E Higher Education
Educational Attainment
Overall Attainment Levels
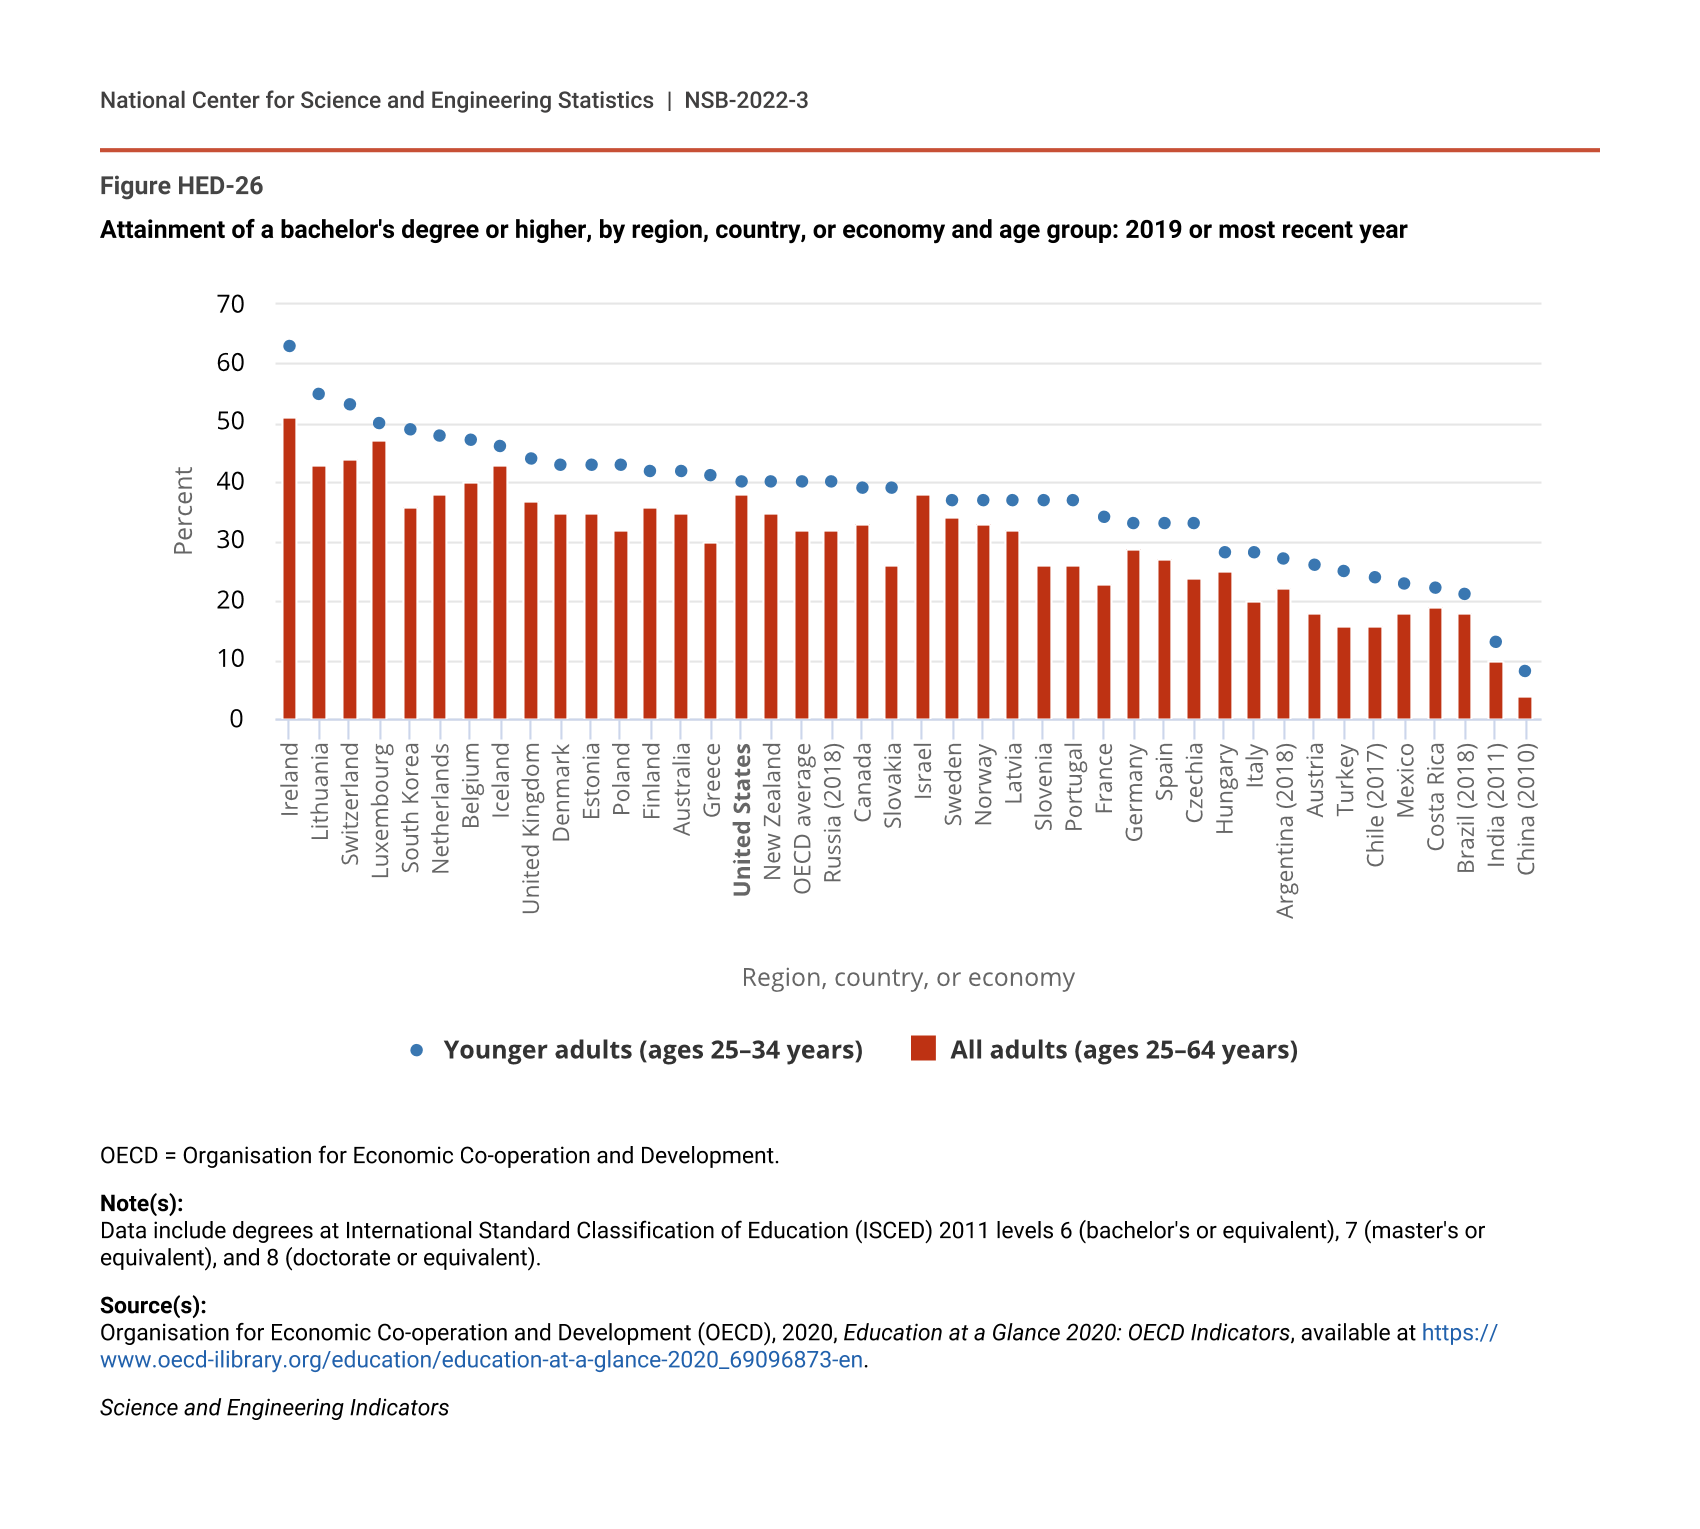
Educational attainment, measured as the proportion of a population that has reached a specific level of education, is often used as a proxy for human capital and the skill levels associated with that level (OECD 2020). Although the United States continues to have a relatively high percentage (38%) of the population ages 25–64 with a bachelor’s or higher degree, many countries have now surpassed the United States in the percentage of the younger population (ages 25–34, 40%) with these levels of education (Figure HED-26). Of 25- to 34-year-olds in the United States, 28% hold a bachelor’s degree as their highest degree, which is higher than the Organisation of Economic Co-operation and Development (OECD) average of 24%. However, only 12% attain education higher than a bachelor’s degree, which is lower than the OECD average of 15% (OECD 2020). Moreover, the increase in attainment among younger people relative to older people visible in other OECD economies is not visible in the United States.
Attainment of a bachelor's degree or higher, by region, country, or economy and age group: 2019 or most recent year
| Region, country, or economy | Younger adults (ages 25–34 years) | All adults (ages 25–64 years) |
|---|---|---|
| Ireland | 63 | 51 |
| Lithuania | 55 | 43 |
| Switzerland | 53 | 44 |
| Luxembourg | 50 | 47 |
| South Korea | 49 | 36 |
| Netherlands | 48 | 38 |
| Belgium | 47 | 40 |
| Iceland | 46 | 43 |
| United Kingdom | 44 | 37 |
| Denmark | 43 | 35 |
| Estonia | 43 | 35 |
| Poland | 43 | 32 |
| Finland | 42 | 36 |
| Australia | 42 | 35 |
| Greece | 41 | 30 |
| United States | 40 | 38 |
| New Zealand | 40 | 35 |
| OECD average | 40 | 32 |
| Russia (2018) | 40 | 32 |
| Canada | 39 | 33 |
| Slovakia | 39 | 26 |
| Israel | 37 | 38 |
| Sweden | 37 | 34 |
| Norway | 37 | 33 |
| Latvia | 37 | 32 |
| Slovenia | 37 | 26 |
| Portugal | 37 | 26 |
| France | 34 | 23 |
| Germany | 33 | 29 |
| Spain | 33 | 27 |
| Czechia | 33 | 24 |
| Hungary | 28 | 25 |
| Italy | 28 | 20 |
| Argentina (2018) | 27 | 22 |
| Austria | 26 | 18 |
| Turkey | 25 | 16 |
| Chile (2017) | 24 | 16 |
| Mexico | 23 | 18 |
| Costa Rica | 22 | 19 |
| Brazil (2018) | 21 | 18 |
| India (2011) | 13 | 10 |
| China (2010) | 8 | 4 |
OECD = Organisation for Economic Co-operation and Development.
Note(s):
Data include degrees at International Standard Classification of Education (ISCED) 2011 levels 6 (bachelor's or equivalent), 7 (master's or equivalent), and 8 (doctorate or equivalent).
Source(s):
Organisation for Economic Co-operation and Development (OECD), 2020, Education at a Glance 2020: OECD Indicators, available at https://www.oecd-ilibrary.org/education/education-at-a-glance-2020_69096873-en.
Science and Engineering Indicators
In the United States, large variation exists in the proportion of 25- to 34-year-olds with a postsecondary degree (in international comparisons, this is often referred to as tertiary attainment). There are differences between demographic groups (de Brey et al. Digest of Education Statistics 2019: Table 104.20 and Table 104.60). There is also geographic variation in the United States, with tertiary attainment levels ranging from a high of 76% in the District of Columbia to a low of 32% in New Mexico (OECD 2020).
First-University Degrees in S&E Fields
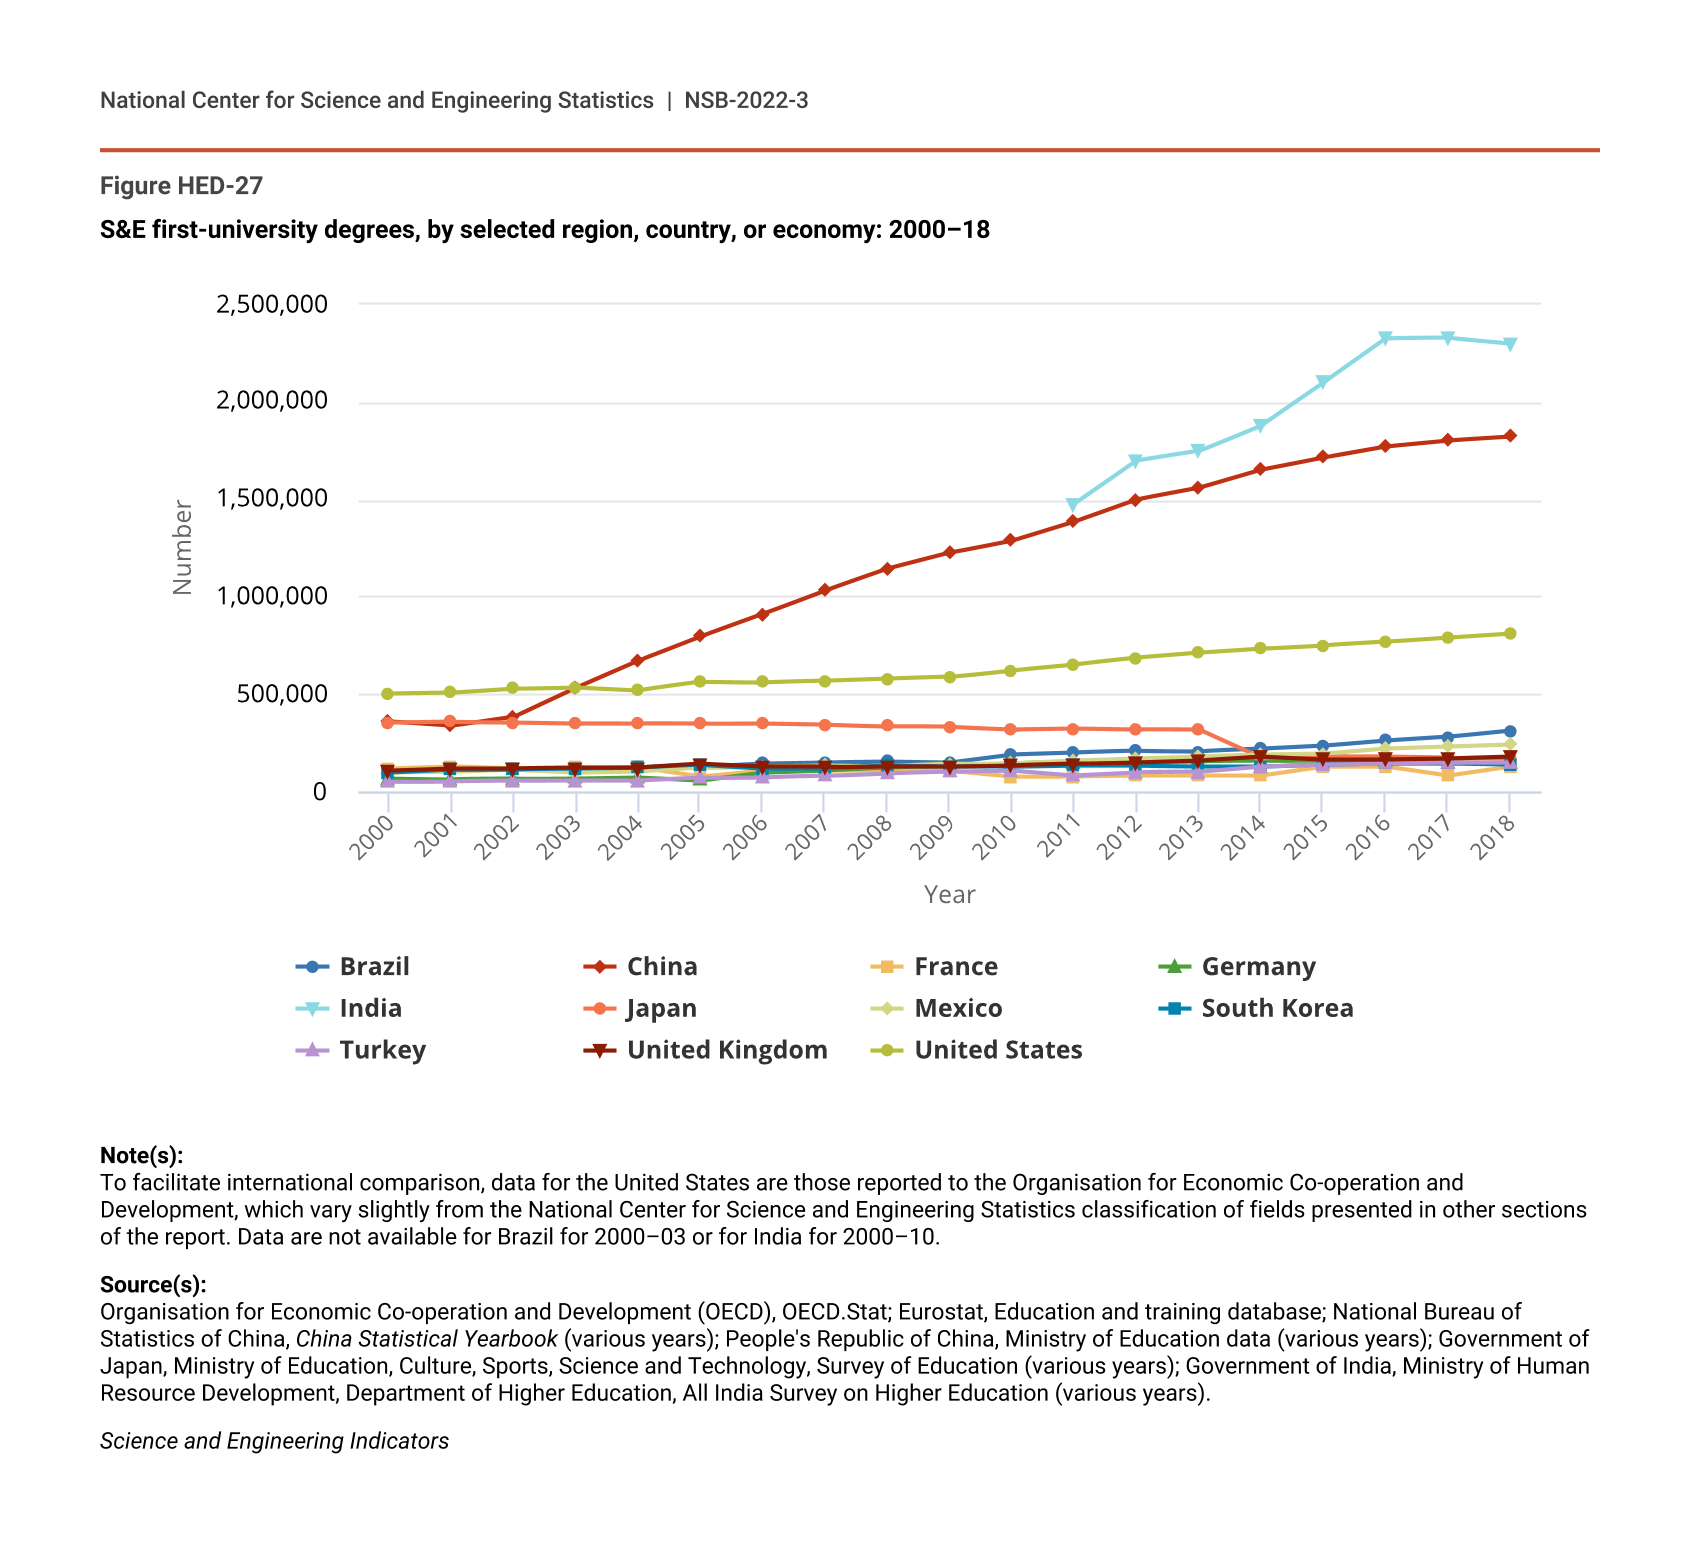
First-university degrees are defined as terminal undergraduate degree programs (see the Glossary section for a more detailed definition) and are often used in international comparisons to accommodate differences among countries in higher education systems. In general, it can be useful to think of a first-university degree as equivalent to a bachelor’s degree. According to the most recent estimates, the United States awarded about 810,000 S&E first-university degrees (Figure HED-27; Table SHED-11). India and China, much larger countries than the United States in terms of overall population, produced 2.3 million and 1.8 million S&E first-university degrees, respectively. Previous editions of Indicators have reported single years of first-university degree data for India. This edition utilizes new data from the All India Survey on Higher Education to provide trend data back to 2011. Other nations reporting large numbers of S&E first-university degrees include Brazil (315,000), Mexico (241,000), the United Kingdom (180,000), Japan (173,000), Turkey (150,000), Germany (147,000), South Korea (139,000), and France (128,000).
S&E first-university degrees, by selected region, country, or economy: 2000–18
| Year | Brazil | China | France | Germany | India | Japan | Mexico | South Korea | Turkey | United Kingdom | United States |
|---|---|---|---|---|---|---|---|---|---|---|---|
| 2000 | NA | 359,478 | 120,705 | 69,053 | NA | 353,465 | 96,474 | 99,352 | 51,875 | 108,406 | 503,467 |
| 2001 | NA | 337,352 | 130,705 | 65,380 | NA | 359,019 | 101,635 | 113,988 | 55,101 | 119,491 | 507,877 |
| 2002 | NA | 384,529 | 117,832 | 66,357 | NA | 357,282 | 113,201 | 116,317 | 56,828 | 119,843 | 529,533 |
| 2003 | NA | 533,582 | 125,304 | 69,549 | NA | 352,088 | 99,134 | 119,104 | 57,425 | 122,518 | 536,792 |
| 2004 | 126,780 | 672,463 | 125,304 | 74,979 | NA | 351,299 | 104,934 | 124,479 | 57,428 | 122,791 | 520,912 |
| 2005 | 130,656 | 796,430 | 75,721 | 59,329 | NA | 349,015 | 122,092 | 138,254 | 72,147 | 142,516 | 563,265 |
| 2006 | 145,983 | 911,846 | 107,572 | 100,212 | NA | 350,137 | 131,743 | 120,612 | 75,109 | 128,299 | 561,019 |
| 2007 | 151,414 | 1,031,911 | 107,200 | 110,774 | NA | 344,990 | 136,777 | 121,293 | 82,341 | 126,934 | 568,382 |
| 2008 | 156,265 | 1,143,338 | 106,765 | 124,465 | NA | 336,815 | 130,418 | 134,850 | 95,449 | 130,922 | 579,670 |
| 2009 | 151,666 | 1,225,642 | 106,462 | 134,781 | NA | 333,553 | 143,152 | 130,740 | 103,285 | 129,813 | 589,271 |
| 2010 | 192,616 | 1,288,999 | 77,374 | 144,724 | NA | 321,168 | 145,971 | 128,716 | 110,119 | 135,845 | 624,289 |
| 2011 | 201,636 | 1,387,374 | 78,294 | 152,872 | 1,475,992 | 325,365 | 159,873 | 135,254 | 85,489 | 143,176 | 653,341 |
| 2012 | 209,920 | 1,500,689 | 81,209 | 155,223 | 1,698,064 | 319,783 | 170,472 | 134,600 | 99,812 | 150,787 | 687,221 |
| 2013 | 208,304 | 1,559,840 | 80,800 | 157,719 | 1,747,614 | 316,730 | 180,755 | 130,533 | 101,214 | 160,363 | 712,383 |
| 2014 | 219,525 | 1,653,565 | 80,885 | 158,833 | 1,880,149 | 173,283 | 189,782 | 130,648 | 128,672 | 180,340 | 733,698 |
| 2015 | 235,267 | 1,716,413 | 127,138 | 161,118 | 2,099,657 | 180,888 | 194,886 | 141,363 | 139,684 | 165,792 | 751,195 |
| 2016 | 262,301 | 1,772,830 | 129,028 | 155,533 | 2,325,221 | 178,891 | 221,456 | 146,438 | 146,128 | 165,792 | 768,291 |
| 2017 | 282,278 | 1,802,760 | 81,736 | 151,585 | 2,327,061 | 173,573 | 231,571 | 145,567 | 149,730 | 169,832 | 790,324 |
| 2018 | 314,863 | 1,821,950 | 128,197 | 146,831 | 2,298,809 | 172,899 | 241,291 | 139,111 | 149,986 | 179,823 | 811,195 |
Note(s):
To facilitate international comparison, data for the United States are those reported to the Organisation for Economic Co-operation and Development, which vary slightly from the National Center for Science and Engineering Statistics classification of fields presented in other sections of the report. Data are not available for Brazil for 2000–03 or for India for 2000–10.
Source(s):
Organisation for Economic Co-operation and Development (OECD), OECD.Stat; Eurostat, Education and training database; National Bureau of Statistics of China, China Statistical Yearbook (various years); People's Republic of China, Ministry of Education data (various years); Government of Japan, Ministry of Education, Culture, Sports, Science and Technology, Survey of Education (various years); Government of India, Ministry of Human Resource Development, Department of Higher Education, All India Survey on Higher Education (various years).
Science and Engineering Indicators
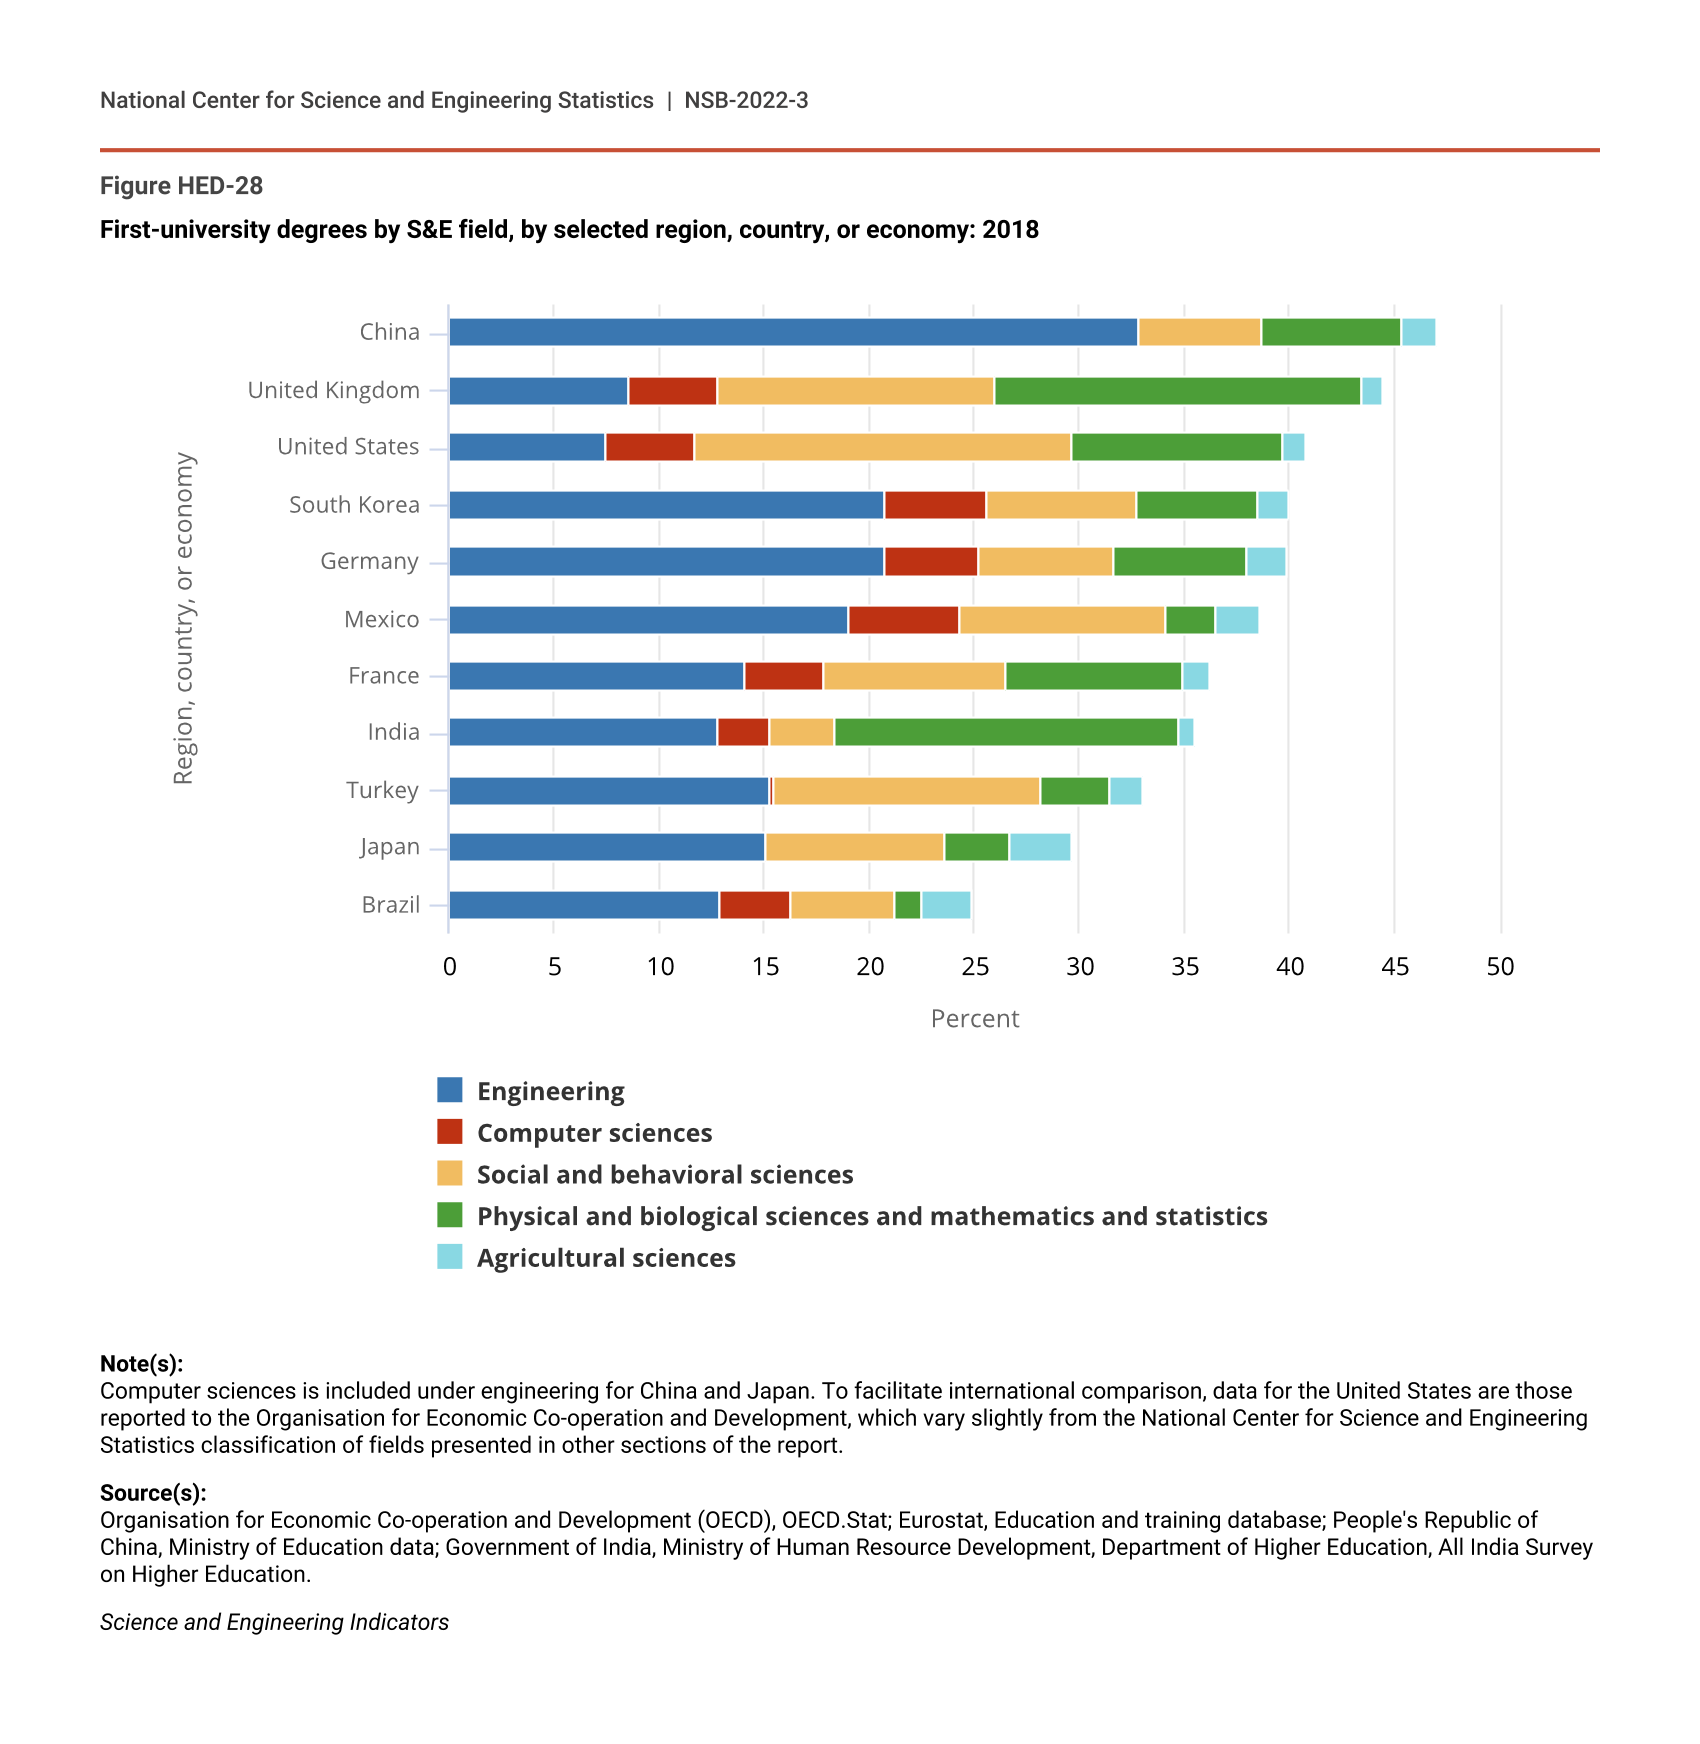
S&E first-university degrees as a proportion of all first-university degrees vary across countries (Figure HED-28). For the United States, the figure is about 41%. Of the countries and economies displayed in Figure HED-28, the United States awards the highest percentage of degrees in social sciences (18%) and the lowest percentage in engineering (7%).
First-university degrees by S&E field, by selected region, country, or economy: 2018
| Region, country, or economy | Engineering | Computer sciences | Social and behavioral sciences | Physical and biological sciences and mathematics and statistics | Agricultural sciences |
|---|---|---|---|---|---|
| China | 32.8 | NA | 5.9 | 6.6 | 1.7 |
| United Kingdom | 8.5 | 4.3 | 13.2 | 17.5 | 0.9 |
| United States | 7.4 | 4.3 | 18.0 | 10.0 | 1.1 |
| South Korea | 20.7 | 4.9 | 7.1 | 5.8 | 1.5 |
| Germany | 20.7 | 4.5 | 6.4 | 6.4 | 1.9 |
| Mexico | 19.0 | 5.3 | 9.8 | 2.4 | 2.1 |
| France | 14.1 | 3.8 | 8.6 | 8.4 | 1.3 |
| India | 12.8 | 2.5 | 3.1 | 16.3 | 0.8 |
| Turkey | 15.3 | 0.2 | 12.7 | 3.2 | 1.6 |
| Japan | 15.1 | NA | 8.5 | 3.1 | 3.0 |
| Brazil | 12.9 | 3.4 | 4.9 | 1.3 | 2.4 |
Note(s):
Computer sciences is included under engineering for China and Japan. To facilitate international comparison, data for the United States are those reported to the Organisation for Economic Co-operation and Development, which vary slightly from the National Center for Science and Engineering Statistics classification of fields presented in other sections of the report.
Source(s):
Organisation for Economic Co-operation and Development (OECD), OECD.Stat; Eurostat, Education and training database; People's Republic of China, Ministry of Education data; Government of India, Ministry of Human Resource Development, Department of Higher Education, All India Survey on Higher Education.
Science and Engineering Indicators
S&E Doctoral Degrees
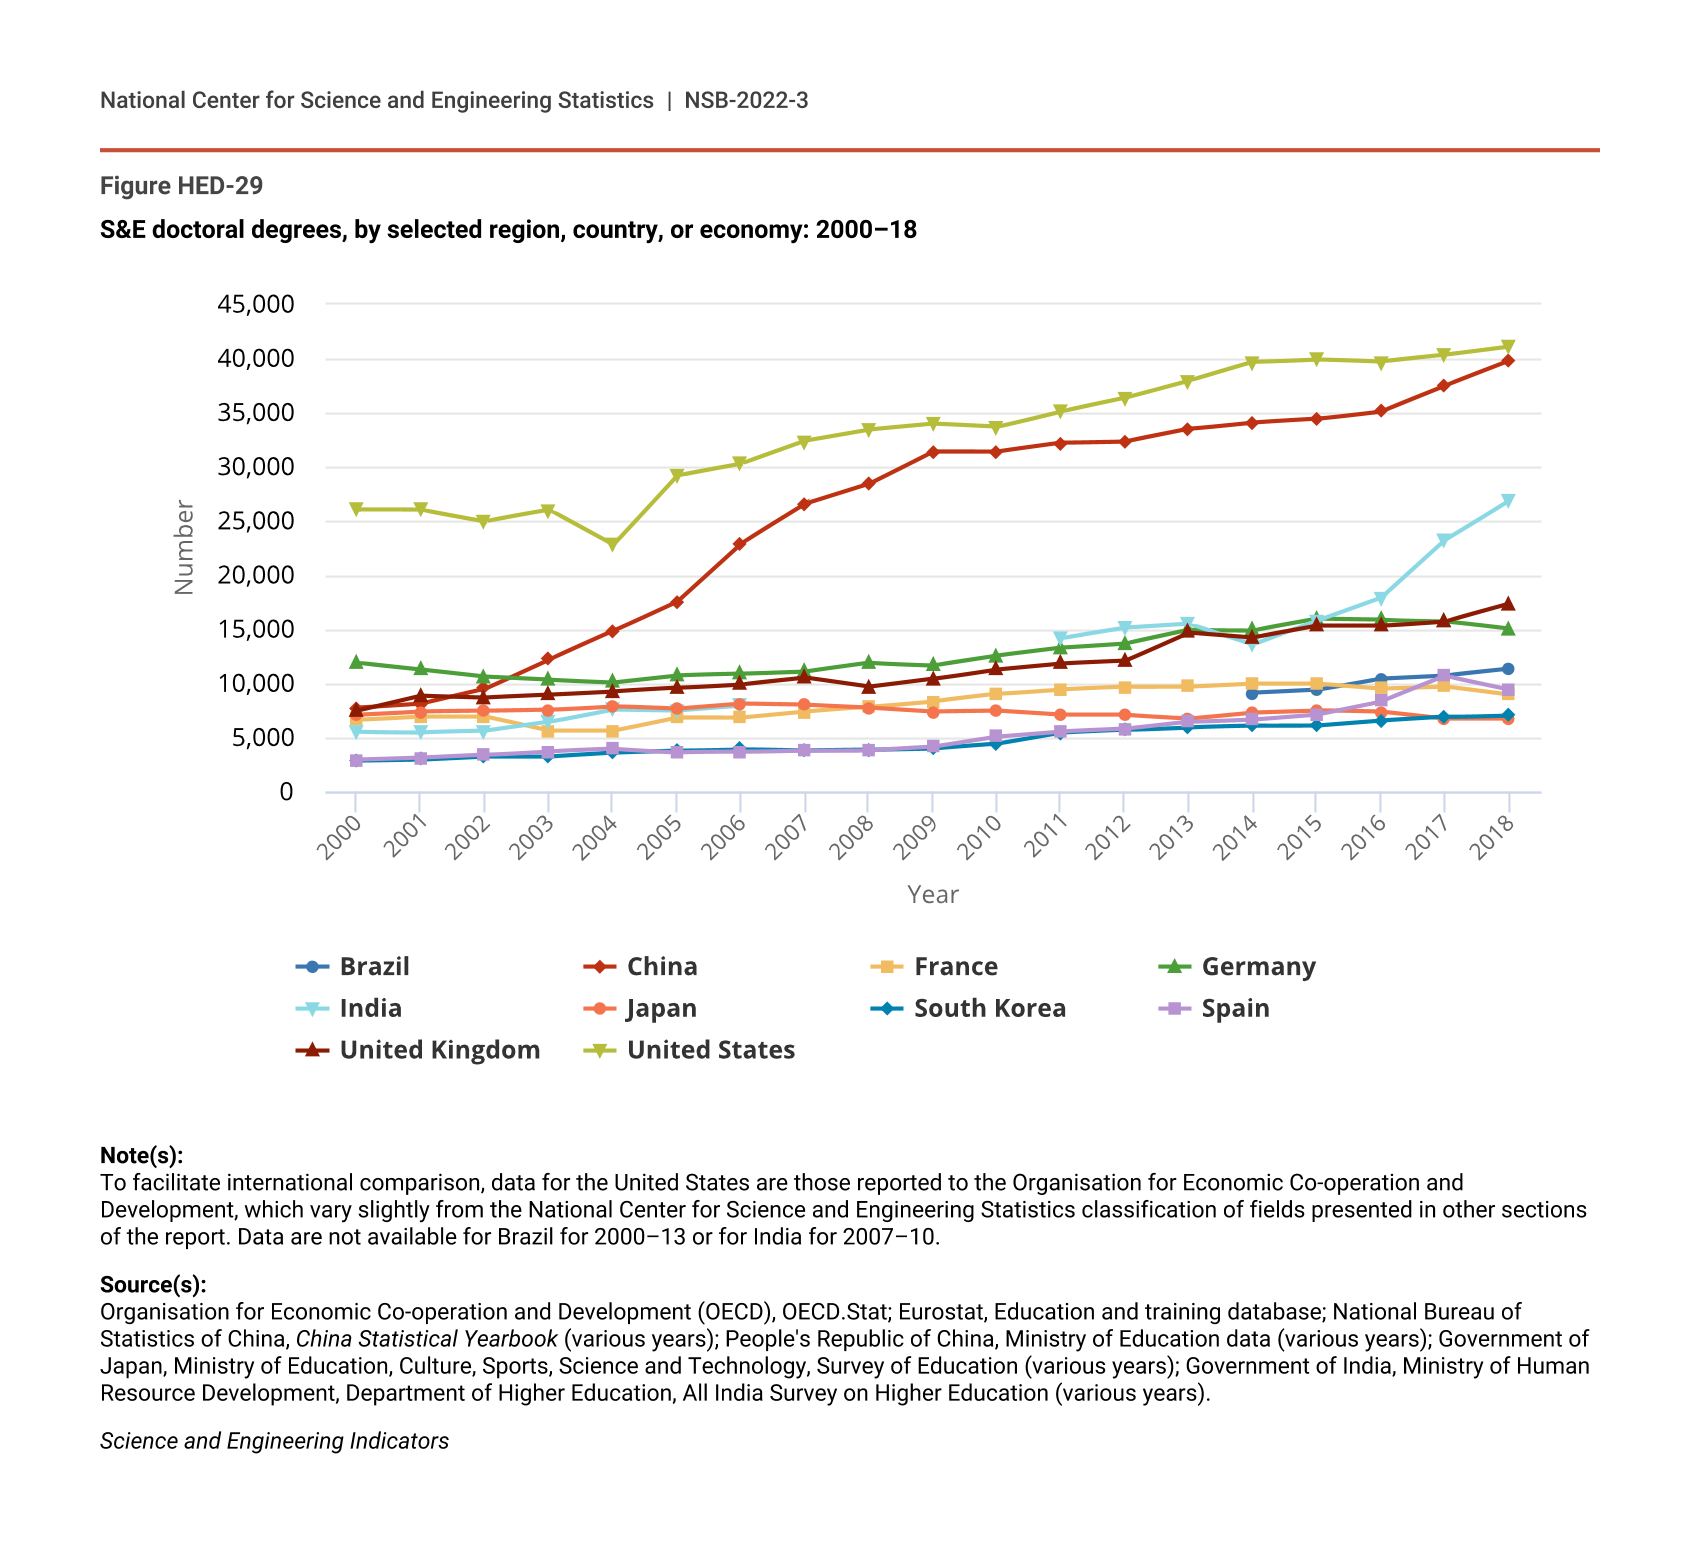
According to the most recent estimates, the United States awards the largest number of S&E doctoral degrees of any country (about 41,000), followed by China (about 40,000), India (27,000), the United Kingdom (17,000), Germany (15,000), Brazil (11,000), France and Spain (about 9,000 each), and Japan (7,000) (Figure HED-29; Table SHED-12).
S&E doctoral degrees, by selected region, country, or economy: 2000–18
| Year | Brazil | China | France | Germany | India | Japan | South Korea | Spain | United Kingdom | United States |
|---|---|---|---|---|---|---|---|---|---|---|
| 2000 | NA | 7,766 | 6,640 | 11,888 | 5,541 | 7,089 | 2,914 | 2,937 | 7,481 | 26,086 |
| 2001 | NA | 8,153 | 6,957 | 11,271 | 5,504 | 7,401 | 3,013 | 3,124 | 8,878 | 26,060 |
| 2002 | NA | 9,523 | 6,957 | 10,618 | 5,637 | 7,461 | 3,294 | 3,394 | 8,722 | 24,992 |
| 2003 | NA | 12,238 | 5,639 | 10,340 | 6,471 | 7,581 | 3,280 | 3,741 | 8,971 | 26,011 |
| 2004 | NA | 14,858 | 5,639 | 10,107 | 7,636 | 7,912 | 3,629 | 3,965 | 9,267 | 22,797 |
| 2005 | NA | 17,595 | 6,868 | 10,740 | 7,537 | 7,658 | 3,817 | 3,659 | 9,582 | 29,216 |
| 2006 | NA | 22,953 | 6,854 | 10,871 | 7,982 | 8,122 | 3,943 | 3,684 | 9,916 | 30,289 |
| 2007 | NA | 26,582 | 7,402 | 11,084 | NA | 8,017 | 3,796 | 3,825 | 10,524 | 32,394 |
| 2008 | NA | 28,439 | 7,835 | 11,887 | NA | 7,761 | 3,867 | 3,852 | 9,674 | 33,423 |
| 2009 | NA | 31,423 | 8,356 | 11,691 | NA | 7,396 | 3,994 | 4,167 | 10,425 | 33,953 |
| 2010 | NA | 31,410 | 9,025 | 12,576 | NA | 7,470 | 4,421 | 5,101 | 11,322 | 33,672 |
| 2011 | NA | 32,208 | 9,466 | 13,281 | 14,191 | 7,100 | 5,454 | 5,576 | 11,859 | 35,113 |
| 2012 | NA | 32,331 | 9,692 | 13,666 | 15,132 | 7,100 | 5,713 | 5,812 | 12,103 | 36,356 |
| 2013 | NA | 33,490 | 9,731 | 14,936 | 15,500 | 6,791 | 5,963 | 6,474 | 14,732 | 37,951 |
| 2014 | 9,124 | 34,103 | 10,023 | 14,912 | 13,616 | 7,357 | 6,087 | 6,708 | 14,271 | 39,682 |
| 2015 | 9,414 | 34,440 | 10,020 | 15,957 | 15,780 | 7,540 | 6,104 | 7,174 | 15,338 | 39,933 |
| 2016 | 10,469 | 35,147 | 9,564 | 15,871 | 17,905 | 7,391 | 6,557 | 8,373 | 15,338 | 39,710 |
| 2017 | 10,752 | 37,506 | 9,755 | 15,761 | 23,246 | 6,745 | 6,903 | 10,711 | 15,757 | 40,319 |
| 2018 | 11,365 | 39,768 | 8,987 | 15,061 | 26,890 | 6,754 | 7,077 | 9,480 | 17,366 | 41,071 |
Note(s):
To facilitate international comparison, data for the United States are those reported to the Organisation for Economic Co-operation and Development, which vary slightly from the National Center for Science and Engineering Statistics classification of fields presented in other sections of the report. Data are not available for Brazil for 2000–13 or for India for 2007–10.
Source(s):
Organisation for Economic Co-operation and Development (OECD), OECD.Stat; Eurostat, Education and training database; National Bureau of Statistics of China, China Statistical Yearbook (various years); People's Republic of China, Ministry of Education data (various years); Government of Japan, Ministry of Education, Culture, Sports, Science and Technology, Survey of Education (various years); Government of India, Ministry of Human Resource Development, Department of Higher Education, All India Survey on Higher Education (various years).
Science and Engineering Indicators
Comparisons of doctoral degree production between the United States and other nations should include the consideration that a substantial number of U.S. S&E doctorate recipients are students on temporary visas. However, as mentioned earlier and discussed in “The STEM Labor Force of Today: Scientists, Engineers, and Skilled Technical Workers,” many of these doctorate recipients stay in the United States for subsequent employment after obtaining their degree.
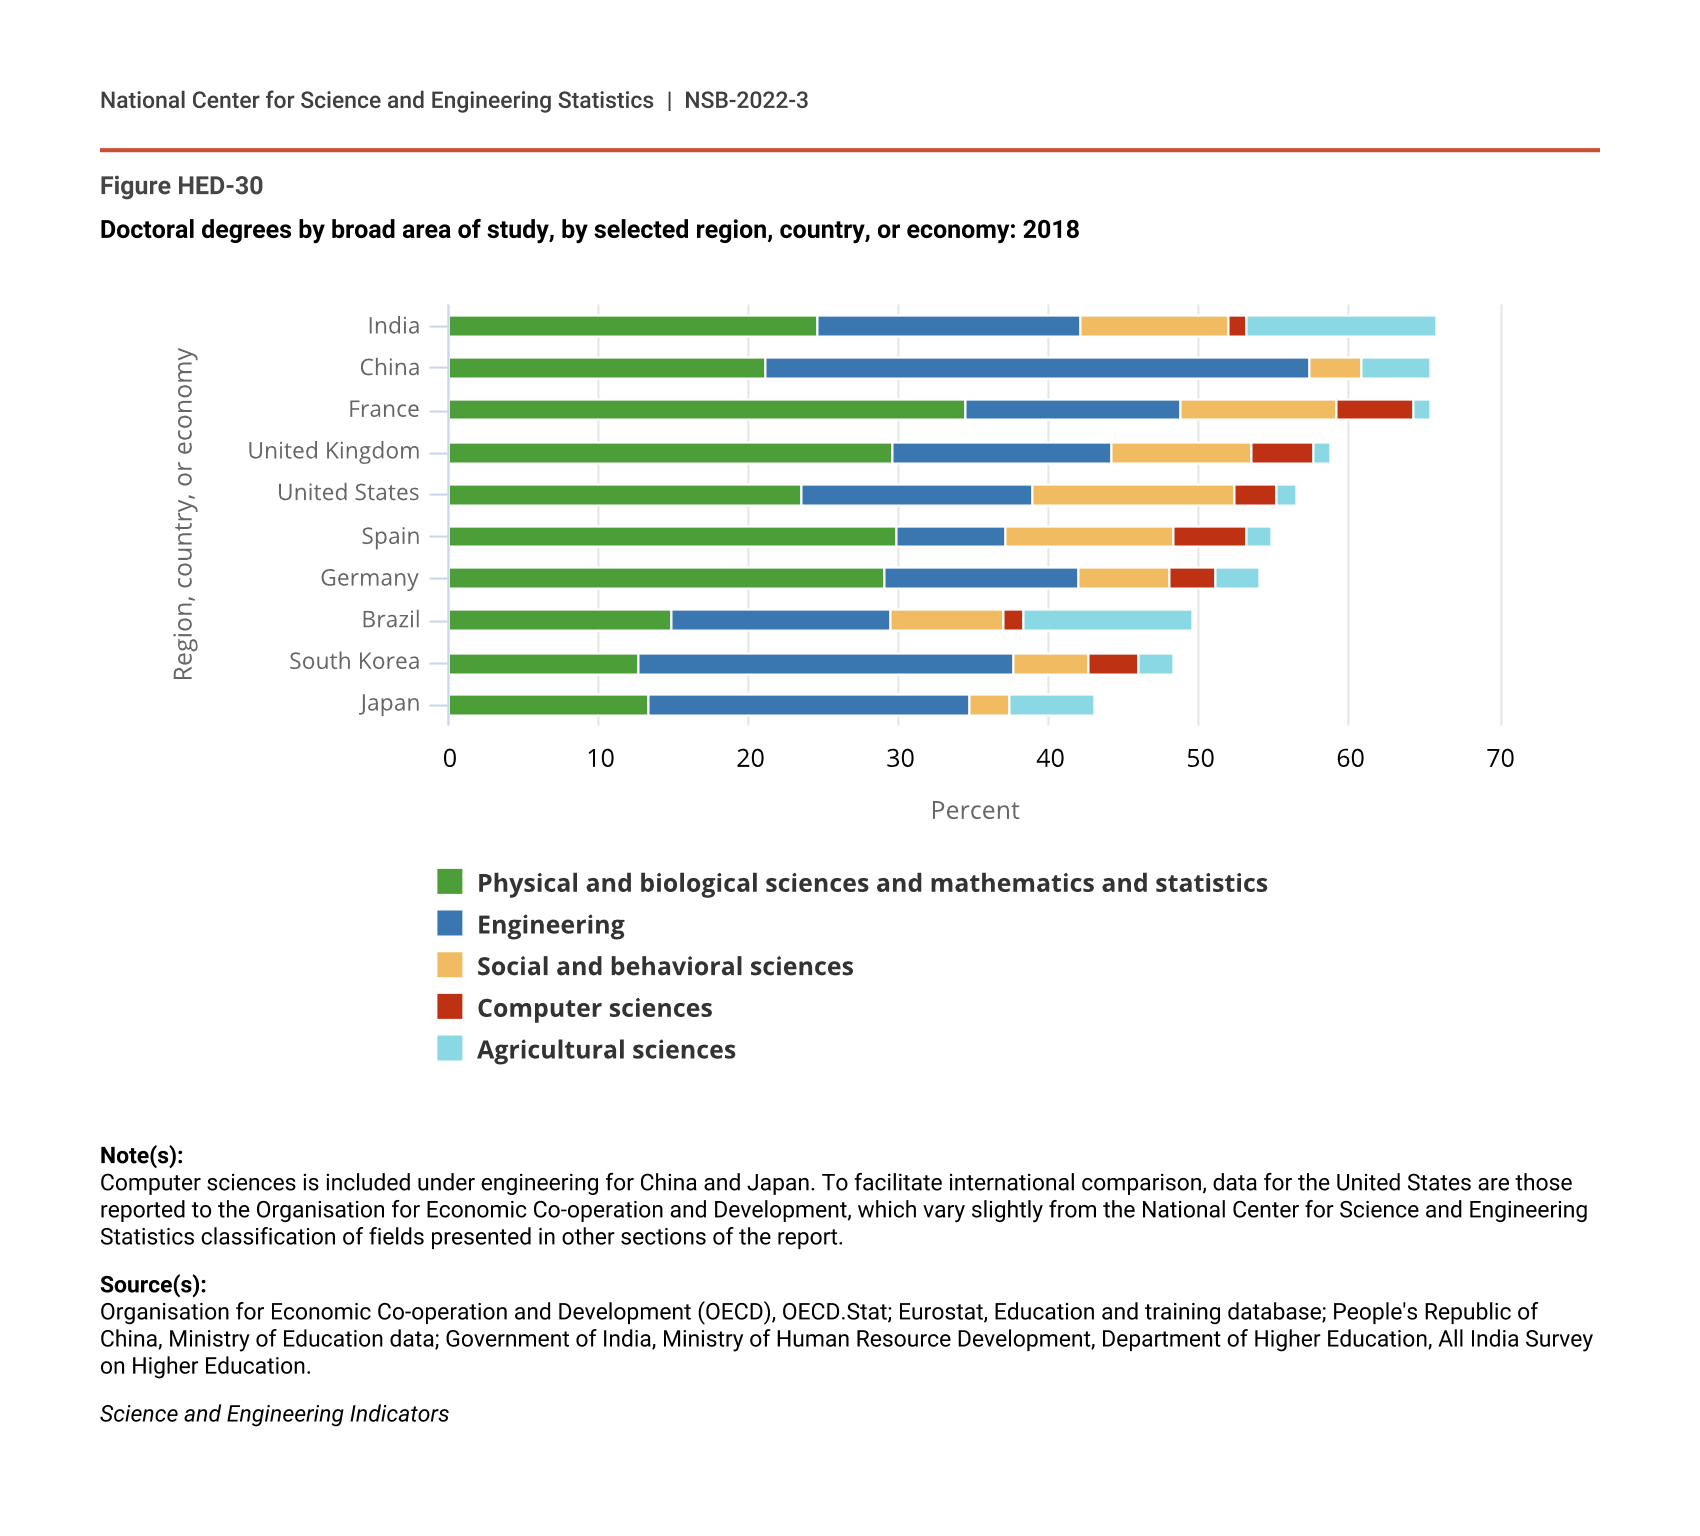
In most of the nations shown in Figure HED-30, S&E doctoral degrees constituted more than half of total doctorate degrees. In addition, for most of these nations, the largest proportion of S&E doctoral degrees was awarded in the physical and biological sciences and in mathematics and statistics. However, in China, South Korea, and Japan, engineering students receive the most S&E doctoral degrees. When comparing only natural sciences (including physical and biological sciences; mathematics and statistics; computer sciences; earth, atmospheric, and ocean sciences; and agricultural sciences) and engineering doctoral degrees, China surpassed the United States as the world’s largest producer in 2007 and has remained so ever since. In 2018, China awarded nearly 38,000 doctorates in these fields; the United States awarded 31,000. While this trend is projected to continue, at the same time there is evidence to suggest that the quality of China’s doctoral education has risen and that most Chinese doctorate recipients receive their degrees from that nation’s elite universities (Zwetsloot et al. 2021).
Doctoral degrees by broad area of study, by selected region, country, or economy: 2018
| Region, country, or economy | Physical and biological sciences and mathematics and statistics | Engineering | Social and behavioral sciences | Computer sciences | Agricultural sciences |
|---|---|---|---|---|---|
| India | 24.6 | 17.5 | 9.9 | 1.2 | 12.6 |
| China | 21.1 | 36.3 | 3.5 | NA | 4.5 |
| France | 34.4 | 14.4 | 10.3 | 5.2 | 1.1 |
| United Kingdom | 29.6 | 14.6 | 9.3 | 4.1 | 1.2 |
| United States | 23.5 | 15.4 | 13.5 | 2.7 | 1.4 |
| Spain | 29.9 | 7.2 | 11.3 | 4.8 | 1.7 |
| Germany | 29.0 | 13.0 | 6.0 | 3.1 | 2.9 |
| Brazil | 14.9 | 14.5 | 7.5 | 1.5 | 11.2 |
| South Korea | 12.7 | 24.9 | 5.0 | 3.4 | 2.3 |
| Japan | 13.3 | 21.4 | 2.6 | NA | 5.7 |
Note(s):
Computer sciences is included under engineering for China and Japan. To facilitate international comparison, data for the United States are those reported to the Organisation for Economic Co-operation and Development, which vary slightly from the National Center for Science and Engineering Statistics classification of fields presented in other sections of the report.
Source(s):
Organisation for Economic Co-operation and Development (OECD), OECD.Stat; Eurostat, Education and training database; People's Republic of China, Ministry of Education data; Government of India, Ministry of Human Resource Development, Department of Higher Education, All India Survey on Higher Education.
Science and Engineering Indicators
International Student Mobility
Internationally mobile students are those who have crossed a national or territorial border for purposes of education and are now enrolled outside their countries of origin. Students become increasingly mobile at more advanced levels of education. Across OECD countries, international students account for an average of less than 5% of bachelor’s or equivalent enrollment, 13% of master’s or equivalent enrollment, and 22% of doctoral or equivalent enrollment (OECD 2020).
Across nations, international students also favor S&E fields and tend to enroll in these fields at higher levels than domestic students (OECD 2020). As shown in earlier sections, these trends are also observed among international students in U.S. institutions.
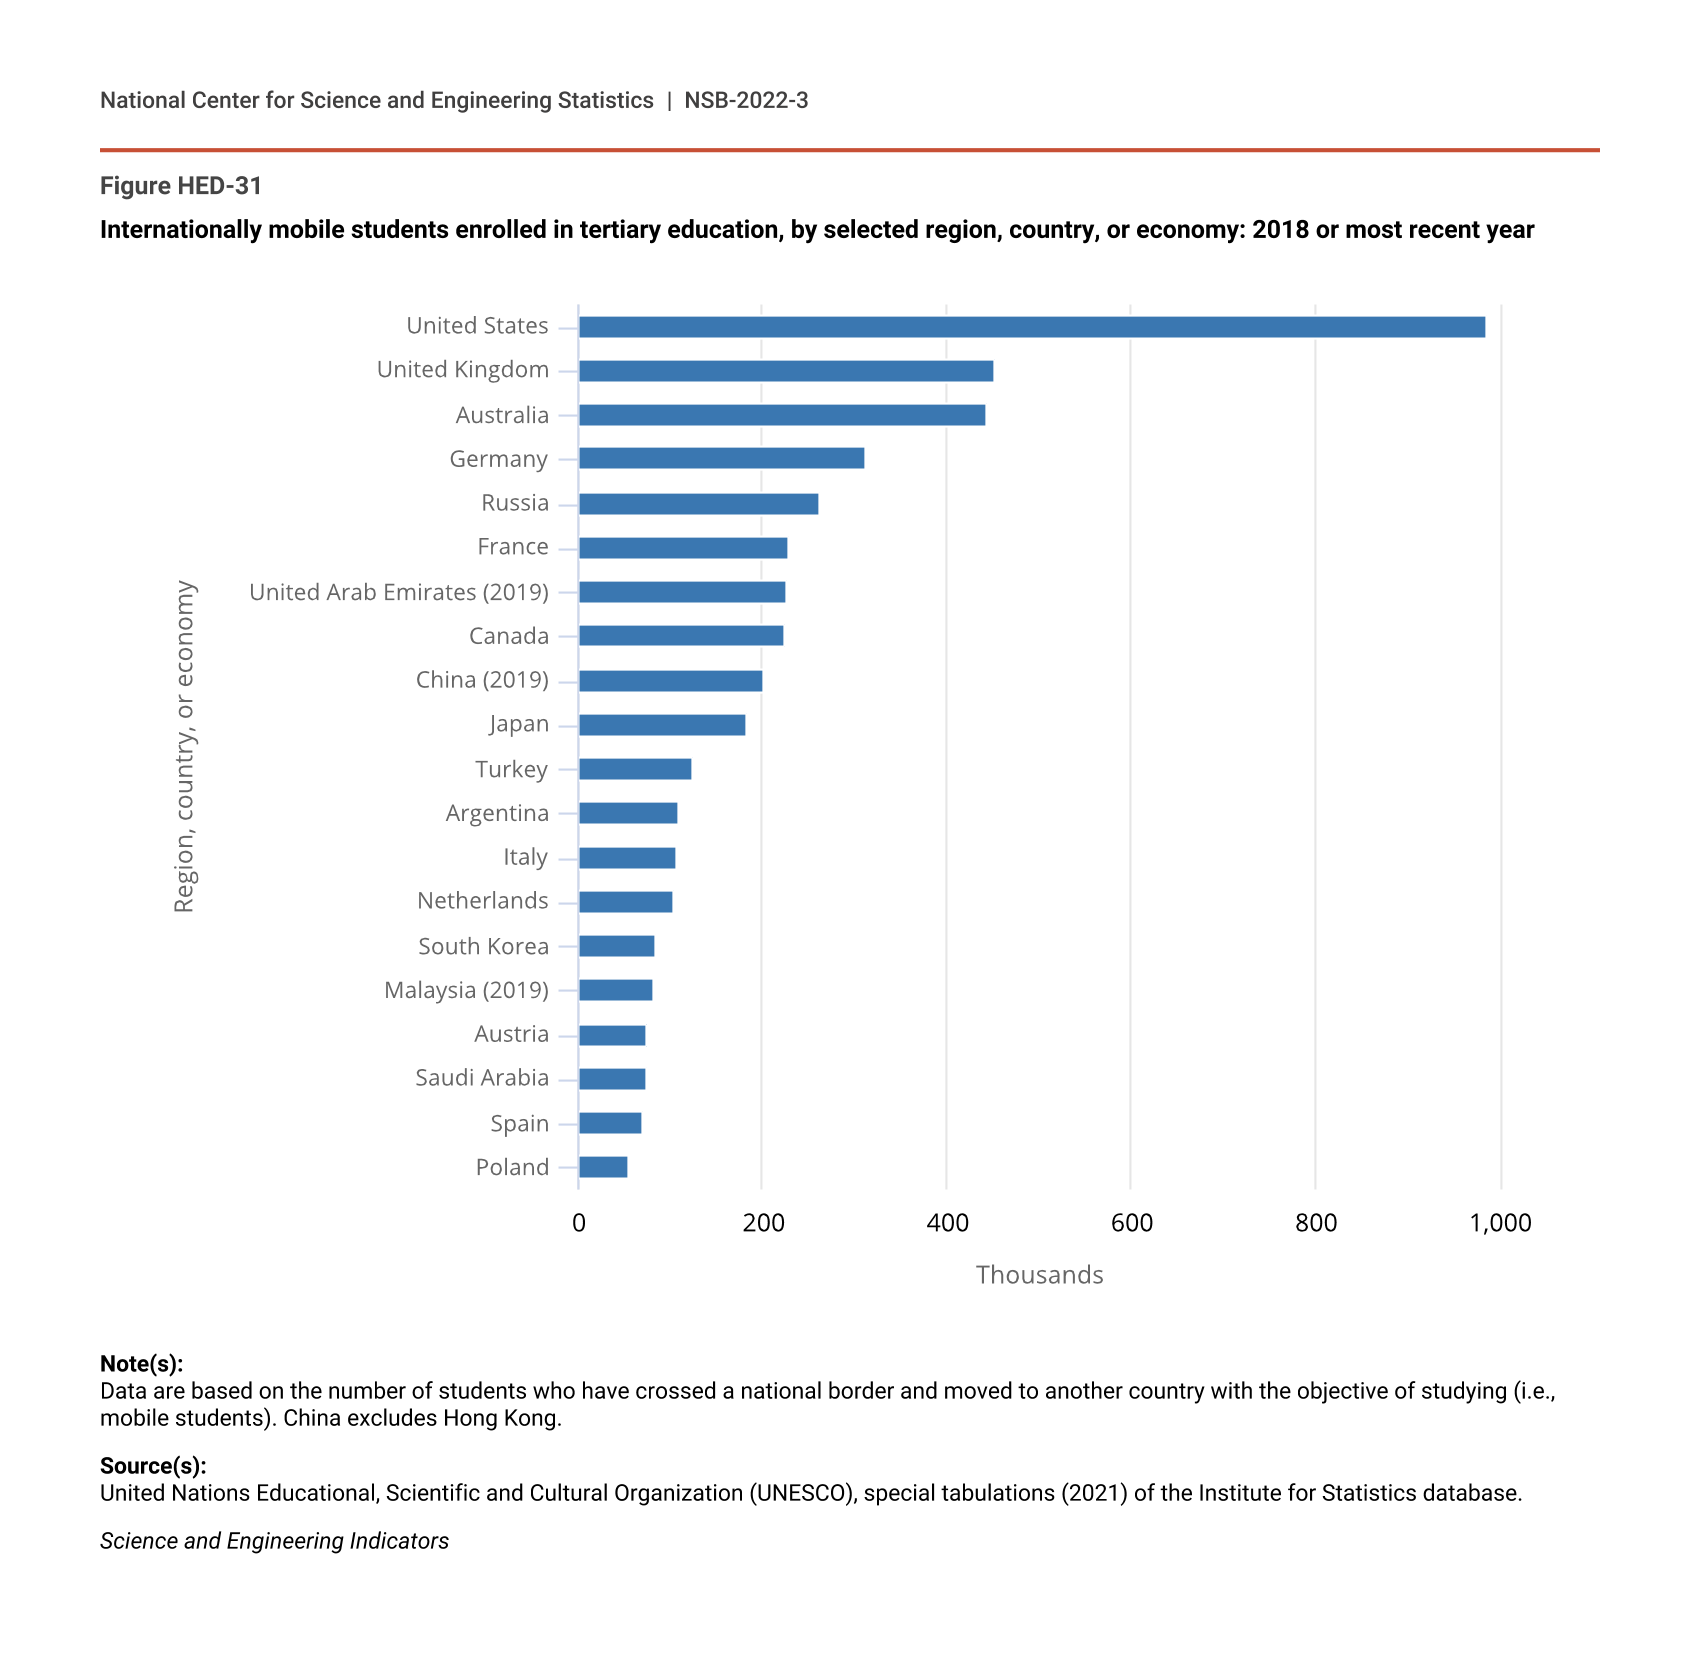
More internationally mobile students (undergraduate and graduate) come to the United States than to any other country (18% of internationally mobile students worldwide) (Figure HED-31). Other top destinations for international students include the United Kingdom, Australia, Germany, Russia, and France. The top 20 destination countries in 2018 together received around 80% of internationally mobile students worldwide. China is also an increasingly popular destination for globally mobile students, now in the top 10.
Internationally mobile students enrolled in tertiary education, by selected region, country, or economy: 2018 or most recent year
| Region, country, or economy | Students |
|---|---|
| United States | 987.3 |
| United Kingdom | 452.1 |
| Australia | 444.5 |
| Germany | 311.7 |
| Russia | 262.4 |
| France | 229.6 |
| United Arab Emirates (2019) | 225.3 |
| Canada | 224.5 |
| China (2019) | 201.2 |
| Japan | 182.7 |
| Turkey | 125.1 |
| Argentina | 109.2 |
| Italy | 106.6 |
| Netherlands | 104.0 |
| South Korea | 84.7 |
| Malaysia (2019) | 82.0 |
| Austria | 75.3 |
| Saudi Arabia | 74.0 |
| Spain | 70.9 |
| Poland | 54.4 |
Note(s):
Data are based on the number of students who have crossed a national border and moved to another country with the objective of studying (i.e., mobile students). China excludes Hong Kong.
Source(s):
United Nations Educational, Scientific and Cultural Organization (UNESCO), special tabulations (2021) of the Institute for Statistics database.
Science and Engineering Indicators
The U.S. share of worldwide internationally mobile students has declined slightly over time, reflecting several factors. The number of internationally mobile students in higher education worldwide (in all fields) has risen dramatically, from around 2 million in 2000 to 5.6 million in 2018 (OECD 2020). According to data from the United Nations Educational, Scientific and Cultural Organization (UNESCO) Institute for Statistics, China and India send the most students abroad; their combined share of outbound internationally mobile students rose from 19% in 2008 to 25% in 2018. Around one-third of Chinese students studying abroad came to the United States in 2018, a proportion that changed very little in the previous 5 years. Around 39% of Indian students studying abroad came to the United States in 2018, down from 46% in 2014. An increasing number of Indian students are studying in Australia (21% in 2018, up from 12% in 2014) and Canada (10% in 2018, up from 7% in 2014).
A related factor is increasing competition among countries for international students; some have set targets for attracting certain numbers. Countries like Australia and Canada have recently reported double-digit growth in international students. However, across nations, border closures due to the pandemic may affect global mobility patterns.