 An official website of the United States government
 Data
Tables
Select "VIEW" to see the table. PDF and Excel are available for download.
Figures

Data Sources
DOWNLOAD DATA SOURCES| Item | Title | Provider | Product |
|---|---|---|---|
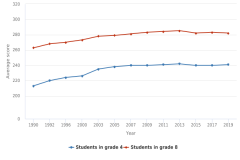
| Figure K12-1 | Average scores of students in grades 4 and 8 on the NAEP mathematics assessment: 1990–2019 | National Center for Education Statistics | National Assessment of Educational Progress |
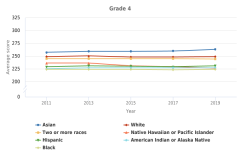
| Figure K12-2 | Average scores of students in grades 4 and 8 on the NAEP mathematics assessment, by race or ethnicity: 2011–19 | National Center for Education Statistics | National Assessment of Educational Progress |
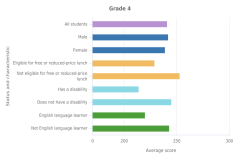
| Figure K12-3 | Average scores of students in grades 4 and 8 on the NAEP mathematics assessment, by sex, socioeconomic status, disability status, and English language learner status: 2019 | National Center for Education Statistics | National Assessment of Educational Progress |
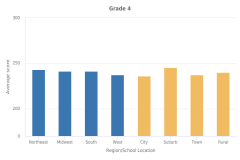
| Figure K12-4 | Average scores of students in grades 4 and 8 on the NAEP mathematics assessment, by region of country and school location: 2019 | National Center for Education Statistics | National Assessment of Educational Progress |
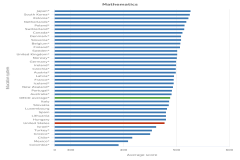
| Figure K12-5 | Average scores of 15-year-old students on the PISA mathematics and science literacy scales, by OECD education system: 2018 | Organisation for Economic Co-operation and Development | Program for International Student Assessment |
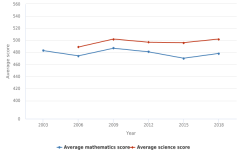
| Figure K12-6 | Average scores of U.S. 15-year-old students on the PISA mathematics and science literacy scales: 2003–18 | Organisation for Economic Co-operation and Development | Program for International Student Assessment |
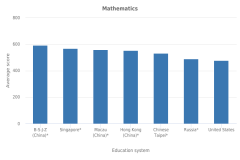
| Figure K12-7 | Average scores of 15-year-old students on the PISA mathematics and science literacy scales in the United States and top-scoring non-OECD education systems: 2018 | Organisation for Economic Co-operation and Development | Program for International Student Assessment |
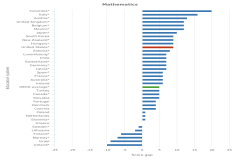
| Figure K12-8 | Male-female score gaps of 15-year-old students on the PISA mathematics and science literacy scales, by OECD education system: 2018 | Organisation for Economic Co-operation and Development | Program for International Student Assessment |
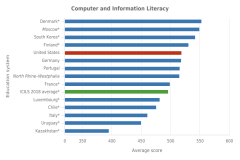
| Figure K12-9 | Average CIL and CT scores of students in grade 8, by education system: 2018 | International Association for the Evaluation of Educational Achievement | International Computer and Information Literacy Study |
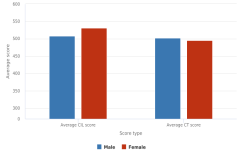
| Figure K12-10 | Average CIL and CT scores of U.S. students in grade 8, by sex: 2018 | International Association for the Evaluation of Educational Achievement | International Computer and Information Literacy Study |
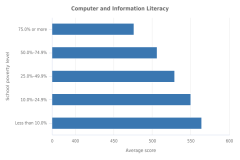
| Figure K12-11 | Average CIL and CT scores of U.S. students in grade 8, by school poverty level: 2018 | International Association for the Evaluation of Educational Achievement | International Computer and Information Literacy Study |
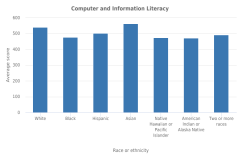
| Figure K12-12 | Average CIL and CT scores of U.S. students in grade 8, by race or ethnicity: 2018 | International Association for the Evaluation of Educational Achievement | International Computer and Information Literacy Study |
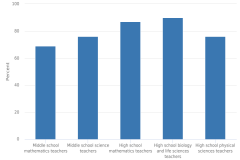
| Figure K12-13 | Public middle and high school mathematics and science teachers with in-field subject-matter preparation: 2017–18 | National Center for Education Statistics | National Teacher and Principal Survey |
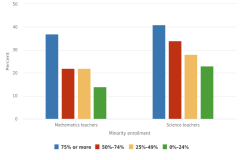
| Figure K12-14 | Public middle and high school mathematics and science teachers who entered teaching through an alternative certification program, by school minority enrollment: 2017–18 | National Center for Education Statistics | National Teacher and Principal Survey |
| Figure K12-15 | Public middle and high school mathematics and science teachers with 3 years or fewer of teaching experience, by school poverty level: 2017–18 | National Center for Education Statistics | National Teacher and Principal Survey |
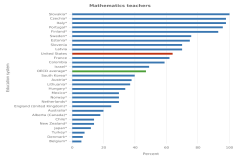
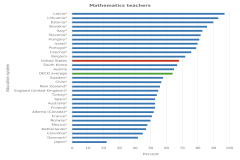
| Figure K12-16 | Lower secondary mathematics and science teachers with a master's or higher degree, by OECD education system: 2018 | Organisation for Economic Co-operation and Development | Teaching and Learning International Survey |
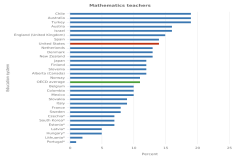
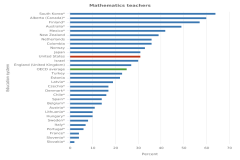
| Figure K12-17 | Lower secondary mathematics and science teachers with 3 years or fewer of teaching experience, by OECD education system: 2018 | Organisation for Economic Co-operation and Development | Teaching and Learning International Survey |
| Figure K12-18 | Lower secondary mathematics and science teachers who were women, by OECD education system: 2018 | Organisation for Economic Co-operation and Development | Teaching and Learning International Survey |
| Figure K12-19 | Lower secondary mathematics and science teachers who agreed that the teaching profession is valued in their society, by OECD education system: 2018 | Organisation for Economic Co-operation and Development | Teaching and Learning International Survey |
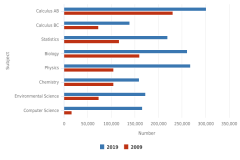
| Figure K12-20 | Number of students taking AP STEM exams, by selected subjects: 2009 and 2019 | College Board | AP Program Participation and Performance Data |
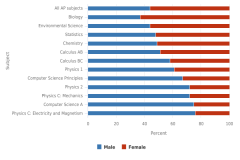
| Figure K12-21 | AP exam takers in selected subjects, by sex: 2019 | College Board | AP Program Participation and Performance Data |
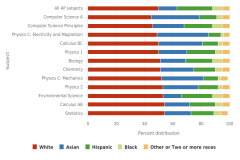
| Figure K12-22 | AP exam takers in selected subjects, by race or ethnicity: 2019 | College Board | AP Program Participation and Performance Data |
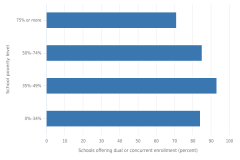
| Figure K12-23 | Among public schools with students enrolled in any of grades 9–12, percentage that offered dual or concurrent enrollment, by school poverty level: 2017–18 | National Center for Education Statistics | National Teacher and Principal Survey |
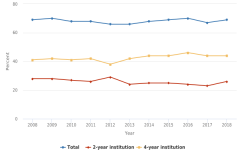
| Figure K12-24 | Immediate college enrollment rates among high school completers, by institution type: 2008–18 | National Center for Education Statistics | Digest of Education Statistics |
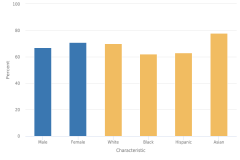
| Figure K12-25 | Immediate college enrollment rates among high school completers, by sex and race or ethnicity: 2018 | National Center for Education Statistics | Digest of Education Statistics |
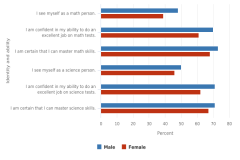
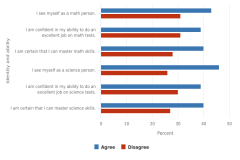
| Figure K12-26 | Fall 2009 students in grade 9 who agreed with various statements about their mathematics and science identity and ability, by sex: 2012 | National Center for Education Statistics | High School Longitudinal Study of 2009 |
| Figure K12-27 | Among fall 2009 students in grade 9 who enrolled in postsecondary education after high school, percentage who reported that their current or most recent major was in a STEM field, by perception of mathematics and science identity and ability: 2016 | National Center for Education Statistics | High School Longitudinal Study of 2009 |
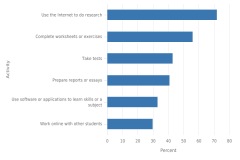
| Figure K12-28 | U.S. students in grade 8 who reported using information and communications technologies for learning activities every school day or at least once a week, by activity: 2018 | International Association for the Evaluation of Educational Achievement | International Computer and Information Literacy Study |
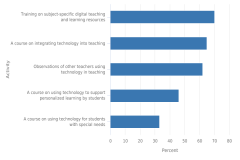
| Figure K12-29 | U.S. eighth-grade teachers who reported participating in technology-related professional learning activities at least once in the past 2 years, by type of activity: 2018 | International Association for the Evaluation of Educational Achievement | International Computer and Information Literacy Study |
| Table K12-1 | Average scores of students in grades 4 and 8 on the NAEP mathematics assessment and score differences, by socioeconomic status and sex within race or ethnicity: 2019 | National Center for Education Statistics | National Assessment of Educational Progress |
| Table K12-2 | Public middle and high school teachers with selected characteristics and average annual salaries of teachers, by teaching field: 2017–18 | National Center for Education Statistics | National Teacher and Principal Survey |
| Table K12-3 | Public middle and high school mathematics and science teachers with in-field subject-matter preparation, by teaching field and selected school characteristics: 2017–18 | National Center for Education Statistics | National Teacher and Principal Survey |
| Table K12-4 | Public middle and high school mathematics and science teachers who are White, Black, or Hispanic, by teaching field and minority enrollment in school: 2017–18 | National Center for Education Statistics | National Teacher and Principal Survey |
| Table K12-5 | Among fall 2009 students in grade 9 who took a mathematics or science course in 2012, percentage reporting various reasons for taking it, by sex and race or ethnicity: 2012 | National Center for Education Statistics | High School Longitudinal Study of 2009 |
| Table K12-6 | Fall 2009 students in grade 9 who agreed with various statements about their mathematics and science ability, by race or ethnicity: 2012 | National Center for Education Statistics | High School Longitudinal Study of 2009 |
| Table K12-7 | Average number of hours in the past week spent on home-based education in households with children enrolled in K−12 school, by selected adult characteristics: 7−12 May 2020 | U.S. Census Bureau | Household Pulse Survey |
| Table K12-8 | Adults who reported time that their children spent on all learning activities in the past week relative to a school day before the COVID-19 pandemic, by selected adult characteristics: 16−28 September 2020 | U.S. Census Bureau | Household Pulse Survey |
| Table K12-9 | Adults who reported frequency of live contact of children with their teachers in person, by phone, or by video in the past week, by selected adult characteristics: 16−28 September 2020 | U.S. Census Bureau | Household Pulse Survey |
| Table K12-10 | Adults who reported that a computer or other digital device and the Internet were always available for children to use at home for educational purposes, by selected adult characteristics: 7−12 May 2020 and 16−28 September 2020 | U.S. Census Bureau | Household Pulse Survey |
| Table SK12-1 | Average scores of students in grades 4, 8, and 12 on the NAEP mathematics assessment, by student characteristics: 1990–2019 | National Center for Education Statistics | National Assessment of Educational Progress |
| Table SK12-2 | Average scores of students in grades 4, 8, and 12 on the main NAEP mathematics assessment, by race or ethnicity: 2011–19 | National Center for Education Statistics | National Assessment of Educational Progress |
| Table SK12-3 | Average scores and 10th and 90th percentile scores of 15-year-old students on the PISA mathematics literacy scale and 90th–10th percentile score gaps, by education system: 2018 | Organisation for Economic Co-operation and Development | Program for International Student Assessment |
| Table SK12-4 | Average scores and 10th and 90th percentile scores of 15-year-old students on the PISA science literacy scale and 90th–10th percentile score gaps, by education system: 2018 | Organisation for Economic Co-operation and Development | Program for International Student Assessment |
| Table SK12-5 | Male-female difference in average scores of 15-year-old students on the PISA mathematics and science literacy scale, by education system: 2018 | Organisation for Economic Co-operation and Development | Program for International Student Assessment |
| Table SK12-6 | Average scores of 15-year-old students on the PISA mathematics literacy scales, by OECD education system: 2012, 2015, and 2018 | Organisation for Economic Co-operation and Development | Program for International Student Assessment |
| Table SK12-7 | Average scores of 15-year-old students on the PISA science literacy scales, by OECD education system: 2012, 2015, and 2018 | Organisation for Economic Co-operation and Development | Program for International Student Assessment |
| Table SK12-8 | Average CIL and CT scores of students in grade 8, by education system: 2018 | International Association for the Evaluation of Educational Achievement | International Computer and Information Literacy Study |
| Table SK12-9 | Average CIL and CT scores of male and female students in grade 8 and female-male score differences, by education system: 2018 | International Association for the Evaluation of Educational Achievement | International Computer and Information Literacy Study |
| Table SK12-10 | Average CIL and CT scores of U.S. students in grade 8, by sex, race or ethnicity, and school poverty level: 2018 | International Association for the Evaluation of Educational Achievement | International Computer and Information Literacy Study |
| Table SK12-11 | Highest degree attainment of public middle and high school teachers, by teaching field and selected school characteristics: 2017–18 | National Center for Education Statistics | National Teacher and Principal Survey |
| Table SK12-12 | Type of certification of public middle and high school teachers, by teaching field and selected school characteristics: 2017–18 | National Center for Education Statistics | National Teacher and Principal Survey |
| Table SK12-13 | Average annual salaries for public middle and high school teachers, by teaching field and selected school characteristics: 2017–18 | National Center for Education Statistics | National Teacher and Principal Survey |
| Table SK12-14 | Subject-matter preparation of public middle and high school mathematics and science teachers, by teaching field and selected school characteristics: 2017–18 | National Center for Education Statistics | National Teacher and Principal Survey |
| Table SK12-15 | Public middle and high school teachers who entered teaching through an alternative certification program, by teaching field and selected school characteristics: 2017–18 | National Center for Education Statistics | National Teacher and Principal Survey |
| Table SK12-16 | Years of teaching experience of public middle and high school teachers, by teaching field and selected school characteristics: 2017–18 | National Center for Education Statistics | National Teacher and Principal Survey |
| Table SK12-17 | Sex of lower secondary mathematics and science teachers, by education system: 2018 | Organisation for Economic Co-operation and Development | Teaching and Learning International Survey |
| Table SK12-18 | Highest degree attainment of lower secondary mathematics and science teachers, by education system: 2018 | Organisation for Economic Co-operation and Development | Teaching and Learning International Survey |
| Table SK12-19 | Years of teaching experience of lower secondary mathematics and science teachers, by education system: 2018 | Organisation for Economic Co-operation and Development | Teaching and Learning International Survey |
| Table SK12-20 | Lower secondary mathematics and science teachers who reported various elements included in their formal education and training, by education system: 2018 | Organisation for Economic Co-operation and Development | Teaching and Learning International Survey |
| Table SK12-21 | Lower secondary mathematics and science teachers who agreed with various statements about the teaching profession, by education system: 2018 | Organisation for Economic Co-operation and Development | Teaching and Learning International Survey |
| Table SK12-22 | Students taking AP exams, by selected subjects: 2009–19 | College Board | AP Program Participation and Performance Data |
| Table SK12-23 | Students taking AP exams, by selected subjects and sex: 2018−19 | College Board | AP Program Participation and Performance Data |
| Table SK12-24 | Among schools with students enrolled in any of grades 9–12, percentage that offered dual or concurrent enrollment, by selected school characteristics: 2017–18 | National Center for Education Statistics | National Teacher and Principal Survey |
| Table SK12-25 | High school graduates enrolled in college in October after completing high school, by demographic characteristics and institution type: 1975–2018 | National Center for Education Statistics | Digest of Education Statistics |
| Table SK12-26 | Among fall 2009 students in grade 9 who took a mathematics or science course, percentage who reported various reasons for taking it, by sex and race or ethnicity: 2012 | National Center for Education Statistics | High School Longitudinal Study of 2009 |
| Table SK12-27 | Fall 2009 students in grade 9 who agreed with various statements about their mathematics and science ability, by sex and race or ethnicity: 2012 | National Center for Education Statistics | High School Longitudinal Study of 2009 |
| Table SK12-28 | Among fall 2009 students in grade 9 who enrolled in postsecondary education after high school, percentage who reported that their current or most recent major was in a STEM field, by perception of mathematics and science ability, sex, and race or ethnicity: 2016 | National Center for Education Statistics | High School Longitudinal Study of 2009 |
| Table SK12-29 | Average number of hours in the past week spent on home-based education in households with children enrolled in K−12 school, by selected adult characteristics: 7−12 May 2020 | U.S. Census Bureau | Household Pulse Survey |
| Table SK12-30 | Adults who reported COVID-19 pandemic impact on how their children received education, by selected adult characteristics: 7−12 May 2020 and 16−28 September 2020 | U.S. Census Bureau | Household Pulse Survey |
| Table SK12-31 | Adults who reported availability of computer or other digital device and the Internet for children to use at home for educational purposes, by selected adult characteristics: 7−12 May 2020 and 16−28 September 2020 | U.S. Census Bureau | Household Pulse Survey |
| Table SK12-32 | Adults who reported provider of computer or digital device and Internet services for children to use at home for educational purposes, by selected adult characteristics: 7−12 May 2020 and 16−28 September 2020 | U.S. Census Bureau | Household Pulse Survey |
| Table SK12-33 | Students in grade 8 who reported using information and communications technologies for learning activities every school day or at least once a week, by type of activity: 2018 | International Association for the Evaluation of Educational Achievement | International Computer and Information Literacy Study |
| Table SK12-34 | Eighth-grade teachers who reported participating in professional learning activities at least once in the past 2 years, by type of activity: 2018 | International Association for the Evaluation of Educational Achievement | International Computer and Information Literacy Study |
| Table SK12-35 | Eighth-grade teachers who agreed with various statements about using information and communications technologies in teaching at school, by statement: 2018 | International Association for the Evaluation of Educational Achievement | International Computer and Information Literacy Study |
| Table SK12-36 | Public school teachers who reported various types of access to computers or the Internet provided to their students by the district or school, by school characteristics: 2018–19 | National Center for Education Statistics | Teachers’ Use of Technology for School and Homework Assignments |
| Table SK12-37 | Public school teachers who reported the extent to which their students used various locations for computer or Internet access to work on school assignments, by school characteristics: 2018–19 | National Center for Education Statistics | Teachers’ Use of Technology for School and Homework Assignments |
| Table SK12-38 | Public school teachers who reported the estimated percentage of their students who had access to a computer at home, the availability of those computers for students to use for school assignments, and the likelihood that those computers had reliable Internet access from home, by school characteristics: 2018–19 | National Center for Education Statistics | Teachers’ Use of Technology for School and Homework Assignments |