|
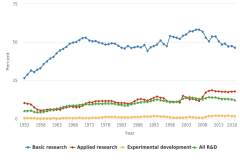
Figure URD-1
|
Academic R&D as a percentage of U.S. R&D, by type of R&D: 1953–2018 |
National Center for Science and Engineering Statistics
|
National Patterns of R&D Resources
|
|
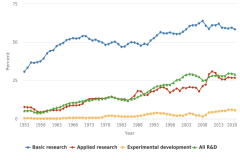
Figure URD-2
|
Federally funded academic R&D as a percentage of U.S. federally funded R&D, by type of R&D: 1953–2018 |
National Center for Science and Engineering Statistics
|
National Patterns of R&D Resources
|
|
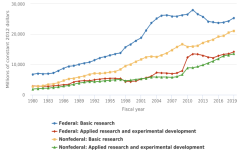
Figure URD-3
|
Federally funded and nonfederally funded higher education R&D expenditures, by type of R&D: FY 1980–2019 |
National Center for Science and Engineering Statistics
|
Higher Education Research and Development Survey
|
|
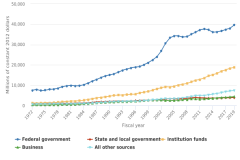
Figure URD-4
|
Higher education R&D expenditures, by source of funds: FY 1972–2019 |
National Center for Science and Engineering Statistics
|
Higher Education Research and Development Survey
|
|
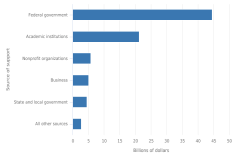
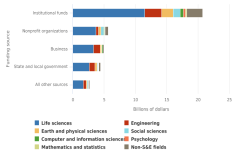
Figure URD-5
|
Academic R&D expenditures, by source of support: FY 2019 |
National Center for Science and Engineering Statistics
|
Higher Education Research and Development Survey
|
|
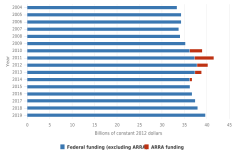
Figure URD-6
|
Federal funding for academic R&D expenditures: 2004–19 |
National Center for Science and Engineering Statistics
|
Higher Education Research and Development Survey
|
|
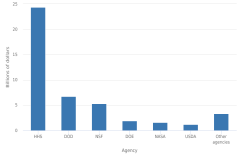
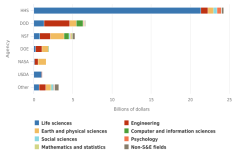
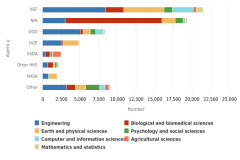
Figure URD-7
|
Federally financed academic R&D expenditures, by agency: FY 2019 |
National Center for Science and Engineering Statistics
|
Higher Education Research and Development Survey
|
|
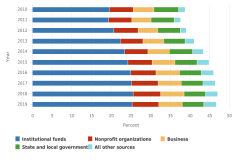
Figure URD-8
|
Nonfederal funding sources as a percentage of total academic R&D expenditures: 2010–19 |
National Center for Science and Engineering Statistics
|
Higher Education Research and Development Survey
|
|
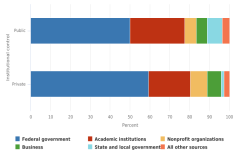
Figure URD-9
|
Academic R&D expenditures, by institutional control and source of support: FY 2019 |
National Center for Science and Engineering Statistics
|
Higher Education Research and Development Survey
|
|
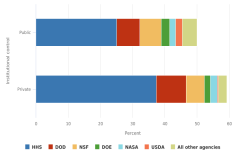
Figure URD-10
|
Federally financed academic R&D expenditures as a percentage of total academic R&D expenditures, by institutional control and agency: FY 2018 |
National Center for Science and Engineering Statistics
|
Higher Education Research and Development Survey
|
|
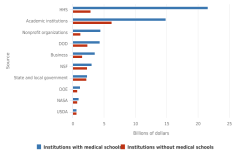
Figure URD-11
|
Academic R&D expenditures at institutions with and without medical schools, by source of funding: FY 2019 |
National Center for Science and Engineering Statistics
|
Higher Education Research and Development Survey
|
|
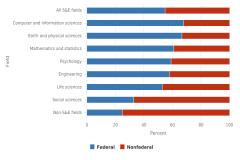
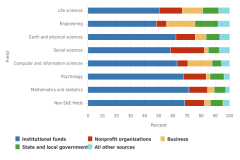
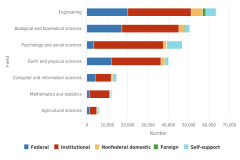
Figure URD-12
|
Federal and nonfederal support for academic R&D, by field: FY 2019 |
National Center for Science and Engineering Statistics
|
Higher Education Research and Development Survey
|
|
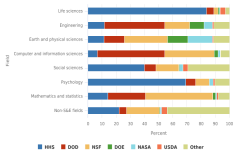
Figure URD-13
|
Federally financed academic R&D expenditures, by agency and field: FY 2019 |
National Center for Science and Engineering Statistics
|
Higher Education Research and Development Survey
|
|
Figure URD-14
|
Federally financed academic R&D expenditures, by field and agency: FY 2019 |
National Center for Science and Engineering Statistics
|
Higher Education Research and Development Survey
|
|
Figure URD-15
|
Nonfederally financed academic R&D expenditures, by funding source and field: FY 2019 |
National Center for Science and Engineering Statistics
|
Higher Education Research and Development Survey
|
|
Figure URD-16
|
Nonfederally financed academic R&D expenditures, by field and funding source: FY 2019 |
National Center for Science and Engineering Statistics
|
Higher Education Research and Development Survey
|
|
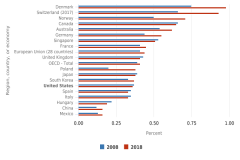
Figure URD-17
|
Higher education expenditure on R&D as a percentage of gross domestic product for selected countries or economies: 2008 and 2018 |
Organisation for Economic Co-operation and Development
|
Main Science and Technology Indicators
|
|
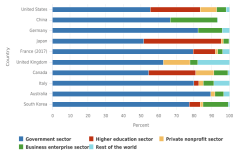
Figure URD-18
|
Funding by sector for higher education expenditure on R&D for selected countries: 2018 |
Organisation for Economic Co-operation and Development
|
Main Science and Technology Indicators
|
|
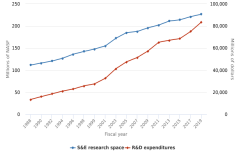
Figure URD-19
|
S&E research space and R&D expenditures at academic institutions: FY 1988–2019 |
National Center for Science and Engineering Statistics
|
Higher Education Research and Development Survey
|
|
Figure URD-19
|
S&E research space and R&D expenditures at academic institutions: FY 1988–2019
|
National Center for Science and Engineering Statistics
|
Survey of Science and Engineering Research Facilities
|
|
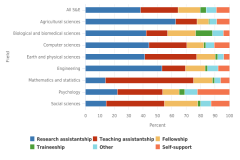
Figure URD-20
|
Full-time S&E doctoral students, by field and mechanism of primary support: 2019 |
National Center for Science and Engineering Statistics
|
Survey of Graduate Students and Postdoctorates in Science and Engineering
|
|
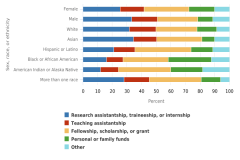
Figure URD-21
|
Primary source of support for U.S. citizen and permanent resident S&E doctorate recipients, by sex, race, or ethnicity: 2015–19 |
National Center for Science and Engineering Statistics
|
Survey of Earned Doctorates
|
|
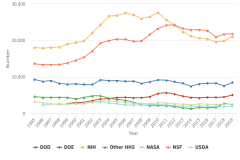
Figure URD-22
|
Full-time graduate students in science, engineering, and health primarily supported by the federal government, by agency: 1995–2019 |
National Center for Science and Engineering Statistics
|
Survey of Graduate Students and Postdoctorates in Science and Engineering
|
|
Figure URD-23
|
Full-time graduate students in S&E primarily supported by the federal government, by field and agency: 2019 |
National Center for Science and Engineering Statistics
|
Survey of Graduate Students and Postdoctorates in Science and Engineering
|
|
Figure URD-24
|
Full-time doctoral students in S&E, by field and primary source of support: 2019 |
National Center for Science and Engineering Statistics
|
Survey of Graduate Students and Postdoctorates in Science and Engineering
|
|
Table SURD-1
|
Current fund expenditures for research equipment at academic institutions, by R&D field: FY 2004–19 |
National Center for Science and Engineering Statistics
|
Higher Education Research and Development Survey
|
|
Table SURD-2
|
Federal share of current funding for research equipment at academic institutions, by R&D field: FY 2004–19 |
National Center for Science and Engineering Statistics
|
Higher Education Research and Development Survey
|
 An official website of the United States government