|
Figure URD-1
|
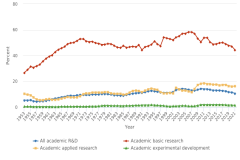
Academic R&D as a percentage of U.S. R&D, by type of R&D: 1953–2021 |
National Center for Science and Engineering Statistics
|
National Patterns of R&D Resources
|
|
Figure URD-2
|
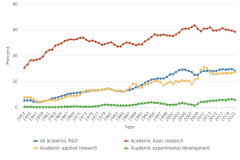
Federally funded academic R&D as a share of U.S. federally funded R&D, by type of R&D: 1953–2021 |
National Center for Science and Engineering Statistics
|
National Patterns of R&D Resources
|
|
Figure URD-3
|
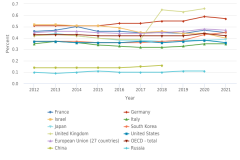
Higher education R&D expenditures as a percentage of gross domestic product for selected regions, countries, or economies: 2012–21 |
Organisation for Economic Co-operation and Development
|
Main Science and Technology Indicators
|
|
Figure URD-4
|
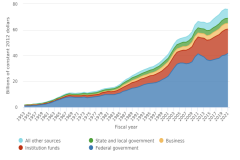
Academic R&D expenditures, by source of funds: FYs 1953–2021 |
National Center for Science and Engineering Statistics
|
Higher Education Research and Development Survey
|
|
Figure URD-5
|
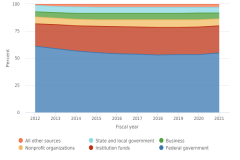
Share of academic R&D expenditures, by source of funds: FYs 2012–21 |
National Center for Science and Engineering Statistics
|
Higher Education Research and Development Survey
|
|
Figure URD-6
|
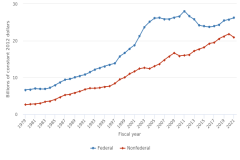
Federal and nonfederal funding of academic basic research: FYs 1979–2021 |
National Center for Science and Engineering Statistics
|
Higher Education Research and Development Survey
|
|
Figure URD-7
|
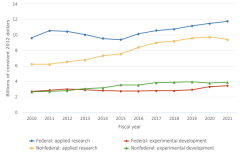
Federal and nonfederal funding of academic experimental development and applied research: FYs 2010–21 |
National Center for Science and Engineering Statistics
|
Higher Education Research and Development Survey
|
|
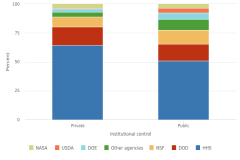
Figure URD-8
|
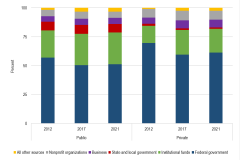
Sources of funding for academic R&D in private and public institutions: FYs 2012, 2017, and 2021 |
National Center for Science and Engineering Statistics
|
Higher Education Research and Development Survey
|
|
Figure URD-9
|
Shares of federal agency funding for public and private institutions: FY 2021 |
National Center for Science and Engineering Statistics
|
Higher Education Research and Development Survey
|
|
Figure URD-10
|
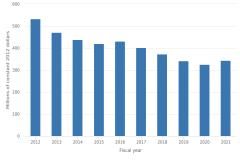
Federally funded R&D expenditures at historically Black colleges and universities: FYs 2012–21 |
National Center for Science and Engineering Statistics
|
Higher Education Research and Development Survey
|
|
Figure URD-11
|
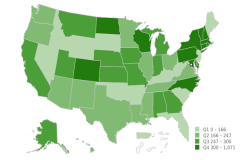
Ratio of academic R&D expenditures to population, by U.S. states: FY 2021 |
National Center for Science and Engineering Statistics
|
Higher Education Research and Development Survey
|
|
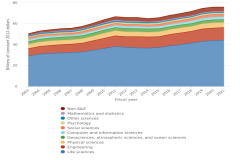
Figure URD-12
|
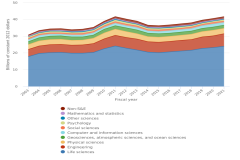
Academic R&D spending, by field: FYs 2003–21 |
National Center for Science and Engineering Statistics
|
Higher Education Research and Development Survey
|
|
Figure URD-13
|
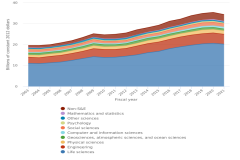
Federally funded academic R&D spending, by field: FYs 2003–21 |
National Center for Science and Engineering Statistics
|
Higher Education Research and Development Survey
|
|
Figure URD-14
|
Nonfederally funded academic R&D spending, by field: FYs 2003–21 |
National Center for Science and Engineering Statistics
|
Higher Education Research and Development Survey
|
|
Figure URD-15
|
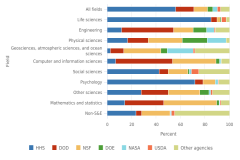
Federally financed academic R&D expenditures, by agency and field: FY 2021 |
National Center for Science and Engineering Statistics
|
Higher Education Research and Development Survey
|
|
Figure URD-16
|
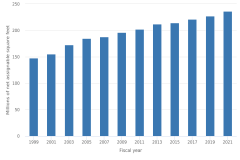
S&E research space at academic institutions: FYs 1999–2021 |
National Center for Science and Engineering Statistics
|
Survey of Science and Engineering Research Facilities
|
|
Figure URD-17
|
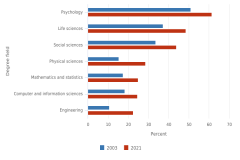
Female S&E doctorate holders employed in academia, by degree field: 2003 and 2021 |
National Center for Science and Engineering Statistics
|
Survey of Doctorate Recipients
|
|
Figure URD-18
|
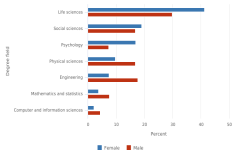
S&E doctorate holders employed in academia, by sex and degree field: 2021 |
National Center for Science and Engineering Statistics
|
Survey of Doctorate Recipients
|
|
Figure URD-19
|
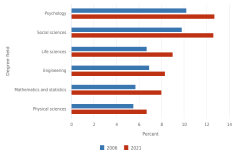
Underrepresented minority S&E doctorate holders employed in academia, by selected degree field: 2006 and 2021 |
National Center for Science and Engineering Statistics
|
Survey of Doctorate Recipients
|
|
Figure URD-20
|
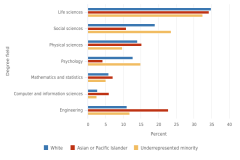
S&E doctorate holders employed in academia, by race or ethnicity and degree field: 2021 |
National Center for Science and Engineering Statistics
|
Survey of Doctorate Recipients
|
|
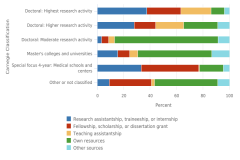
Figure URD-21
|
Primary source of financial support of doctorate recipients, by 2018 Carnegie Classification of institutions: 2021 |
National Center for Science and Engineering Statistics
|
Survey of Earned Doctorates
|
|
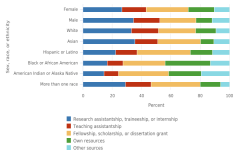
Figure URD-22
|
Primary source of financial support for U.S. citizen and permanent resident S&E doctorate recipients, by sex, race, or ethnicity: 2017–21 |
National Center for Science and Engineering Statistics
|
Survey of Earned Doctorates
|
|
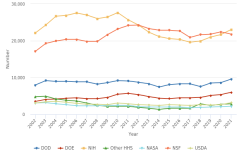
Figure URD-23
|
Full-time graduate students in S&E primarily supported by the federal government, by agency: 2002–21 |
National Center for Science and Engineering Statistics
|
Survey of Graduate Students and Postdoctorates in Science and Engineering
|
|
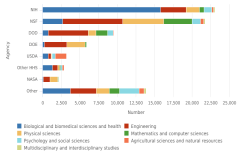
Figure URD-24
|
Full-time graduate students in S&E primarily supported by the federal government, by degree field and agency: 2021 |
National Center for Science and Engineering Statistics
|
Survey of Graduate Students and Postdoctorates in Science and Engineering
|
|
Table URD-1
|
Federal agency support of academic R&D spending: FYs 2012, 2017, and 2021 |
National Center for Science and Engineering Statistics
|
Higher Education Research and Development Survey
|
|
Table URD-2
|
Top 30 institutions, ranked by R&D expenditures: FYs 2001, 2011, and 2021 |
National Center for Science and Engineering Statistics
|
Higher Education Research and Development Survey
|
 An official website of the United States government