 An official website of the United States government
 Data
Tables
Select "VIEW" to see the table. PDF and Excel are available for download.
Figures
Data Sources
DOWNLOAD DATA SOURCES| Item | Title | Provider | Product |
|---|---|---|---|
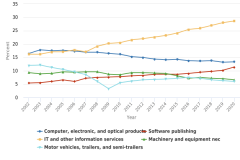
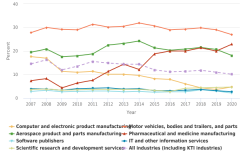
| Figure KTI-1 | Industry share of U.S. total KTI value added, by selected industries: 2002–20 | U.S. Bureau of Economic Analysis | Value Added by Industry |
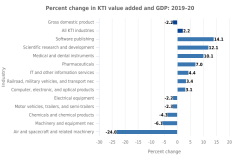
| Figure KTI-2 | Percent change and contribution to percent change in KTI value added: 2019–20 | U.S. Bureau of Economic Analysis | Value Added by Industry |
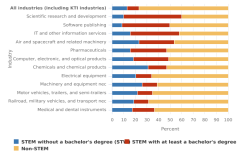
| Figure KTI-3 | Workers in each KTI industry, by workforce and education: 2019 | U.S. Census Bureau | American Community Survey |
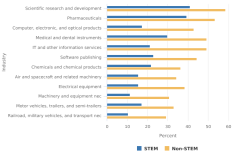
| Figure KTI-4 | Women employed in KTI industries, by workforce: 2019 | U.S. Census Bureau | American Community Survey |
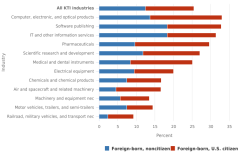
| Figure KTI-5 | Foreign-born STEM workers in each KTI industry, by citizenship: 2019 | U.S. Census Bureau | American Community Survey |
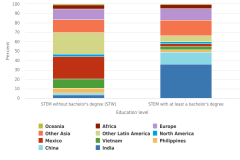
| Figure KTI-6 | Foreign-born KTI workers in STEM occupations, by country or region of birth and education level: 2019 | U.S. Census Bureau | American Community Survey |
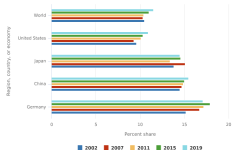
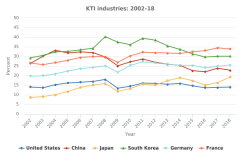
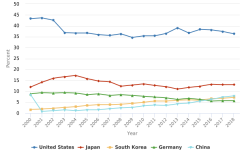
| Figure KTI-7 | KTI value added as a share of domestic GDP for selected countries and years: 2002–19 | IHS Markit | Comparative Industry Service |
| Figure KTI-7 | KTI value added as a share of domestic GDP for selected countries and years: 2002–19 | U.S. Bureau of Economic Analysis | Value Added by Industry |
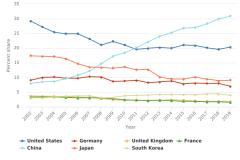
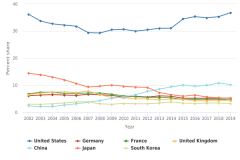
| Figure KTI-8 | Country share of global KTI manufacturing value added for selected countries: 2002–19 | IHS Markit | Comparative Industry Service |
| Figure KTI-8 | Country share of global KTI manufacturing value added for selected countries: 2002–19 | U.S. Bureau of Economic Analysis | Value Added by Industry |
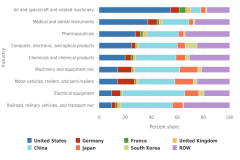
| Figure KTI-9 | Country share of global KTI manufacturing value added, by KTI industry: 2019 | IHS Markit | Comparative Industry Service |
| Figure KTI-9 | Country share of global KTI manufacturing value added, by KTI industry: 2019 | U.S. Bureau of Economic Analysis | Value Added by Industry |
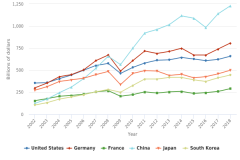
| Figure KTI-10 | Country share of global KTI services value added for selected countries: 2002–19 | IHS Markit | Comparative Industry Service |
| Figure KTI-10 | Country share of global KTI services value added for selected countries: 2002–19 | U.S. Bureau of Economic Analysis | Value Added by Industry |
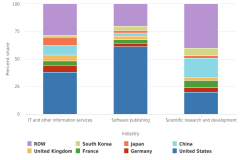
| Figure KTI-11 | Country share of global KTI services value added, by KTI service industry: 2019 | IHS Markit | Comparative Industry Service |
| Figure KTI-11 | Country share of global KTI services value added, by KTI service industry: 2019 | U.S. Bureau of Economic Analysis | Value Added by Industry |
| Figure KTI-12 | Gross exports of KTI industries, by selected country: 2002–18 | Organisation for Economic Co-operation and Development | Trade in Value Added: Principal Indicators |
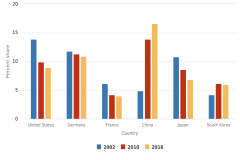
| Figure KTI-13 | Country share of global KTI exports, by selected countries: 2002, 2010, and 2018 | Organisation for Economic Co-operation and Development | Trade in Value Added: Principal Indicators |
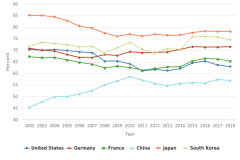
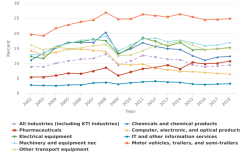
| Figure KTI-14 | KTI manufacturing exports as a share of all manufacturing exports, by selected country: 2002–18 | Organisation for Economic Co-operation and Development | Trade in Value Added: Principal Indicators |
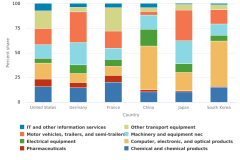
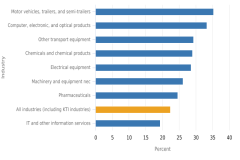
| Figure KTI-15 | Industry composition of country KTI exports for selected countries: 2018 | Organisation for Economic Co-operation and Development | Trade in Value Added: Principal Indicators |
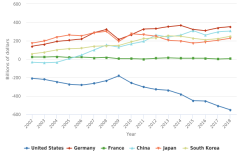
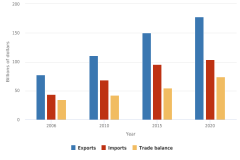
| Figure KTI-16 | KTI trade balance, by selected country: 2002–18 | Organisation for Economic Co-operation and Development | Trade in Value Added: Principal Indicators |
| Figure KTI-17 | Exports, imports, and trade balance of KTI services for the United States: Selected years, 2006–20 | U.S. Bureau of Economic Analysis | International Services |
| Figure KTI-18 | Average foreign value-added share of KTI and total gross exports for selected countries: 2002–18 | Organisation for Economic Co-operation and Development | Trade in Value Added: Principal Indicators |
| Figure KTI-19 | Average foreign value-added share of global KTI gross exports, by KTI industry: 2018 | Organisation for Economic Co-operation and Development | Trade in Value Added: Principal Indicators |
| Figure KTI-20 | Foreign value added share of U.S. gross exports for KTI industries: 2002–18 | Organisation for Economic Co-operation and Development | Trade in Value Added: Principal Indicators |
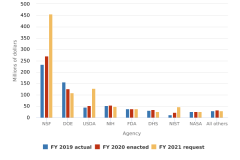
| Figure KTI-21 | U.S. federal R&D in AI, by selected agency: FYs 2019–21 | National Science and Technology Council | Networking and Information Technology Research and Development Program (NITRD) |
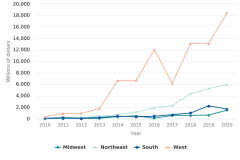
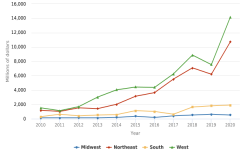
| Figure KTI-22 | AI-related venture capital funding, by U.S. region: 2010–20 | PitchBook | Venture Capital and Private Equity Database |
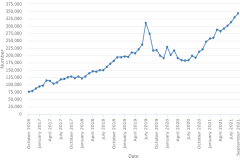
| Figure KTI-23 | Total AI-related job postings in the United States: October 2016–September 2021 | Emsi Burning Glass | Job Posting Analytics |
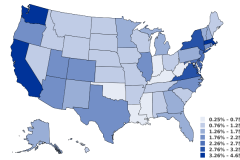
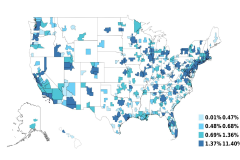
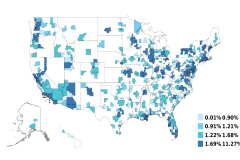
| Figure KTI-24 | Unique AI-related job postings as a share of all unique job postings, by state: October 2016–September 2021 | Emsi Burning Glass | Job Posting Analytics |
| Figure KTI-25 | Unique AI-related job postings as a share of all unique job postings, by selected metropolitan statistical areas: October 2016–September 2021 | Emsi Burning Glass | Job Posting Analytics |
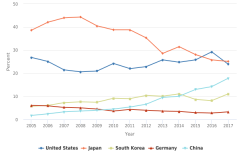
| Figure KTI-26 | Country share of AI-related patents, by top 5 countries: 2005–17 | Organisation for Economic Co-operation and Development | Intellectual property (IP) statistics and analysis |
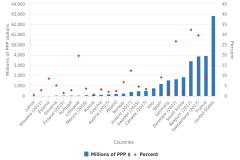
| Figure KTI-27 | Biotechnology R&D expenditures and biotechnology R&D expenditures as a share of total domestic R&D for reporting OECD countries, by country: 2018 or latest year available | Organisation for Economic Co-operation and Development | Key Biotechnology Indicators |
| Figure KTI-27 | Biotechnology R&D expenditures and biotechnology R&D expenditures as a share of total domestic R&D for reporting OECD countries, by country: 2018 or latest year available | Organisation for Economic Co-operation and Development | Main Science and Technology Indicators |
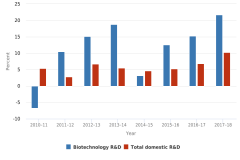
| Figure KTI-28 | Annual change in biotechnology R&D performance and total domestic R&D performance: 2010–18 | National Center for Science and Engineering Statistics | Business R&D and Innovation Survey |
| Figure KTI-28 | Annual change in biotechnology R&D performance and total domestic R&D performance: 2010–18 | National Center for Science and Engineering Statistics | Business Research and Development Survey |
| Figure KTI-29 | Biotechnology-related venture capital funding, by U.S. region: 2010–20 | PitchBook | Venture Capital and Private Equity Database |
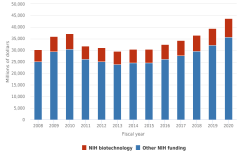
| Figure KTI-30 | National Institutes of Health obligations for biotechnology and other funding: FYs 2008–20 | National Institutes of Health | NIH RePORTER |
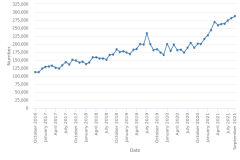
| Figure KTI-31 | Total biotechnology-related job postings in the United States: October 2016–September 2021 | Emsi Burning Glass | Job Posting Analytics |
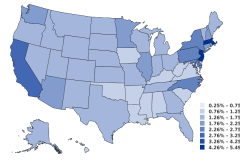
| Figure KTI-32 | Unique biotechnology-related job postings as a share of all unique job postings, by state: October 2016–September 2021 | Emsi Burning Glass | Job Posting Analytics |
| Figure KTI-33 | Unique biotechnology-related job postings as a share of all unique job postings, by metropolitan statistical area: October 2016–September 2021 | Emsi Burning Glass | Job Posting Analytics |
| Figure KTI-34 | Country share of biotechnology-related patents, based on the new biotechnology definition, by top 5 countries: 2000–18 | Organisation for Economic Co-operation and Development | Intellectual property (IP) statistics and analysis |
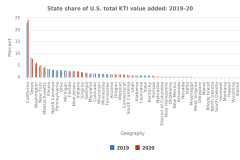
| Figure KTI-A | State share of U.S. total KTI value added and per capita state total KTI value added: 2019–20 | U.S. Bureau of Economic Analysis | Annual Gross Domestic Product (GDP) by State |
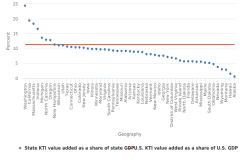
| Figure KTI-B | KTI value added as a share of U.S. and state GDP: 2020 | U.S. Bureau of Economic Analysis | Annual Gross Domestic Product (GDP) by State |
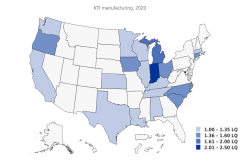
| Figure KTI-C | Specialization in KTI industry production, by state: 2020 | U.S. Bureau of Economic Analysis | Annual Gross Domestic Product (GDP) by State |
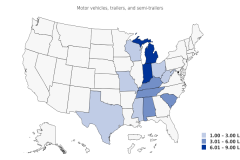
| Figure KTI-D | Specialization in production for two selected industries, by state: 2020 | U.S. Bureau of Economic Analysis | Annual Gross Domestic Product (GDP) by State |
| Figure KTI-E | Imported content share of gross exports by U.S. KTI industry: 2007–20 | U.S. Bureau of Economic Analysis | Global Value Chains |
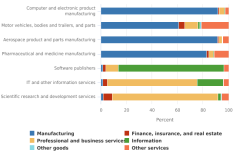
| Figure KTI-F | Domestic value-added content of gross exports, by exporting KTI industry and source sector: 2020 | U.S. Bureau of Economic Analysis | Global Value Chains |
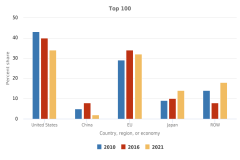
| Figure KTI-G | Top-ranked supercomputers, by region, country, or economy: Selected years, 2010–21 | TOP500 | TOP500 Lists |
| Table KTI-1 | U.S. KTI industries, by value added and share of GDP: 2019 and 2020 | U.S. Bureau of Economic Analysis | Value Added by Industry |
| Table KTI-2 | Annual rates of change in U.S. KTI value added and GDP: 2002–20 | U.S. Bureau of Economic Analysis | Value Added by Industry |
| Table KTI-3 | Global KTI industries, by value added and share of global GDP: 2019 | IHS Markit | Comparative Industry Service |
| Table KTI-3 | Global KTI industries, by value added and share of global GDP: 2019 | U.S. Bureau of Economic Analysis | Value Added by Industry |
| Table SAKTI-1 | OECD classification of industries, by R&D intensity | Organisation for Economic Co-operation and Development | OECD Taxonomy of Economic Activities Based on R&D Intensity |
| Table SAKTI-2 | 2012 NAICS to ISIC, Rev.4, concordance for U.S. value added, by industry data | U.S. Census Bureau | North American Industry Classification System Concordances |
| Table SAKTI-3 | Concordance for KTI employment data | U.S. Census Bureau | North American Industry Classification System Concordances |
| Table SKTI-1 | U.S. KTI industry value added: 2002–20 | U.S. Bureau of Economic Analysis | Value Added by Industry |
| Table SKTI-2 | Employment in KTI industries, by workforce and education: 2019 | U.S. Census Bureau | American Community Survey |
| Table SKTI-3 | Employment in each workforce and KTI industry, by sex, race or ethnicity, and nativity and citizenship: 2019 | U.S. Census Bureau | American Community Survey |
| Table SKTI-4 | Regions, countries, or economies in world industry data | IHS Markit | Comparative Industry Service |
| Table SKTI-5 | Value added of KTI industries, by region, country, or economy: 2002–19 | IHS Markit | Comparative Industry Service |
| Table SKTI-5 | Value added of KTI industries, by region, country, or economy: 2002–19 | U.S. Bureau of Economic Analysis | Value Added by Industry |
| Table SKTI-6 | Value added of KTI manufacturing industries, by region, country, or economy: 2002–19 | IHS Markit | Comparative Industry Service |
| Table SKTI-6 | Value added of KTI manufacturing industries, by region, country, or economy: 2002–19 | U.S. Bureau of Economic Analysis | Value Added by Industry |
| Table SKTI-7 | Value added of KTI services industries, by region, country, or economy: 2002–19 | IHS Markit | Comparative Industry Service |
| Table SKTI-7 | Value added of KTI services industries, by region, country, or economy: 2002–19 | U.S. Bureau of Economic Analysis | Value Added by Industry |
| Table SKTI-8 | Value added of chemicals and chemical products industry, by region, country, or economy: 2002–19 | IHS Markit | Comparative Industry Service |
| Table SKTI-8 | Value added of chemicals and chemical products industry, by region, country, or economy: 2002–19 | U.S. Bureau of Economic Analysis | Value Added by Industry |
| Table SKTI-9 | Value added of pharmaceuticals industry, by region, country, or economy: 2002–19 | IHS Markit | Comparative Industry Service |
| Table SKTI-9 | Value added of pharmaceuticals industry, by region, country, or economy: 2002–19 | U.S. Bureau of Economic Analysis | Value Added by Industry |
| Table SKTI-10 | Value added of computer, electronic, and optical products industry, by region, country, or economy: 2002–19 | IHS Markit | Comparative Industry Service |
| Table SKTI-10 | Value added of computer, electronic, and optical products industry, by region, country, or economy: 2002–19 | U.S. Bureau of Economic Analysis | Value Added by Industry |
| Table SKTI-11 | Value added of electrical equipment industry, by region, country, or economy: 2002–19 | IHS Markit | Comparative Industry Service |
| Table SKTI-11 | Value added of electrical equipment industry, by region, country, or economy: 2002–19 | U.S. Bureau of Economic Analysis | Value Added by Industry |
| Table SKTI-12 | Value added of machinery and equipment industry, by region, country, or economy: 2002–19 | IHS Markit | Comparative Industry Service |
| Table SKTI-12 | Value added of machinery and equipment industry, by region, country, or economy: 2002–19 | U.S. Bureau of Economic Analysis | Value Added by Industry |
| Table SKTI-13 | Value added of motor vehicles, trailers, and semi-trailers industry, by region, country, or economy: 2002–19 | IHS Markit | Comparative Industry Service |
| Table SKTI-13 | Value added of motor vehicles, trailers, and semi-trailers industry, by region, country, or economy: 2002–19 | U.S. Bureau of Economic Analysis | Value Added by Industry |
| Table SKTI-14 | Value added of air and spacecraft and related machinery industry, by region, country, or economy: 2002–19 | IHS Markit | Comparative Industry Service |
| Table SKTI-14 | Value added of air and spacecraft and related machinery industry, by region, country, or economy: 2002–19 | U.S. Bureau of Economic Analysis | Value Added by Industry |
| Table SKTI-15 | Value added of railroad, military vehicles, and other transport industry, by region, country, or economy: 2002–19 | IHS Markit | Comparative Industry Service |
| Table SKTI-15 | Value added of railroad, military vehicles, and other transport industry, by region, country, or economy: 2002–19 | U.S. Bureau of Economic Analysis | Value Added by Industry |
| Table SKTI-16 | Value added of medical and dental instruments industry, by region, country, or economy: 2002–19 | IHS Markit | Comparative Industry Service |
| Table SKTI-16 | Value added of medical and dental instruments industry, by region, country, or economy: 2002–19 | U.S. Bureau of Economic Analysis | Value Added by Industry |
| Table SKTI-17 | Value added of IT and other information services industry, by region, country, or economy: 2002–19 | IHS Markit | Comparative Industry Service |
| Table SKTI-17 | Value added of IT and other information services industry, by region, country, or economy: 2002–19 | U.S. Bureau of Economic Analysis | Value Added by Industry |
| Table SKTI-18 | Value added of software publishing industry, by region, country, or economy: 2002–19 | IHS Markit | Comparative Industry Service |
| Table SKTI-18 | Value added of software publishing industry, by region, country, or economy: 2002–19 | U.S. Bureau of Economic Analysis | Value Added by Industry |
| Table SKTI-19 | Value added of scientific research and development industry, by region, country, or economy: 2002–19 | IHS Markit | Comparative Industry Service |
| Table SKTI-19 | Value added of scientific research and development industry, by region, country, or economy: 2002–19 | U.S. Bureau of Economic Analysis | Value Added by Industry |
| Table SKTI-20 | Exports and imports of KTI industries for select countries: 2002–18 | Organisation for Economic Co-operation and Development | Trade in Value Added: Principal Indicators |
| Table SKTI-21 | Total AI venture capital raised, by selected country and region: 2000–20 | PitchBook | Venture Capital and Private Equity Database |
| Table SKTI-22 | AI-related venture capital funding, by U.S. state and region: 2010–20 | PitchBook | Venture Capital and Private Equity Database |
| Table SKTI-23 | Unique AI-related job postings as a share of all unique job postings, by state: October 2016–September 2021 | Emsi Burning Glass | Job Posting Analytics |
| Table SKTI-24 | Total biotechnology venture capital raised, by selected country and region: 2000–20 | PitchBook | Venture Capital and Private Equity Database |
| Table SKTI-25 | Biotechnology-related venture capital funding, by U.S. state and region: 2010–20 | PitchBook | Venture Capital and Private Equity Database |
| Table SKTI-26 | Unique biotechnology-related job postings as a share of all unique job postings, by state: October 2016–September 2021 | Emsi Burning Glass | Job Posting Analytics |