 An official website of the United States government
 Enabling Technologies
Enabling technologies are discoveries arising from advanced S&E activity that allow the creation or improvement of products and services across a wide product scope (Teece 2016). Given the ability for these technologies to reshape existing markets, identifying their role and prevalence within regional economies is important for determining economic growth potential in emerging KTI industries. For example, according to the European Commission’s (EC’s) Joint Research Centre, regional specialization in key enabling technologies—that is, technologies identified by EC as drivers of future economic competitiveness, such as industrial biotechnology and nanotechnologies—directly affects economic growth, while specialization in fast-growing technologies increases economic growth only through downstream effects on a region’s innovation performance (e.g., patents) (Evangelista, Meliciani, and Vezzani 2015; Montresor and Quatraro 2015).
AI and biotechnology are two enabling technologies that are essential drivers of U.S. economic activity and competitiveness. For example, biotechnology has been key to the development of coronavirus research and COVID-19 vaccines (see 2022 Indicators reports, “Invention, Knowledge Transfer, and Innovation” and “Publications Output: U.S. Trends and International Comparisons,” for information on the COVID-19 vaccine development). Although both of these enabling technologies have been important to U.S. economic growth, they differ in terms of development and use throughout the U.S. economy.
In this section, the roles of AI and biotechnology in the U.S. economy are analyzed to identify trends that indicate regional economic competitiveness related to these technologies. The analysis focuses on three primary lenses for each technology: (1) investment at the global and national level, (2) demand for workers with technology-related skills, and (3) patents. Additional analysis is performed on the adoption of AI technologies within U.S. businesses and on the economic impacts of biotechnology. Where possible, comparisons are made between the use of these technologies in the United States and other countries.
Artificial Intelligence (AI)
A core objective of AI research and technologies is to automate or replicate human learning and cognition (EOP/NSTC 2016). AI technologies are rapidly integrating machine learning with increasingly available data, and these changes are predicted to have profound implications for the economy and society, with influences on both the production and characteristics of a wide range of products and services—and also on the nature of work (Cockburn, Henderson, and Stern 2018; WIPO 2019). These rapid changes are widely expected to have significant and long-term economic and technological effects on society, including sectors and occupations not historically impacted by technology.
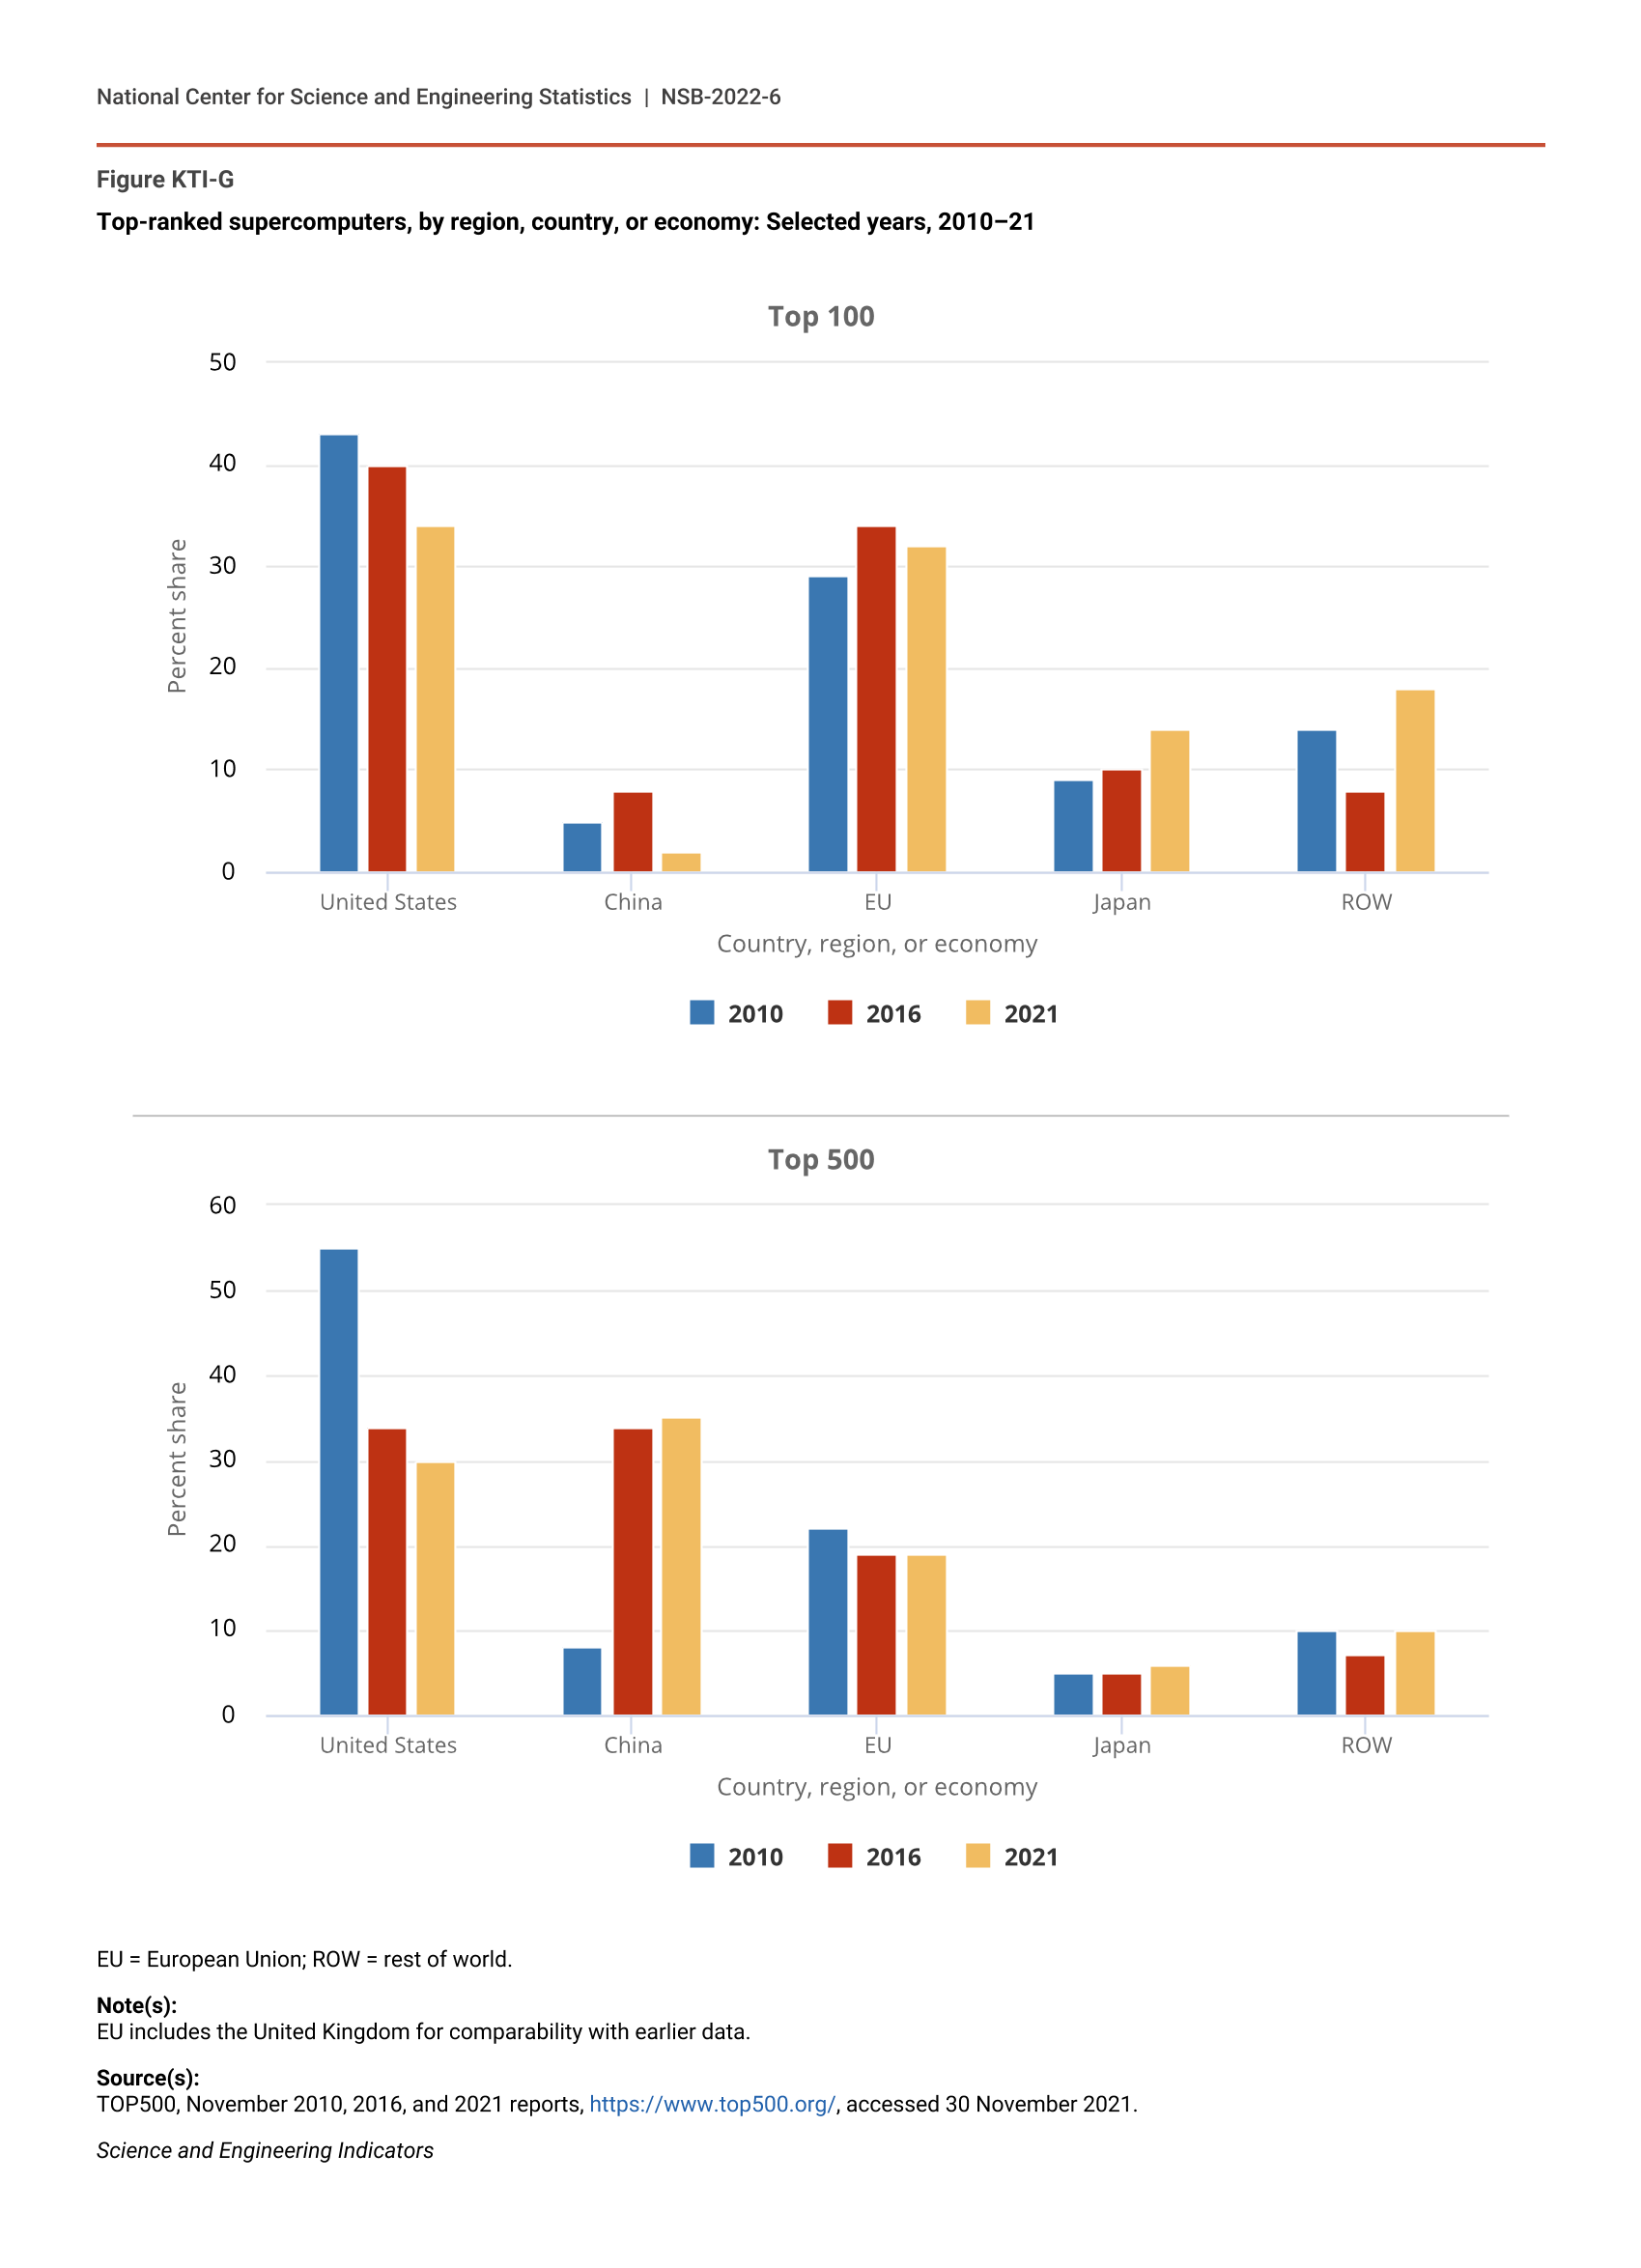
AI research areas and technologies include machine learning, autonomous robotics and vehicles, computable statistics, computer vision, language processing, virtual agents, and neural networks (Furman and Seamans 2018). The expanded use of machine learning and other AI technologies has increased the demand for high-performance computing to improve the velocity and efficiency of AI systems, including training of multitasking AI models. In addition to supporting development of AI, supercomputers are also increasingly using AI to help researchers make discoveries faster. Through better ways of analyzing the present and predicting the future, AI and supercomputing capabilities have the potential to provide solutions for many societal challenges and to facilitate advances in many fields (see sidebar Trends in High-Performance Computing).
Although the application of AI has the potential to enhance productivity across many fields and, ultimately, to improve economic welfare for many, AI also has the potential to exacerbate already existing inequalities in the United States. AI innovations result in pronounced advantages for individuals and organizations that can capitalize on this technology and in disadvantages for individuals and organizations who lack the necessary technological skills to harness it effectively. This creates a digital divide between those that have AI and those that do not (Carter, Liu, and Cantrell 2020). For example, some firms may be better placed than others to develop or deploy AI. Moreover, if the gains of AI accrue to a small number of superstar innovators or firms with excessive market power, this could produce a divide between innovators and workers—and, thus, further reinforce the potentially negative impact of AI on inequality (Lane and Saint-Martin 2021). AI applications have also been found to perpetuate social biases and stereotypes by finding patterns within data sets that reflect implicit biases and then emphasize and reinforce these biases as global truth. For example, AI-powered advertisements in search engines have been found to display far fewer ads for high-paying executive jobs to women than to men (Howard and Borenstein 2018).
Investment in AI
Global Trends
AI startups depend heavily on venture capital financing; data on venture capital show emerging areas where investors see potential commercial impacts. Over the past decade, venture capital funding in AI grew rapidly, increasing from around $726 million in 2010 to $54 billion in 2020. In 2020, about 82% of global AI venture capital funding went to startups in the United States and China (Table SKTI-21). Europe also accounted for a significant share of global venture capital funding for AI (9%) although less than the United States (51%) and China (31%).
Flows of venture capital funding in AI to China have been unstable over the past decade when compared to those of the United States. Although venture funding for AI in China surpassed that of the United States in 2017–18, it fell significantly in 2019, from $21 billion to $8 billion. This sharp decline is consistent with an overall decline in venture capital funding in China (for more details, see 2022 Indicators report, “Invention, Knowledge Transfer, and Innovation”). In contrast, AI venture funding in the United States grew more consistently during this time, reaching $28 billion in 2020 and accounting for slightly more than half of the global total.
Companies in AI and other emerging technologies also depend on two other forms of financing—private equity, and mergers and acquisitions (M&A)—to continue growing and to commercialize their technology with the goal of becoming a publicly listed company that receives funding from public and institutional investors. Arnold, Rahkovsky, and Huang (2020) constructed a data set to capture total earlier-stage investment in AI firms—venture capital, private equity, and M&A. These data provide a rough estimate of the total amount of financing into AI firms.
According to these data, combined worldwide investment in venture capital, private equity, and M&A more than doubled from $28 billion in 2015 to $74 billion in 2019. The United States attracted more than half of this investment at $47 billion (64% of the global share). China was the second-largest recipient of this funding, receiving $7 billion, half its level in 2018 and far below the United States. U.S. companies received more AI investment and are most active in AI applications of business services and analytics, general purpose applications, and medicine and life sciences. In contrast, Chinese companies are active in areas such as security and biometrics (including facial recognition), arts and leisure (including personal social media platforms), and transportation (Arnold, Rahkovsky, and Huang 2020).
U.S. Trends
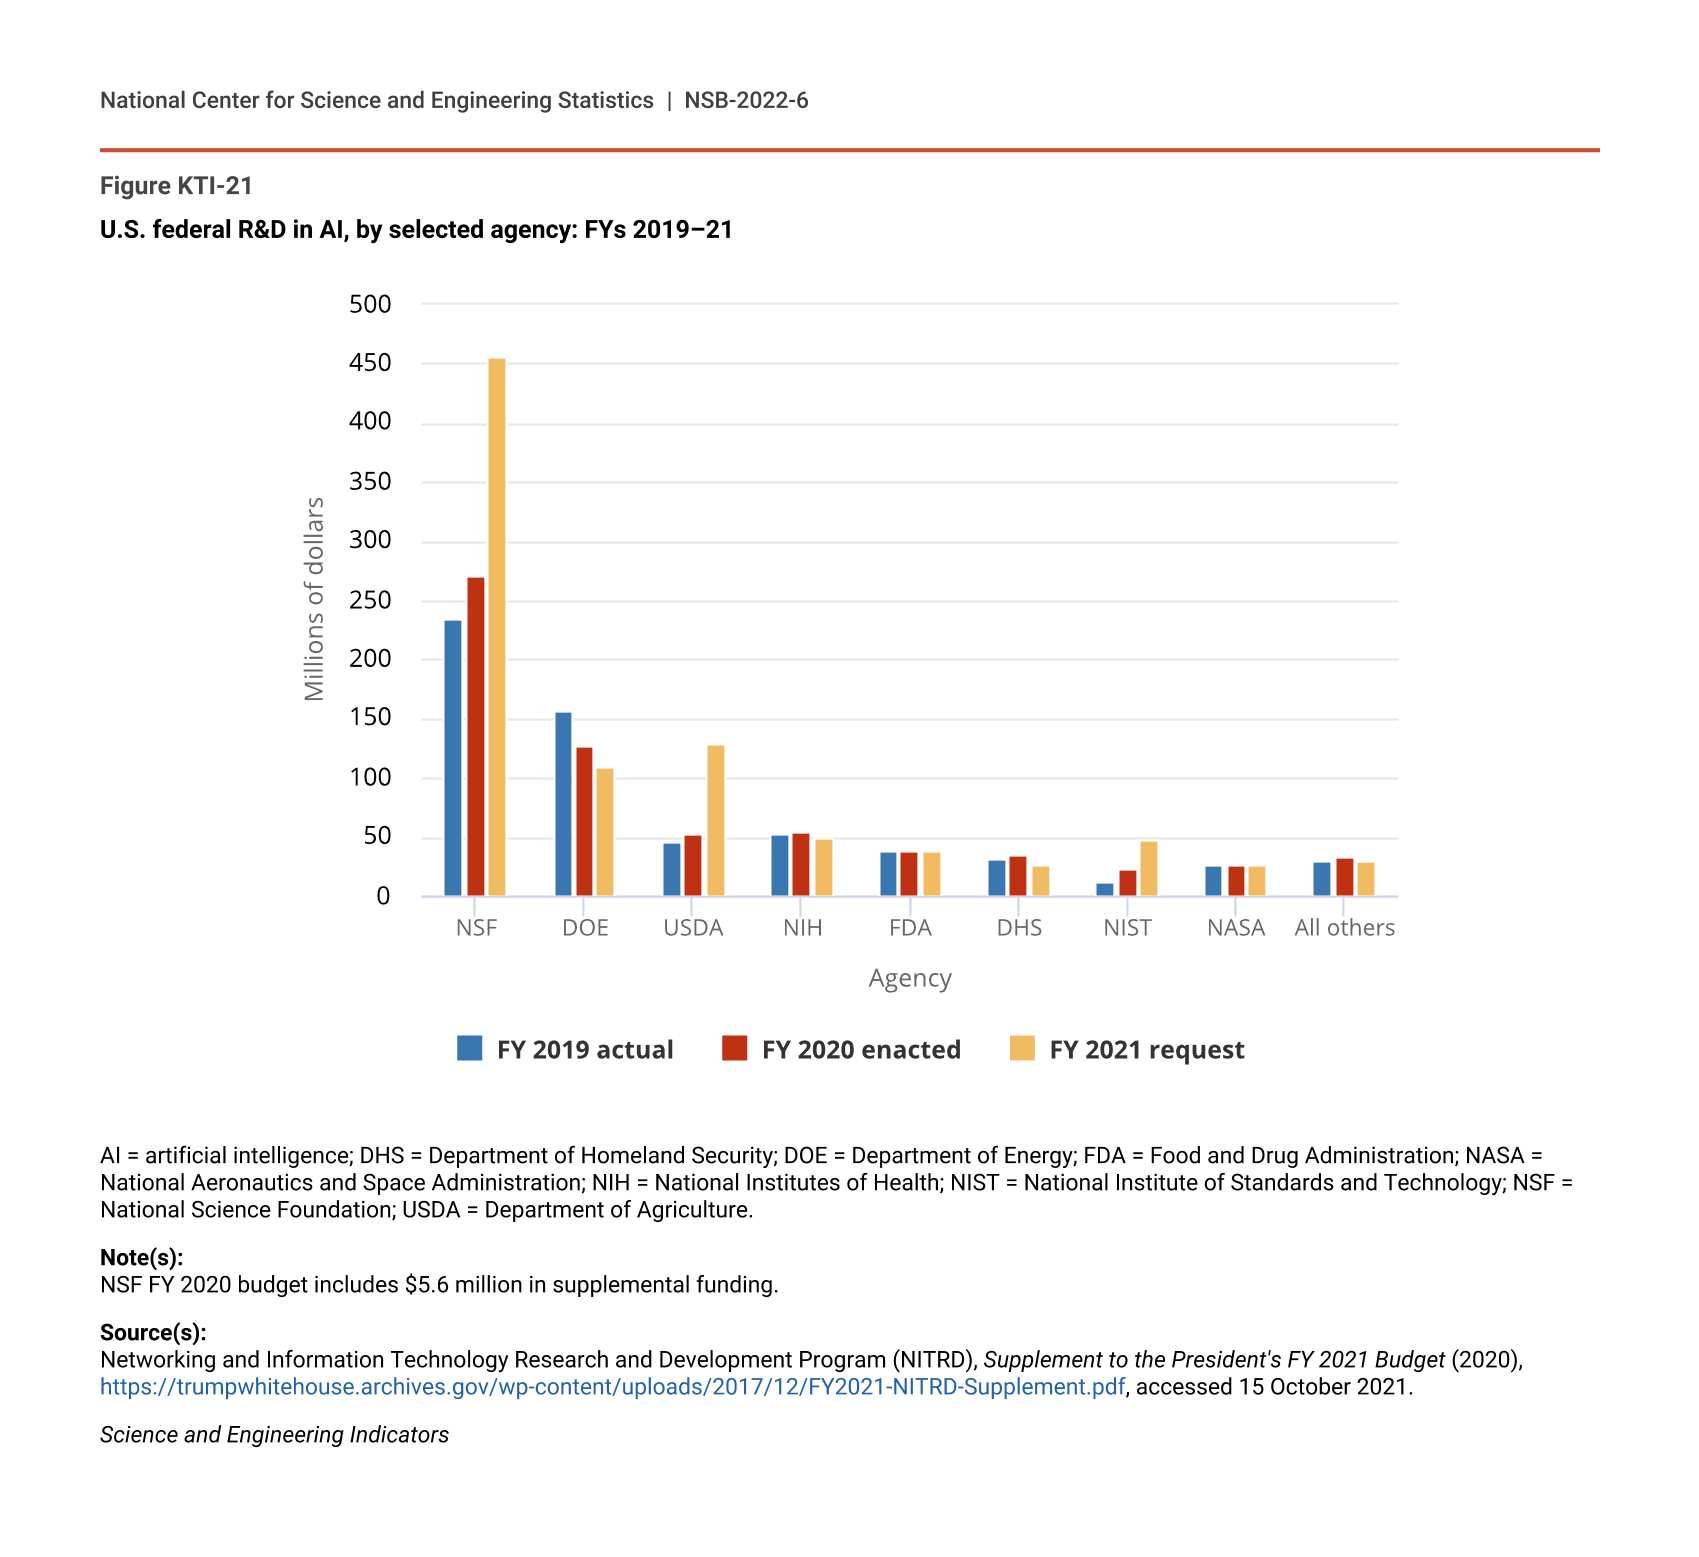
The U.S. federal government invested an estimated $1.1 billion in funding nonmilitary AI in FY 2020, 15% higher compared to FY 2019, according to the Networking and Information Technology Research and Development (NITRD), a federal program that coordinates the activities of multiple agencies to tackle multidisciplinary, multitechnology, and multisector R&D needs (NITRD 2021). The $1.1 billion in AI R&D in FY 2020 consists of $670 million in R&D that is explicitly identified as directly applicable to AI and of $350 million in R&D that is related to AI but may have a primary classification in a non-AI technology. Four federal departments and agencies—the National Science Foundation, the Department of Energy (DOE), the Department of Agriculture (USDA), and National Institutes of Health (NIH)—accounted collectively for more than three-quarters of the direct AI funding in FYs 2019–20 (Figure KTI-21). These estimates do not include substantial R&D investments in military and intelligence applications, which are not disclosed to the public.
U.S. federal R&D in AI, by selected agency: FYs 2019–21
| Agency | FY 2019 actual | FY 2020 enacted | FY 2021 request |
|---|---|---|---|
| NSF | 235.0 | 270.5 | 456.8 |
| DOE | 156.3 | 126.8 | 109.3 |
| USDA | 45.1 | 53.2 | 127.9 |
| NIH | 52.0 | 53.9 | 49.4 |
| FDA | 39.0 | 39.0 | 38.0 |
| DHS | 31.3 | 34.5 | 26.6 |
| NIST | 12.7 | 22.1 | 47.1 |
| NASA | 26.3 | 26.3 | 26.3 |
| All others | 30.0 | 34.2 | 30.6 |
AI = artificial intelligence; DHS = Department of Homeland Security; DOE = Department of Energy; FDA = Food and Drug Administration; NASA = National Aeronautics and Space Administration; NIH = National Institutes of Health; NIST = National Institute of Standards and Technology; NSF = National Science Foundation; USDA = Department of Agriculture.
Note(s):
NSF FY 2020 budget includes $5.6 million in supplemental funding.
Source(s):
Networking and Information Technology Research and Development Program (NITRD), Supplement to the President's FY 2021 Budget (2020), https://trumpwhitehouse.archives.gov/wp-content/uploads/2017/12/FY2021-NITRD-Supplement.pdf, accessed 15 October 2021.
Science and Engineering Indicators
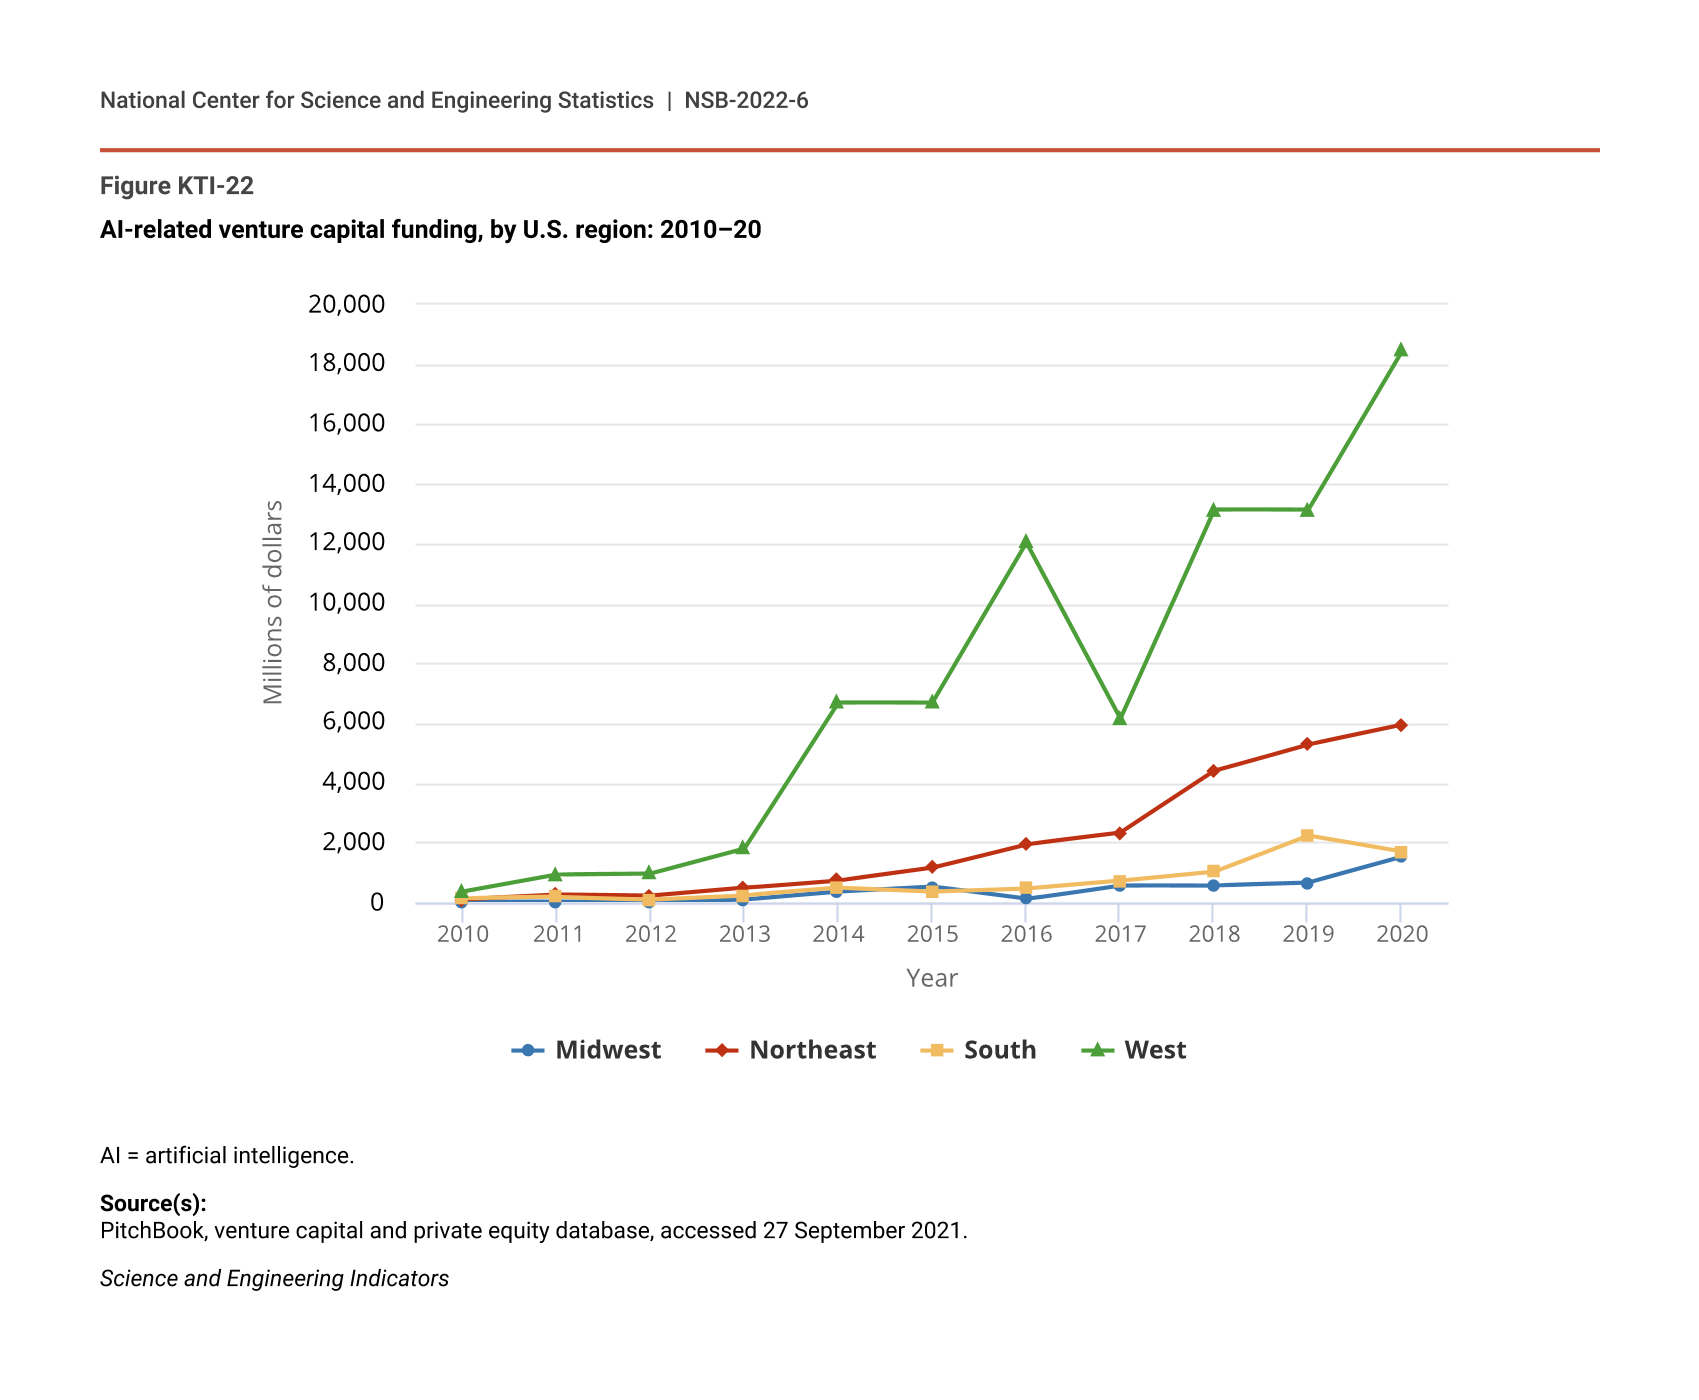
In addition to federal funding, venture capital remains critically important for AI-related firms in the United States. Between 2010 and 2020, total venture investments in U.S. AI startups grew from $598.1 million to $27.6 billion, with a compound annual growth rate of 47% (Table SKTI-22). While growth in AI venture funding has been ubiquitous throughout the United States, different regions and states have seen varying levels of growth over the past several years.
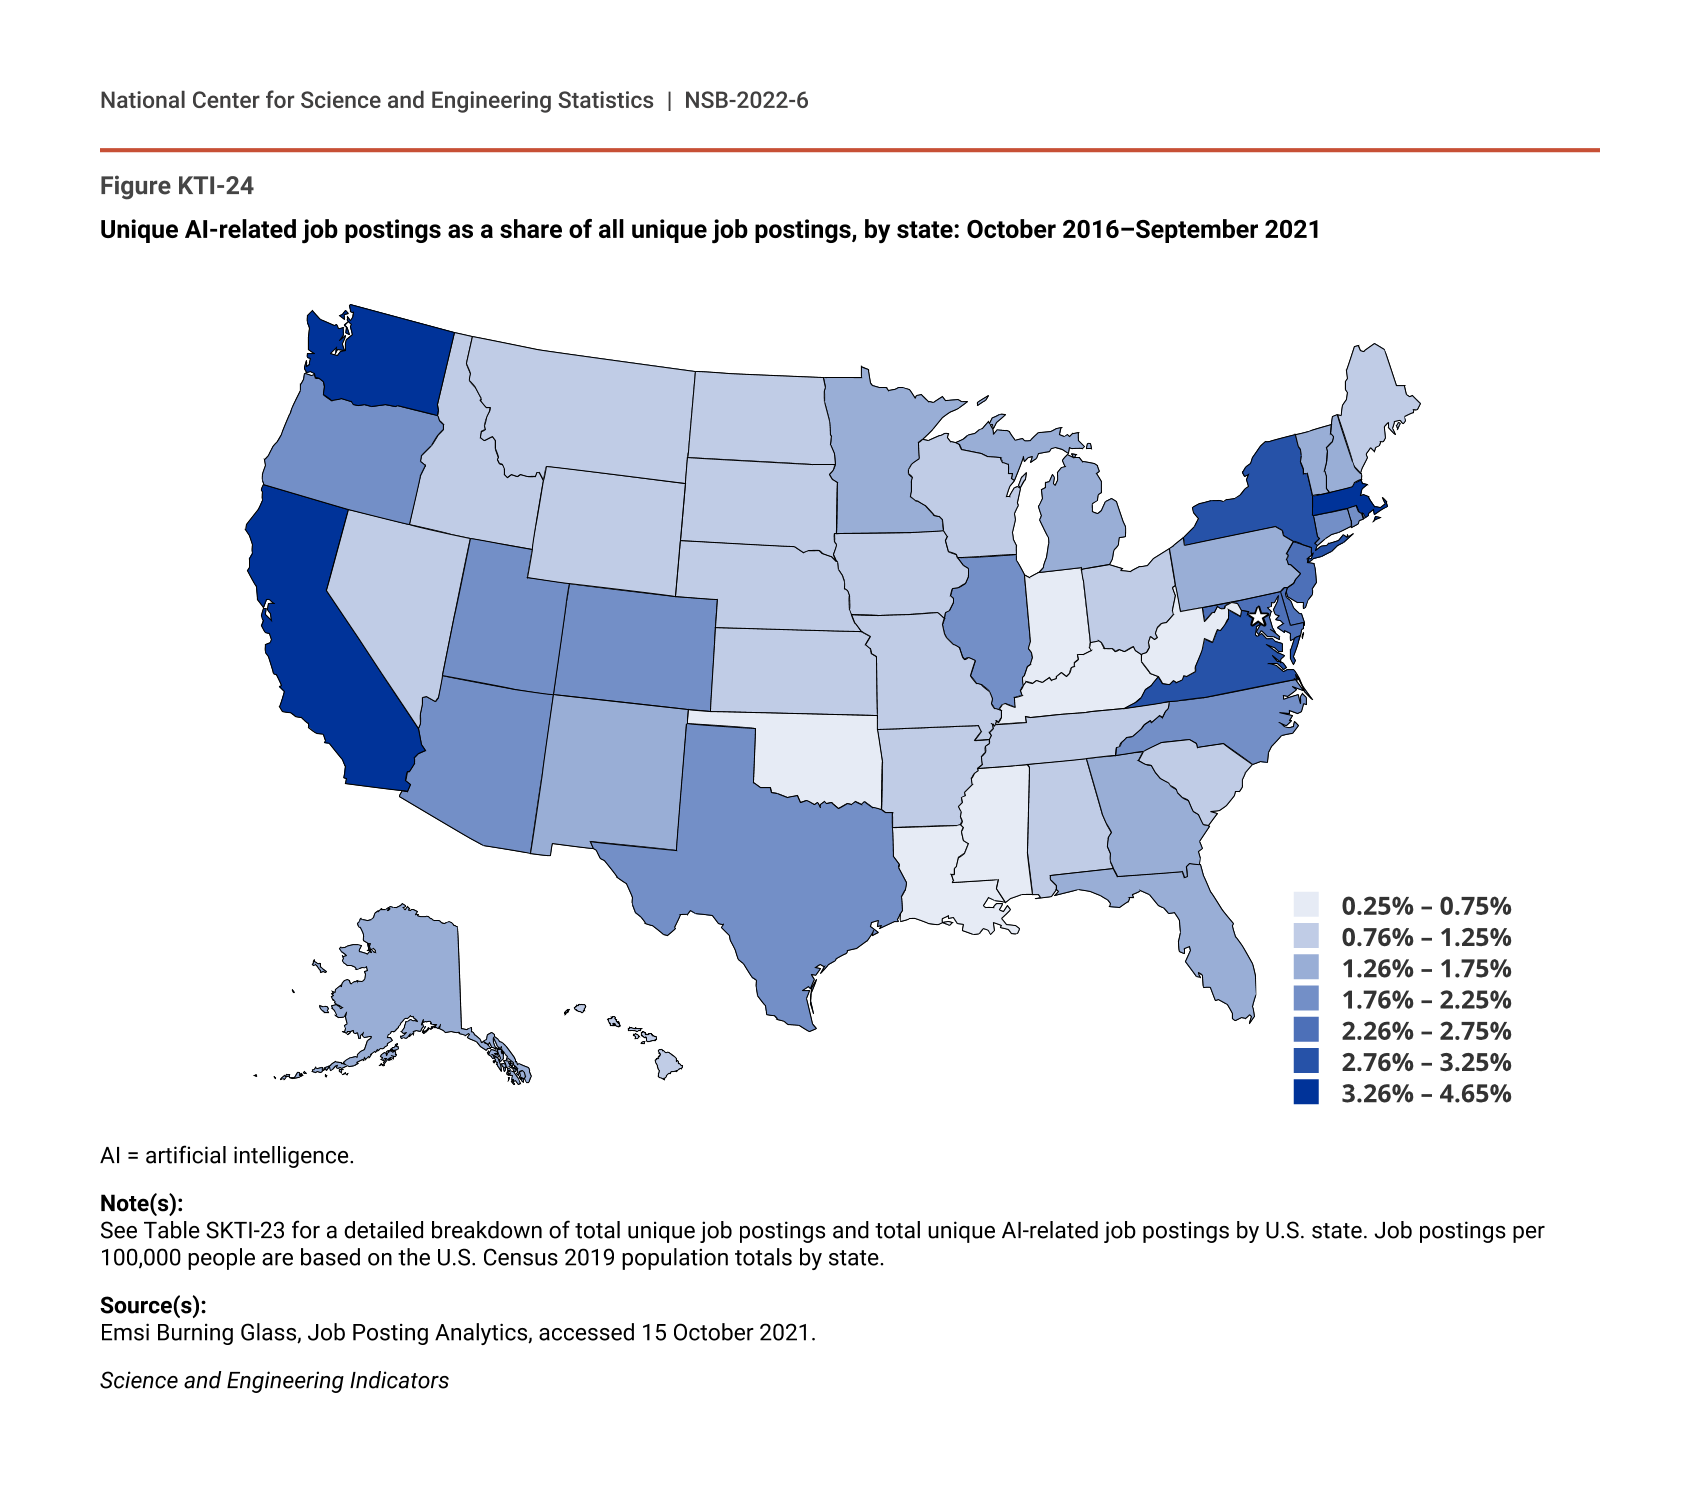
The concentration and growth of venture capital financing in AI across Census regions has been uneven over the past decade. The Western United States continues to attract the vast majority of AI venture capital financing in the United States (Figure KTI-22; Table SKTI-22). Of the more than $115 billion in AI venture funding raised in the United States between 2010 and 2020, $80.3 billion (70%) flowed to the West—in particular, to California ($71.8 billion). The Northeast received the next-highest portion of total U.S. AI venture capital ($22.8 billion, or 20%), with New York ($11.9 billion) and Massachusetts ($8.2 billion) receiving the most in the region. The dominance of the Northeast and the West in attracting venture capital funding is consistent with these regions producing the most KTI output. Smaller amounts flowed to states in the South ($7.6 billion, or 7%) and the Midwest ($4.4 billion, or 4%).
AI-related venture capital funding, by U.S. region: 2010–20
| Year | Midwest | Northeast | South | West |
|---|---|---|---|---|
| 2010 | 5.62 | 100.50 | 131.27 | 360.74 |
| 2011 | 12.37 | 255.97 | 175.55 | 930.11 |
| 2012 | 18.92 | 214.33 | 101.15 | 957.58 |
| 2013 | 83.74 | 483.48 | 235.59 | 1,792.05 |
| 2014 | 348.58 | 733.73 | 479.54 | 6,678.18 |
| 2015 | 514.79 | 1,162.97 | 353.33 | 6,669.44 |
| 2016 | 107.46 | 1,941.26 | 452.97 | 12,023.68 |
| 2017 | 570.56 | 2,320.76 | 715.72 | 6,137.93 |
| 2018 | 563.02 | 4,388.45 | 1,025.10 | 13,133.65 |
| 2019 | 653.60 | 5,271.26 | 2,237.87 | 13,125.04 |
| 2020 | 1,512.80 | 5,928.71 | 1,698.39 | 18,459.48 |
AI = artificial intelligence.
Source(s):
PitchBook, venture capital and private equity database, accessed 27 September 2021.
Science and Engineering Indicators
While the Northeast and the West attracted the most venture capital funding in AI on a per-dollar basis, this investment grew the most in the Midwest from a low starting position between 2010 and 2020. AI-related venture capital in the United States grew, on average, 47% per year, while investments in the West (48%) and the Northeast (50%) grew a few percentage points faster. In the Midwest, however, AI venture investing grew on average 75% per year, exceeding that of the other regions and the nation. Although the South raised more AI venture capital than the Midwest between 2010 and 2020, it grew 29% per year. Because of its comparatively faster growth, the AI venture capital in the Midwest is catching up to the South. For example, the Midwest and the South began the decade with significantly different levels of financing ($5.6 million and $131.3 million, respectively), but by 2020, both regions were attracting similar amounts ($1.5 billion and $1.7 billion, respectively). Additionally, unlike the composition of investment growth in the West and the Northeast, where investments are concentrated in one or two states, both the Midwest and the South see a greater number of states attracting notable levels of funding. States like Illinois, Ohio, and Minnesota account for a larger share of growth in the Midwest, while states like Texas, Virginia, Georgia, and Florida fueled growth in the South.
AI Patents
AI capabilities include patenting and innovation activities and publications related to AI technologies. This section analyzes trends in patenting activities across countries and over time. Trends in patent application filings and publications help to show the increasing prevalence of a technology in an economy over time. A detailed discussion of publications related to AI can be found in the 2020 Indicators report “Production and Trade of Knowledge- and Technology-Intensive Industries.”
The United States Patent and Trademark Office (USPTO) collects data on invention filings for AI-related technologies. A 2020 paper released by the USPTO finds that, between 2002 and 2018, annual filings for AI patent applications increased by more than 100% in the United States, while the share of all patent applications containing AI grew from 9% to 16% (Toole et al. 2020). These data indicate a growing intensity of AI in the U.S. economy, with more inventions filed in the United States making use of the technology.
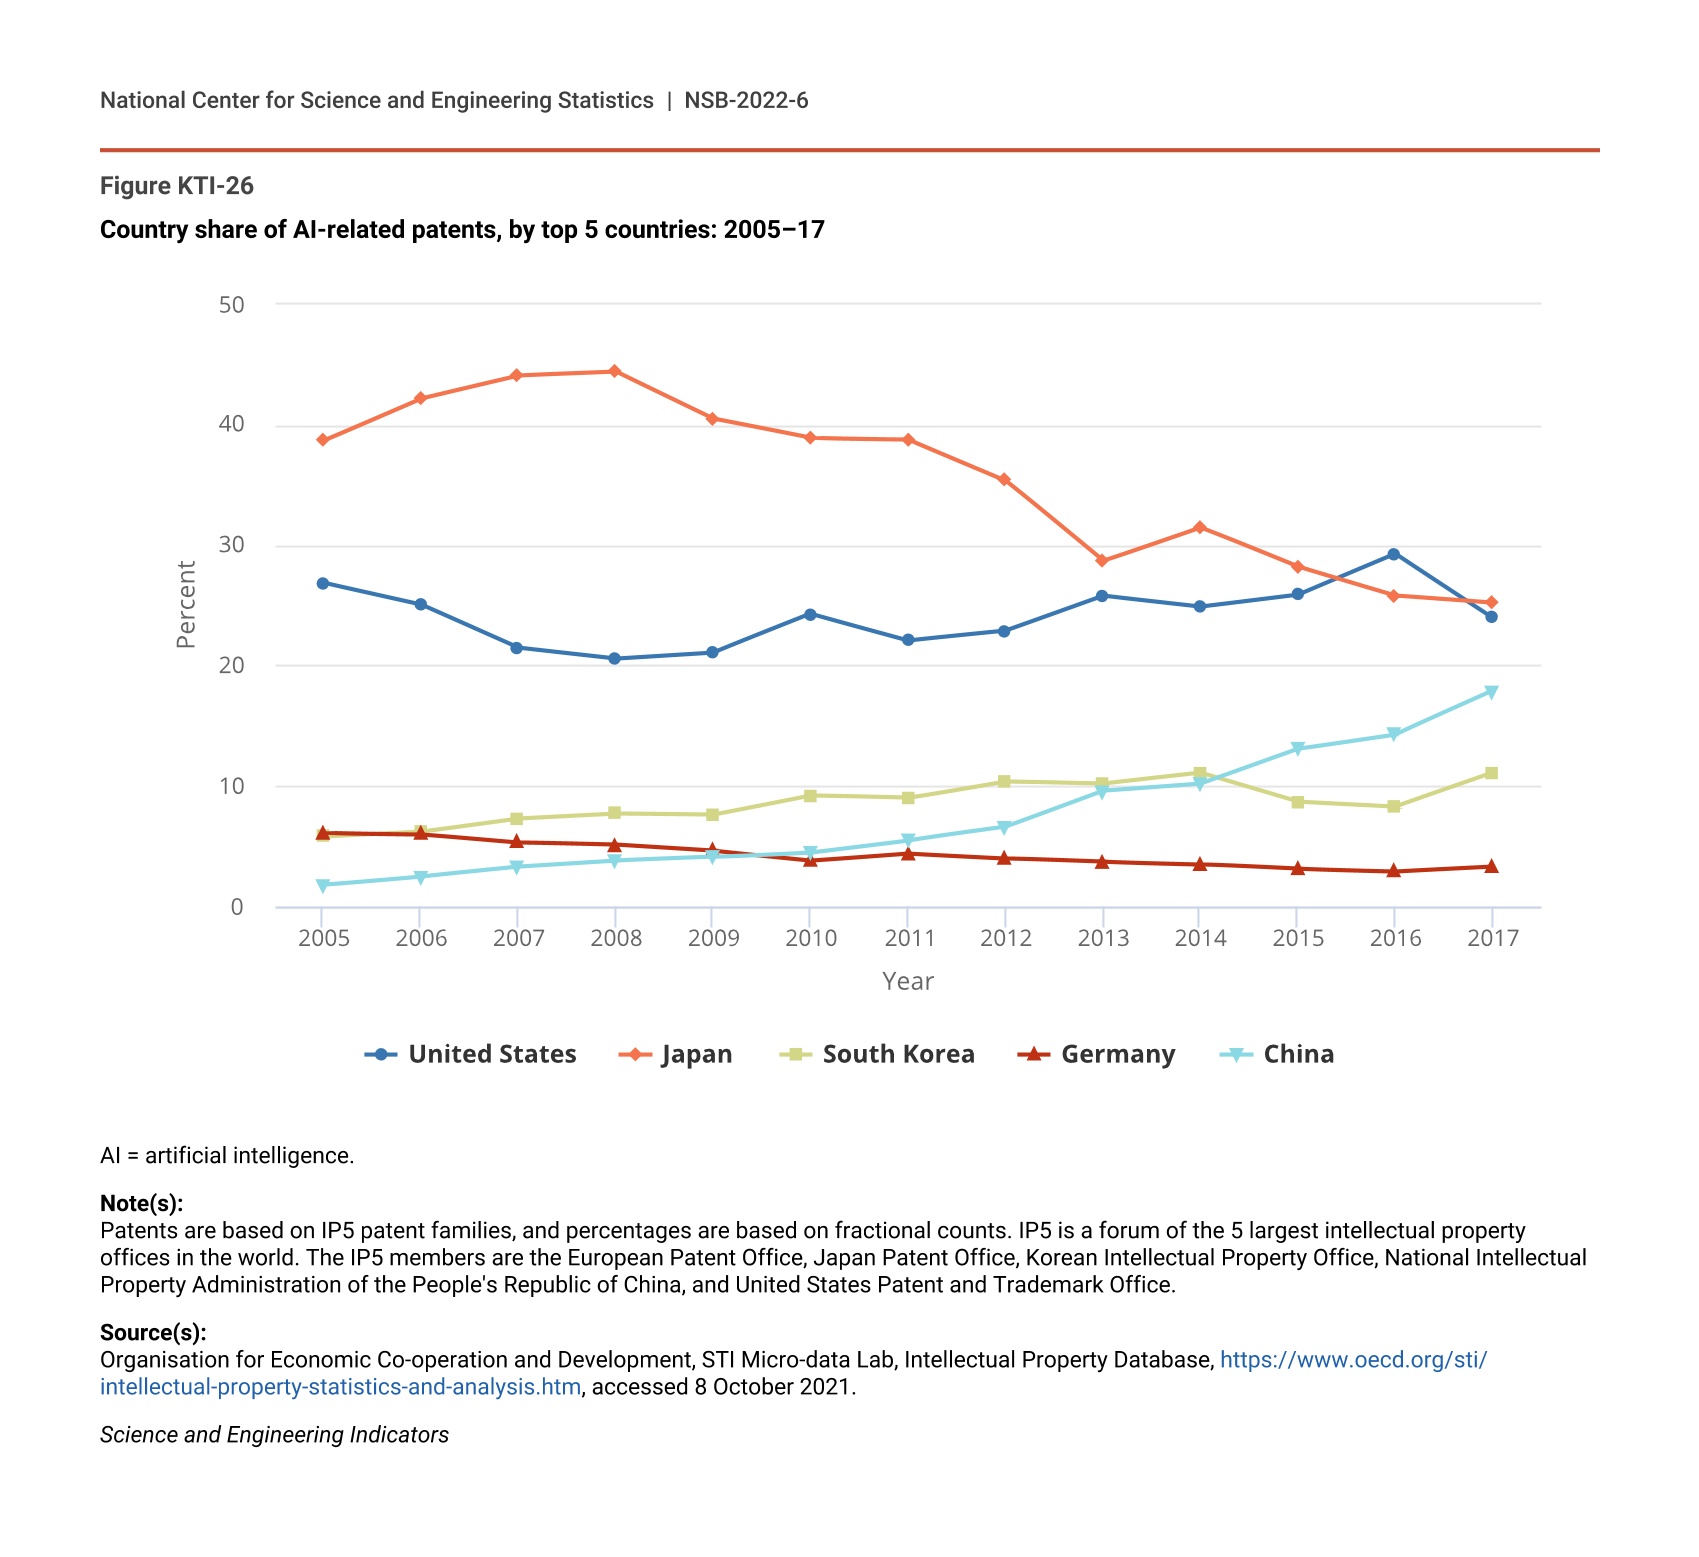
The U.S. share of AI-related patent families filed within at least 1 of the top 5 global intellectual property offices (USPTO, European Patent Office, Japan Patent Office, Korean Intellectual Property Office, National Intellectual Property Administration of the People’s Republic of China) has remained relatively steady over time (Figure KTI-26). Although falling from 26.9% in 2005 to 24.0% in 2017, the U.S. share has recovered slightly from the smaller shares seen between 2007 and 2012. Meanwhile, China and South Korea have both increased their shares of global patents filed for AI-related technologies, from 1.8% to 17.9% and 5.8% to 11.1%, respectively.
Country share of AI-related patents, by top 5 countries: 2005–17
| Year | United States | Japan | South Korea | Germany | China |
|---|---|---|---|---|---|
| 2005 | 26.9 | 38.7 | 5.8 | 6.1 | 1.8 |
| 2006 | 25.1 | 42.2 | 6.2 | 6.0 | 2.5 |
| 2007 | 21.5 | 44.1 | 7.3 | 5.3 | 3.3 |
| 2008 | 20.6 | 44.4 | 7.7 | 5.1 | 3.8 |
| 2009 | 21.1 | 40.5 | 7.6 | 4.6 | 4.1 |
| 2010 | 24.3 | 38.9 | 9.2 | 3.8 | 4.5 |
| 2011 | 22.1 | 38.8 | 9.0 | 4.4 | 5.5 |
| 2012 | 22.9 | 35.4 | 10.4 | 4.0 | 6.6 |
| 2013 | 25.8 | 28.7 | 10.2 | 3.7 | 9.6 |
| 2014 | 24.9 | 31.5 | 11.1 | 3.5 | 10.2 |
| 2015 | 25.9 | 28.2 | 8.7 | 3.1 | 13.1 |
| 2016 | 29.3 | 25.8 | 8.3 | 2.9 | 14.3 |
| 2017 | 24.0 | 25.2 | 11.1 | 3.3 | 17.9 |
AI = artificial intelligence.
Note(s):
Patents are based on IP5 patent families, and percentages are based on fractional counts. IP5 is a forum of the 5 largest intellectual property offices in the world. The IP5 members are the European Patent Office, Japan Patent Office, Korean Intellectual Property Office, National Intellectual Property Administration of the People's Republic of China, and United States Patent and Trademark Office.
Source(s):
Organisation for Economic Co-operation and Development, STI Micro-data Lab, Intellectual Property Database, https://www.oecd.org/sti/intellectual-property-statistics-and-analysis.htm, accessed 8 October 2021.
Science and Engineering Indicators
AI Adoption in Businesses
As an enabling technology, or general-purpose technology (GPT), AI is expected to contribute to increased productivity for businesses, leading to increased long-run economic growth (Aghion, Jones, and Jones 2017). Much research has been done on the impact of GPTs—including AI—on the U.S. economy (Gordon 2015; Brynjolfsson, Rock, and Syverson 2017). Until recently, the available data suggested that AI and other GPTs have not contributed to increased productivity, despite the new technologies and investment they brought. The leading explanation for this paradox is that there is a delay between the emergence of a GPT and its contribution to growth because other complementary intangible investments—such as data sets, firm-specific human capital, and new business processes—are also required (Brynjolfsson, Rock, and Syverson 2017). This debate has been difficult to resolve because comprehensive business sector data on the diffusion and impact of AI and other technologies have been limited to surveys focused on a single sector or focused primarily on large enterprises.
A new technology module of the Annual Business Survey (ABS)—developed in partnership between the Census Bureau and NCSES—collects data on the adoption and use of several advanced business technologies from a large, nationally representative sample of 850,000 smaller and larger firms in private, nonfarm sectors of the economy. Advanced business technologies include AI-related technologies like guided vehicles, machine learning, machine vision, natural language processing, and voice recognition software. Using data from this new ABS module, Zolas et al. (2020) found that adoption rates for advanced business technologies in the United States were generally low—and were significantly lower than levels reported in earlier surveys.
Importantly, although nearly all firms use some form of digital information, and most use some kind of cloud service, only 10.3% of firms in 2017 adopted at least one of the advanced business technologies, such as AI. Adoption of these advanced business technologies is skewed heavily toward larger firms (i.e., those with more than 5,000 employees), with more than 50% of them making use of advanced business technologies that embody AI. Adoption rates also vary across sectors, with use of advanced business technologies concentrated in industries such as manufacturing and IT. In contrast, the service sector shows lower levels of advanced business technology adoption, including management and financial services. Somewhat surprisingly, transportation and warehousing also show low levels of adoption, which may reflect the greater role of smaller firms in this sector (Zolas et al. 2020).
Research suggests that the adoption of advanced business technologies impacted the productivity of U.S. businesses. For example, Andrews, Criscuolo, and Gal (2016) and Autor et al. (2017) agree that macroeconomic indicators show a slowdown in U.S. business productivity over the last two decades. However, the authors argue that these indicators obscure a significant divergence in productivity across firms. Firms operating at the “frontier”—which are often larger enterprises—have witnessed an increase in productivity, while other firms have seen lagging productivity performance. The rise of superstar firms is consistent with the ABS data on AI adoption. The data suggest a self-reinforcing cycle in which large firms are better able to adopt GPTs, leading to increased firm-level productivity. Technology adoption, as measured by the technology module of the ABS, is associated with increased productivity, as measured by the innovation module of the ABS (Zolas et al. 2020). The implication is that GPTs, including AI, have an especially strong impact on the growth of large enterprises and are a source of increased industry concentration by increasing divergence between superstar firms and the rest.
Biotechnology
Although there is no consensus on defining biotechnology, it can be broadly defined as “the broad application of science and technology to living organisms, as well as parts, products and models thereof, to alter living or non-living materials for the production of knowledge, goods and services” (OECD 2013:156). Modern biotechnology developed as a science with enormous potential for human welfare in areas ranging from food processing to human health and environmental protection. One of the major areas in biotechnology is medicine. This is the field in which most of the R&D is taking place, and several breakthroughs have been made. This area includes medical applications, such as utilizing organisms for the production of novel drugs or employing stem cells to replace or regenerate injured tissues and possibly regenerate whole organs. Another major area is industrial biotechnology, which includes modern application of biotechnology for sustainable processing and production of chemical products, materials, and fuels (Erickson and Winters 2012). Use of biotechnology to substitute existing processes makes industrial sectors like chemicals and pharmaceuticals, pulp and paper, textiles, energy, and materials and polymers more efficient and environmentally friendly, contributing to industrial sustainability in various ways. A third major area is agricultural biotechnology. With the aid of rDNA technology, it has now become possible to produce transgenic plants with desirable genes, such as herbicide resistance, disease resistance, and increased shelf life (USDA/ERS 2020).
Investment in Biotechnology
Global Trends
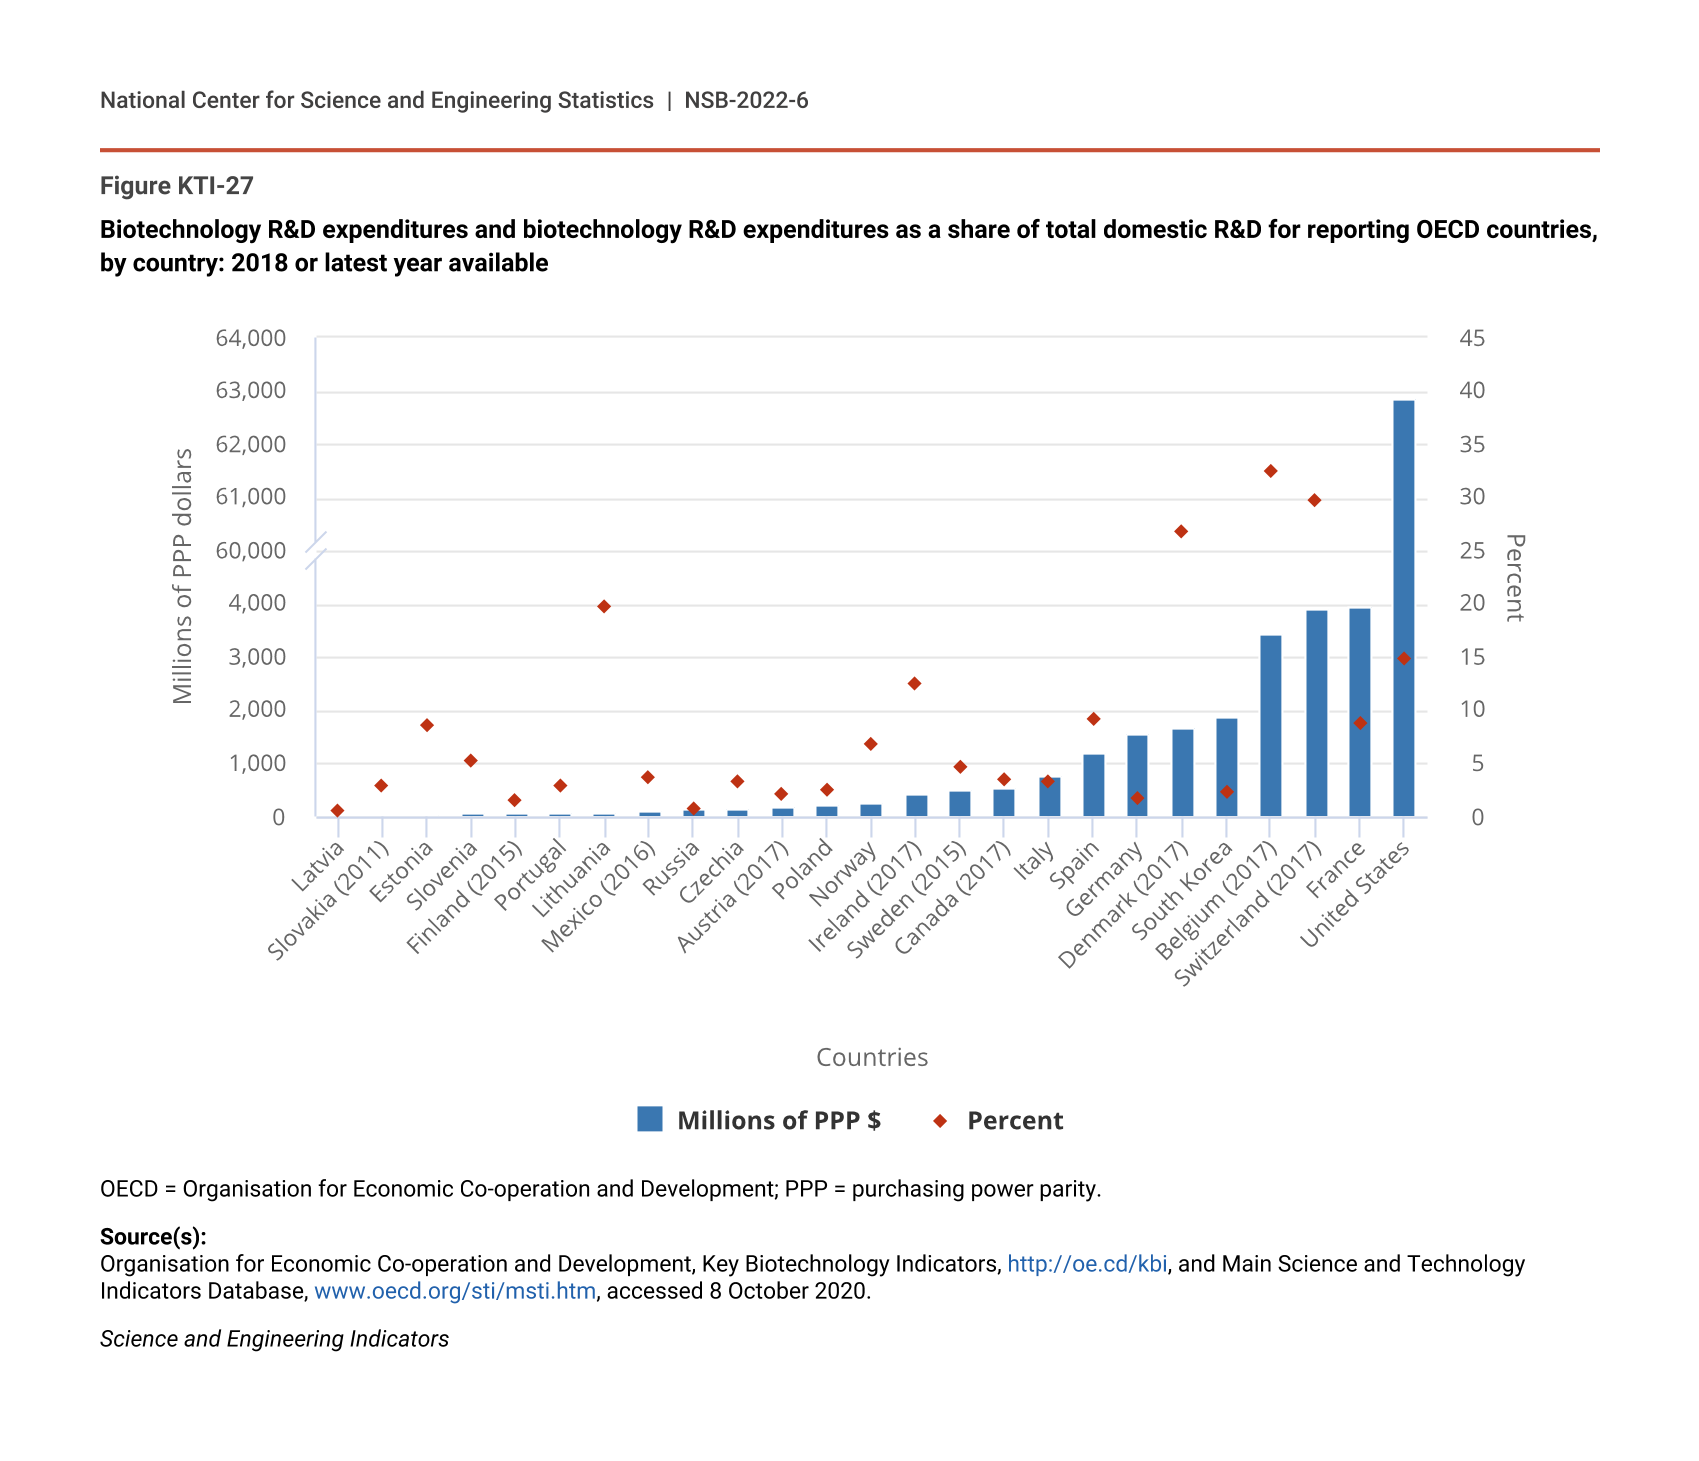
According to OECD (2021a), the United States performs the most business sector biotechnology R&D ($63 billion, or 70%) among the 25 countries for which data are available (Figure KTI-27). This is almost 16 times that of France ($3.9 billion), the next largest. Although the United States performs the most biotechnology R&D, its share of total domestic R&D and its R&D intensity—that is, biotechnology R&D as percentage of industry value added—is below that of other countries. In terms of share of total domestic R&D to biotechnology, the United States ranks fifth (15%) among the 25 countries, well below the 27%–32% shares reported in Switzerland, Belgium, and Denmark. Similarly, the United States (0.5) ranks fourth for biotechnology R&D intensity, while higher biotechnology R&D intensity is reported in Belgium (1.0), Switzerland (1.0), and Denmark (0.8) (OECD 2021a).
Biotechnology R&D expenditures and biotechnology R&D expenditures as a share of total domestic R&D for reporting OECD countries, by country: 2018 or latest year available
| Countries | Millions of PPP $ | Percent |
|---|---|---|
| Latvia | 0.4 | 0.5 |
| Slovakia (2011) | 10.5 | 3.0 |
| Estonia | 24.7 | 8.7 |
| Slovenia | 61.9 | 5.3 |
| Finland (2015) | 72.1 | 1.6 |
| Portugal | 73.3 | 3.0 |
| Lithuania | 77.8 | 19.7 |
| Mexico (2016) | 127.0 | 3.7 |
| Russia | 164.1 | 0.7 |
| Czechia | 168.2 | 3.3 |
| Austria (2017) | 213.3 | 2.2 |
| Poland | 244.7 | 2.5 |
| Norway | 261.2 | 6.8 |
| Ireland (2017) | 437.4 | 12.6 |
| Sweden (2015) | 492.7 | 4.6 |
| Canada (2017) | 563.6 | 3.6 |
| Italy | 780.0 | 3.3 |
| Spain | 1,212.5 | 9.1 |
| Germany | 1,572.3 | 1.7 |
| Denmark (2017) | 1,682.2 | 26.9 |
| South Korea | 1884.1 | 2.4 |
| Belgium (2017) | 3,460.8 | 32.4 |
| Switzerland (2017) | 3,899.0 | 29.7 |
| France | 3,933.9 | 8.8 |
| United States | 62862.1 | 14.9 |
OECD = Organisation for Economic Co-operation and Development; PPP = purchasing power parity.
Source(s):
Organisation for Economic Co-operation and Development, Key Biotechnology Indicators, http://oe.cd/kbi, and Main Science and Technology Indicators Database, www.oecd.org/sti/msti.htm, accessed 8 October 2020.
Science and Engineering Indicators
Although the OECD does not collect biotechnology data on China, other evidence suggests that China has committed resources to expand its presence in biotechnology. President Xi Jinping has made China’s leadership in this sector a core priority through the Made in China 2025 strategy (Huggett 2019). According to the World Health Organization (2017), the Chinese government is targeting the domestic pharmaceutical industry to invest 5% of revenues in R&D, but that target is not yet reached. To put this into context, U.S. pharmaceutical industries invest roughly 11% of their revenues in R&D, which is much greater than the target set by the Chinese government (see forthcoming Indicators 2022 report, “Research and Development: U.S. Trends and International Comparisons”). Nevertheless, some estimates show that annual R&D expenditures by Chinese pharmaceutical firms, the foundation of the biotechnology sector, rose from some 39 billion renminbi (RMB) in 2014 ($5.5 billion in U.S. dollars) to over 53 billion RMB ($7.5 billion in U.S. dollars) by 2017. Expenditures on new product development among these firms, an important indicator of future growth potential, increased from just over 40 billion RMB ($5.6 billion in U.S. dollars) to almost 60 billion RMB ($8.4 billion in U.S. dollars) (Moore 2020). Overall, highly innovative drugs still originate from international companies, and Chinese manufacturers excel in generics (e.g., biosimilars) and traditional Chinese medicine (Schmid and Xiong 2021).
Venture capital data also show China’s increasing presence in biotechnology. According to data from PitchBook, global venture capital investment in biotechnology was $44.0 billion in 2020 (Table SKTI-24). The United States is the largest destination, receiving more than 60% of total investment, and is followed by China (19% global share) and Europe (15% global share). The amount of investment has increased significantly over the last decade, growing from $4.5 billion in 2010 to $44.0 billion in 2020. China’s investment expanded rapidly from 2015 to 2020, rising from less than $1.0 billion to $8.3 billion. Although investment continued to grow in the United States, its global share fell slightly from 68% to 67% due to comparatively faster growth by China.
U.S. Trends
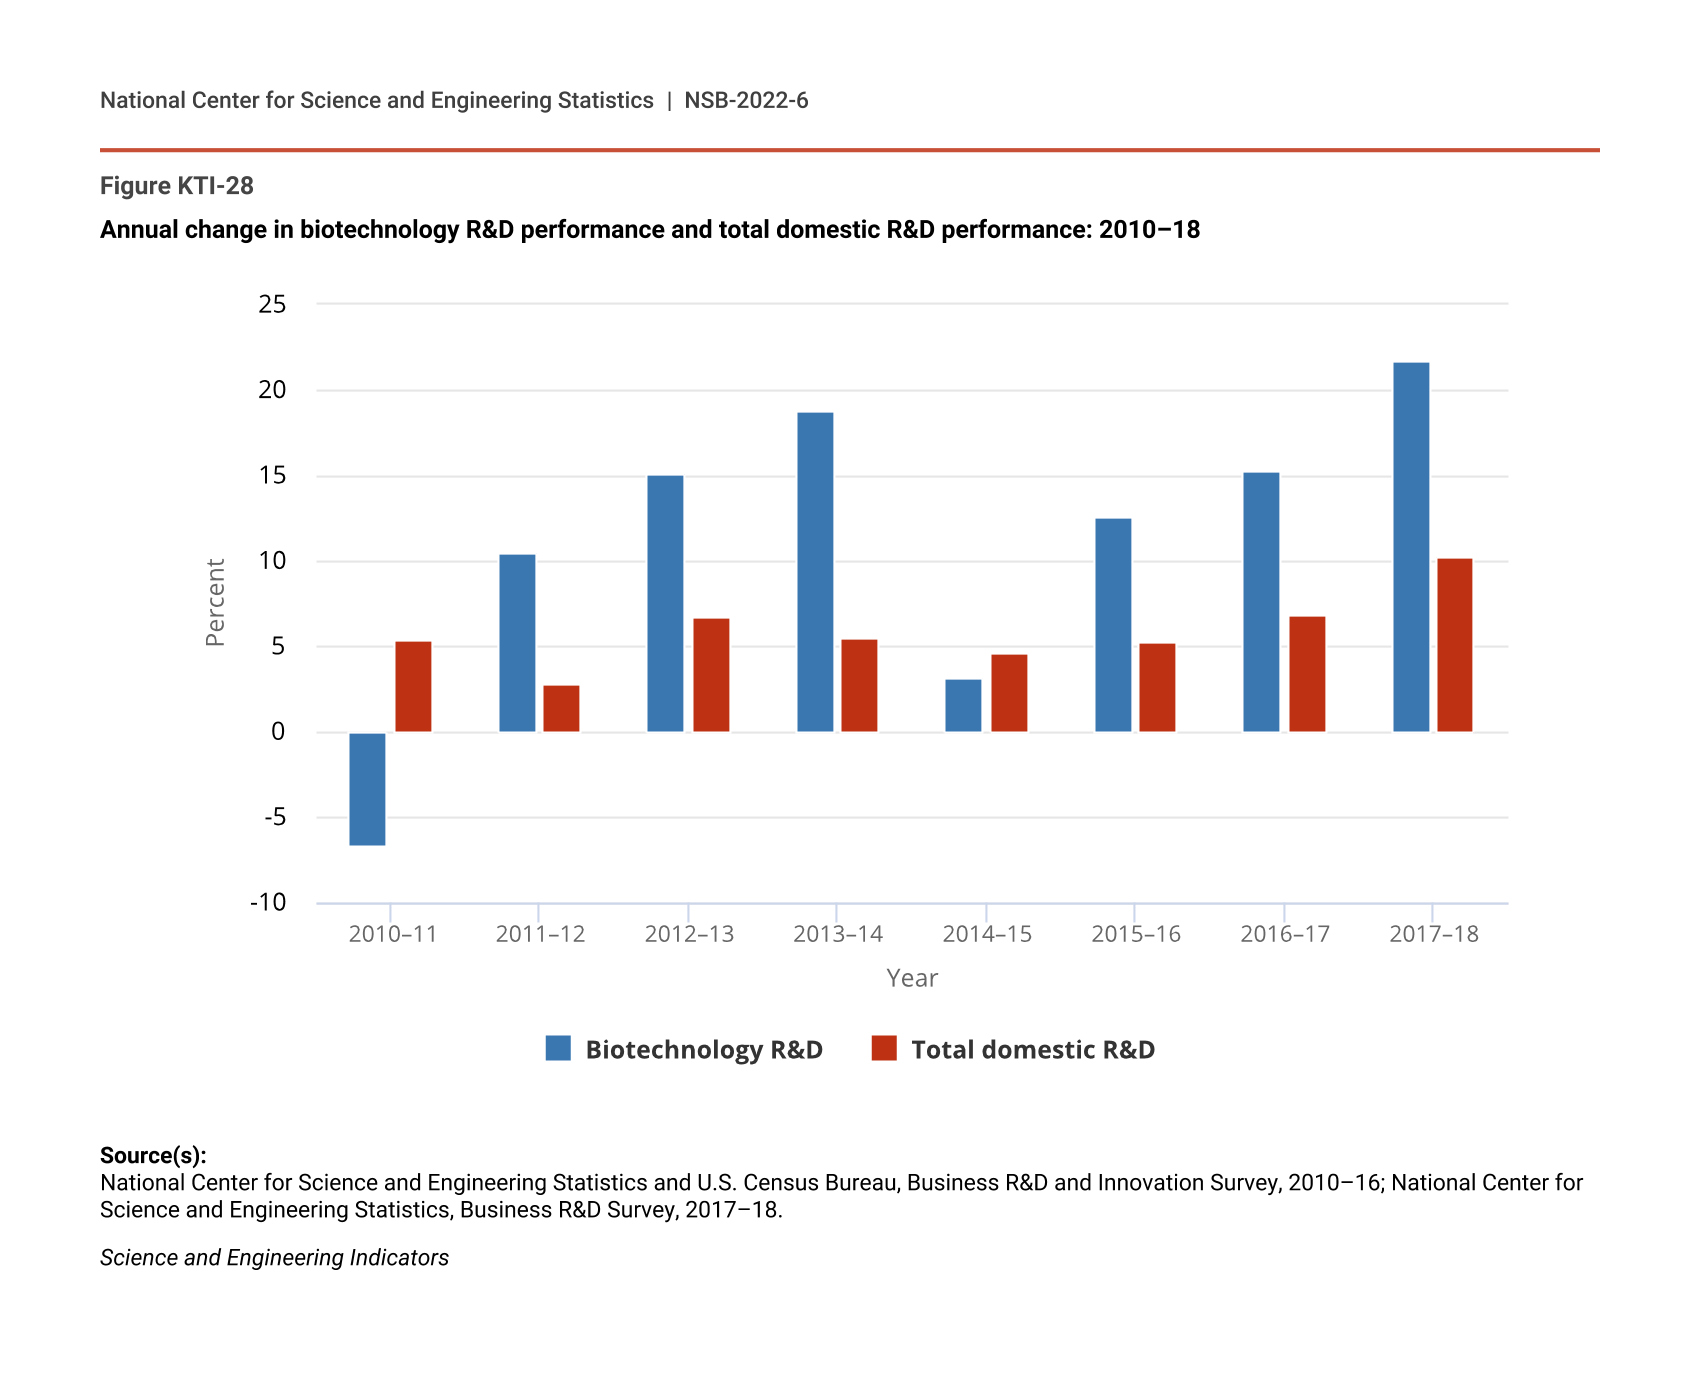
NCSES collects data on U.S. business spending on biotechnology R&D performance through the Business Research and Development Survey (BRDS). According to these data, domestic business R&D performance on biotechnology was $49 billion in 2018. U.S. business R&D performance on biotechnology was seven times that of business R&D performance on AI, which was $7 billion in 2018 (NCSES BRDS 2018: Table 1). Biotechnology business R&D performance increased an average of 11% from 2010 to 2018, whereas total domestic R&D performance increased an average of 6% (Figure KTI-28). The faster growth of biotechnology business R&D performance compared to the total has led to an increase in the proportion of total domestic R&D performance in biotechnology from 10% to 14% between 2010 to 2018. More recently, growth in biotechnology R&D has outpaced total domestic R&D performance. This indicates an increasing research focus on biotechnology in the United States.
Annual change in biotechnology R&D performance and total domestic R&D performance: 2010–18
| Year | Biotechnology R&D | Total domestic R&D |
|---|---|---|
| 2010–11 | -6.7 | 5.4 |
| 2011–12 | 10.5 | 2.8 |
| 2012–13 | 15.1 | 6.7 |
| 2013–14 | 18.8 | 5.5 |
| 2014–15 | 3.2 | 4.6 |
| 2015–16 | 12.6 | 5.3 |
| 2016–17 | 15.3 | 6.8 |
| 2017–18 | 21.7 | 10.2 |
Source(s):
National Center for Science and Engineering Statistics and U.S. Census Bureau, Business R&D and Innovation Survey, 2010–16; National Center for Science and Engineering Statistics, Business R&D Survey, 2017–18.
Science and Engineering Indicators
According to the BRDS (NCSES BRDS 2018: Table 20), most biotechnology R&D in the U.S. business sector is performed in manufacturing by large companies, and it is paid for by the companies’ own funds. Pharmaceutical and medicine manufacturers (73%) perform the most domestic R&D on biotechnology, followed by scientific research and development services (13%), computer and electronic products manufacturing (4%), miscellaneous manufacturing (4%) (e.g., medical equipment and supplies, games, office supplies, slot machines), and the food industry (2%). Most companies that engage in biotechnology R&D employ fewer than 250 employees (82%); however, companies with 250 or more employees performed $51 billion, or 82% of all biotechnology R&D. Of these companies, 78% paid for biotechnology R&D using their own funds rather than funds from another entity (i.e., another company or the federal government).
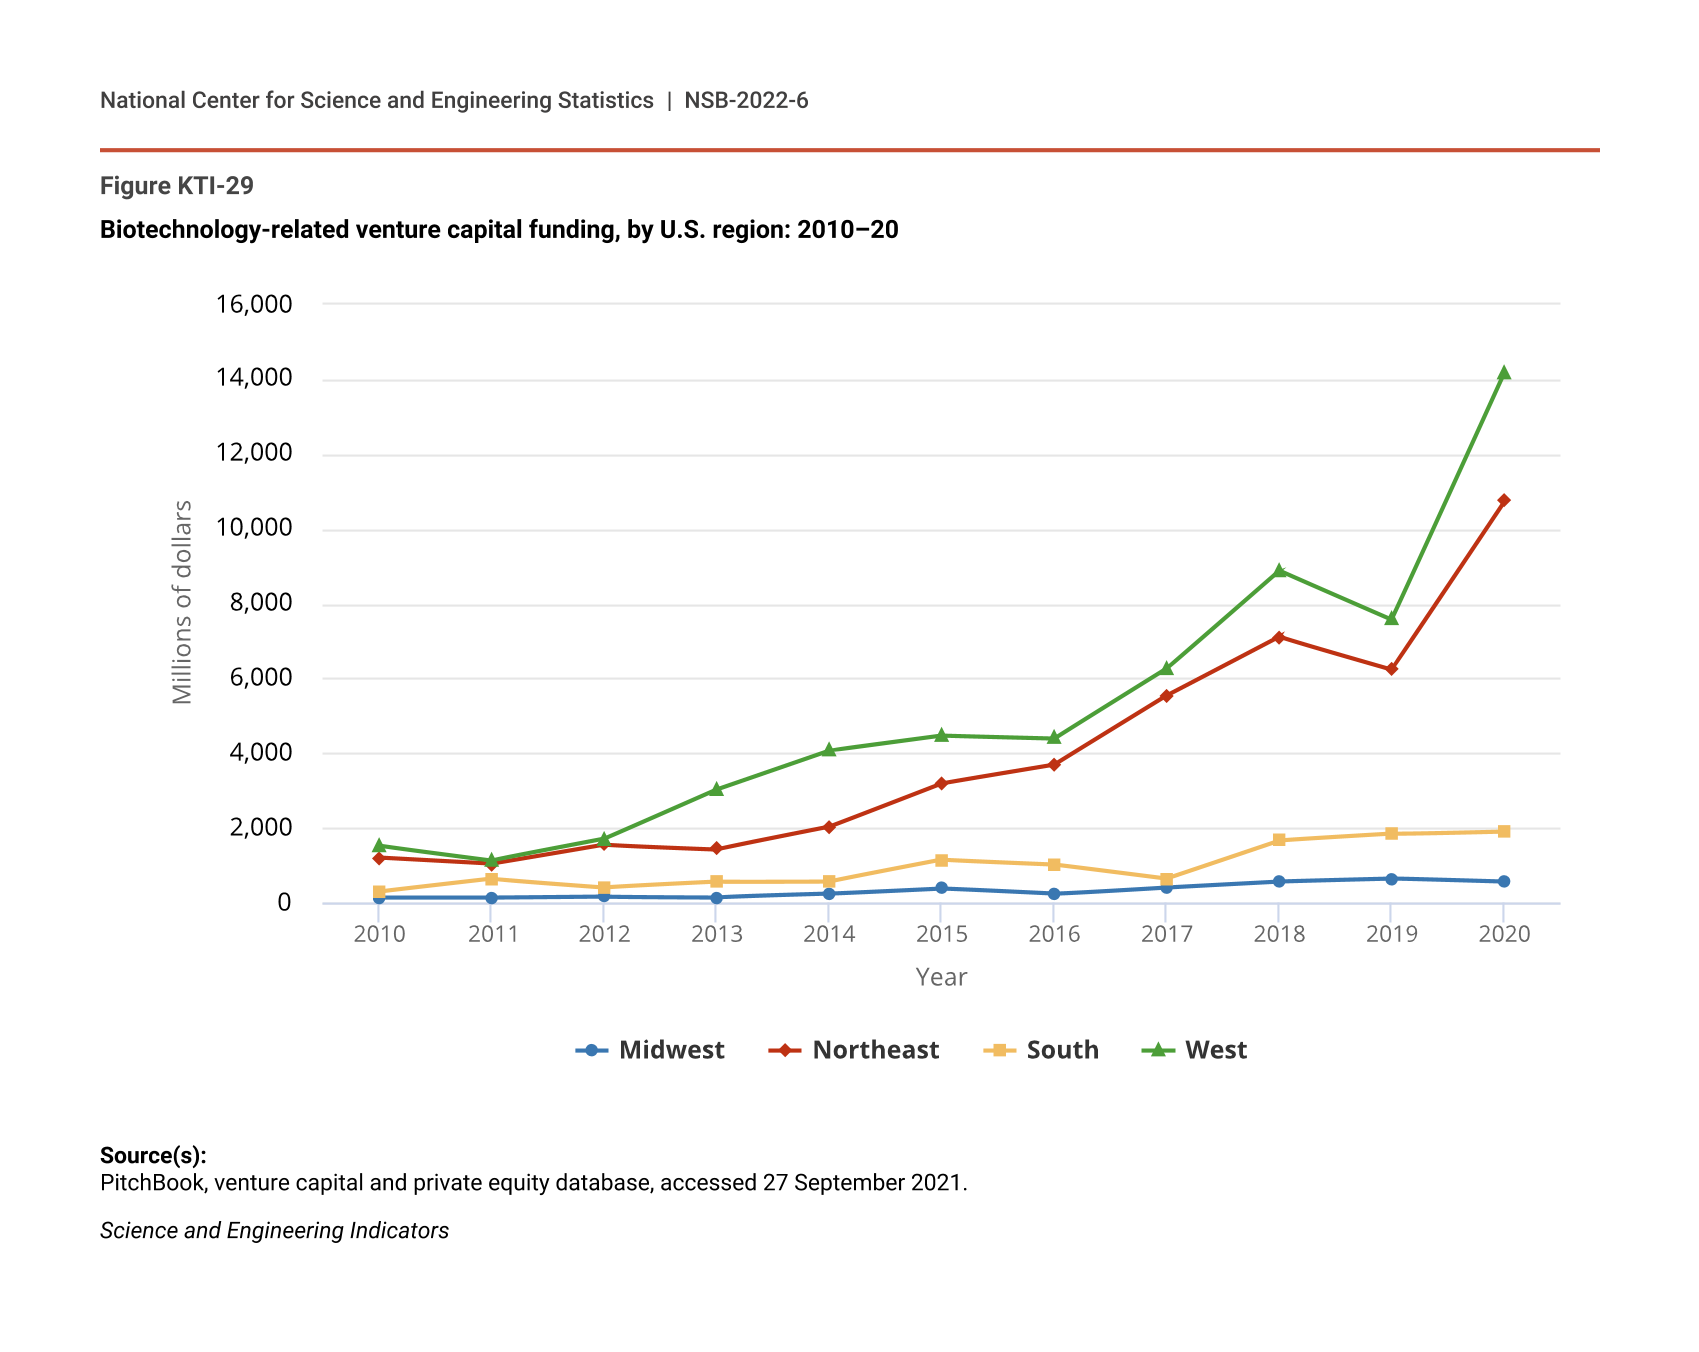
Data from PitchBook show the flow of venture capital financing within the United States. U.S. venture capital investments in biotechnology increased from $3.1 billion in 2010 to $27.4 billion in 2020, accumulating $115 billion during this period. The majority of this funding went to states in the West Census region ($57.1 billion, or 50%) and Northeast ($43.6 billion, or 38%) (Figure KTI-29; Table SKTI-25). California ($49.9 billion) attracted 88% of venture capital in the West, and Massachusetts ($32.0 billion) attracted 73% in the Northeast; these two states and their regions thus attracted most venture capital in the United States overall during this period. Smaller amounts flowed to states in the South (9% of total) and in the Midwest (3% of total), and funding was distributed more evenly among the states within each of these regions.
Biotechnology-related venture capital funding, by U.S. region: 2010–20
| Year | Midwest | Northeast | South | West |
|---|---|---|---|---|
| 2010 | 122.85 | 1,183.80 | 281.32 | 1,509.42 |
| 2011 | 122.15 | 1,021.78 | 623.51 | 1,122.02 |
| 2012 | 151.21 | 1,535.38 | 405.69 | 1,693.45 |
| 2013 | 136.72 | 1,422.91 | 547.71 | 3,017.22 |
| 2014 | 220.77 | 2,014.16 | 561.30 | 4,057.10 |
| 2015 | 362.47 | 3,177.42 | 1,137.23 | 4,457.76 |
| 2016 | 218.33 | 3,673.92 | 1,016.23 | 4,381.79 |
| 2017 | 398.76 | 5,522.47 | 633.57 | 6,251.50 |
| 2018 | 555.32 | 7,099.16 | 1,649.50 | 8,875.75 |
| 2019 | 630.32 | 6,238.62 | 1,824.14 | 7,567.35 |
| 2020 | 541.48 | 10,734.39 | 1,898.83 | 14,184.22 |
Source(s):
PitchBook, venture capital and private equity database, accessed 27 September 2021.
Science and Engineering Indicators
Consistent with previous analysis, biotechnology venture capital grew the most in regions that have historically attracted more funding. The West and the Northeast attracted the highest levels of funding and grew the fastest at 25% per year between 2010 and 2020. The growth in these regions was led by California and Massachusetts. As a result, the Northeast increased its share of U.S. total venture capital financing in biotechnology from 33% in 2010–15 to 40% in 2016–20, and the West’s share has been relatively constant since 2015 at 47%–52%.
Concentration decreased in the South and the Midwest as these regions grew at slower rates and had the lowest levels of funding compared to the Northeast and the West. Between 2010 and 2020, the South grew at 21% per year, while the Midwest grew at 16%. Between 2010 and 2015, the South represented about 12% of all biotechnology venture capital investment in the United States, but this share fell to 8% between 2016 and 2020. The share of biotechnology investments in the Midwest ranged between 2% and 4% during this period.
Analysis of the PitchBook venture capital data for the U.S. biotechnology sector yields a few key similarities with the U.S. AI sector. First, venture financing for both enabling technologies is highly concentrated in the West and the Northeast—in particular, in California and Massachusetts—on a per-dollar and percentage-share basis. Second, while some regions and sectors, such as the Midwest in AI and the South in biotechnology, are seeing high rates of annual growth, this growth has not been enough to increase the share of these regions’ venture investments within the United States overall. Third, in both AI and biotechnology, venture capital investments are more evenly distributed across states in the South and the Midwest, whereas investments in the West and the Northeast are highly concentrated in one or two states. Perhaps most notably, although biotechnology ($3.1 billion in 2010) began the decade with significantly higher rates of investment than AI ($598.1 million), in 2020 both technologies received similar levels of investment—about $27 billion. The increase in AI venture capital investments in the United States has been so rapid that, between 2010 and 2020, biotechnology and AI firms in the United States received similar levels of venture funding—roughly $115 billion.
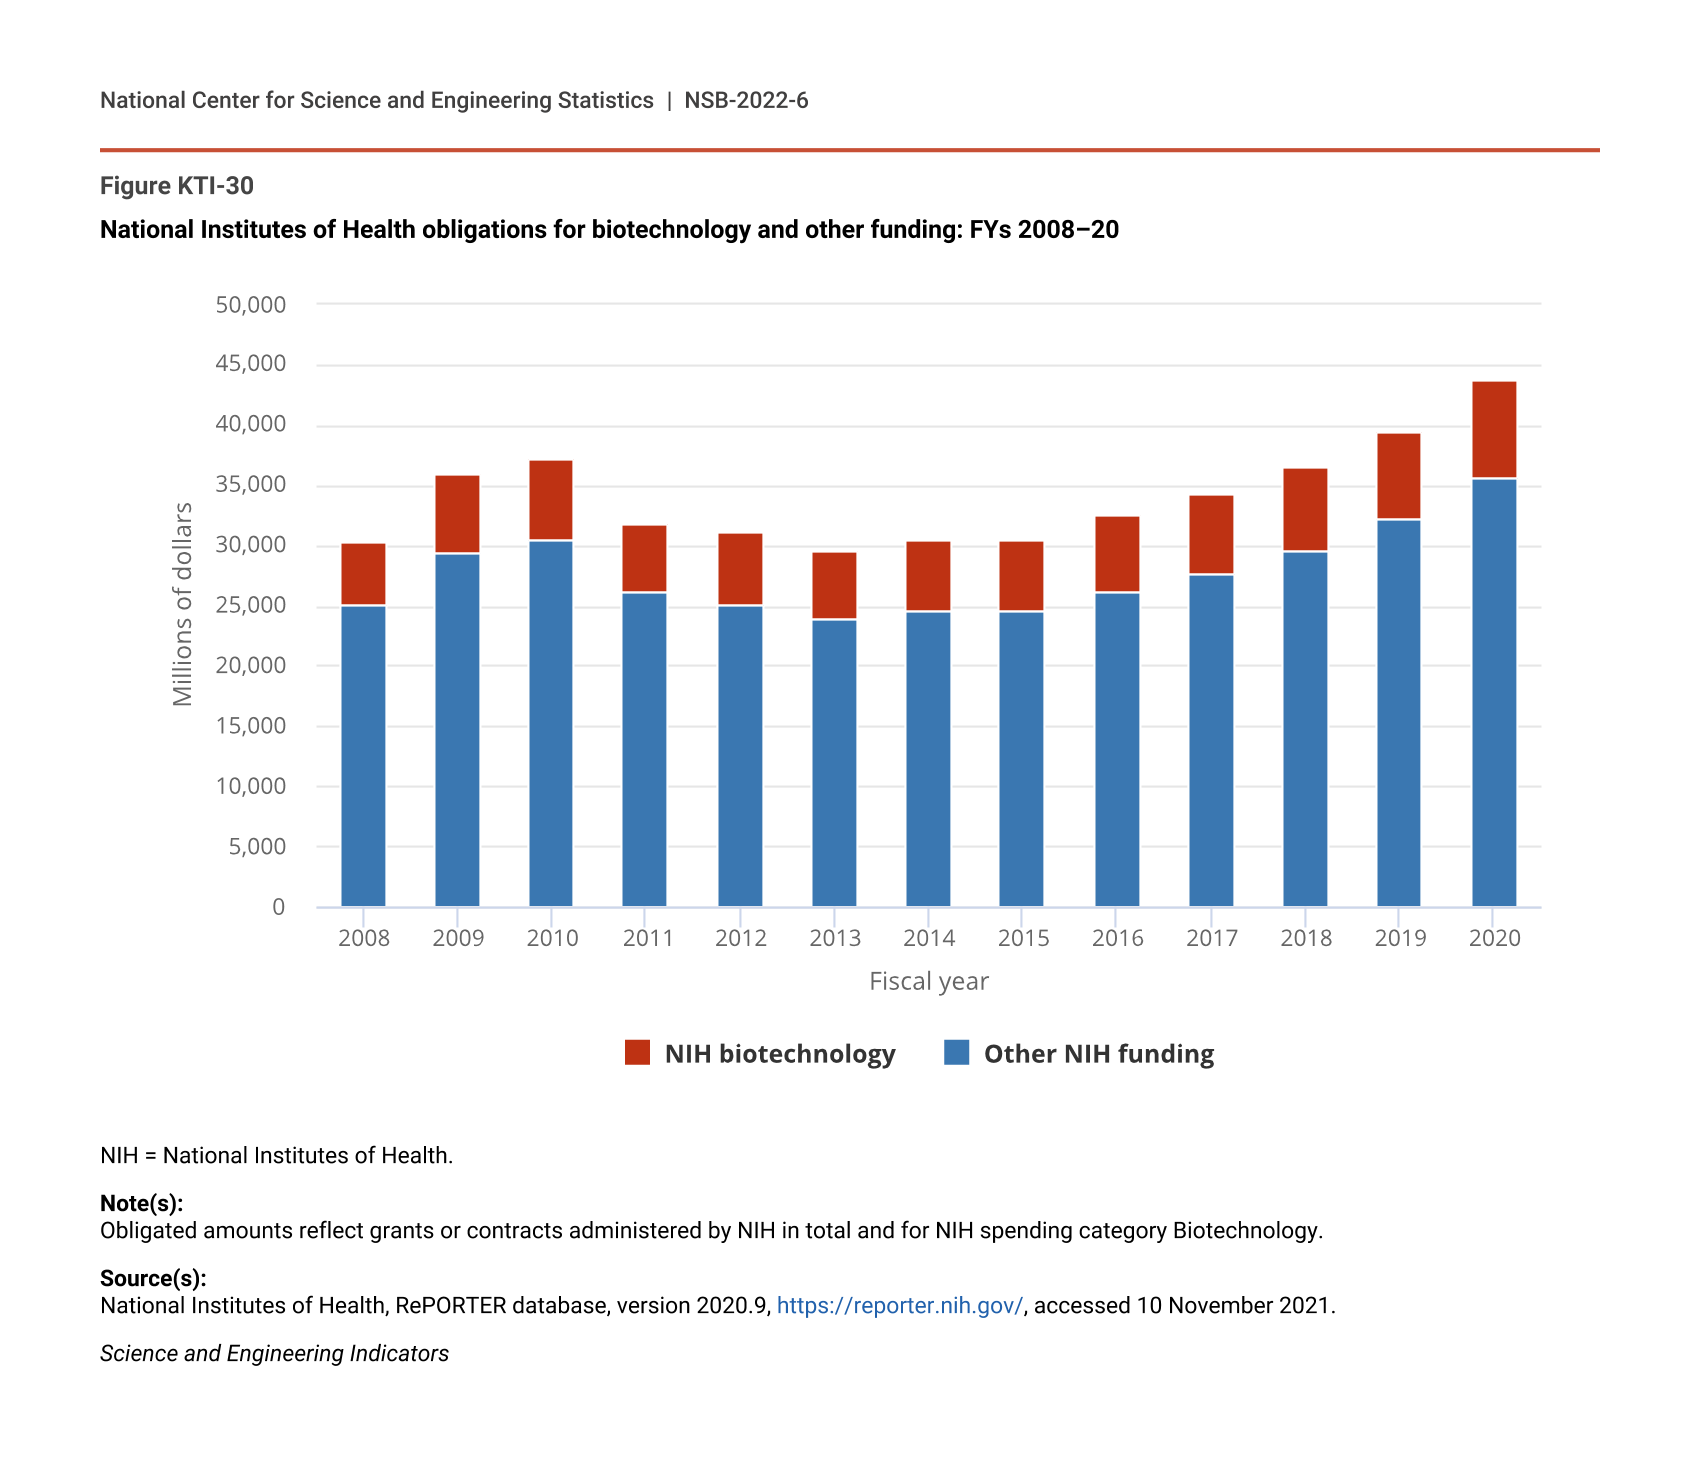
The federal government is also an important source of funding for biotechnology R&D. NIH funds a substantial amount of biotechnology R&D. NIH obligated about $8 billion on biotechnology grants or contracts in 2020, which is 19% of overall NIH obligations. NIH obligations on biotechnology research grew 4% per year since 2008, 1 percentage point more than total NIH (3%) (Figure KTI-30). Excluding NIH intramural spending obligations, in 2020, organizations in California, Washington, and Massachusetts were awarded the most NIH grants or contracts on biotechnology, a pattern similar to the venture capital financing across states.
National Institutes of Health obligations for biotechnology and other funding: FYs 2008–20
| Fiscal year | Other NIH funding | NIH biotechnology |
|---|---|---|
| 2008 | 25,164 | 5,130 |
| 2009 | 29,464 | 6,514 |
| 2010 | 30,424 | 6,782 |
| 2011 | 26,075 | 5,748 |
| 2012 | 25,014 | 6,074 |
| 2013 | 23,838 | 5,670 |
| 2014 | 24,523 | 5,853 |
| 2015 | 24,562 | 5,971 |
| 2016 | 26,063 | 6,407 |
| 2017 | 27,676 | 6,522 |
| 2018 | 29,621 | 6,876 |
| 2019 | 32,209 | 7,173 |
| 2020 | 35,554 | 8,242 |
NIH = National Institutes of Health.
Note(s):
Obligated amounts reflect grants or contracts administered by NIH in total and for NIH spending category Biotechnology.
Source(s):
National Institutes of Health, RePORTER database, version 2020.9, https://reporter.nih.gov/, accessed 10 November 2021.
Science and Engineering Indicators
Biotechnology Patents
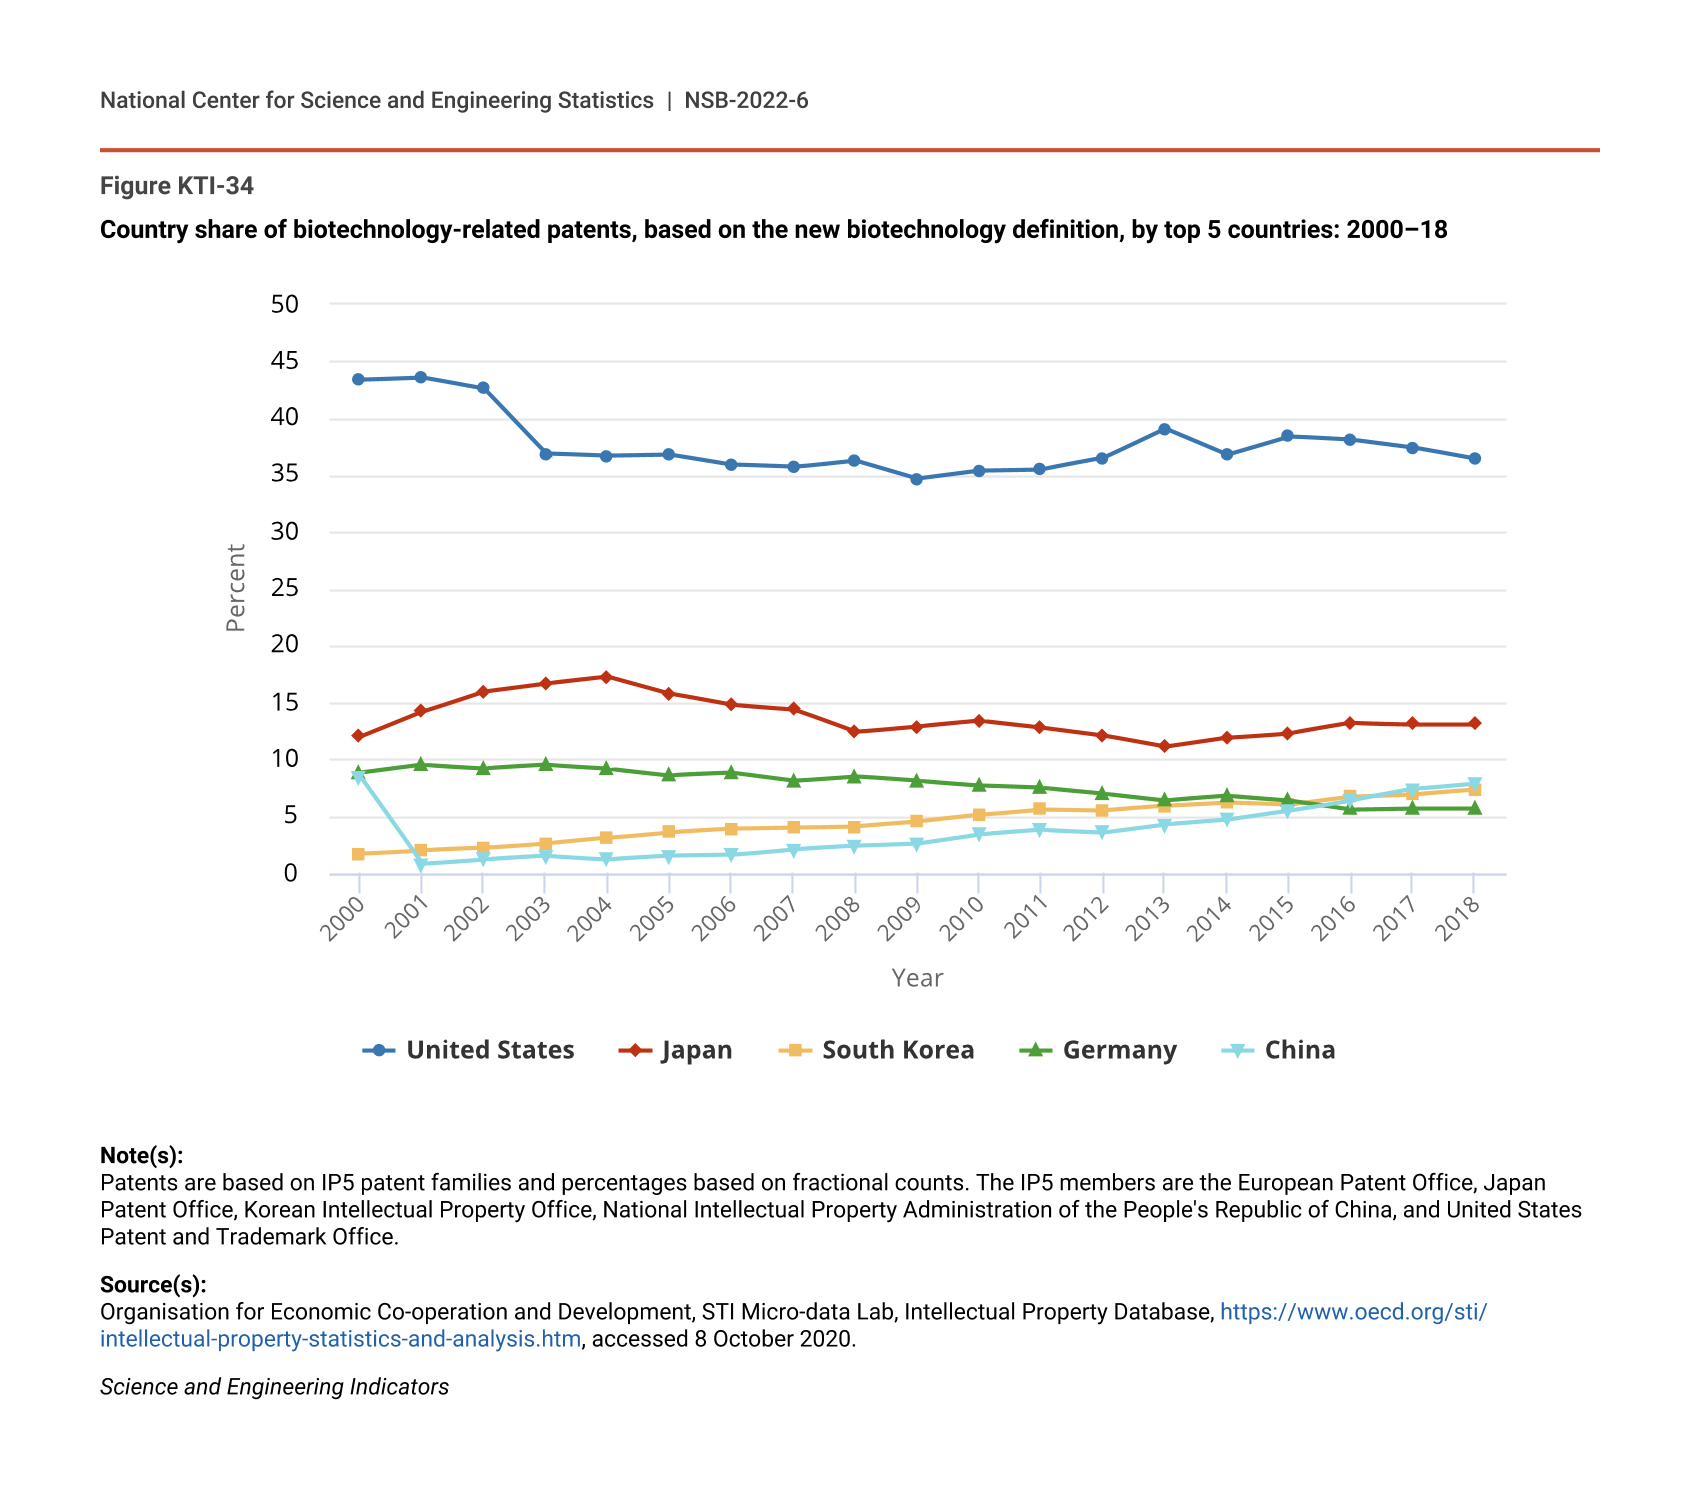
Patenting is closely linked to invention and indicates the transformation of knowledge into new products and services. Based on OECD’s (2021a) definition of biotechnology, inventors living in the United States (36%) patent most of the biotechnology-related patent families filed within the five intellectual property offices (IP5), and this share has been fairly stable since 2010 (Figure KTI-34). The next-largest producers are Japan (13%), China (8%), South Korea (7%), and Germany (6%). Germany’s share has been on a long-term downward trend since 2001, whereas South Korea’s and China’s shares have been on an upward trend since 2001. The share of USPTO utility patents in biotechnology granted to inventors living in the United States (as defined by the World Intellectual Property Organization [WIPO]) is also stable, ranging between 55% and 57% during the period 2010–20.
Country share of biotechnology-related patents, based on the new biotechnology definition, by top 5 countries: 2000–18
| Year | United States | Japan | South Korea | Germany | China |
|---|---|---|---|---|---|
| 2000 | 43.4 | 12.0 | 1.7 | 8.8 | 8.5 |
| 2001 | 43.6 | 14.2 | 2.0 | 9.5 | 0.8 |
| 2002 | 42.6 | 16.0 | 2.2 | 9.2 | 1.2 |
| 2003 | 36.9 | 16.7 | 2.6 | 9.5 | 1.5 |
| 2004 | 36.7 | 17.3 | 3.1 | 9.2 | 1.2 |
| 2005 | 36.8 | 15.8 | 3.6 | 8.6 | 1.5 |
| 2006 | 35.9 | 14.8 | 3.9 | 8.8 | 1.6 |
| 2007 | 35.7 | 14.4 | 4.0 | 8.1 | 2.1 |
| 2008 | 36.3 | 12.4 | 4.1 | 8.5 | 2.4 |
| 2009 | 34.7 | 12.9 | 4.5 | 8.1 | 2.6 |
| 2010 | 35.4 | 13.4 | 5.1 | 7.7 | 3.4 |
| 2011 | 35.5 | 12.8 | 5.6 | 7.5 | 3.8 |
| 2012 | 36.5 | 12.1 | 5.5 | 7.0 | 3.6 |
| 2013 | 39.1 | 11.1 | 5.9 | 6.4 | 4.3 |
| 2014 | 36.8 | 11.9 | 6.2 | 6.8 | 4.7 |
| 2015 | 38.4 | 12.3 | 6.0 | 6.4 | 5.5 |
| 2016 | 38.1 | 13.2 | 6.7 | 5.6 | 6.4 |
| 2017 | 37.4 | 13.1 | 6.9 | 5.7 | 7.4 |
| 2018 | 36.4 | 13.1 | 7.3 | 5.7 | 7.9 |
Note(s):
Patents are based on IP5 patent families and percentages based on fractional counts. The IP5 members are the European Patent Office, Japan Patent Office, Korean Intellectual Property Office, National Intellectual Property Administration of the People's Republic of China, and United States Patent and Trademark Office.
Source(s):
Organisation for Economic Co-operation and Development, STI Micro-data Lab, Intellectual Property Database, https://www.oecd.org/sti/intellectual-property-statistics-and-analysis.htm, accessed 8 October 2020.
Science and Engineering Indicators
Economic Impacts of Biotechnology
Although the direct benefits of biotechnology stemming from increased employment for highly skilled and well-paid workers and increased sales revenues are small compared to other industries, the indirect benefits of biotechnology, including improvements in quality of life, economic growth, better health products and services, and a cleaner environment, are substantial. An illustrative example of the direct and indirect impacts of biotechnology on the U.S. economy can be readily seen during the pandemic. Several of the COVID-19 vaccines were developed using biotechnology, resulting in increased sales and profits for companies researching and producing the vaccines (Terry 2021; Johnson 2021). More importantly, the vaccines saved thousands of lives and boosted the U.S. economy by reducing voluntary social distancing and official lockdown requirements (Gagnon, Kamin, and Kearns 2021). This section describes some of the direct and indirect impacts of biotechnology, more generally, in the U.S. economy.
Estimating the direct effects of biotechnology to the U.S. economy is difficult because biotechnology is used in many industries, and there is no consensus on what industries are biotechnology. Many private companies have evaluated the market value of biotechnology companies in the United States; depending on their definition of biotechnology, these estimates range between $135 billion in 2020 to $561 billion in 2017 (IBISWorld 2021b; PhRMA 2019). In terms of value-added output, biotechnology companies produced $294 billion in 2017 (PhRMA 2019), or roughly 1.5% of GDP. Although employment in these companies is relatively small (less than 1% of the U.S. workforce, based on PhRMA and IBISWorld 2021a), average compensation for biotechnology workers ($127,000) is more than double that of the average U.S. worker ($61,000). This roughly amounts to $103 billion in labor income and $20 billion in federal personal tax revenue (PhRMA 2019).
Like the COVID-19 vaccine, the products produced from biotechnology inventions and innovations can have substantial effects on mortality and morbidity, and large economic benefits from both. For example, biotechnology in agriculture has resulted in genetically engineered crops that have and can be used in the future to reduce global food insecurity. In their literature review, Berman et al. (2013) found that several studies demonstrated the benefits of first-generation crops to farmers in many developing countries and the consequential positive effects on national GDP and gross national product values, thus increasing the ability of governments to invest in infrastructure and improve the health and well-being of their populations. In medical application of biotechnology, from 1980 to 2014, more than 260 novel human therapeutics covering 230 indications have been marketed in the United States (Evens and Kaitin 2015). With the rising number of Americans with chronic conditions, many of these biotechnology-based medicines are used to treat symptoms associated with them and to allow those individuals to work productively and have a long life (Boersma, Black, and Ward 2020; Evens and Kaitin 2015). Industrial biotechnology also has great potential for mitigating climate change by using enzymes and microorganisms to make bio-based products in a diverse variety of industry sectors (e.g., agricultural biomass) (OECD 2011). These scientific breakthroughs from biotechnology have laid the foundation for fundamentally new capabilities that have the potential to transform society, the environment, and the economy.