 An official website of the United States government
 Overview
The U.S. Science and Engineering Enterprise in a Changing World
The first two and a half decades of the 21st century were a period of notable change for the United States and its science and engineering (S&E) enterprise. This period has been shaped by predicted developments—such as growing international competition and multipolarity and the dramatic growth in the development and use of computing and information and communication technologies—as well as by unforeseen events like the COVID-19 pandemic that altered the global science and technology (S&T) landscape.
The U.S. National Science Foundation (NSF) and National Science Board (NSB) celebrated their 75th anniversaries in 2025. To mark NSF’s 50th anniversary in 2000, the NSB commissioned a special edition of Science and Engineering Indicators (Indicators), with a historical focus on “the conditions that characterized U.S. science and engineering 50 years ago compared to the current state of the Nation’s S&E enterprise.” Similarly, the 2026 edition looks at the trends and developments of the last two and a half decades that have shaped the U.S. and global S&T landscape.
The 2000 edition of Indicators identified “enduring themes” that shaped the U.S. S&E enterprise in the second half of the 20th century, focusing on, among others, research and development (R&D) funding and performance; the significance of private sector R&D; science, technology, engineering, and mathematics (STEM) education and the STEM workforce; and international competitiveness (NSB 2000). These themes have remained cornerstones of the biennial Indicators series. The 2000 Indicators also highlighted the impacts of information technologies at the end of 20th century on all aspects of society, including the S&E enterprise. That report presented emerging themes that the NSB identified as important for the first decade of the 21st century: globalization of R&D and education, information technologies, knowledge-based economies, the STEM workforce, and STEM education, among others.
The 2002 Indicators highlighted U.S. strength in the support and conduct of R&D at the start of the 21st century and reported that international governments “have initiated broad national and regional efforts to capture similar benefits,” which “may foreshadow the eventual creation of new centers of scientific, technological, and engineering excellence” (NSB 2002). The report identified challenges facing the U.S. S&E enterprise due to increasing international competition for R&D investment, S&E talent, and trade. Since 2000, the global S&T landscape has been shaped, in part, by increased trade and R&D activity in Asia—East Asia notably, and China specifically. Total U.S. trade with China reached $660.7 billion in 2024, third among U.S. trading partners behind Mexico ($945.6 billion) and Canada ($917.4 billion) and up from $125.2 billion in 2000 (BEA 2025a). In constant 2017 dollars, U.S. trade of goods and services with China grew by 809% between 2000 and 2024, compared with 490% growth with Mexico and 245% growth with Canada.
The knowledge generated by R&D can have direct outcomes such as the development of new products and services as well as knowledge “spillover” effects in which “ideas generated by one inventor may lead other inventors to create other new ideas” (Myers and Lanahan 2022). There is interest in understanding the association and connections between R&D funding and performance and a diverse set of spillover effects. The Bureau of Labor Statistics routinely estimates the contribution of R&D spillovers to the domestic private nonfarm business sector's total factor productivity (TFP; see “Total Factor Productivity” section) and has done so since 1988 (BLS 2026).
In addition to evaluating the contributions of R&D spillovers to TFP, other policy relevant assessments related to R&D funding and performance and spillover effects include the following:
- The impact of the type of R&D and source of funds on the magnitude of R&D spillovers (Azoulay et al. 2019; Arora, Belenzon, and Sheer 2021; Arora et al. 2024)
- The contributions of international trade to knowledge spillovers and productivity (Coe and Helpman 1995; Coe, Helpman, and Hoffmaister 2009; CRS 2025a)
- The effects of large changes in federal nondefense R&D funding—changes unrelated to overall macroeconomic indicators—on overall productivity growth, the establishment of technology clusters and entrepreneurship, employment, manufacturing value added, and capital accumulation in specific industrial sectors (Fieldhouse and Mertens 2023; Gross and Sampat 2023; Kantor and Whalley 2025)
- The impact of federal defense R&D on private-sector R&D and productivity (Moretti, Steinwender, and Van Reenen 2019; Antolin-Diaz and Surico 2025)
- The impact of institutional factors—including patent protection, business climate, and tertiary education quality—on the magnitude of R&D spillover effects within an economy (Coe, Helpman, and Hoffmaister 2009; Foster-McGregor and Mohnen 2023; WIPO 2026)
The Indicators series and this report present data that characterize R&D contributions to innovative activity and productivity. These include R&D funding, source, and type; patents and publications as indicators of knowledge spillovers; and trade and productivity measures as indicators of output of innovative activity. The series highlights STEM education and workforce data, which are critical to understanding domestic employment patterns and the preparation of students to join the workforce and are critical to realizing the contributions of R&D funding and performance to innovative activity and productivity. Taken together, these indicators help characterize the state of the U.S. S&E enterprise in an international context.
U.S. Emphasis on Critical and Emerging Technologies
Since the 21st century, the U.S. government has emphasized critical and emerging technology (CET) areas through annual White House Office of Science and Technology Policy (OSTP)–Office of Management and Budget (OMB) memoranda on R&D budget priorities, executive orders, and formal legislative mandates. One of the first instances of a presidential administration prioritizing an emerging technology in the 21st century was the Clinton administration elevating nanotechnology to a national initiative in FY 2001. Congress codified this commitment through the 21st Century Nanotechnology Research and Development Act (P.L. 108-153) in 2003, with cumulative National Nanotechnology Initiative (NNI) funding since 2001 totaling over $45 billion through the 2025 request (NNCO 2024). Since then, Congress has supported research in select technology areas through the passage of the America COMPETES Act (P.L. 110-69) in 2007 and the America COMPETES Reauthorization Act of 2010 (P.L. 111-358). The 2007 law was passed “to invest in innovation through research and development, and to improve the competitiveness of the United States” and expressed the “sense of Congress that each Federal research agency should strive to support and promote innovation in the United States.”
The first Trump administration advanced the institutionalization of emerging technology coordination, with the OSTP-OMB FY 2020 R&D budget priorities memorandum identifying artificial intelligence (AI), quantum information science and technology (QIST), and strategic computing as “critically important” to U.S. national security and economic competitiveness (Mulvaney and Kratsios 2018). Congress passed the National Quantum Initiative Act (P.L. 115-368), which was signed into law in December 2018 “to accelerate quantum research and development for the economic and national security of the United States,” establishing the National Quantum Coordination Office within OSTP and authorizing new research centers at NSF and DOE. Agencies tasked with implementing the initiative have since expanded coordinated research activities across quantum computing, quantum networking, and quantum sensing (NQCO 2024). The National Science and Technology Council (NSTC) Select Committee on Artificial Intelligence was created in 2018 to advise the White House on interagency AI R&D budget priorities and improve interagency AI efforts “to ensure continued U.S. leadership in this field” (NSTC 2020b). Congress further institutionalized AI coordination through the National Artificial Intelligence Initiative Act of 2020 (as Division E of the William M. [Mac] Thornberry National Defense Authorization Act for Fiscal Year 2021 [P.L. 116-283]), which established the National AI Initiative Office, required development of a national AI strategy, and authorized expanded AI R&D across federal agencies. Congress enacted the CHIPS and Science Act of 2022 (P.L. 117-167), authorizing over $280 billion to increase domestic semiconductor manufacturing and expand R&D investment in critical technologies.
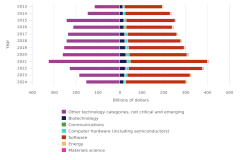
These policy and legislative frameworks have enabled technology priorities to persist across presidential administrations and changes in congressional majorities. The NSTC’s Critical and Emerging Technologies List was established in 2020 by the first Trump administration to identify technologies that inform national security–related activities, building on the October 2020 National Strategy for Critical and Emerging Technologies (NSTC 2020a). The Biden administration continued this framework, with the OSTP-OMB FY 2025 R&D budget priorities memorandum directing agencies to “advance critical and emerging technology areas such as microelectronics, biotechnology, quantum information science, advanced materials, high performance computing, and nuclear” technologies (Young and Prabhakar 2023). OSTP updated the list in 2024 and identified 18 technology categories—including AI, QIST, biotechnologies, advanced manufacturing, and semiconductors—that are “potentially significant to U.S. national security” (OSTP 2024; NSTC 2024).
The second Trump administration has continued the emphasis on CETs. The OSTP-OMB FY 2027 R&D budget priorities memorandum identifies six priority CET areas: AI, QIST, semiconductors and microelectronics, advanced communications networks, future computing technologies, and advanced manufacturing (Vought and Kratsios 2025). The memorandum also identifies biotechnologies and biomanufacturing as critical to strengthening and safeguarding American health, building the STEM workforce through STEM education and workforce development, and investing in and expanding access to research infrastructure.
The U.S. Science and Engineering Enterprise
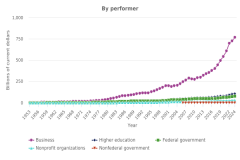
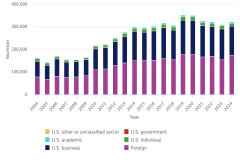
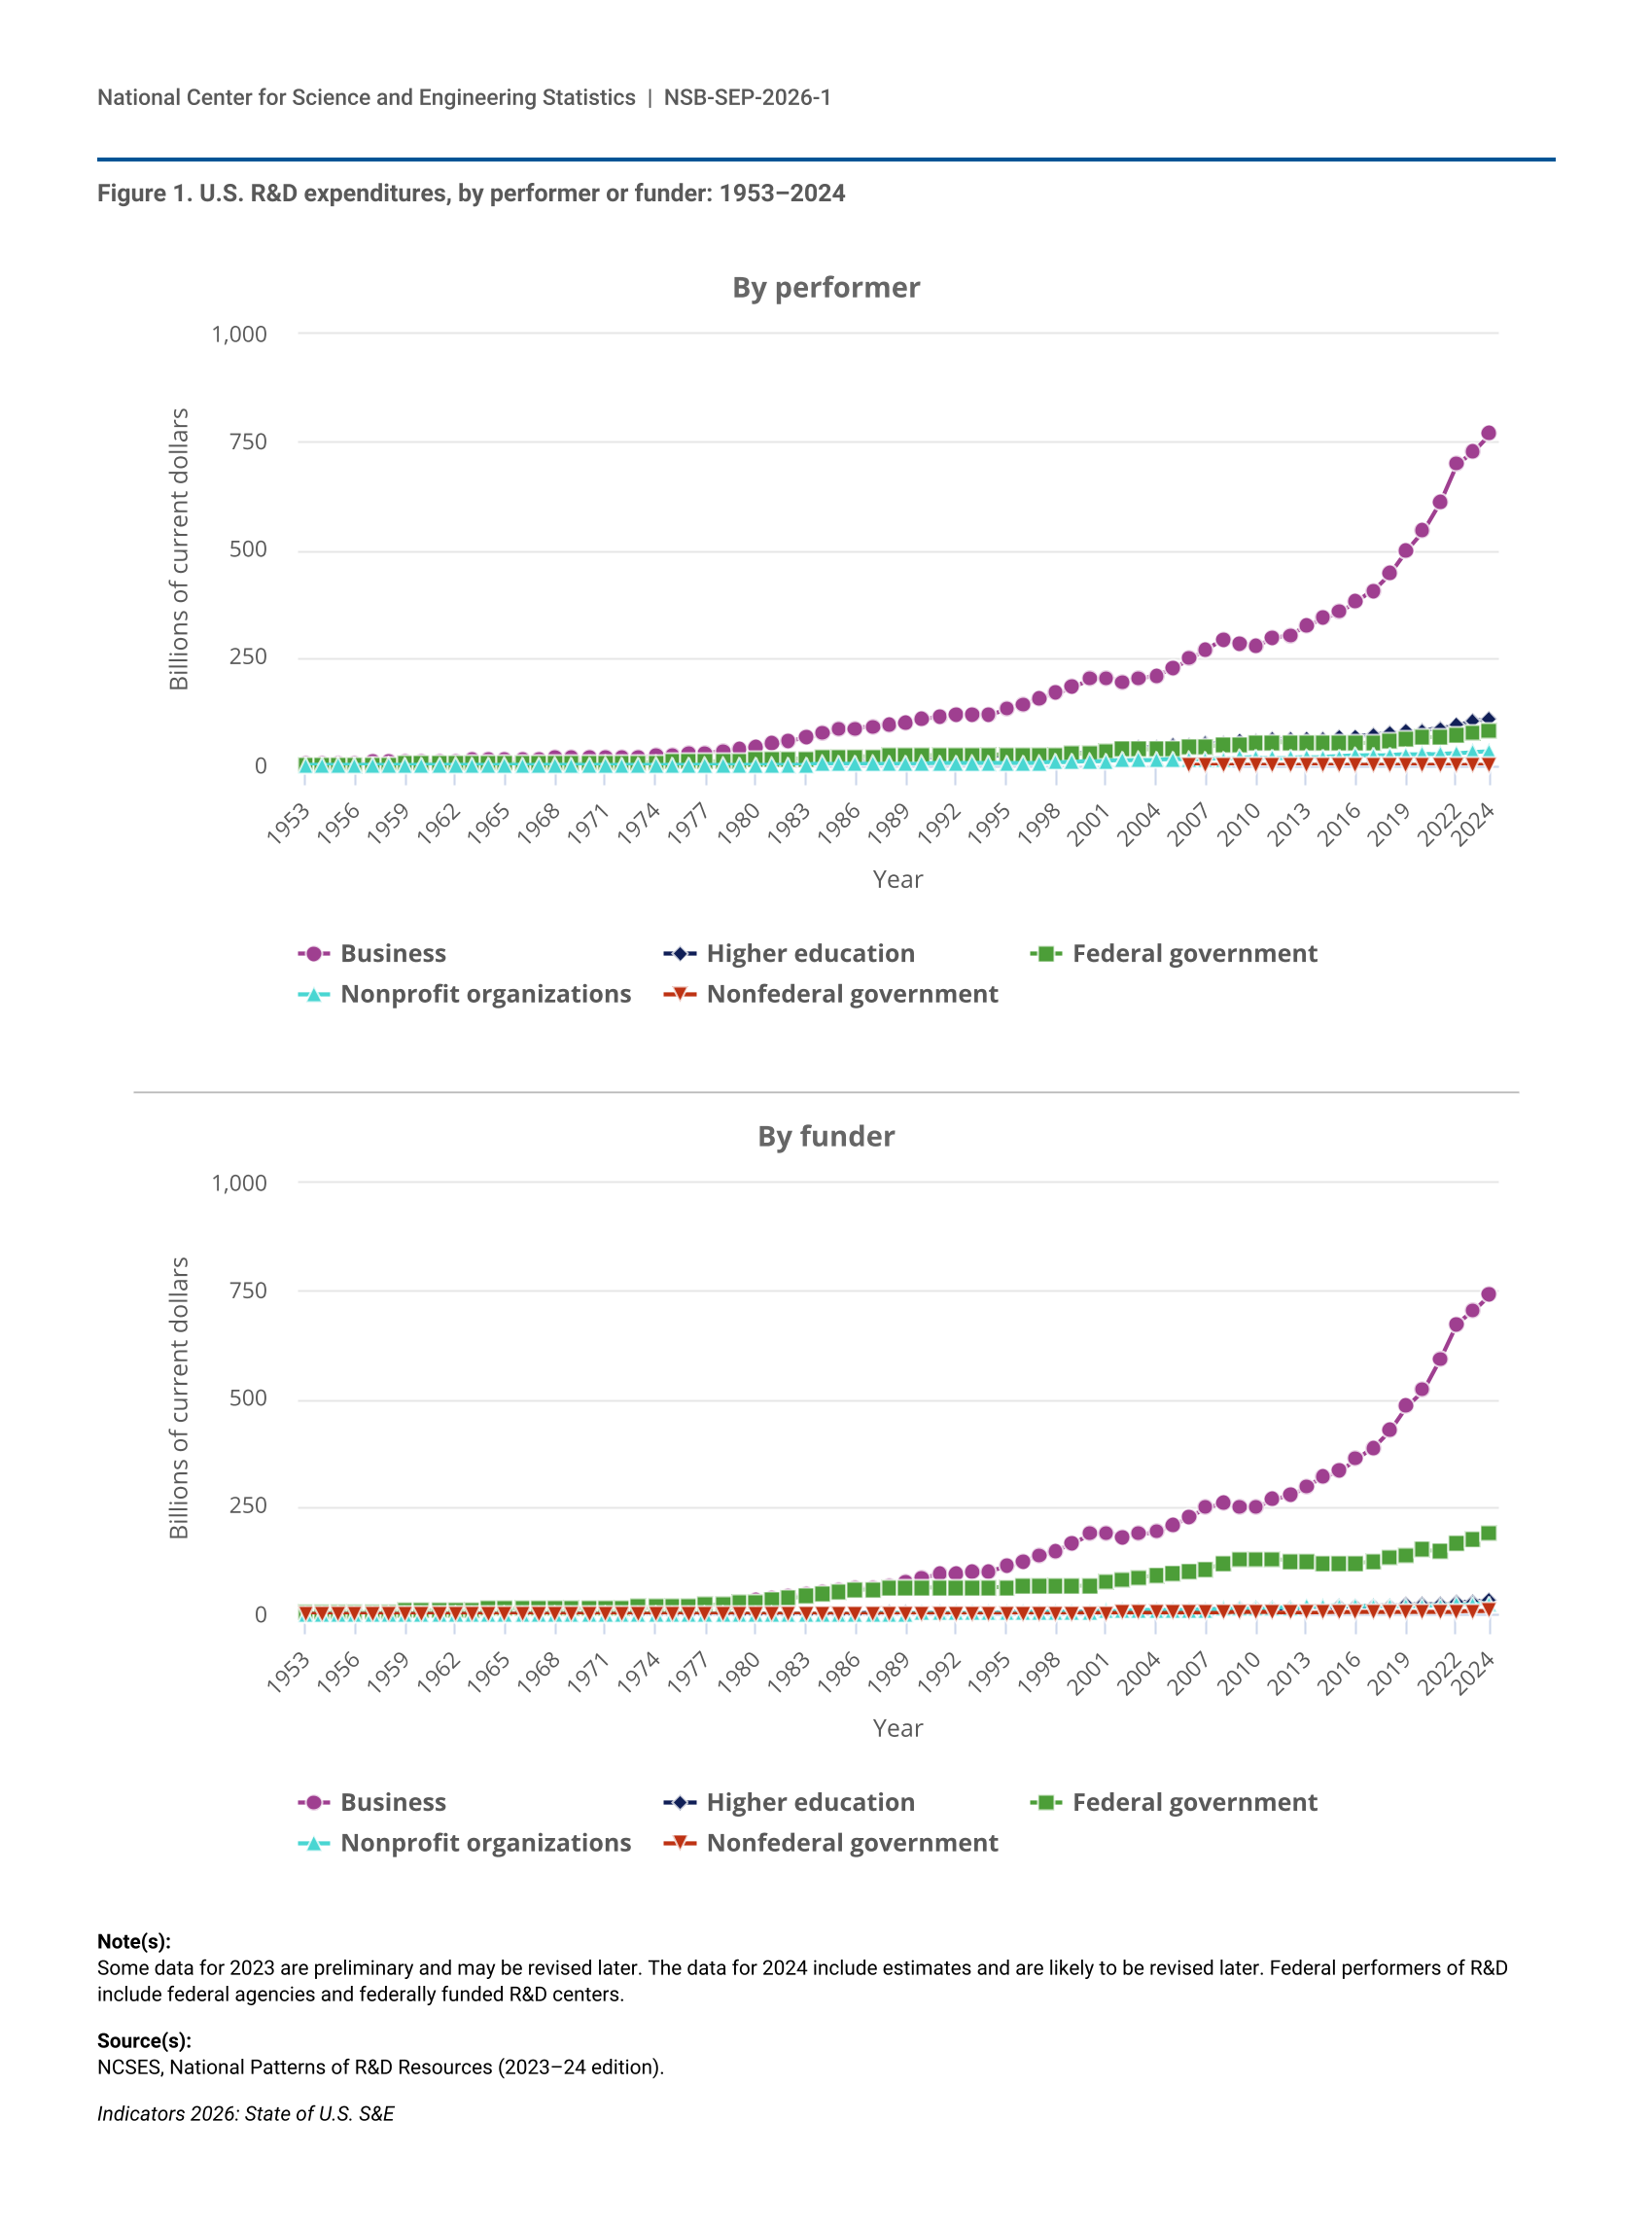
The U.S. S&E enterprise remains among the strongest globally, leading in a number of key indicators. This continued leadership, however, exists within a rapidly evolving global landscape characterized by intensifying international competition in the trade of high-technology goods and services, global investment in CETs, shifting domestic funding dynamics, and concerns about maintaining the nation’s STEM workforce pipeline. In 2024, U.S. R&D expenditures were estimated to reach $993 billion in current U.S. dollars, up from $937 billion in 2023 (Figure 1) (NCSES 2026d). In 2024, businesses performed 77% and funded 75% of all U.S. R&D, with compound annual growth rates higher than those of other sectors since 2010.
| Year | Business | Higher education | Federal government | Nonprofit organizations | Nonfederal government |
|---|---|---|---|---|---|
| 1953 | 3.6 | 0.3 | 1.1 | 0.1 | NA |
| 1954 | 4.1 | 0.3 | 1.1 | 0.1 | NA |
| 1955 | 4.4 | 0.3 | 1.3 | 0.1 | NA |
| 1956 | 6.3 | 0.4 | 1.7 | 0.1 | NA |
| 1957 | 7.3 | 0.4 | 2.0 | 0.2 | NA |
| 1958 | 8.1 | 0.5 | 2.2 | 0.2 | NA |
| 1959 | 9.2 | 0.6 | 2.5 | 0.2 | NA |
| 1960 | 10.0 | 0.7 | 2.7 | 0.3 | NA |
| 1961 | 10.4 | 0.8 | 3.1 | 0.3 | NA |
| 1962 | 11.0 | 1.0 | 3.2 | 0.4 | NA |
| 1963 | 12.2 | 1.2 | 3.7 | 0.4 | NA |
| 1964 | 13.0 | 1.4 | 4.3 | 0.4 | NA |
| 1965 | 13.8 | 1.6 | 4.4 | 0.5 | NA |
| 1966 | 15.2 | 1.8 | 4.5 | 0.5 | NA |
| 1967 | 16.0 | 2.0 | 4.8 | 0.6 | NA |
| 1968 | 17.0 | 2.2 | 4.9 | 0.6 | NA |
| 1969 | 17.8 | 2.3 | 5.2 | 0.6 | NA |
| 1970 | 17.6 | 2.4 | 5.6 | 0.7 | NA |
| 1971 | 17.8 | 2.6 | 5.8 | 0.7 | NA |
| 1972 | 19.0 | 2.8 | 6.2 | 0.8 | NA |
| 1973 | 20.7 | 3.0 | 6.4 | 0.9 | NA |
| 1974 | 22.2 | 3.2 | 6.9 | 1.0 | NA |
| 1975 | 23.5 | 3.6 | 7.6 | 1.1 | NA |
| 1976 | 26.1 | 3.9 | 8.3 | 1.1 | NA |
| 1977 | 28.9 | 4.3 | 8.9 | 1.2 | NA |
| 1978 | 32.2 | 5.0 | 10.1 | 1.4 | NA |
| 1979 | 37.1 | 5.7 | 11.0 | 1.6 | NA |
| 1980 | 43.2 | 6.5 | 11.9 | 1.7 | NA |
| 1981 | 50.4 | 7.1 | 13.0 | 1.8 | NA |
| 1982 | 57.2 | 7.6 | 14.1 | 1.9 | NA |
| 1983 | 63.7 | 8.3 | 15.8 | 2.2 | NA |
| 1984 | 73.1 | 9.2 | 17.5 | 2.5 | NA |
| 1985 | 82.4 | 10.3 | 19.2 | 2.8 | NA |
| 1986 | 85.9 | 11.5 | 19.9 | 2.9 | NA |
| 1987 | 90.2 | 12.8 | 20.4 | 3.0 | NA |
| 1988 | 94.9 | 14.2 | 21.6 | 3.2 | NA |
| 1989 | 99.9 | 15.6 | 22.7 | 3.7 | NA |
| 1990 | 107.4 | 16.9 | 23.5 | 4.1 | NA |
| 1991 | 114.7 | 18.2 | 23.3 | 4.7 | NA |
| 1992 | 116.8 | 19.4 | 24.2 | 5.0 | NA |
| 1993 | 115.4 | 20.5 | 24.5 | 5.3 | NA |
| 1994 | 117.4 | 21.6 | 24.6 | 5.6 | NA |
| 1995 | 129.8 | 22.6 | 25.4 | 5.8 | NA |
| 1996 | 142.4 | 23.7 | 25.0 | 6.2 | NA |
| 1997 | 155.4 | 24.6 | 25.2 | 6.6 | NA |
| 1998 | 167.1 | 25.6 | 25.8 | 7.2 | NA |
| 1999 | 182.1 | 27.5 | 26.8 | 8.0 | NA |
| 2000 | 200.0 | 29.9 | 28.5 | 9.6 | NA |
| 2001 | 202.0 | 32.8 | 32.8 | 11.0 | NA |
| 2002 | 193.9 | 36.7 | 35.5 | 11.9 | NA |
| 2003 | 200.7 | 40.6 | 37.2 | 12.8 | NA |
| 2004 | 208.3 | 43.3 | 37.7 | 13.4 | NA |
| 2005 | 226.2 | 45.5 | 39.6 | 14.1 | NA |
| 2006 | 247.7 | 47.4 | 41.6 | 14.0 | 0.3 |
| 2007 | 269.3 | 49.4 | 44.1 | 14.7 | 0.4 |
| 2008 | 290.7 | 52.1 | 45.6 | 15.9 | 0.5 |
| 2009 | 282.4 | 54.9 | 47.6 | 17.5 | 0.6 |
| 2010 | 279.0 | 58.1 | 50.8 | 18.1 | 0.7 |
| 2011 | 294.1 | 60.1 | 53.5 | 17.8 | 0.7 |
| 2012 | 302.3 | 60.9 | 52.1 | 17.8 | 0.7 |
| 2013 | 322.5 | 61.5 | 51.1 | 18.5 | 0.6 |
| 2014 | 340.7 | 62.3 | 52.7 | 19.6 | 0.6 |
| 2015 | 355.8 | 64.6 | 52.8 | 20.6 | 0.6 |
| 2016 | 379.5 | 67.8 | 51.2 | 22.6 | 0.6 |
| 2017 | 405.8 | 71.1 | 52.6 | 23.4 | 0.6 |
| 2018 | 445.6 | 74.9 | 58.4 | 24.4 | 0.6 |
| 2019 | 498.2 | 78.1 | 62.8 | 25.5 | 0.7 |
| 2020 | 543.2 | 80.8 | 65.1 | 26.7 | 0.7 |
| 2021 | 608.6 | 85.7 | 66.7 | 27.0 | 0.7 |
| 2022 | 697.3 | 94.3 | 71.5 | 28.1 | 0.7 |
| 2023 | 727.5 | 103.3 | 74.8 | 30.8 | 0.8 |
| 2024 | 769.0 | 110.3 | 81.0 | 32.3 | 0.8 |
| Year | Business | Higher education | Federal government | Nonprofit organizations | Nonfederal government |
|---|---|---|---|---|---|
| 1953 | 2.2 | 0.0 | 2.8 | 0.1 | 0.0 |
| 1954 | 2.4 | 0.0 | 3.1 | 0.1 | 0.0 |
| 1955 | 2.5 | 0.0 | 3.5 | 0.1 | 0.1 |
| 1956 | 3.3 | 0.0 | 5.0 | 0.1 | 0.1 |
| 1957 | 3.5 | 0.1 | 6.2 | 0.1 | 0.1 |
| 1958 | 3.7 | 0.1 | 7.0 | 0.1 | 0.1 |
| 1959 | 4.1 | 0.1 | 8.2 | 0.1 | 0.1 |
| 1960 | 4.5 | 0.1 | 8.9 | 0.1 | 0.1 |
| 1961 | 4.8 | 0.1 | 9.5 | 0.1 | 0.1 |
| 1962 | 5.1 | 0.1 | 10.1 | 0.2 | 0.1 |
| 1963 | 5.5 | 0.1 | 11.6 | 0.2 | 0.1 |
| 1964 | 5.9 | 0.1 | 12.8 | 0.2 | 0.1 |
| 1965 | 6.5 | 0.1 | 13.2 | 0.2 | 0.2 |
| 1966 | 7.3 | 0.2 | 14.2 | 0.3 | 0.2 |
| 1967 | 8.1 | 0.2 | 14.6 | 0.3 | 0.2 |
| 1968 | 9.0 | 0.2 | 15.0 | 0.3 | 0.2 |
| 1969 | 10.0 | 0.2 | 15.2 | 0.3 | 0.2 |
| 1970 | 10.4 | 0.3 | 15.0 | 0.3 | 0.2 |
| 1971 | 10.8 | 0.3 | 15.2 | 0.4 | 0.3 |
| 1972 | 11.7 | 0.3 | 16.0 | 0.4 | 0.3 |
| 1973 | 13.3 | 0.3 | 16.6 | 0.4 | 0.3 |
| 1974 | 14.9 | 0.4 | 17.3 | 0.5 | 0.3 |
| 1975 | 15.8 | 0.4 | 18.5 | 0.5 | 0.3 |
| 1976 | 17.7 | 0.5 | 20.3 | 0.6 | 0.4 |
| 1977 | 19.6 | 0.6 | 22.1 | 0.7 | 0.4 |
| 1978 | 22.5 | 0.7 | 24.4 | 0.7 | 0.4 |
| 1979 | 26.1 | 0.8 | 27.2 | 0.8 | 0.5 |
| 1980 | 30.9 | 0.9 | 30.0 | 0.9 | 0.5 |
| 1981 | 35.9 | 1.1 | 33.7 | 1.0 | 0.6 |
| 1982 | 40.7 | 1.2 | 37.1 | 1.1 | 0.6 |
| 1983 | 45.3 | 1.4 | 41.5 | 1.2 | 0.7 |
| 1984 | 52.2 | 1.5 | 46.5 | 1.4 | 0.7 |
| 1985 | 58.0 | 1.7 | 52.6 | 1.5 | 0.8 |
| 1986 | 61.0 | 2.0 | 54.6 | 1.6 | 1.0 |
| 1987 | 62.6 | 2.3 | 58.6 | 1.8 | 1.1 |
| 1988 | 68.0 | 2.5 | 60.1 | 2.1 | 1.2 |
| 1989 | 75.0 | 2.9 | 60.5 | 2.3 | 1.3 |
| 1990 | 83.2 | 3.2 | 61.6 | 2.6 | 1.4 |
| 1991 | 92.3 | 3.5 | 60.8 | 2.9 | 1.5 |
| 1992 | 96.2 | 3.6 | 60.9 | 3.1 | 1.5 |
| 1993 | 96.5 | 3.7 | 60.5 | 3.4 | 1.6 |
| 1994 | 99.2 | 3.9 | 60.8 | 3.7 | 1.6 |
| 1995 | 110.9 | 4.1 | 63.0 | 3.9 | 1.8 |
| 1996 | 123.4 | 4.4 | 63.4 | 4.2 | 1.9 |
| 1997 | 136.2 | 4.9 | 64.4 | 4.6 | 1.9 |
| 1998 | 147.8 | 5.2 | 65.9 | 5.0 | 1.9 |
| 1999 | 164.5 | 5.7 | 66.8 | 5.4 | 2.0 |
| 2000 | 186.0 | 6.3 | 67.2 | 6.3 | 2.2 |
| 2001 | 188.4 | 6.9 | 73.8 | 7.1 | 2.3 |
| 2002 | 180.7 | 7.7 | 78.9 | 8.1 | 2.6 |
| 2003 | 186.2 | 8.3 | 85.1 | 9.0 | 2.8 |
| 2004 | 191.3 | 8.6 | 90.8 | 9.0 | 2.9 |
| 2005 | 207.8 | 9.4 | 95.4 | 9.8 | 3.0 |
| 2006 | 227.2 | 10.2 | 99.9 | 10.3 | 3.3 |
| 2007 | 246.8 | 10.9 | 105.1 | 11.4 | 3.6 |
| 2008 | 258.0 | 11.7 | 117.6 | 13.2 | 4.2 |
| 2009 | 246.6 | 12.1 | 125.8 | 14.2 | 4.3 |
| 2010 | 248.1 | 12.3 | 126.6 | 15.3 | 4.3 |
| 2011 | 266.4 | 13.1 | 127.0 | 15.3 | 4.4 |
| 2012 | 275.7 | 14.3 | 123.8 | 15.7 | 4.2 |
| 2013 | 297.2 | 15.3 | 120.1 | 17.3 | 4.2 |
| 2014 | 318.4 | 16.2 | 118.4 | 18.8 | 4.2 |
| 2015 | 333.2 | 17.3 | 119.5 | 20.2 | 4.3 |
| 2016 | 360.3 | 18.9 | 118.2 | 19.4 | 5.0 |
| 2017 | 386.5 | 20.0 | 122.4 | 19.5 | 5.1 |
| 2018 | 426.5 | 21.1 | 131.0 | 20.0 | 5.3 |
| 2019 | 482.2 | 21.9 | 135.6 | 20.0 | 5.5 |
| 2020 | 520.3 | 22.6 | 148.0 | 19.9 | 5.7 |
| 2021 | 590.9 | 23.9 | 147.3 | 20.9 | 5.7 |
| 2022 | 673.1 | 26.6 | 164.5 | 21.6 | 6.0 |
| 2023 | 703.9 | 29.5 | 173.4 | 23.8 | 6.7 |
| 2024 | 743.0 | 31.8 | 185.9 | 25.4 | 7.3 |
Some data for 2023 are preliminary and may be revised later. The data for 2024 include estimates and are likely to be revised later. Federal performers of R&D include federal agencies and federally funded R&D centers.
NCSES, National Patterns of R&D Resources (2023–24 edition).
Indicators 2026: State of U.S. S&E
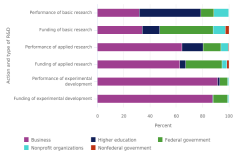
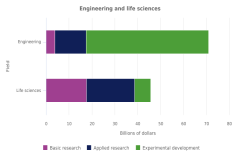
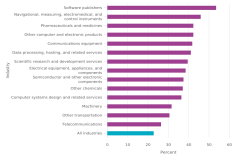
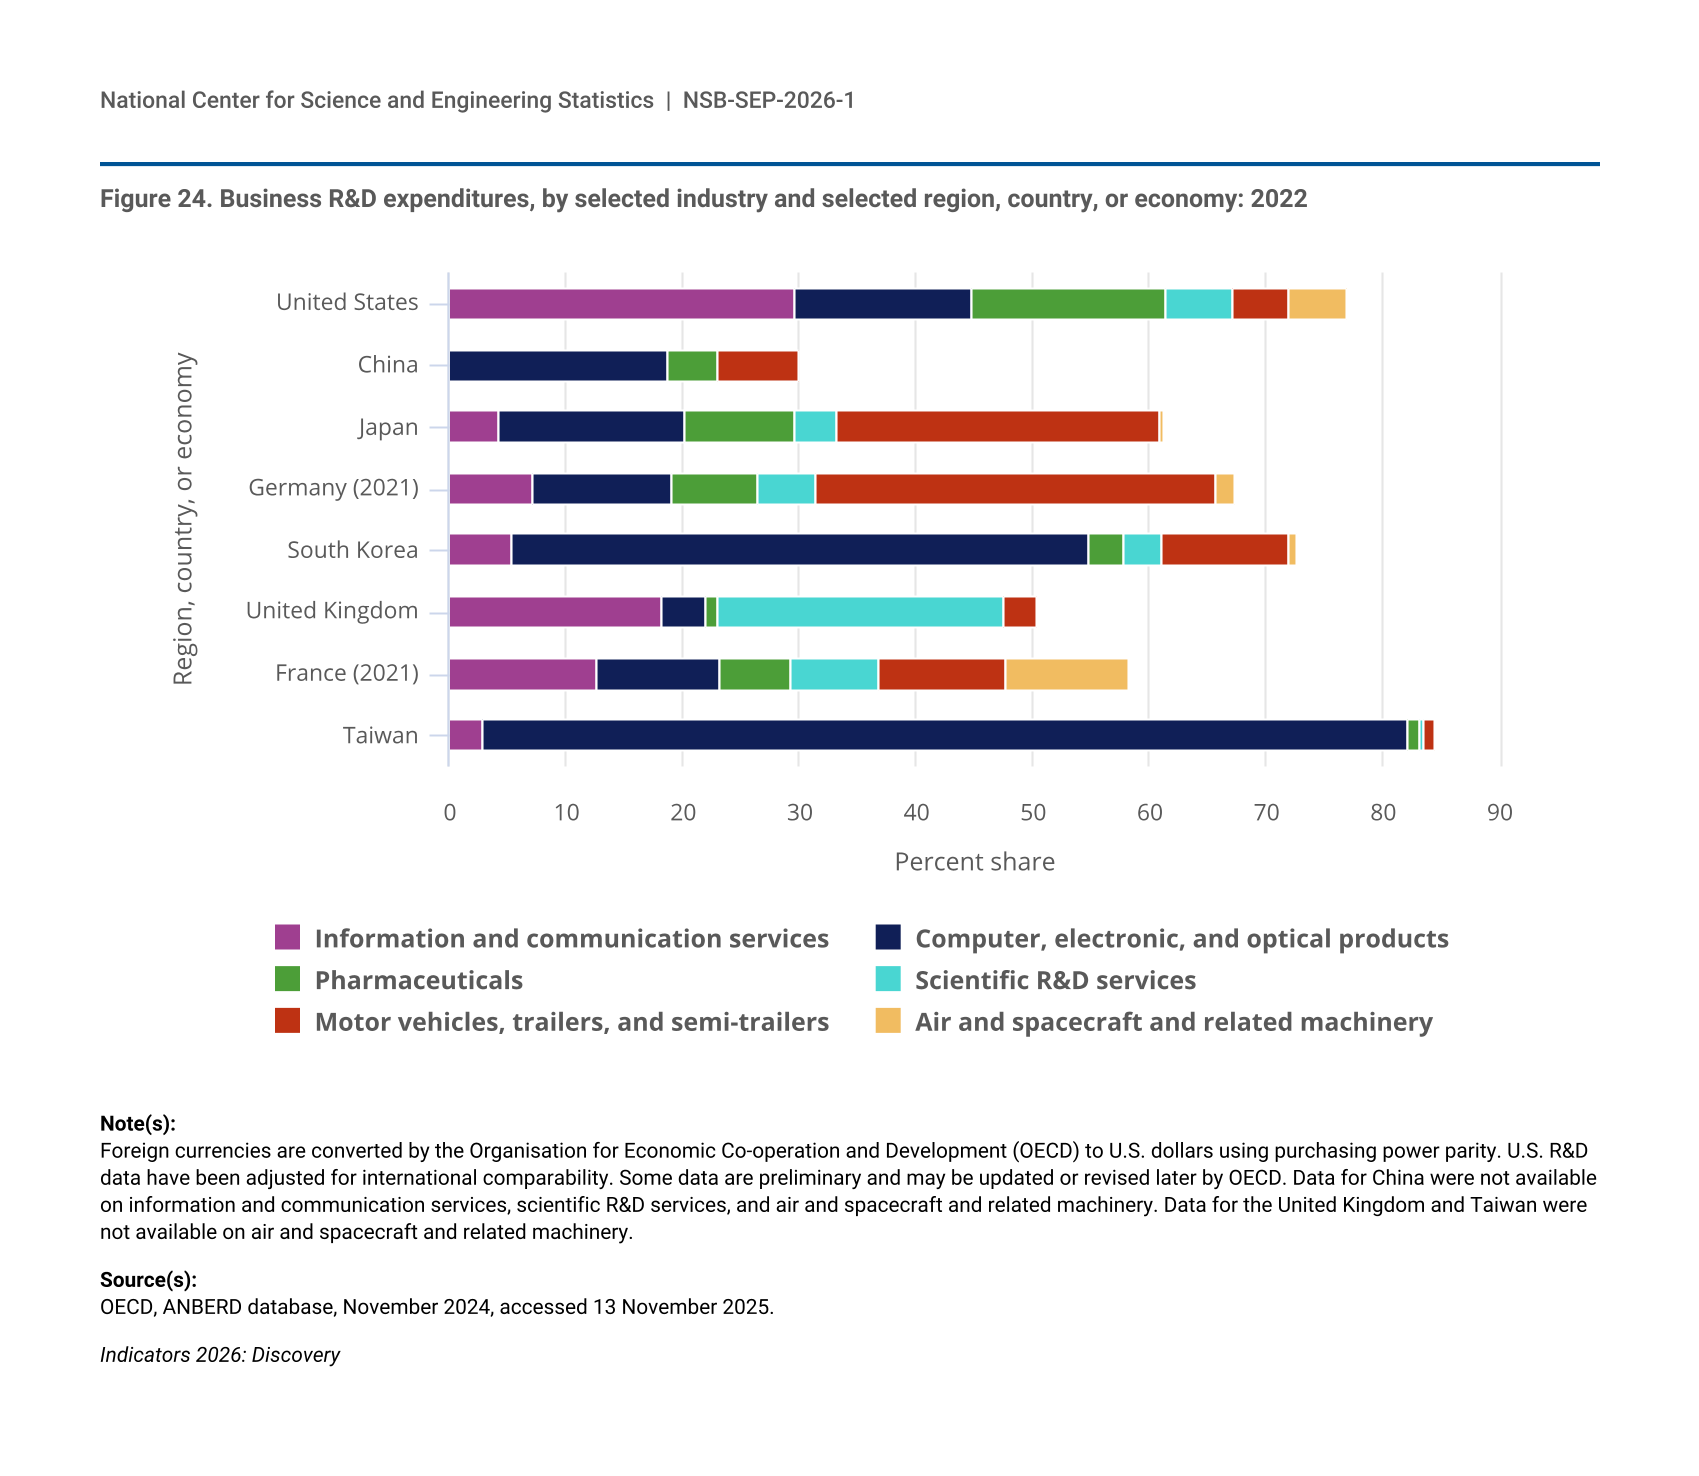
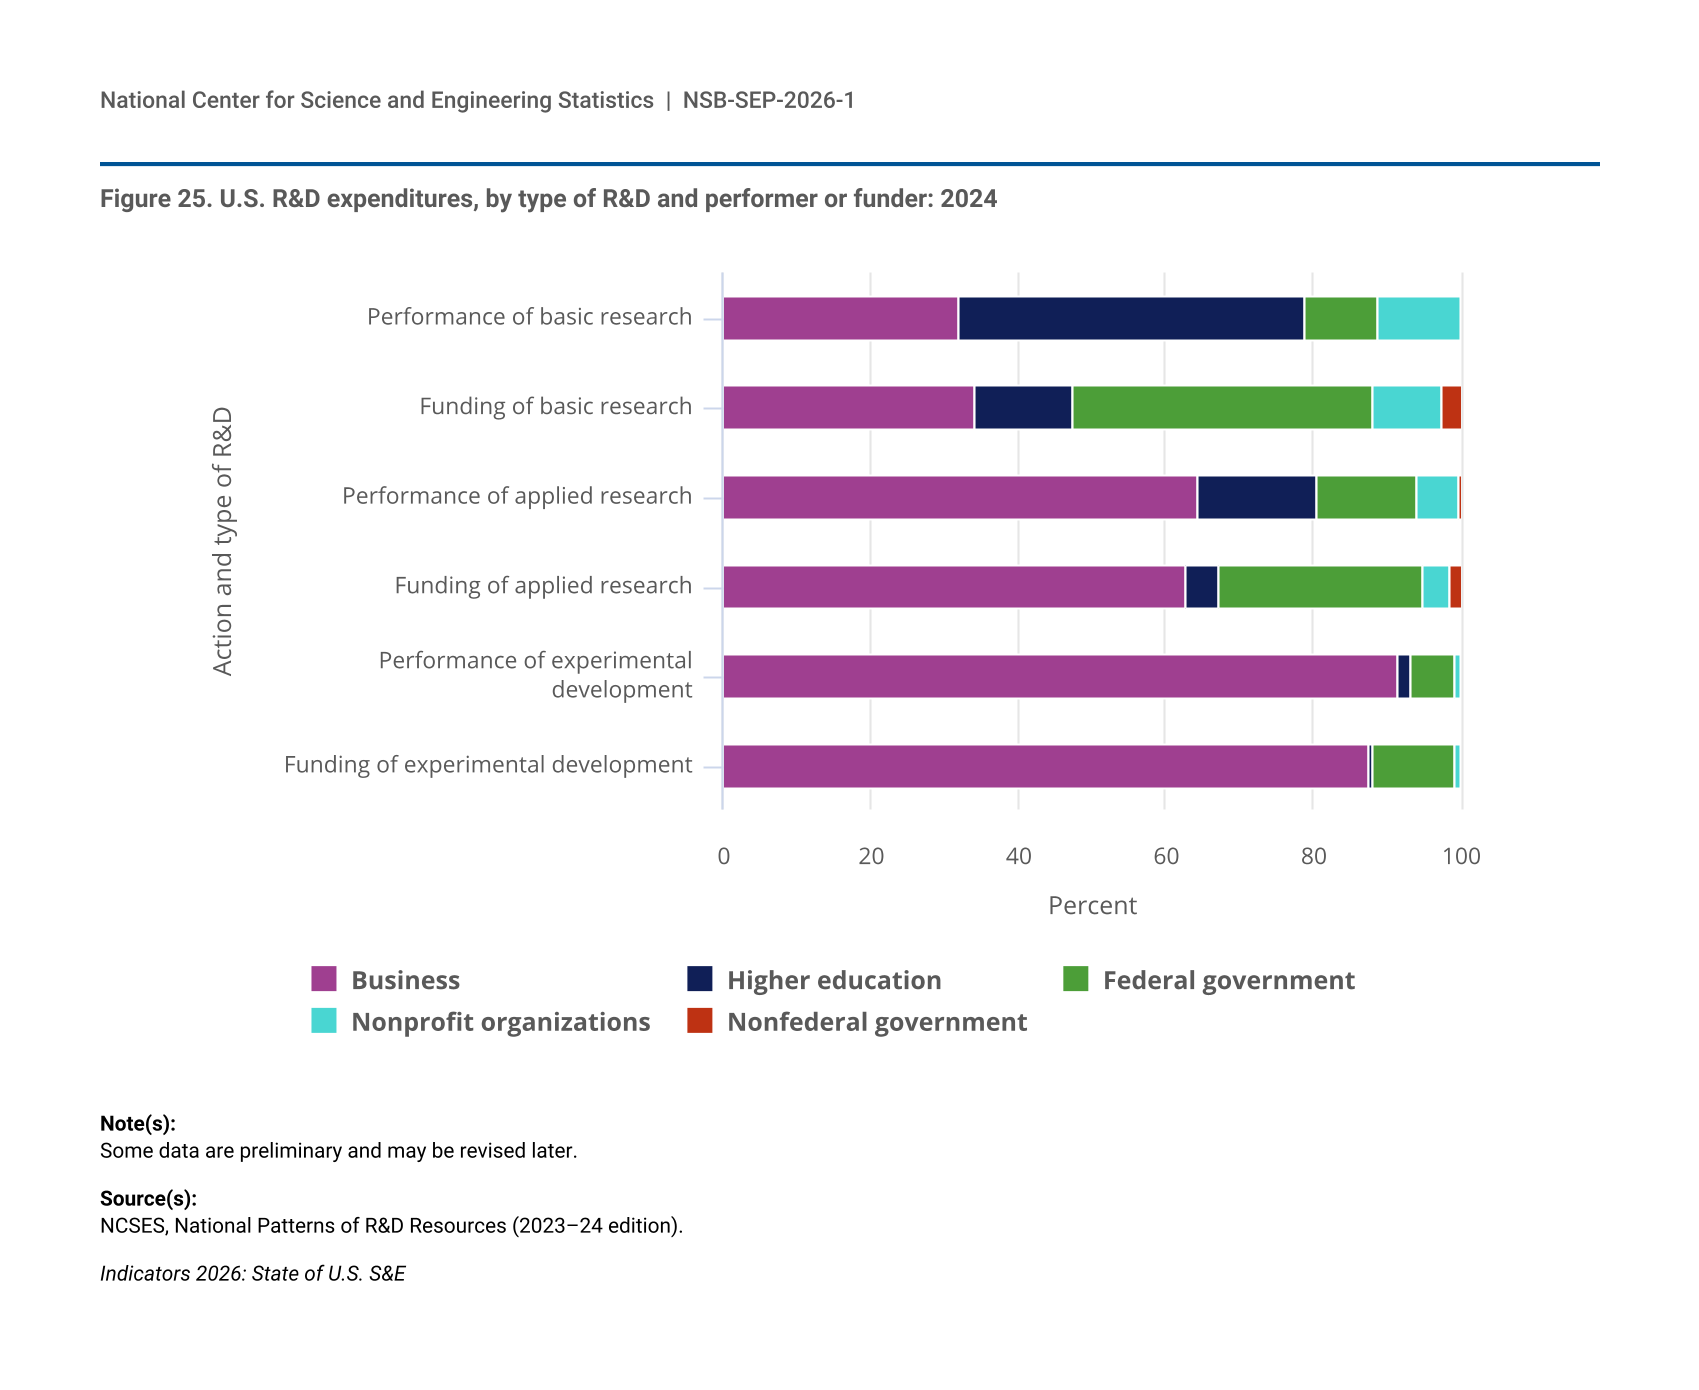
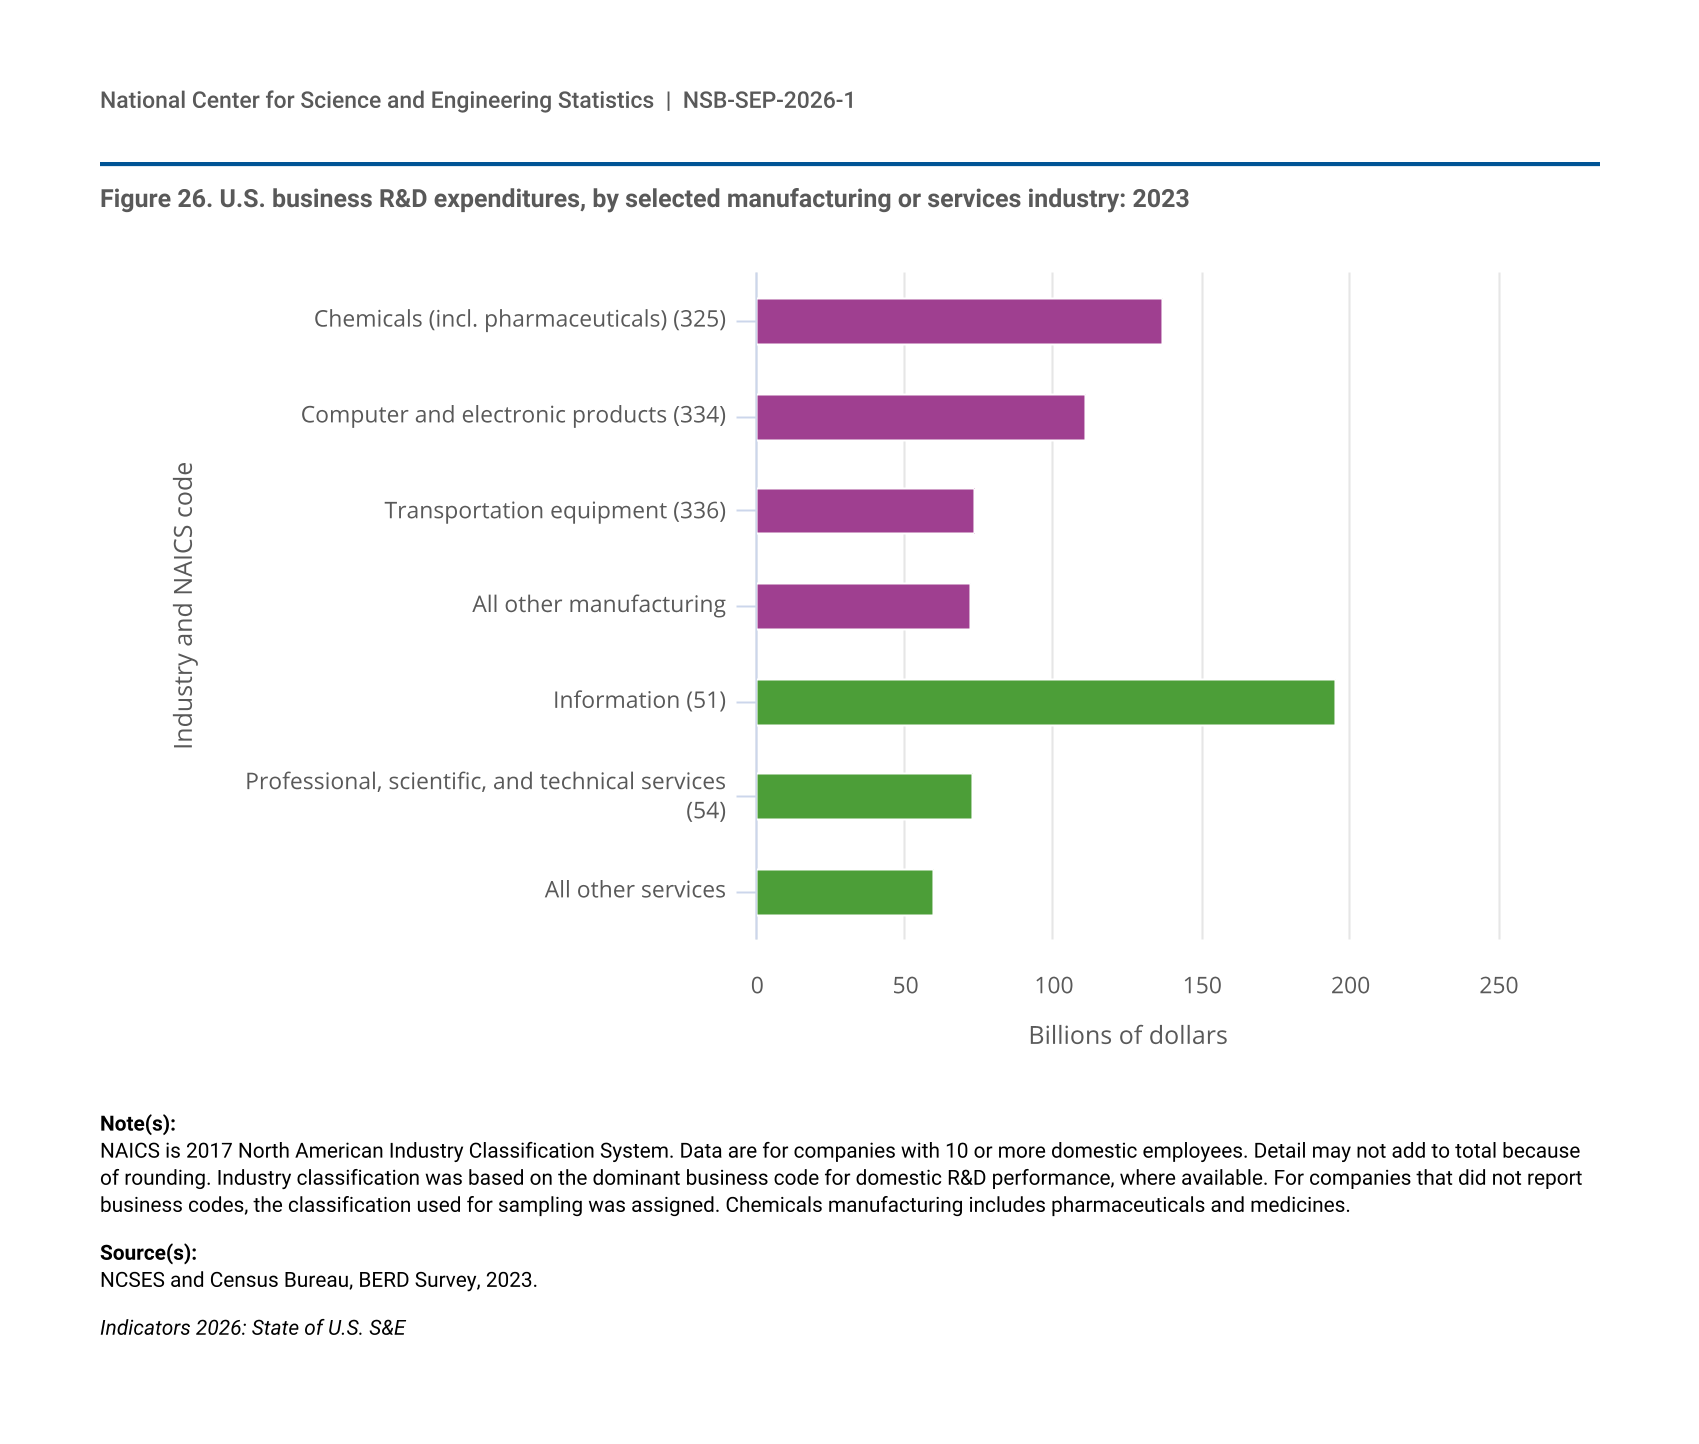
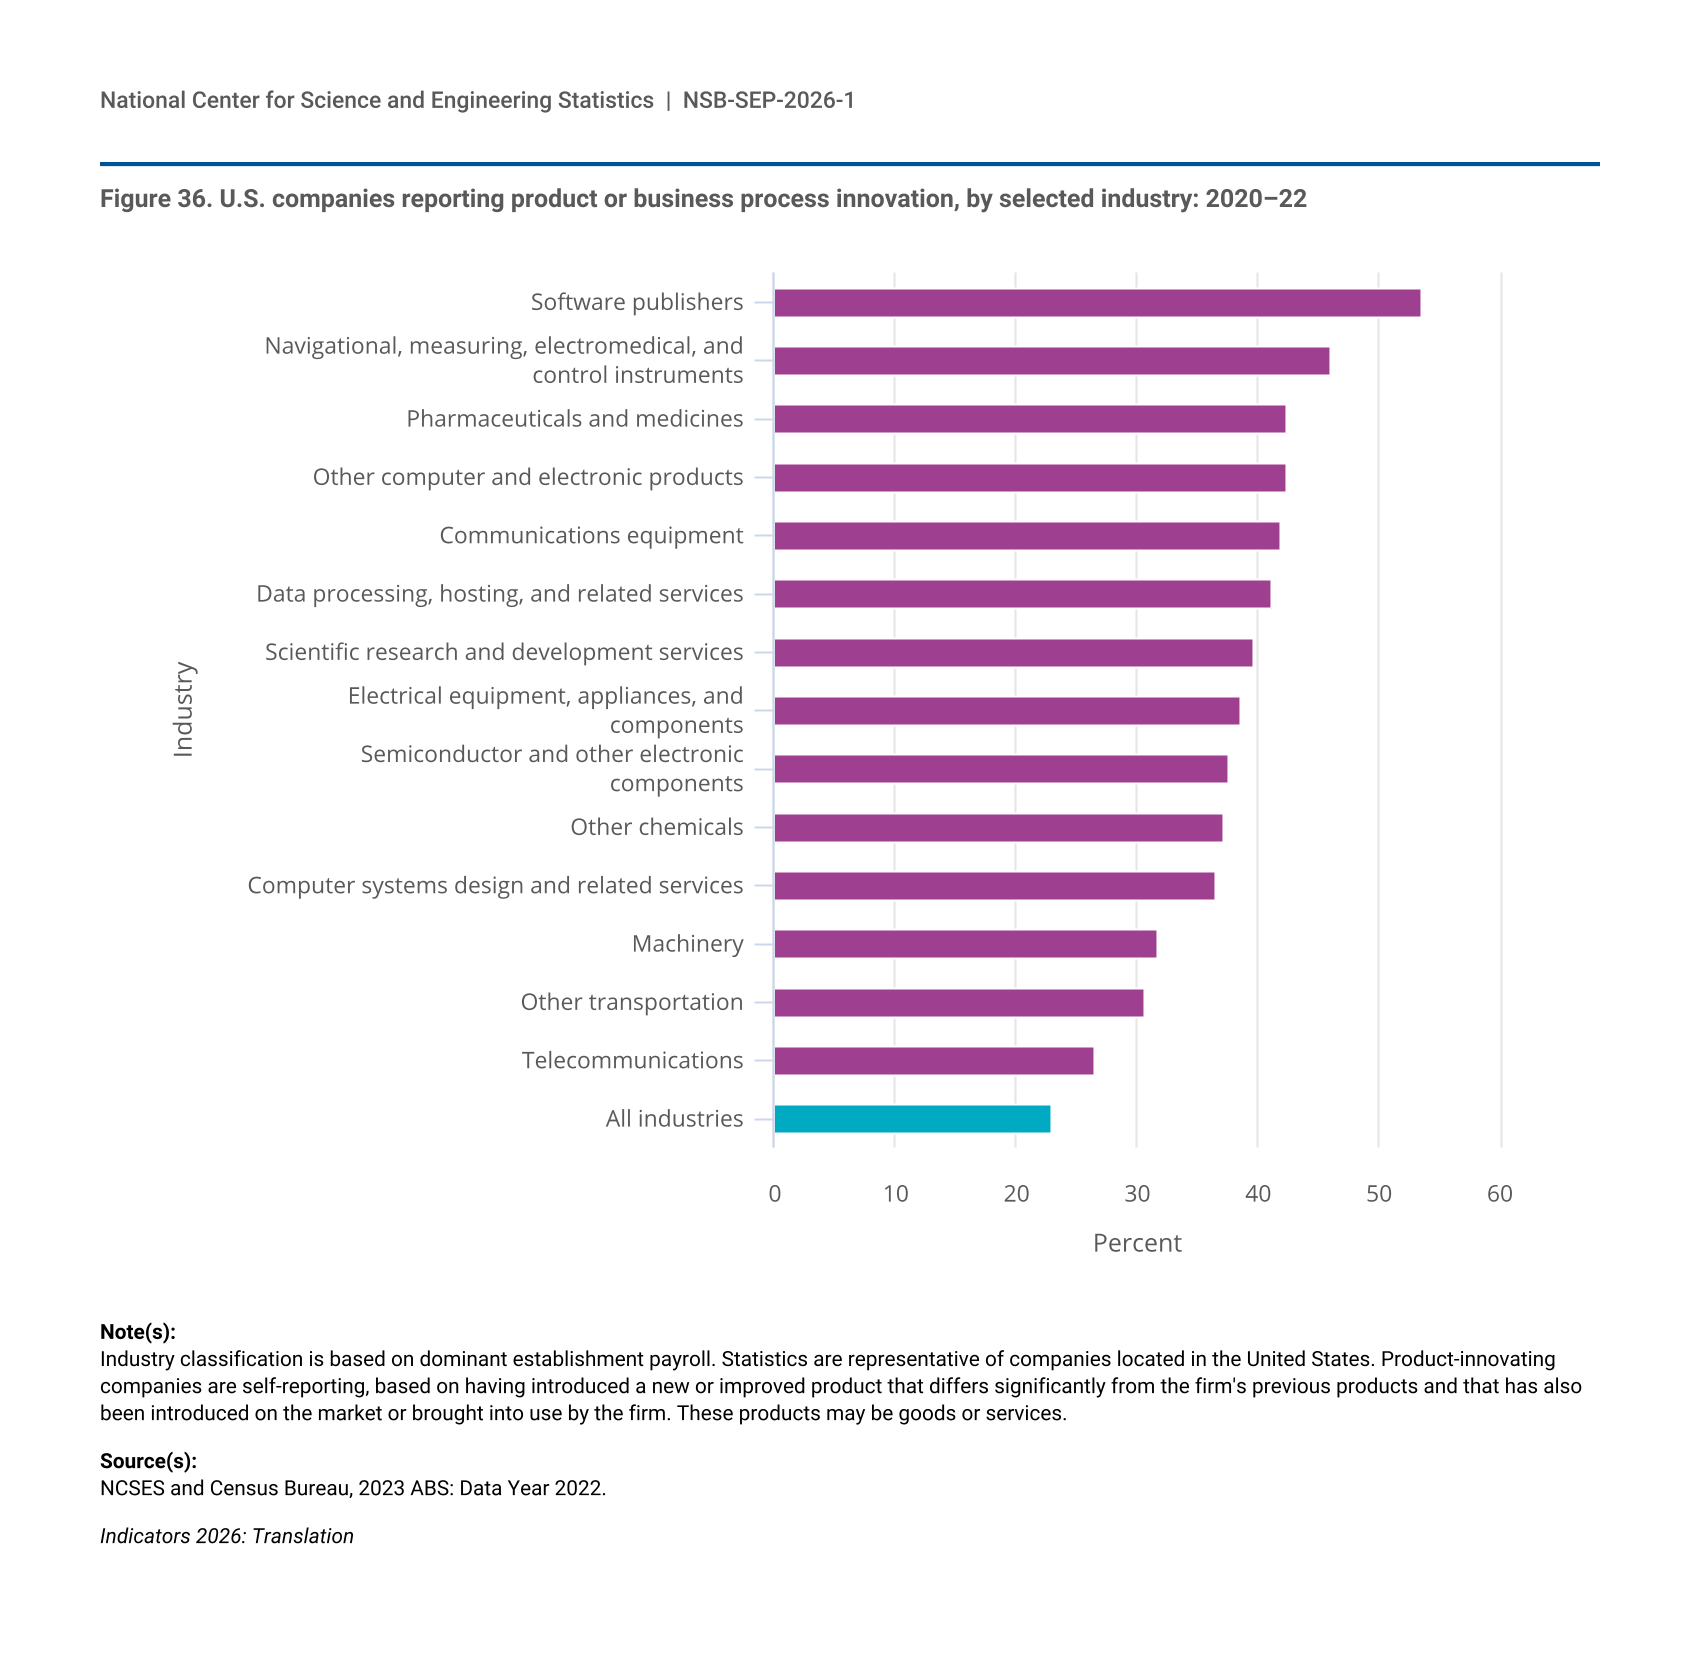
R&D activities are classified into three types of R&D: basic research, applied research, and experimental development (see the “Glossary” section for definitions). This private-sector expansion has fundamentally reshaped the funding of basic research. The share of business funding for basic research grew from 19% to 34% between 2000 and 2024, while the federal government’s share declined from 58% to 40% (NCSES National Patterns 2023–24: Table 7). In 2024, experimental development accounted for about two-thirds (67%) of U.S. R&D performance, applied research accounted for 18%, and basic research accounted for 15% (NCSES 2026b). The predominance of experimental development is consistent with the business sector’s role as the largest performer and funder of R&D, given its focus on closer-to-market applications. This pattern of domestic R&D has remained fairly consistent since 2000 (Table 1). Across all industries within the business sector—including manufacturing and services—R&D investment is heavily concentrated in software: 42% of U.S. business R&D in 2023 focused on software products and embedded software technologies.
a Some data for 2023 are preliminary and may be revised later.
b The data for 2024 are estimates and are likely to be revised later.
Data throughout the time series reported here are consistently based on the Organisation for Economic Co-operation and Development (OECD) Frascati Manual 2015 (OECD 2015) definitions for basic research, applied research, and experimental development. Prior to 2010, however, some changes were introduced in the questionnaires of the sectoral expenditure surveys to improve the accuracy of respondents' classification of their R&D by type. Accordingly, small percentage changes in the historical data may not be meaningful.
NCSES, National Patterns of R&D Resources (2023–24 edition).
Indicators 2026: State of U.S. S&E
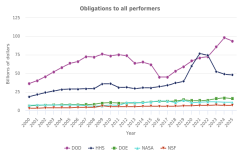
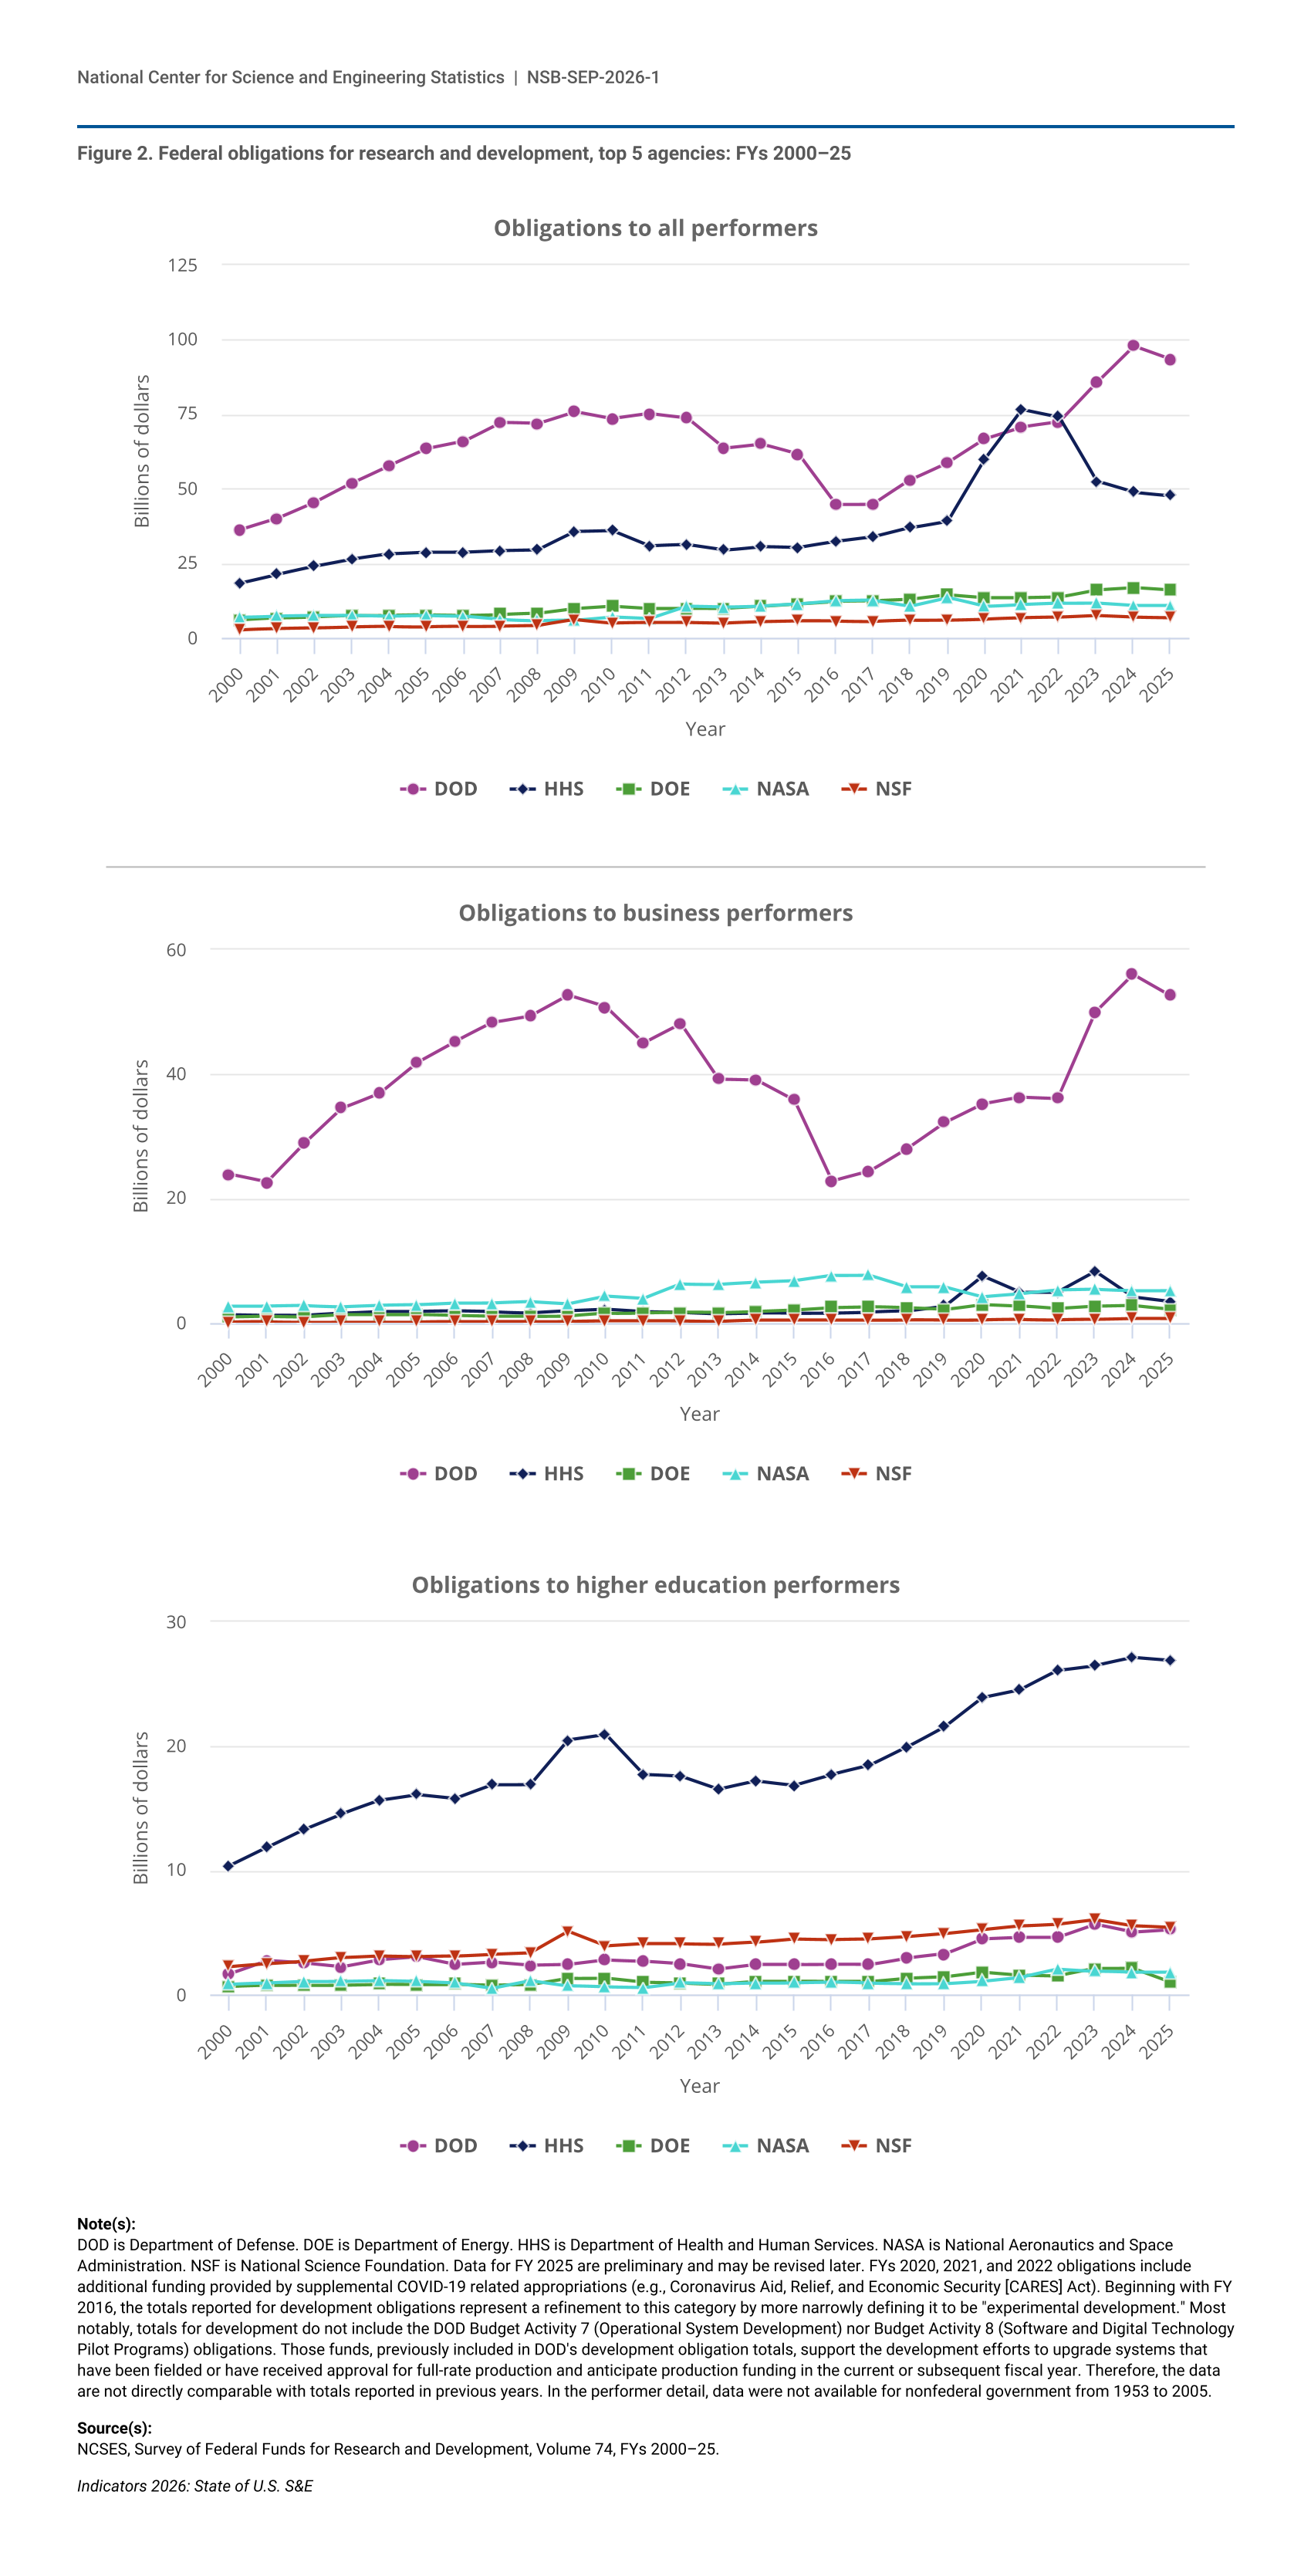
Since 2000, total federal obligations for R&D have been dominated by the Department of Defense (DOD) and the Department of Health and Human Services (HHS) (Figure 2). However, when looking at federal R&D obligations to business R&D performers (e.g., firms) and higher education R&D performers (e.g., principal investigators at academic institutions), a distinct pattern emerges: DOD has dominated funding for business performers since 2000, while HHS has dominated funding for higher education performers, with NSF being the second-largest agency funder for higher education performers over the same period except in 2001, when DOD was the second largest (Figure 2).
| Year | DOD | HHS | DOE | NASA | NSF |
|---|---|---|---|---|---|
| 2000 | 36.21 | 18.43 | 6.06 | 6.88 | 2.73 |
| 2001 | 39.98 | 21.34 | 6.67 | 7.35 | 3.04 |
| 2002 | 45.41 | 24.01 | 7.04 | 7.51 | 3.26 |
| 2003 | 51.90 | 26.40 | 7.41 | 7.50 | 3.61 |
| 2004 | 57.79 | 28.13 | 7.55 | 7.18 | 3.77 |
| 2005 | 63.39 | 28.75 | 7.73 | 7.39 | 3.74 |
| 2006 | 65.87 | 28.77 | 7.56 | 7.21 | 3.79 |
| 2007 | 72.21 | 29.30 | 7.88 | 6.13 | 3.97 |
| 2008 | 71.83 | 29.55 | 8.24 | 5.83 | 4.14 |
| 2009 | 75.86 | 35.58 | 9.89 | 5.94 | 6.10 |
| 2010 | 73.47 | 35.93 | 10.69 | 7.12 | 5.02 |
| 2011 | 75.16 | 30.85 | 9.95 | 6.57 | 5.15 |
| 2012 | 73.80 | 31.20 | 9.95 | 10.66 | 5.17 |
| 2013 | 63.56 | 29.38 | 9.84 | 10.37 | 4.96 |
| 2014 | 64.98 | 30.66 | 10.53 | 10.75 | 5.40 |
| 2015 | 61.51 | 30.27 | 11.39 | 11.36 | 5.67 |
| 2016 | 44.75 | 32.22 | 12.21 | 12.40 | 5.59 |
| 2017 | 44.87 | 33.77 | 12.31 | 12.59 | 5.52 |
| 2018 | 52.97 | 36.91 | 12.83 | 10.72 | 5.85 |
| 2019 | 58.78 | 39.19 | 14.38 | 13.57 | 6.00 |
| 2020 | 66.70 | 60.01 | 13.45 | 10.54 | 6.35 |
| 2021 | 70.71 | 76.65 | 13.45 | 11.21 | 6.71 |
| 2022 | 72.35 | 74.10 | 13.70 | 11.62 | 6.90 |
| 2023 | 85.54 | 52.53 | 16.15 | 11.72 | 7.49 |
| 2024 | 97.86 | 48.79 | 16.89 | 10.90 | 7.00 |
| 2025 | 93.35 | 47.72 | 16.03 | 10.94 | 6.83 |
| Year | DOD | HHS | DOE | NASA | NSF |
|---|---|---|---|---|---|
| 2000 | 23.90 | 1.32 | 0.92 | 2.64 | 0.12 |
| 2001 | 22.62 | 1.22 | 1.04 | 2.66 | 0.14 |
| 2002 | 28.86 | 1.18 | 0.99 | 2.75 | 0.12 |
| 2003 | 34.54 | 1.52 | 1.33 | 2.60 | 0.13 |
| 2004 | 37.00 | 1.82 | 1.31 | 2.80 | 0.13 |
| 2005 | 41.92 | 1.82 | 1.31 | 2.88 | 0.13 |
| 2006 | 45.25 | 1.89 | 1.13 | 3.16 | 0.14 |
| 2007 | 48.30 | 1.76 | 1.01 | 3.17 | 0.16 |
| 2008 | 49.37 | 1.62 | 1.03 | 3.37 | 0.16 |
| 2009 | 52.69 | 1.91 | 1.10 | 3.05 | 0.23 |
| 2010 | 50.80 | 2.15 | 1.51 | 4.28 | 0.32 |
| 2011 | 45.04 | 1.77 | 1.61 | 3.90 | 0.30 |
| 2012 | 48.14 | 1.68 | 1.67 | 6.22 | 0.29 |
| 2013 | 39.22 | 1.47 | 1.63 | 6.21 | 0.21 |
| 2014 | 39.07 | 1.58 | 1.86 | 6.52 | 0.39 |
| 2015 | 35.84 | 1.52 | 2.09 | 6.76 | 0.41 |
| 2016 | 22.78 | 1.59 | 2.48 | 7.61 | 0.39 |
| 2017 | 24.36 | 1.74 | 2.59 | 7.68 | 0.41 |
| 2018 | 28.03 | 1.89 | 2.38 | 5.78 | 0.47 |
| 2019 | 32.23 | 2.72 | 2.13 | 5.77 | 0.40 |
| 2020 | 35.23 | 7.58 | 2.97 | 4.20 | 0.46 |
| 2021 | 36.31 | 4.95 | 2.72 | 4.65 | 0.51 |
| 2022 | 36.10 | 4.97 | 2.25 | 5.23 | 0.48 |
| 2023 | 50.01 | 8.24 | 2.62 | 5.35 | 0.51 |
| 2024 | 56.08 | 4.13 | 2.76 | 5.17 | 0.67 |
| 2025 | 52.63 | 3.42 | 2.19 | 5.18 | 0.66 |
| Year | DOD | HHS | DOE | NASA | NSF |
|---|---|---|---|---|---|
| 2000 | 1.68 | 10.37 | 0.67 | 0.85 | 2.27 |
| 2001 | 2.76 | 11.85 | 0.74 | 0.94 | 2.50 |
| 2002 | 2.55 | 13.33 | 0.76 | 1.07 | 2.70 |
| 2003 | 2.25 | 14.58 | 0.79 | 1.10 | 2.98 |
| 2004 | 2.81 | 15.64 | 0.85 | 1.17 | 3.12 |
| 2005 | 3.04 | 16.10 | 0.83 | 1.10 | 3.07 |
| 2006 | 2.43 | 15.79 | 0.86 | 0.98 | 3.11 |
| 2007 | 2.61 | 16.89 | 0.77 | 0.55 | 3.27 |
| 2008 | 2.36 | 16.92 | 0.82 | 1.15 | 3.38 |
| 2009 | 2.42 | 20.48 | 1.33 | 0.73 | 5.09 |
| 2010 | 2.79 | 20.92 | 1.35 | 0.62 | 3.92 |
| 2011 | 2.70 | 17.73 | 1.01 | 0.57 | 4.10 |
| 2012 | 2.49 | 17.58 | 0.96 | 0.97 | 4.10 |
| 2013 | 2.07 | 16.54 | 0.86 | 0.88 | 4.08 |
| 2014 | 2.43 | 17.20 | 1.08 | 0.95 | 4.23 |
| 2015 | 2.43 | 16.87 | 1.08 | 0.98 | 4.51 |
| 2016 | 2.45 | 17.72 | 1.06 | 1.02 | 4.46 |
| 2017 | 2.42 | 18.43 | 1.06 | 0.93 | 4.50 |
| 2018 | 2.96 | 19.94 | 1.35 | 0.90 | 4.68 |
| 2019 | 3.29 | 21.59 | 1.46 | 0.92 | 4.92 |
| 2020 | 4.52 | 23.93 | 1.84 | 1.11 | 5.24 |
| 2021 | 4.63 | 24.56 | 1.60 | 1.40 | 5.54 |
| 2022 | 4.62 | 26.10 | 1.53 | 2.06 | 5.69 |
| 2023 | 5.68 | 26.49 | 2.11 | 1.90 | 6.05 |
| 2024 | 5.04 | 27.13 | 2.14 | 1.8 | 5.56 |
| 2025 | 5.24 | 26.9 | 1.04 | 1.81 | 5.42 |
DOD is Department of Defense. DOE is Department of Energy. HHS is Department of Health and Human Services. NASA is National Aeronautics and Space Administration. NSF is National Science Foundation. Data for FY 2025 are preliminary and may be revised later. FYs 2020, 2021, and 2022 obligations include additional funding provided by supplemental COVID-19 related appropriations (e.g., Coronavirus Aid, Relief, and Economic Security [CARES] Act). Beginning with FY 2016, the totals reported for development obligations represent a refinement to this category by more narrowly defining it to be "experimental development." Most notably, totals for development do not include the DOD Budget Activity 7 (Operational System Development) nor Budget Activity 8 (Software and Digital Technology Pilot Programs) obligations. Those funds, previously included in DOD's development obligation totals, support the development efforts to upgrade systems that have been fielded or have received approval for full-rate production and anticipate production funding in the current or subsequent fiscal year. Therefore, the data are not directly comparable with totals reported in previous years. In the performer detail, data were not available for nonfederal government from 1953 to 2005.
NCSES, Survey of Federal Funds for Research and Development, Volume 74, FYs 2000–25.
Indicators 2026: State of U.S. S&E
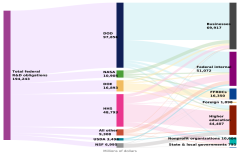
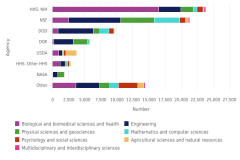
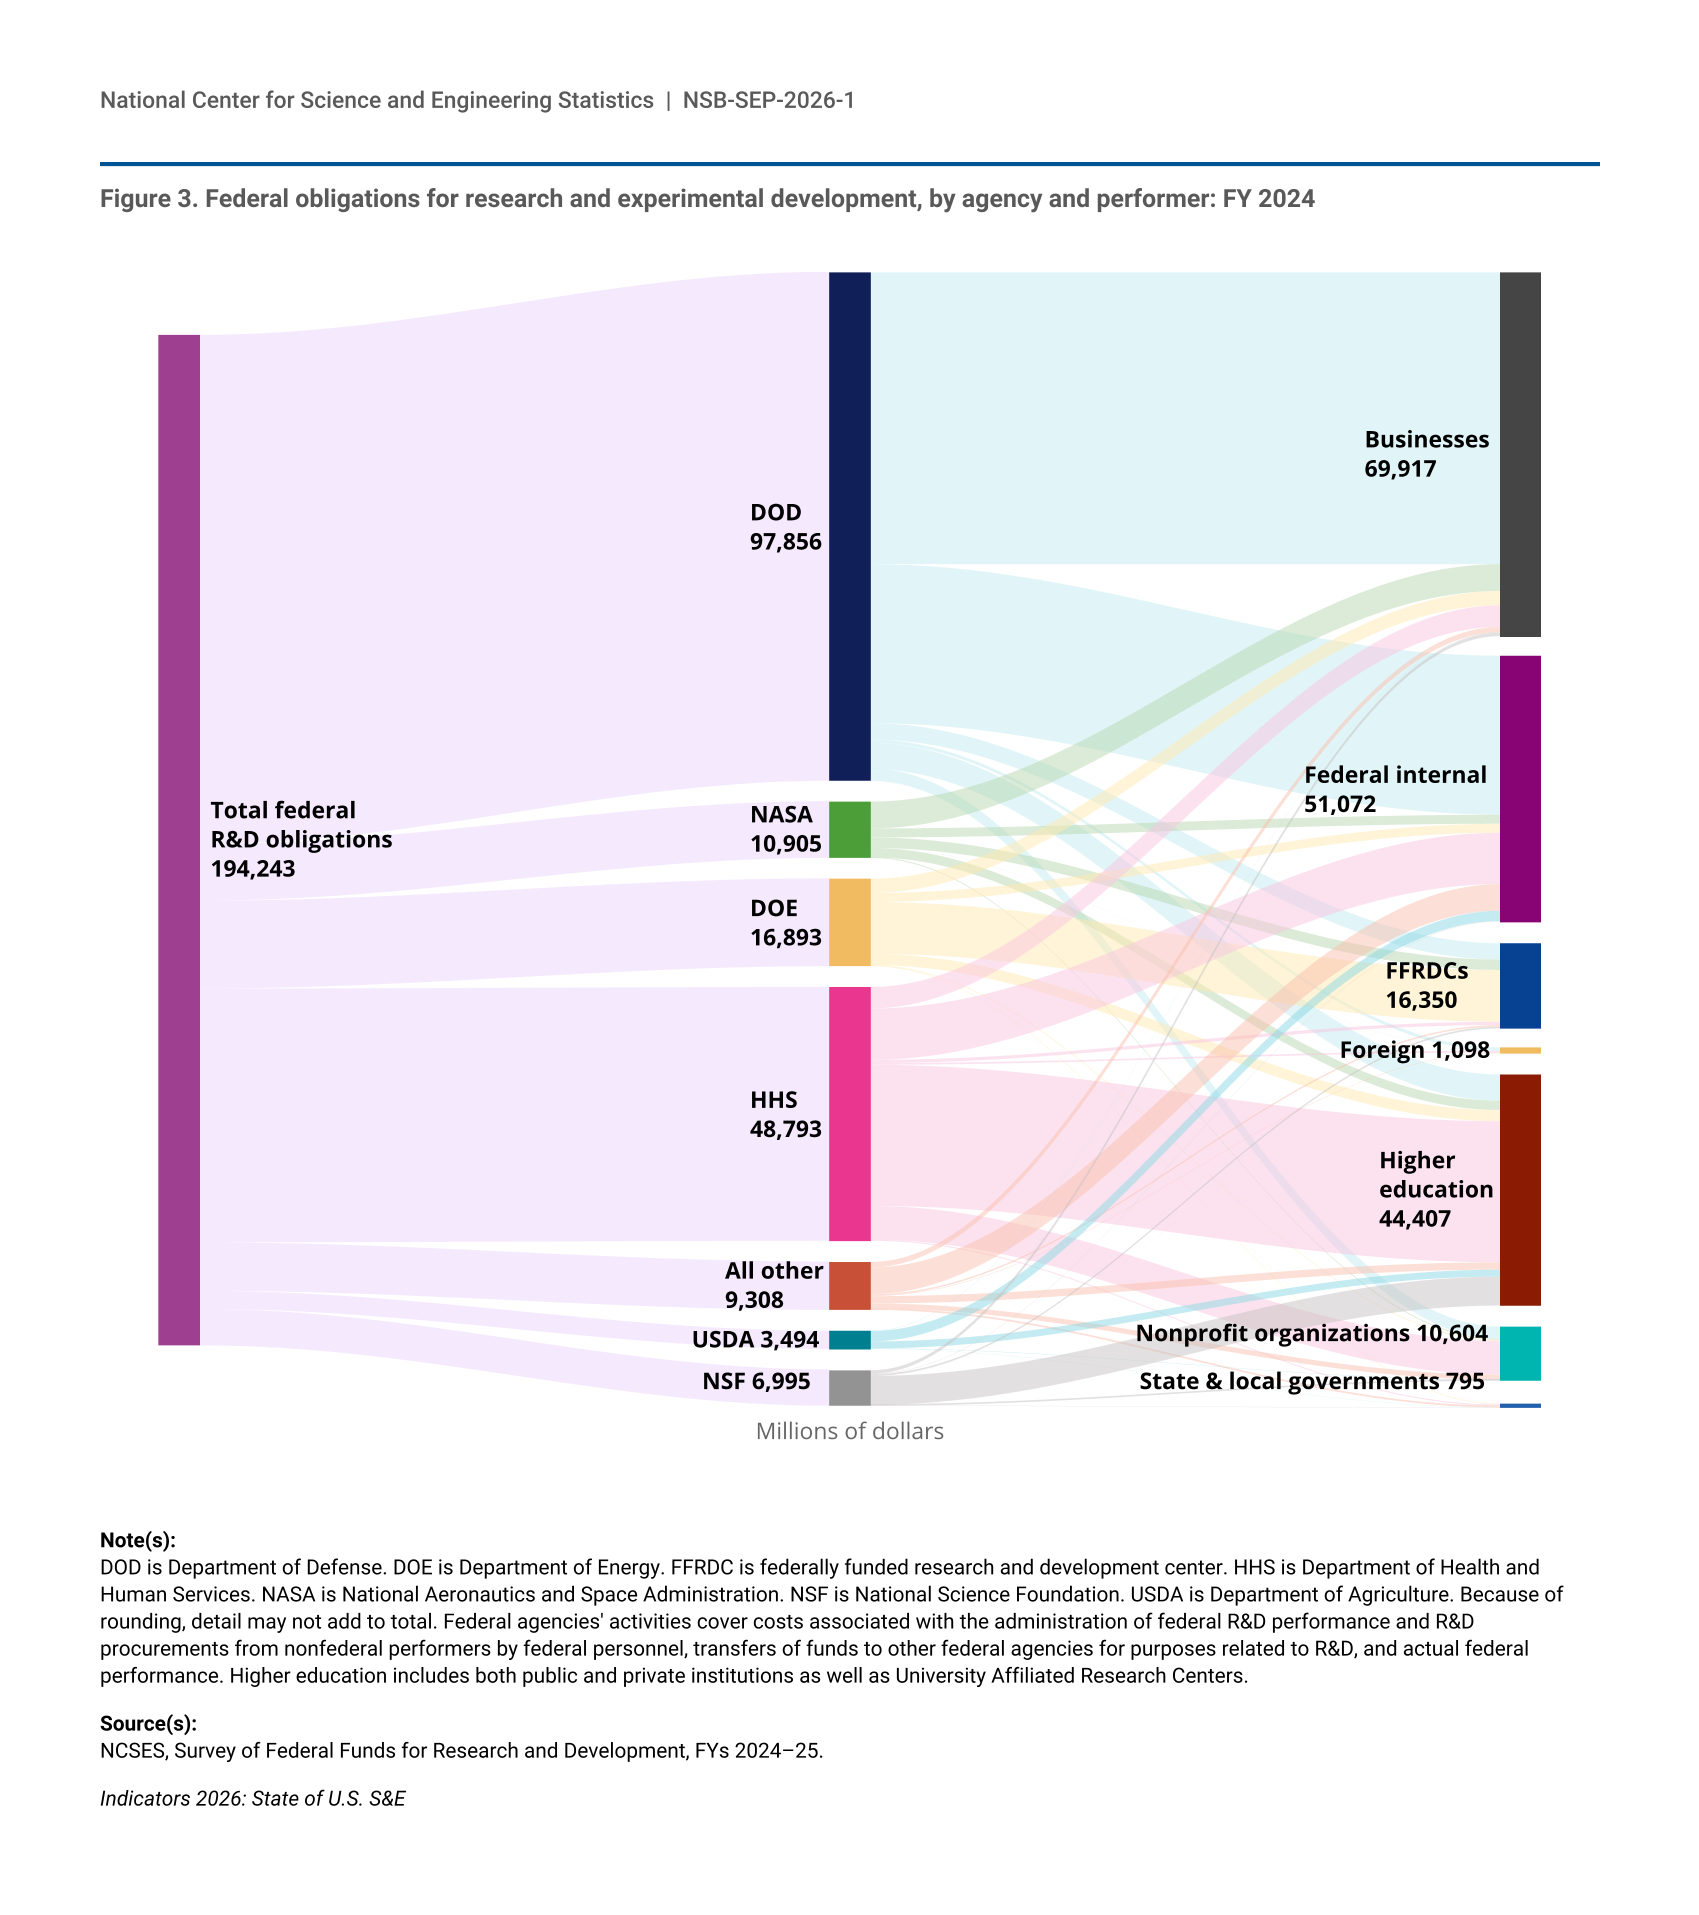
In 2024, the federal agency R&D funding pattern that has persisted since 2000 held, with DOD providing the majority of federal funding to business R&D performers and HHS providing the majority of federal funding to higher education R&D performers. Federal agency R&D obligations in 2024 totaled over $194 billion from across 14 federal departments and 15 independent agencies (Figure 3). These funds were highly aggregated among the six largest agencies by total R&D obligations. For example, when combined, DOD, HHS, NSF, DOE, the National Aeronautics and Space Administration (NASA), and the Department of Agriculture (USDA) accounted for 95% of all federal R&D. In FY 2024, DOD accounted for 80% of all federal R&D obligations to the business sector, DOE was responsible for 61% of R&D obligations to the nation’s 41 federally funded research and development centers (such as the DOE National Laboratories and Technology Centers), and HHS accounted for 61% of R&D obligations to higher education.
| Agency | Total ($millions) |
|---|---|
| Total federal R&D obligations | 194,243 |
| Total federal R&D obligations, DOD | 97,856 |
| Total federal R&D obligations, DOD, Businesses | 56,084 |
| Total federal R&D obligations, DOD, Federal internal | 30,574 |
| Total federal R&D obligations, DOD, FFRDCs | 3,139 |
| Total federal R&D obligations, DOD, Foreign | 637 |
| Total federal R&D obligations, DOD, Higher education | 5,036 |
| Total federal R&D obligations, DOD, Nonprofit organizations | 2,372 |
| Total federal R&D obligations, DOD, State & local governments | 15 |
| Total federal R&D obligations, NASA | 10,905 |
| Total federal R&D obligations, NASA, Businesses | 5,165 |
| Total federal R&D obligations, NASA, Federal internal | 1,721 |
| Total federal R&D obligations, NASA, FFRDCs | 2,001 |
| Total federal R&D obligations, NASA, Foreign | 21 |
| Total federal R&D obligations, NASA, Higher education | 1,805 |
| Total federal R&D obligations, NASA, Nonprofit organizations | 187 |
| Total federal R&D obligations, NASA, State & local governments | 4 |
| Total federal R&D obligations, DOE | 16,893 |
| Total federal R&D obligations, DOE, Businesses | 2,759 |
| Total federal R&D obligations, DOE, Federal internal | 1,725 |
| Total federal R&D obligations, DOE, FFRDCs | 9,964 |
| Total federal R&D obligations, DOE, Foreign | 3 |
| Total federal R&D obligations, DOE, Higher education | 2,137 |
| Total federal R&D obligations, DOE, Nonprofit organizations | 172 |
| Total federal R&D obligations, DOE, State & local governments | 134 |
| Total federal R&D obligations, HHS | 48,793 |
| Total federal R&D obligations, HHS, Businesses | 4,132 |
| Total federal R&D obligations, HHS, Federal internal | 9,873 |
| Total federal R&D obligations, HHS, FFRDCs | 616 |
| Total federal R&D obligations, HHS, Foreign | 326 |
| Total federal R&D obligations, HHS, Higher education | 27,131 |
| Total federal R&D obligations, HHS, Nonprofit organizations | 6,502 |
| Total federal R&D obligations, HHS, State & local governments | 213 |
| Total federal R&D obligations, All other | 9,308 |
| Total federal R&D obligations, All other, Businesses | 1,059 |
| Total federal R&D obligations, All other, Federal internal | 5,118 |
| Total federal R&D obligations, All other, FFRDCs | 295 |
| Total federal R&D obligations, All other, Foreign | 89 |
| Total federal R&D obligations, All other, Higher education | 1,406 |
| Total federal R&D obligations, All other, Nonprofit organizations | 991 |
| Total federal R&D obligations, All other, State & local governments | 349 |
| Total federal R&D obligations, USDA | 3,493 |
| Total federal R&D obligations, USDA, Businesses | 48 |
| Total federal R&D obligations, USDA, Federal internal | 2,000 |
| Total federal R&D obligations, USDA, FFRDCs | 0 |
| Total federal R&D obligations, USDA, Foreign | 10 |
| Total federal R&D obligations, USDA, Higher education | 1,336 |
| Total federal R&D obligations, USDA, Nonprofit organizations | 67 |
| Total federal R&D obligations, USDA, State & local governments | 33 |
| Total federal R&D obligations, NSF | 6,995 |
| Total federal R&D obligations, NSF, Businesses | 670 |
| Total federal R&D obligations, NSF, Federal internal | 61 |
| Total federal R&D obligations, NSF, FFRDCs | 335 |
| Total federal R&D obligations, NSF, Foreign | 12 |
| Total federal R&D obligations, NSF, Higher education | 5,556 |
| Total federal R&D obligations, NSF, Nonprofit organizations | 313 |
| Total federal R&D obligations, NSF, State & local governments | 47 |
DOD is Department of Defense. DOE is Department of Energy. FFRDC is federally funded research and development center. HHS is Department of Health and Human Services. NASA is National Aeronautics and Space Administration. NSF is National Science Foundation. USDA is Department of Agriculture. Because of rounding, detail may not add to total. Federal agencies' activities cover costs associated with the administration of federal R&D performance and R&D procurements from nonfederal performers by federal personnel, transfers of funds to other federal agencies for purposes related to R&D, and actual federal performance. Higher education includes both public and private institutions as well as University Affiliated Research Centers.
NCSES, Survey of Federal Funds for Research and Development, FYs 2024–25.
Indicators 2026: State of U.S. S&E
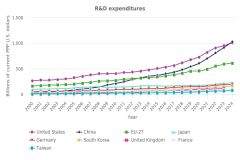
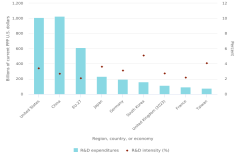
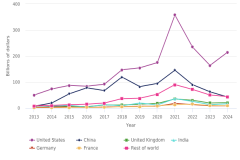
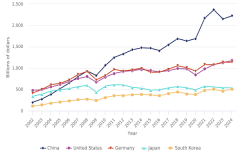
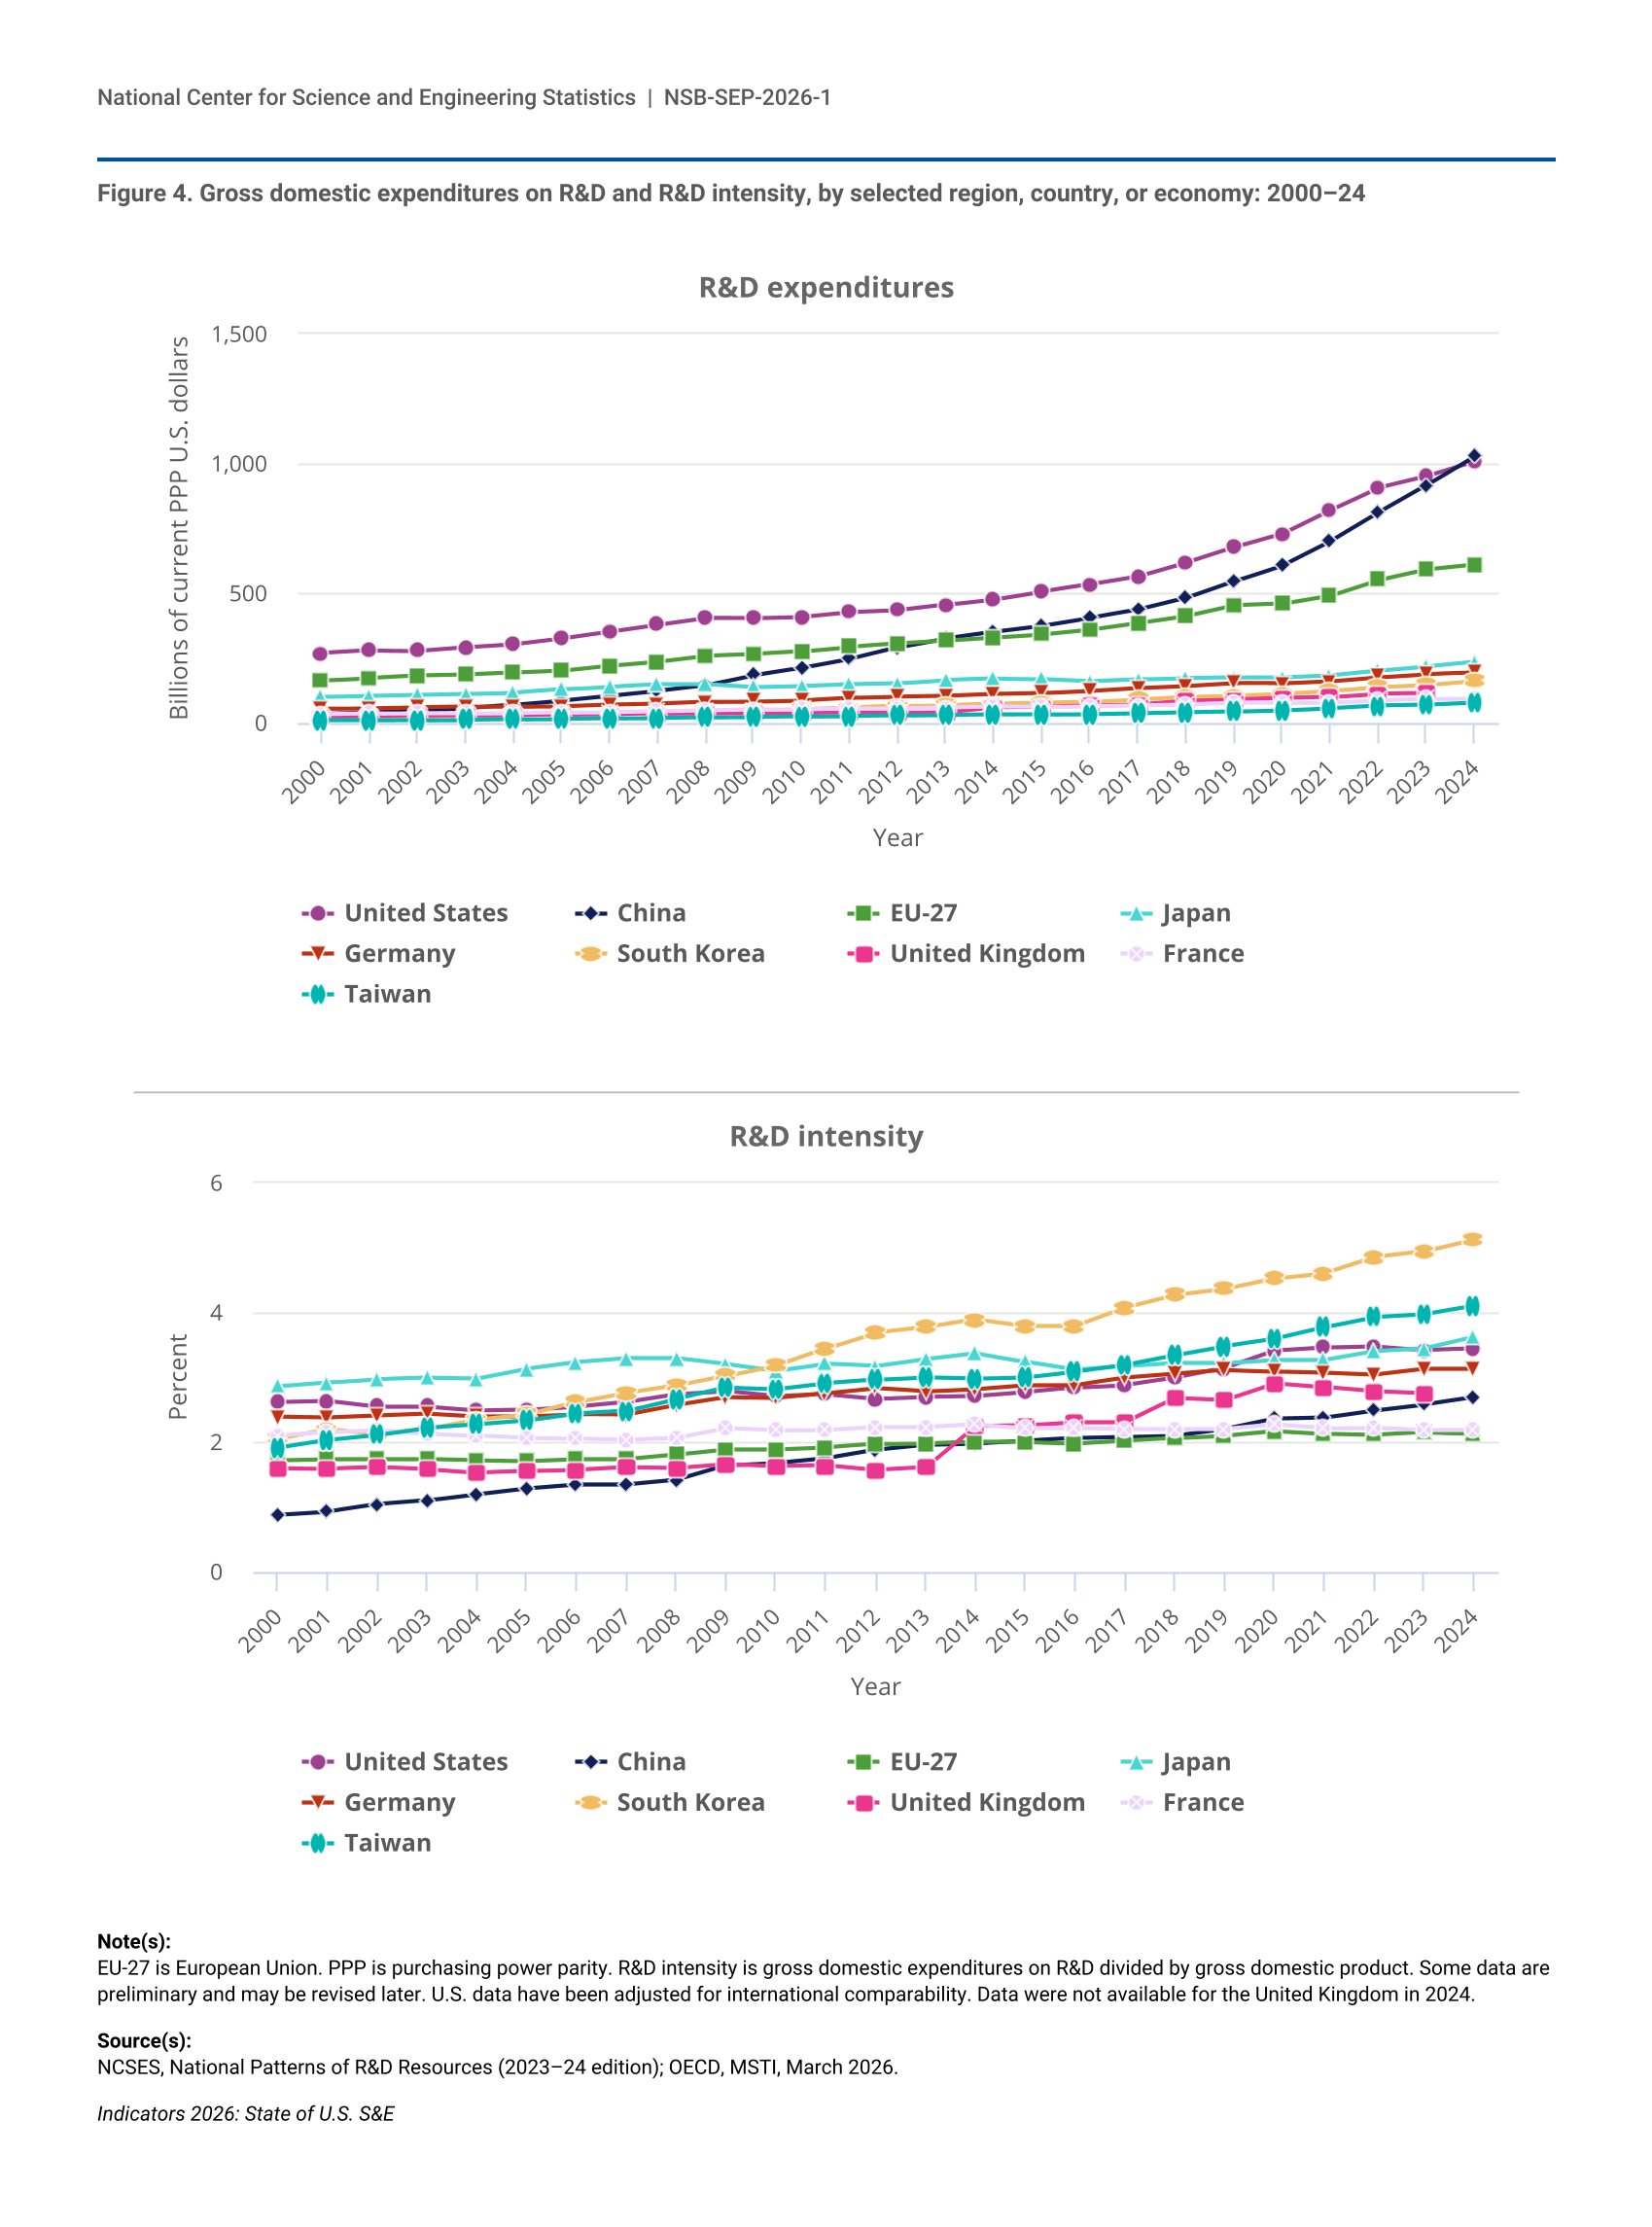
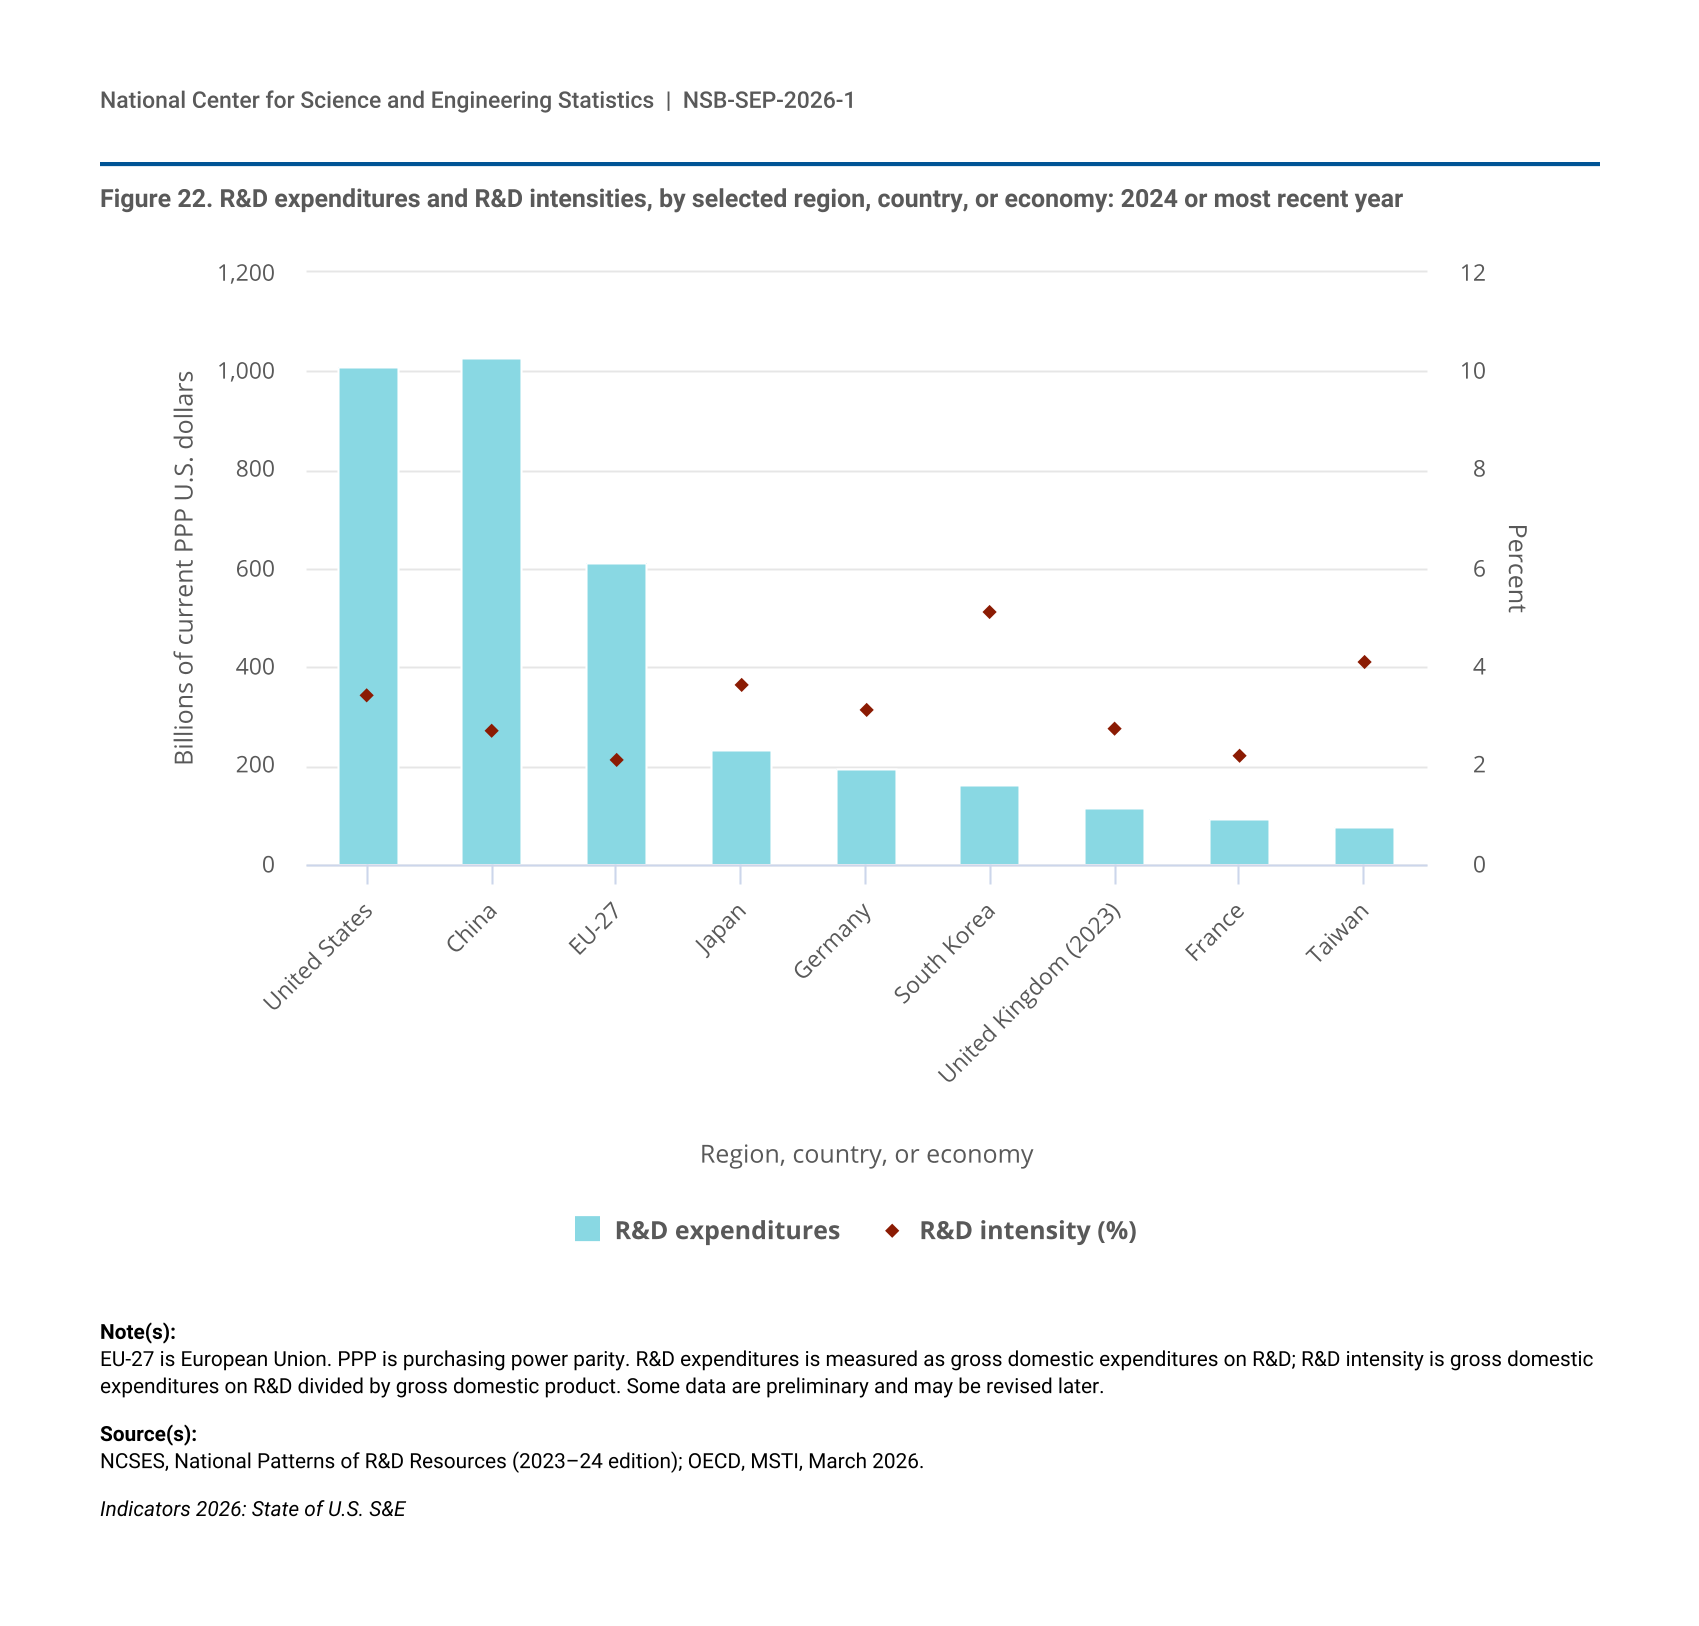
China’s emergence as an S&T competitor represents one of the most significant shifts in the global R&D landscape of the 21st century (CRS 2024, 2025b). When adjusted for international comparability, China is estimated to have surpassed the United States for the first time in gross domestic expenditures on R&D (GERD) in 2024 with $1.028 trillion, followed by the United States with $1.009 trillion (Figure 4). These totals may be revised as new national data are reported to OECD and purchasing power parity (PPP) benchmarks are updated.
| Year | United States | China | EU-27 | Japan | Germany | South Korea | United Kingdom | France | Taiwan |
|---|---|---|---|---|---|---|---|---|---|
| 2000 | 269 | 33 | 163 | 99 | 54 | 19 | 25 | 33 | 9 |
| 2001 | 279 | 39 | 173 | 104 | 56 | 21 | 26 | 36 | 9 |
| 2002 | 278 | 48 | 182 | 108 | 59 | 23 | 28 | 38 | 10 |
| 2003 | 292 | 57 | 186 | 112 | 61 | 24 | 29 | 37 | 12 |
| 2004 | 304 | 70 | 193 | 117 | 63 | 28 | 29 | 38 | 13 |
| 2005 | 326 | 87 | 201 | 129 | 64 | 31 | 31 | 40 | 15 |
| 2006 | 352 | 105 | 221 | 139 | 70 | 35 | 33 | 42 | 17 |
| 2007 | 379 | 124 | 237 | 148 | 74 | 41 | 35 | 44 | 19 |
| 2008 | 405 | 145 | 259 | 149 | 81 | 44 | 37 | 47 | 21 |
| 2009 | 404 | 184 | 265 | 137 | 83 | 46 | 36 | 50 | 22 |
| 2010 | 409 | 212 | 275 | 141 | 87 | 52 | 38 | 51 | 24 |
| 2011 | 427 | 247 | 293 | 148 | 96 | 58 | 39 | 54 | 26 |
| 2012 | 434 | 291 | 305 | 152 | 101 | 65 | 39 | 55 | 28 |
| 2013 | 455 | 327 | 317 | 165 | 103 | 68 | 42 | 58 | 29 |
| 2014 | 477 | 352 | 330 | 170 | 110 | 73 | 60 | 61 | 31 |
| 2015 | 507 | 375 | 342 | 169 | 114 | 77 | 63 | 61 | 32 |
| 2016 | 534 | 405 | 360 | 160 | 123 | 81 | 67 | 64 | 34 |
| 2017 | 565 | 436 | 386 | 167 | 134 | 90 | 71 | 66 | 37 |
| 2018 | 618 | 481 | 413 | 172 | 142 | 100 | 85 | 69 | 40 |
| 2019 | 677 | 546 | 454 | 174 | 153 | 105 | 89 | 76 | 43 |
| 2020 | 730 | 608 | 460 | 175 | 151 | 112 | 95 | 76 | 49 |
| 2021 | 822 | 701 | 492 | 183 | 160 | 123 | 99 | 79 | 57 |
| 2022 | 908 | 811 | 552 | 201 | 176 | 139 | 113 | 86 | 66 |
| 2023 | 952 | 916 | 593 | 217 | 188 | 147 | 115 | 91 | 69 |
| 2024 | 1,009 | 1,028 | 612 | 234 | 193 | 162 | NA | 93 | 77 |
| Year | United States | China | EU-27 | Japan | Germany | South Korea | United Kingdom | France | Taiwan |
|---|---|---|---|---|---|---|---|---|---|
| 2000 | 2.62 | 0.88 | 1.72 | 2.86 | 2.39 | 2.05 | 1.60 | 2.10 | 1.91 |
| 2001 | 2.64 | 0.93 | 1.74 | 2.92 | 2.38 | 2.20 | 1.59 | 2.15 | 2.03 |
| 2002 | 2.55 | 1.04 | 1.74 | 2.97 | 2.41 | 2.13 | 1.61 | 2.19 | 2.11 |
| 2003 | 2.55 | 1.10 | 1.74 | 2.99 | 2.44 | 2.20 | 1.58 | 2.13 | 2.22 |
| 2004 | 2.49 | 1.20 | 1.72 | 2.98 | 2.40 | 2.35 | 1.53 | 2.10 | 2.27 |
| 2005 | 2.50 | 1.29 | 1.71 | 3.13 | 2.40 | 2.43 | 1.55 | 2.06 | 2.33 |
| 2006 | 2.55 | 1.35 | 1.74 | 3.23 | 2.43 | 2.62 | 1.57 | 2.05 | 2.44 |
| 2007 | 2.62 | 1.35 | 1.74 | 3.29 | 2.42 | 2.76 | 1.61 | 2.03 | 2.48 |
| 2008 | 2.74 | 1.42 | 1.81 | 3.29 | 2.57 | 2.87 | 1.60 | 2.06 | 2.67 |
| 2009 | 2.79 | 1.64 | 1.89 | 3.20 | 2.69 | 3.02 | 1.66 | 2.21 | 2.84 |
| 2010 | 2.71 | 1.68 | 1.89 | 3.10 | 2.68 | 3.18 | 1.63 | 2.18 | 2.82 |
| 2011 | 2.74 | 1.75 | 1.92 | 3.21 | 2.75 | 3.44 | 1.64 | 2.19 | 2.91 |
| 2012 | 2.67 | 1.88 | 1.97 | 3.17 | 2.83 | 3.69 | 1.57 | 2.23 | 2.96 |
| 2013 | 2.70 | 1.96 | 1.98 | 3.28 | 2.78 | 3.77 | 1.61 | 2.23 | 3.00 |
| 2014 | 2.71 | 1.98 | 2.00 | 3.37 | 2.82 | 3.89 | 2.25 | 2.27 | 2.98 |
| 2015 | 2.77 | 2.02 | 2.00 | 3.24 | 2.88 | 3.79 | 2.26 | 2.22 | 3.00 |
| 2016 | 2.84 | 2.06 | 1.98 | 3.11 | 2.88 | 3.79 | 2.31 | 2.22 | 3.09 |
| 2017 | 2.88 | 2.08 | 2.02 | 3.17 | 2.99 | 4.07 | 2.31 | 2.20 | 3.19 |
| 2018 | 2.99 | 2.10 | 2.06 | 3.22 | 3.05 | 4.27 | 2.68 | 2.20 | 3.34 |
| 2019 | 3.14 | 2.20 | 2.10 | 3.22 | 3.11 | 4.36 | 2.65 | 2.20 | 3.48 |
| 2020 | 3.41 | 2.36 | 2.17 | 3.27 | 3.09 | 4.52 | 2.91 | 2.27 | 3.59 |
| 2021 | 3.46 | 2.38 | 2.13 | 3.27 | 3.07 | 4.60 | 2.85 | 2.21 | 3.77 |
| 2022 | 3.48 | 2.49 | 2.11 | 3.40 | 3.04 | 4.85 | 2.78 | 2.22 | 3.93 |
| 2023 | 3.42 | 2.58 | 2.15 | 3.44 | 3.13 | 4.94 | 2.75 | 2.18 | 3.97 |
| 2024 | 3.44 | 2.69 | 2.13 | 3.62 | 3.13 | 5.13 | NA | 2.18 | 4.10 |
EU-27 is European Union. PPP is purchasing power parity. R&D intensity is gross domestic expenditures on R&D divided by gross domestic product. Some data are preliminary and may be revised later. U.S. data have been adjusted for international comparability. Data were not available for the United Kingdom in 2024.
NCSES, National Patterns of R&D Resources (2023–24 edition); OECD, MSTI, March 2026.
Indicators 2026: State of U.S. S&E
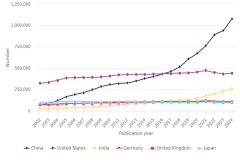
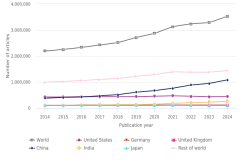
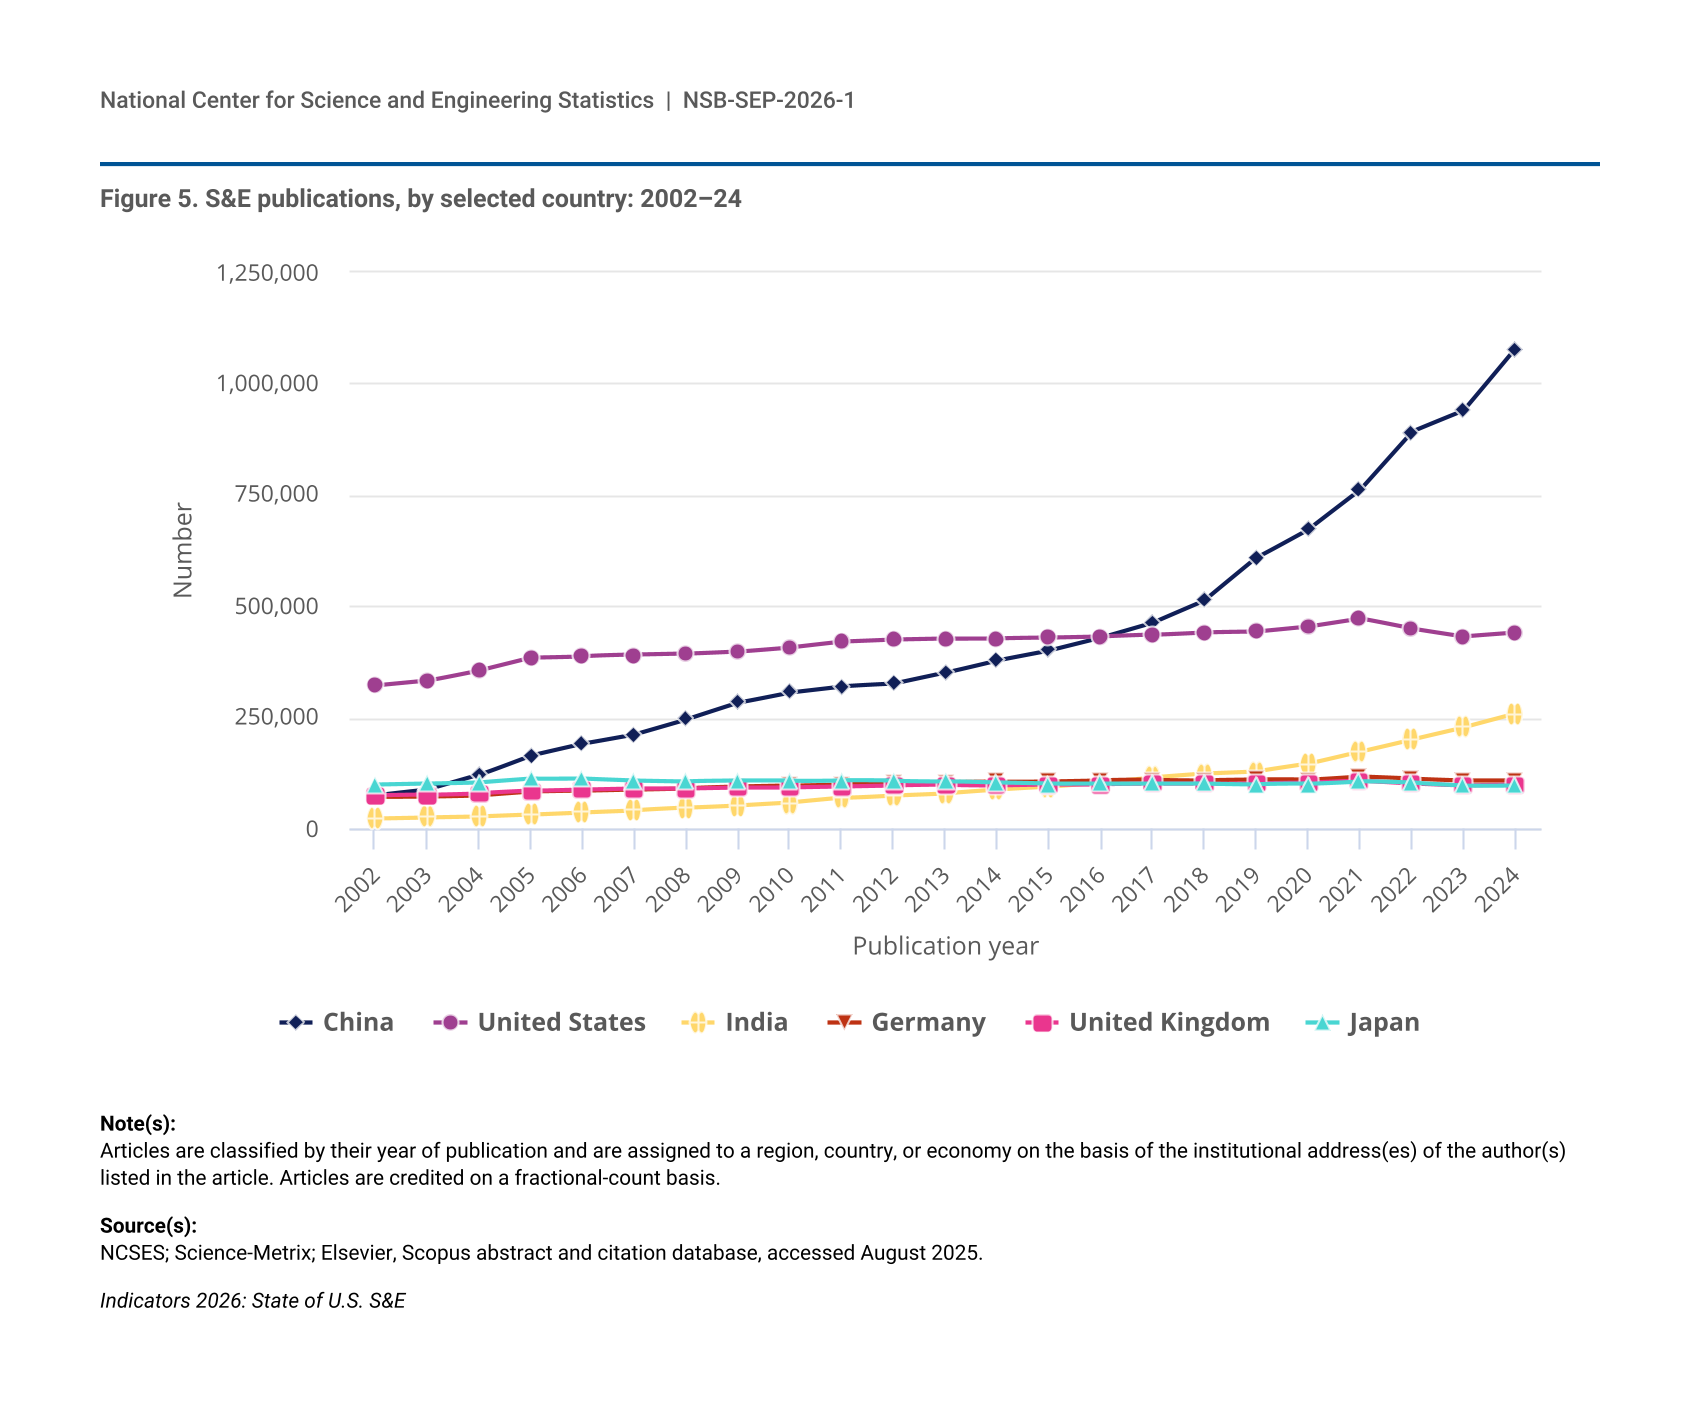
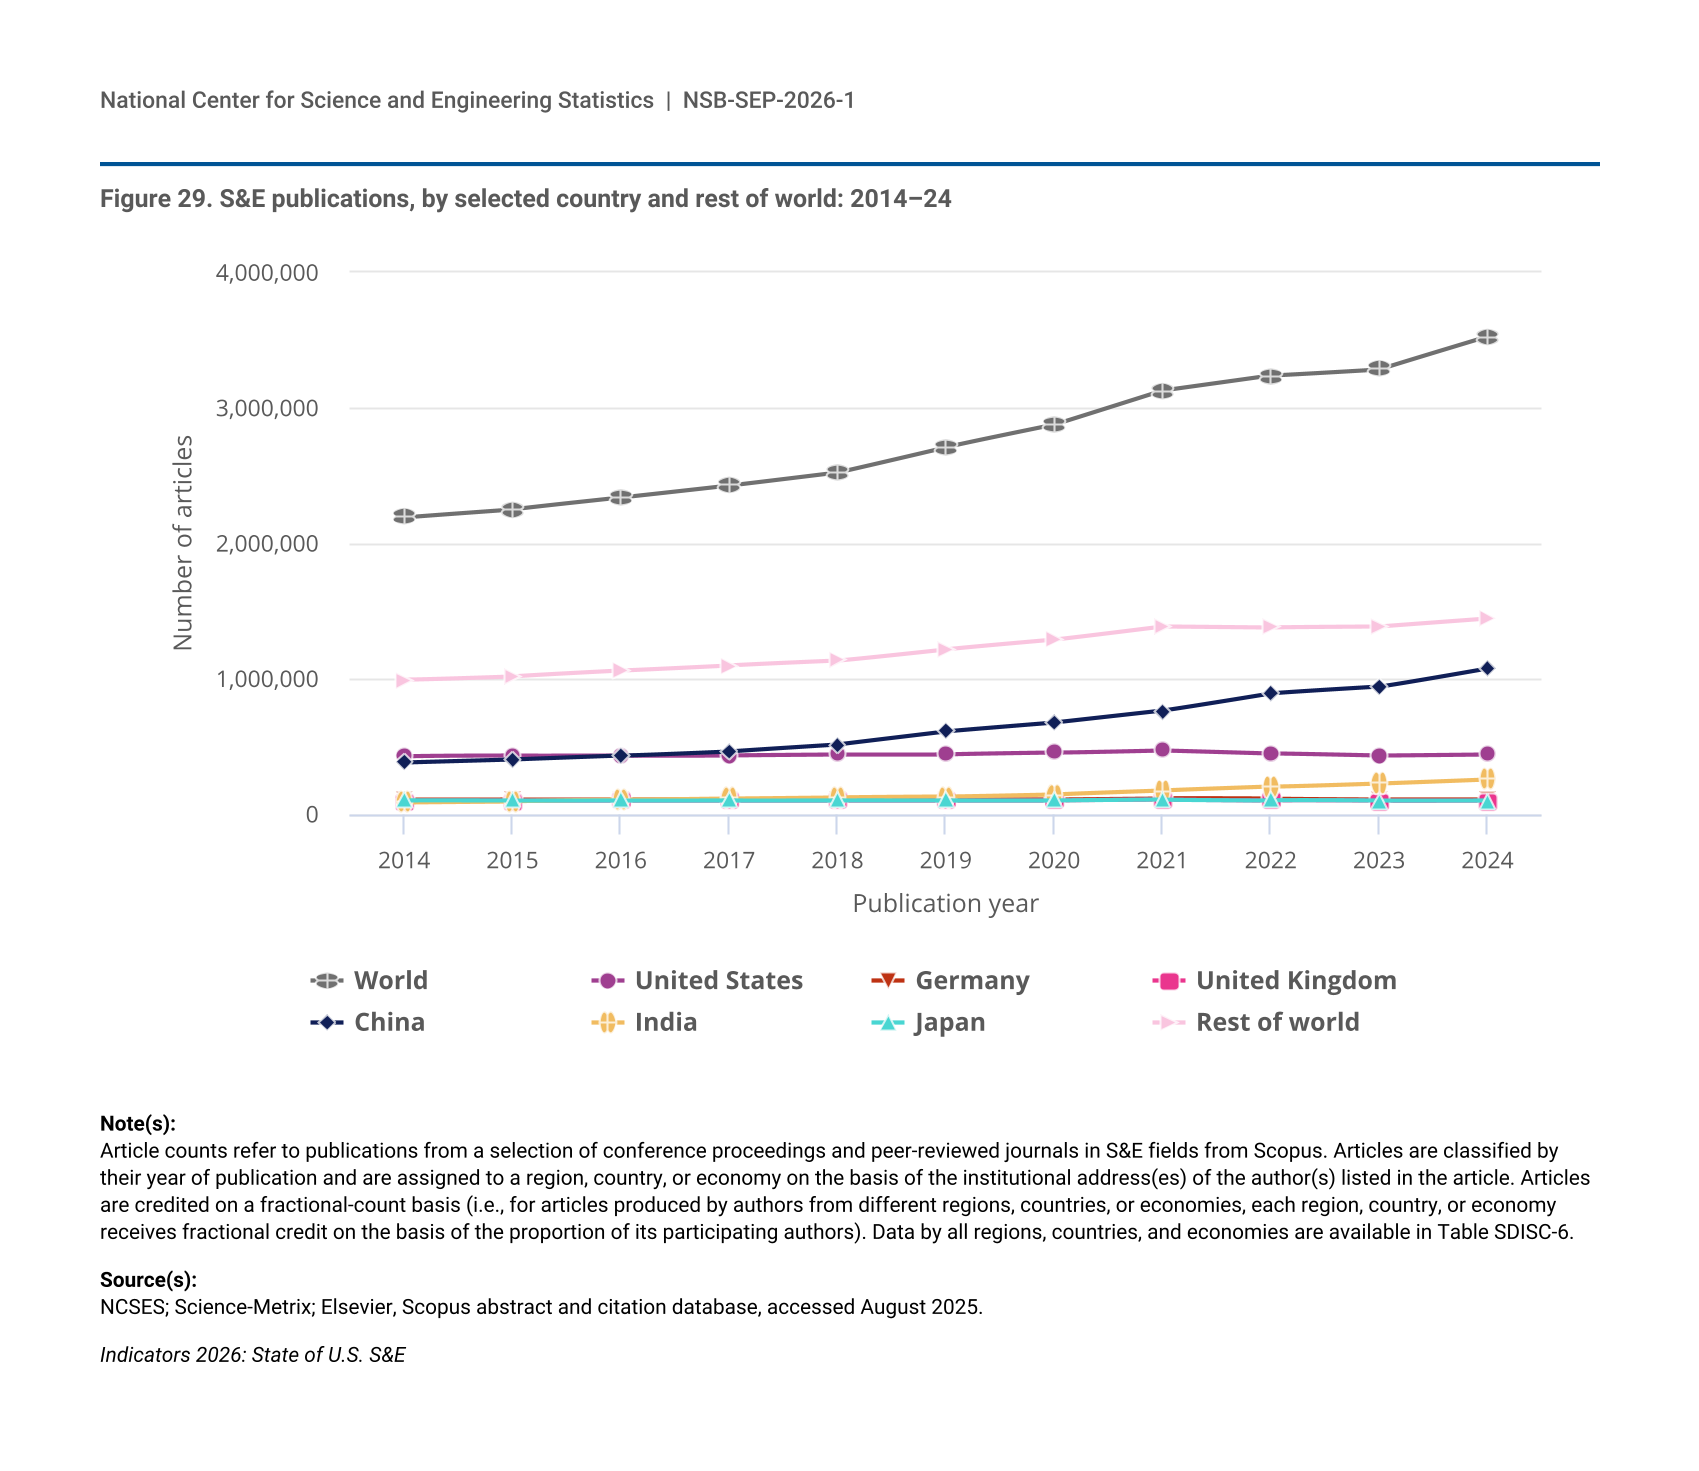
China has become the largest producer of peer-reviewed S&E publications, surpassing the United States in total output in 2017 and now producing more than double the U.S. output (Figure 5); see the “Global Output of Research Publications” section for additional discussion of the challenges using gross counts of publications and the use of highly cited articles (HCAs) to overcome those.
| Publication year | China | United States | India | Germany | United Kingdom | Japan |
|---|---|---|---|---|---|---|
| 2002 | 74,732 | 321,704 | 23,695 | 71,377 | 74,910 | 98,814 |
| 2003 | 87,373 | 332,635 | 26,118 | 72,718 | 76,135 | 101,170 |
| 2004 | 120,716 | 356,266 | 28,037 | 75,377 | 79,865 | 103,655 |
| 2005 | 165,103 | 385,042 | 32,132 | 83,726 | 84,947 | 111,962 |
| 2006 | 191,549 | 387,904 | 37,012 | 85,647 | 88,326 | 112,828 |
| 2007 | 212,520 | 390,254 | 41,263 | 88,426 | 90,880 | 108,591 |
| 2008 | 246,163 | 392,627 | 46,472 | 91,188 | 90,798 | 106,630 |
| 2009 | 283,621 | 397,794 | 51,826 | 94,223 | 93,001 | 107,506 |
| 2010 | 306,996 | 407,442 | 58,267 | 96,173 | 93,221 | 107,207 |
| 2011 | 320,383 | 420,476 | 68,997 | 99,225 | 94,931 | 109,057 |
| 2012 | 325,816 | 425,194 | 75,487 | 103,761 | 97,088 | 107,465 |
| 2013 | 350,655 | 427,489 | 80,135 | 104,424 | 98,595 | 106,957 |
| 2014 | 378,661 | 428,049 | 88,227 | 105,528 | 97,901 | 103,336 |
| 2015 | 400,690 | 429,340 | 94,731 | 106,804 | 99,616 | 100,582 |
| 2016 | 429,614 | 431,848 | 104,549 | 108,978 | 100,133 | 101,145 |
| 2017 | 463,411 | 435,539 | 115,542 | 109,828 | 100,980 | 101,829 |
| 2018 | 513,153 | 441,299 | 123,760 | 109,200 | 101,193 | 102,066 |
| 2019 | 608,541 | 442,821 | 128,410 | 110,442 | 102,112 | 100,232 |
| 2020 | 672,772 | 454,221 | 145,534 | 109,515 | 103,482 | 100,519 |
| 2021 | 761,535 | 472,375 | 173,204 | 117,492 | 108,325 | 106,627 |
| 2022 | 891,697 | 448,935 | 200,839 | 112,822 | 102,064 | 102,670 |
| 2023 | 938,945 | 431,338 | 227,796 | 109,086 | 97,459 | 96,872 |
| 2024 | 1,078,580 | 439,892 | 258,469 | 109,102 | 99,582 | 97,974 |
Articles are classified by their year of publication and are assigned to a region, country, or economy on the basis of the institutional address(es) of the author(s) listed in the article. Articles are credited on a fractional-count basis.
NCSES; Science-Metrix; Elsevier, Scopus abstract and citation database, accessed August 2025.
Indicators 2026: State of U.S. S&E
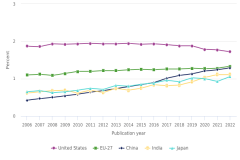
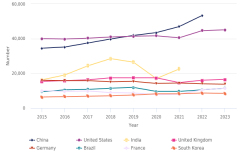
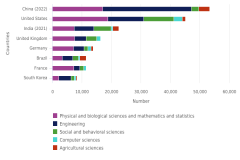
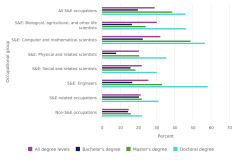
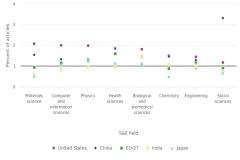
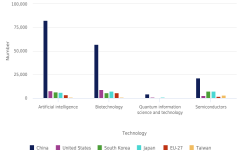
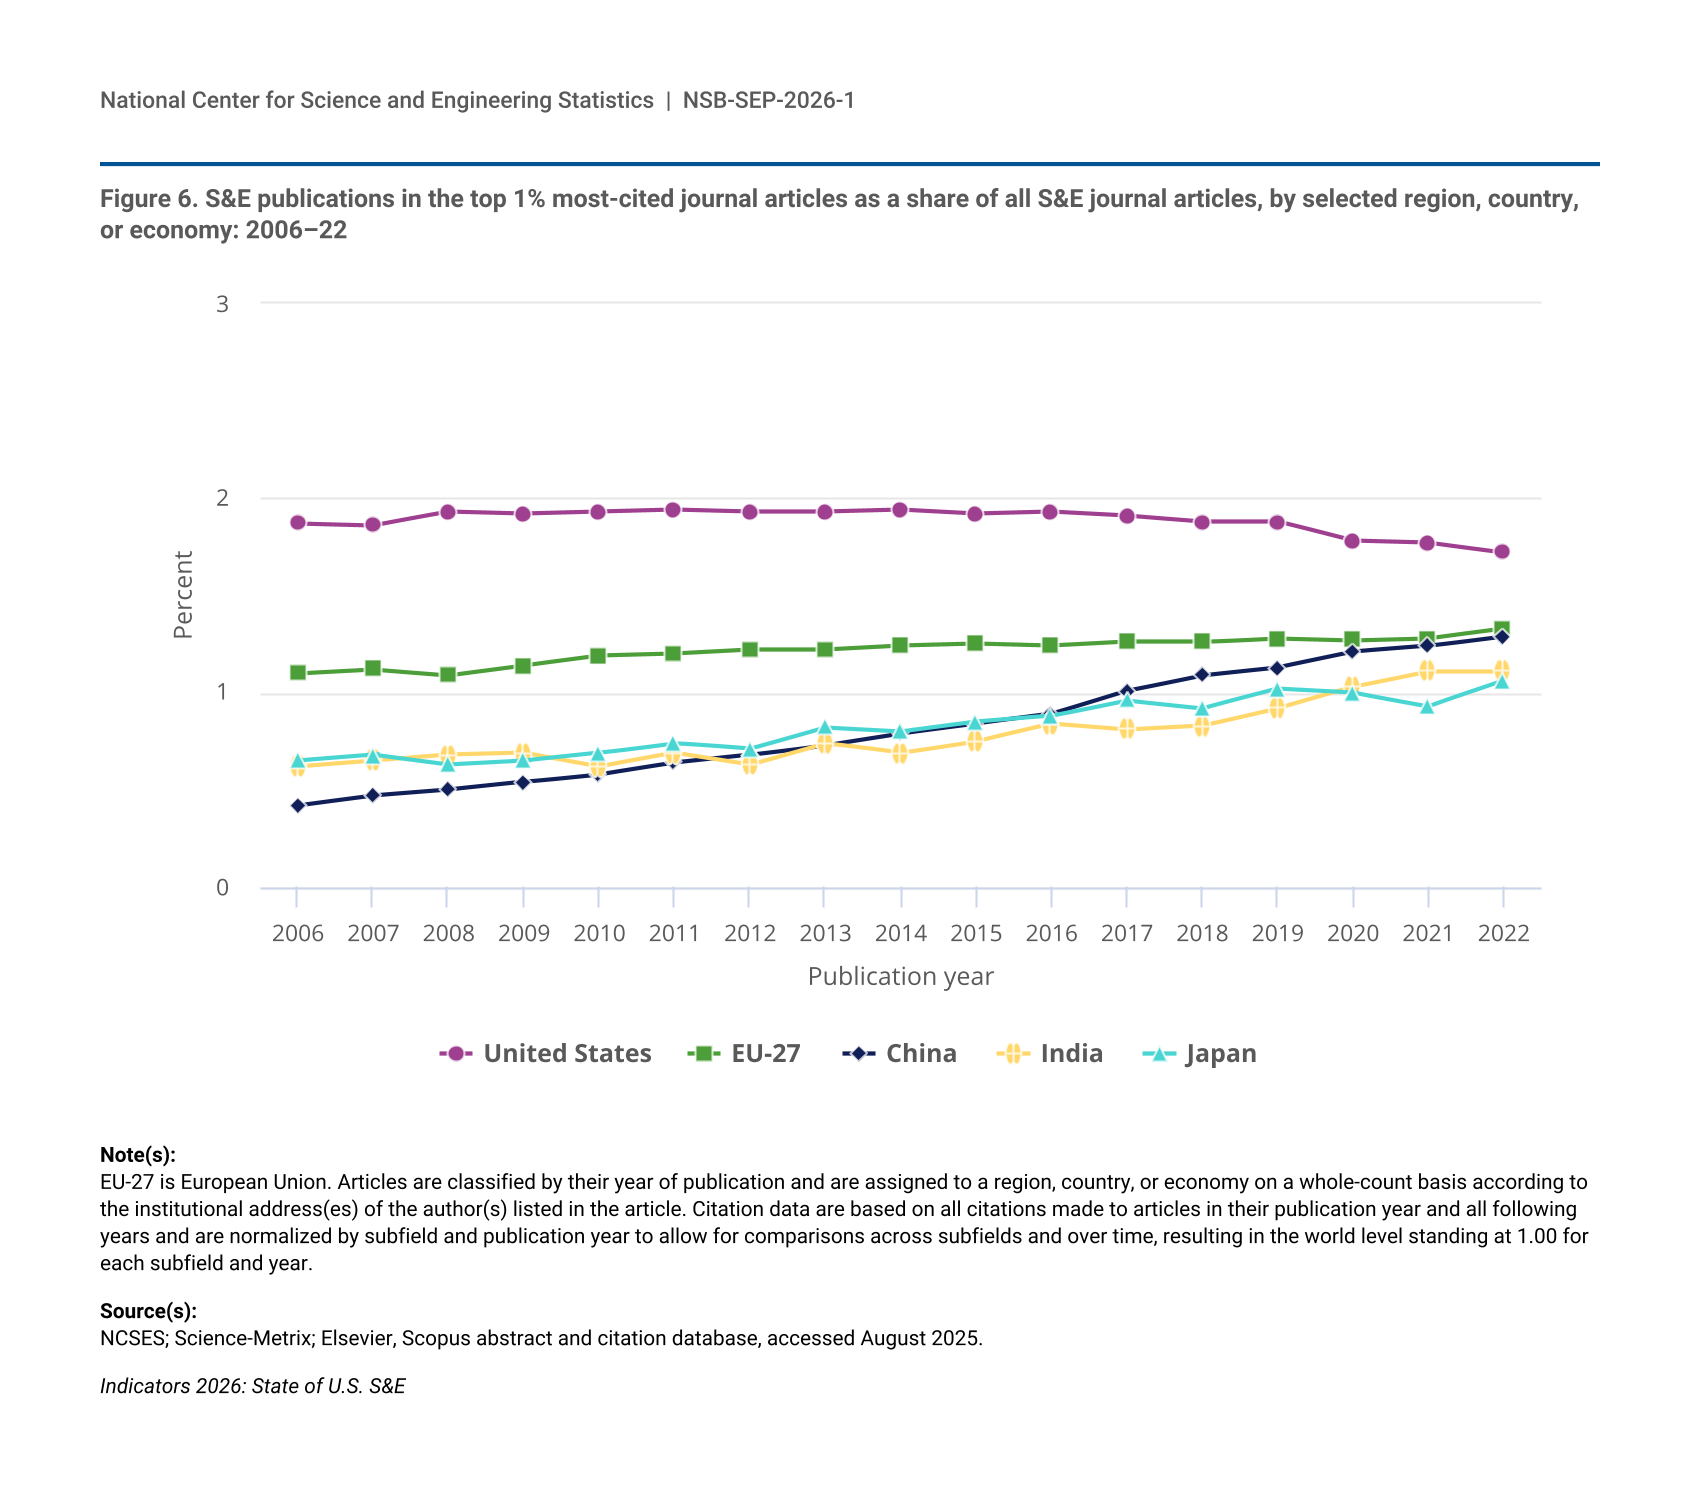
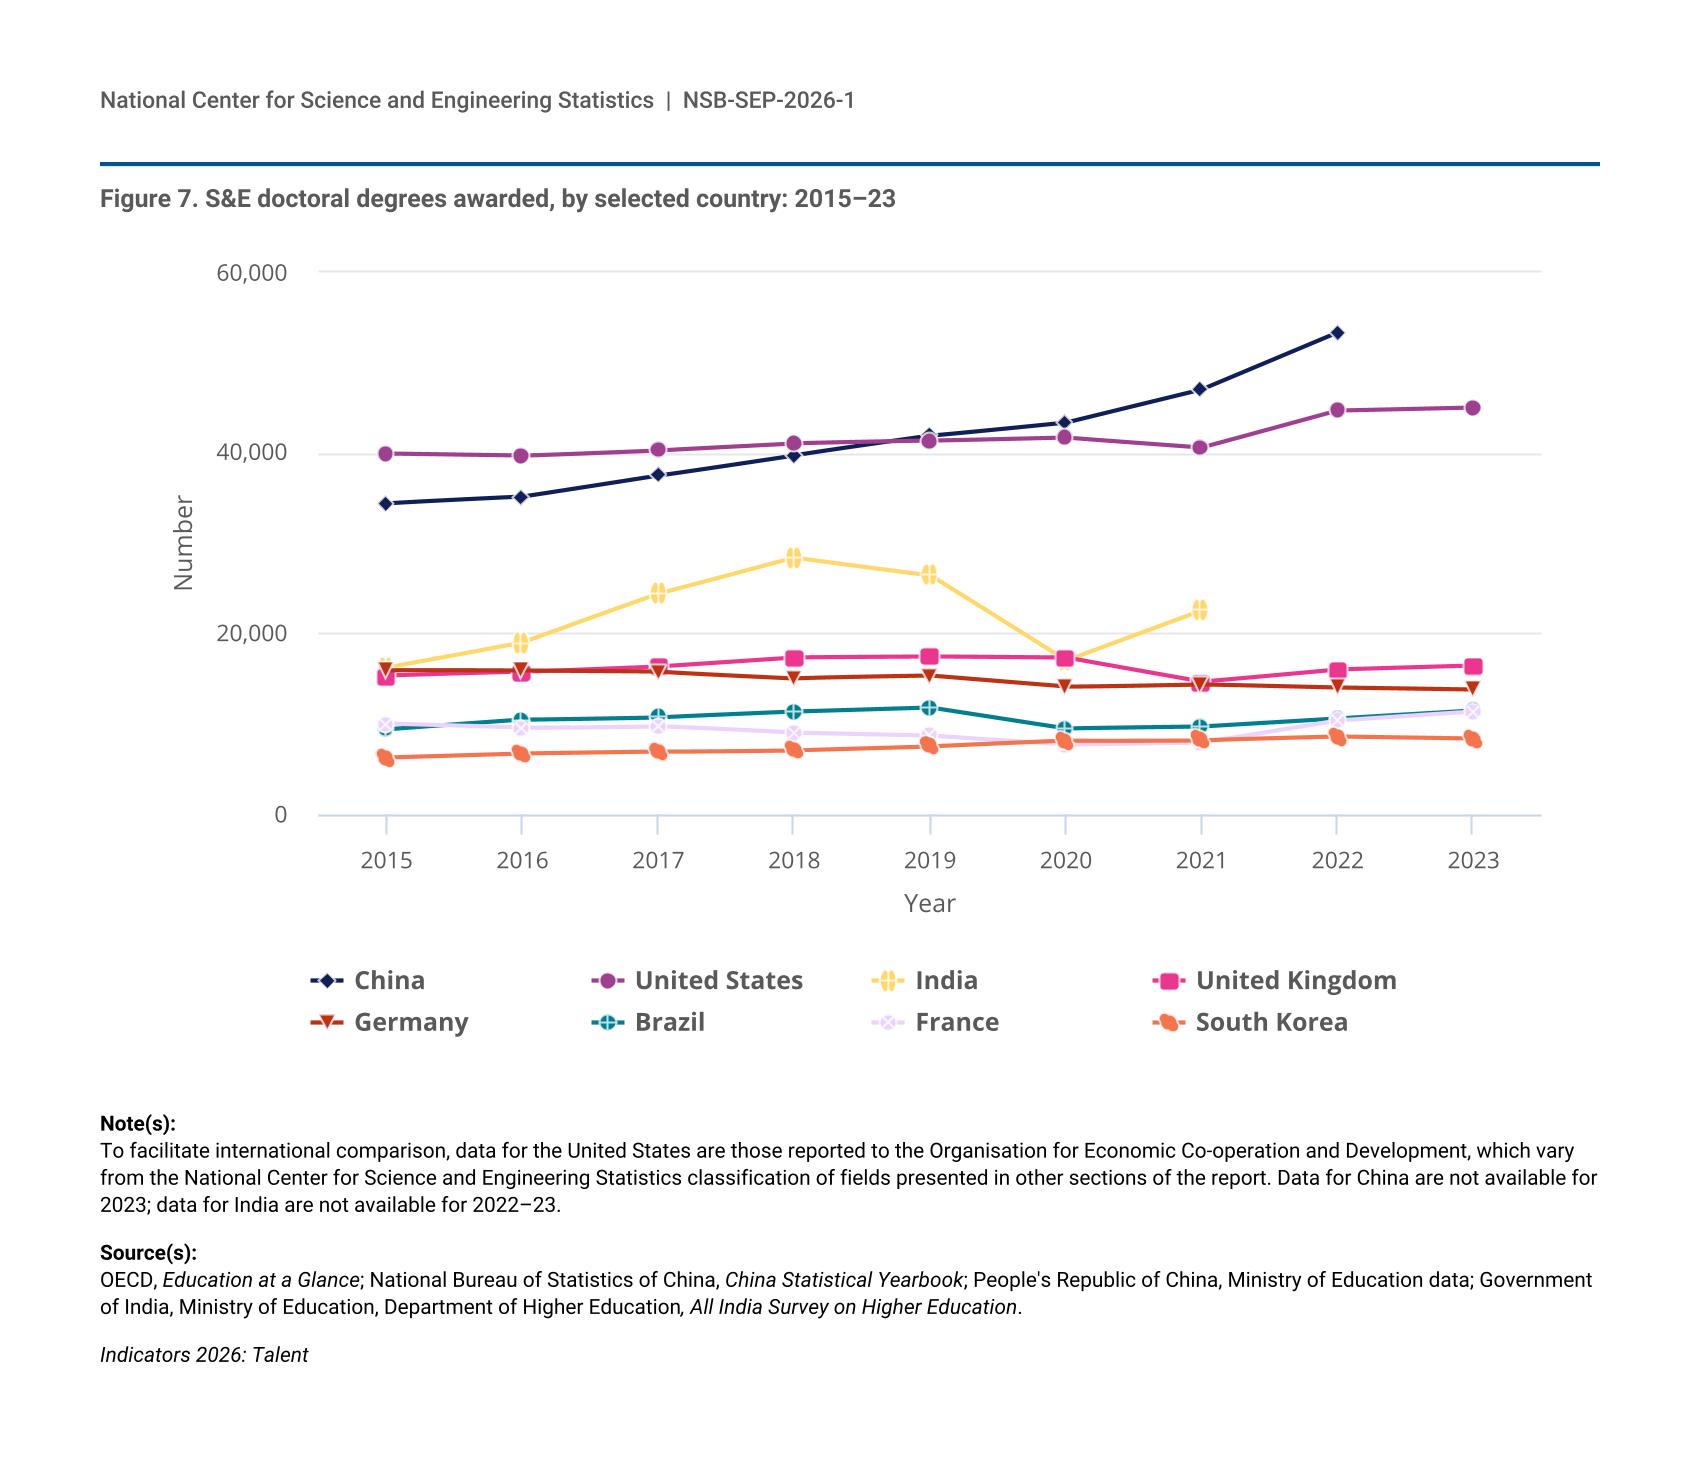
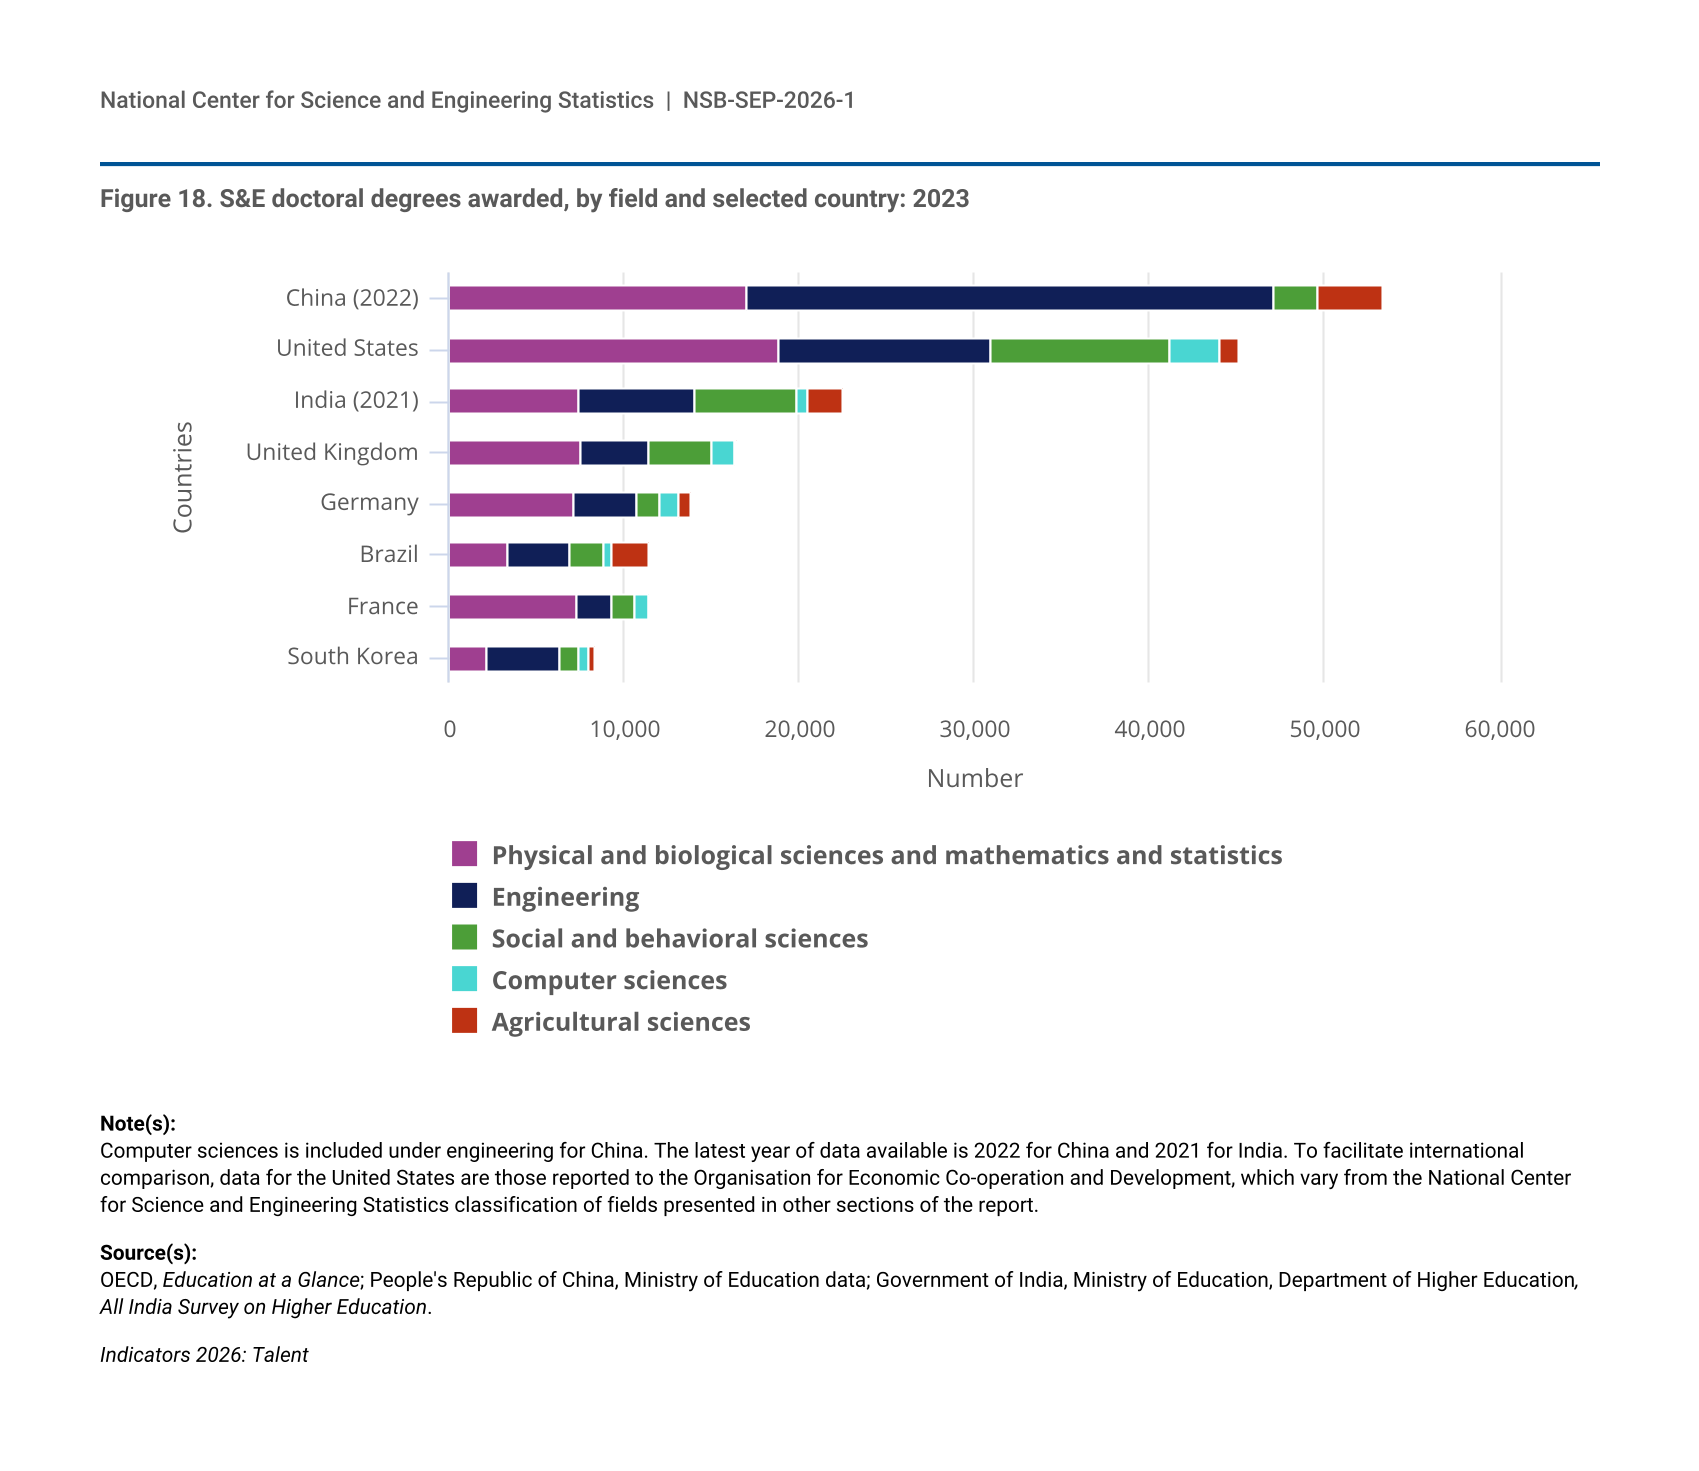
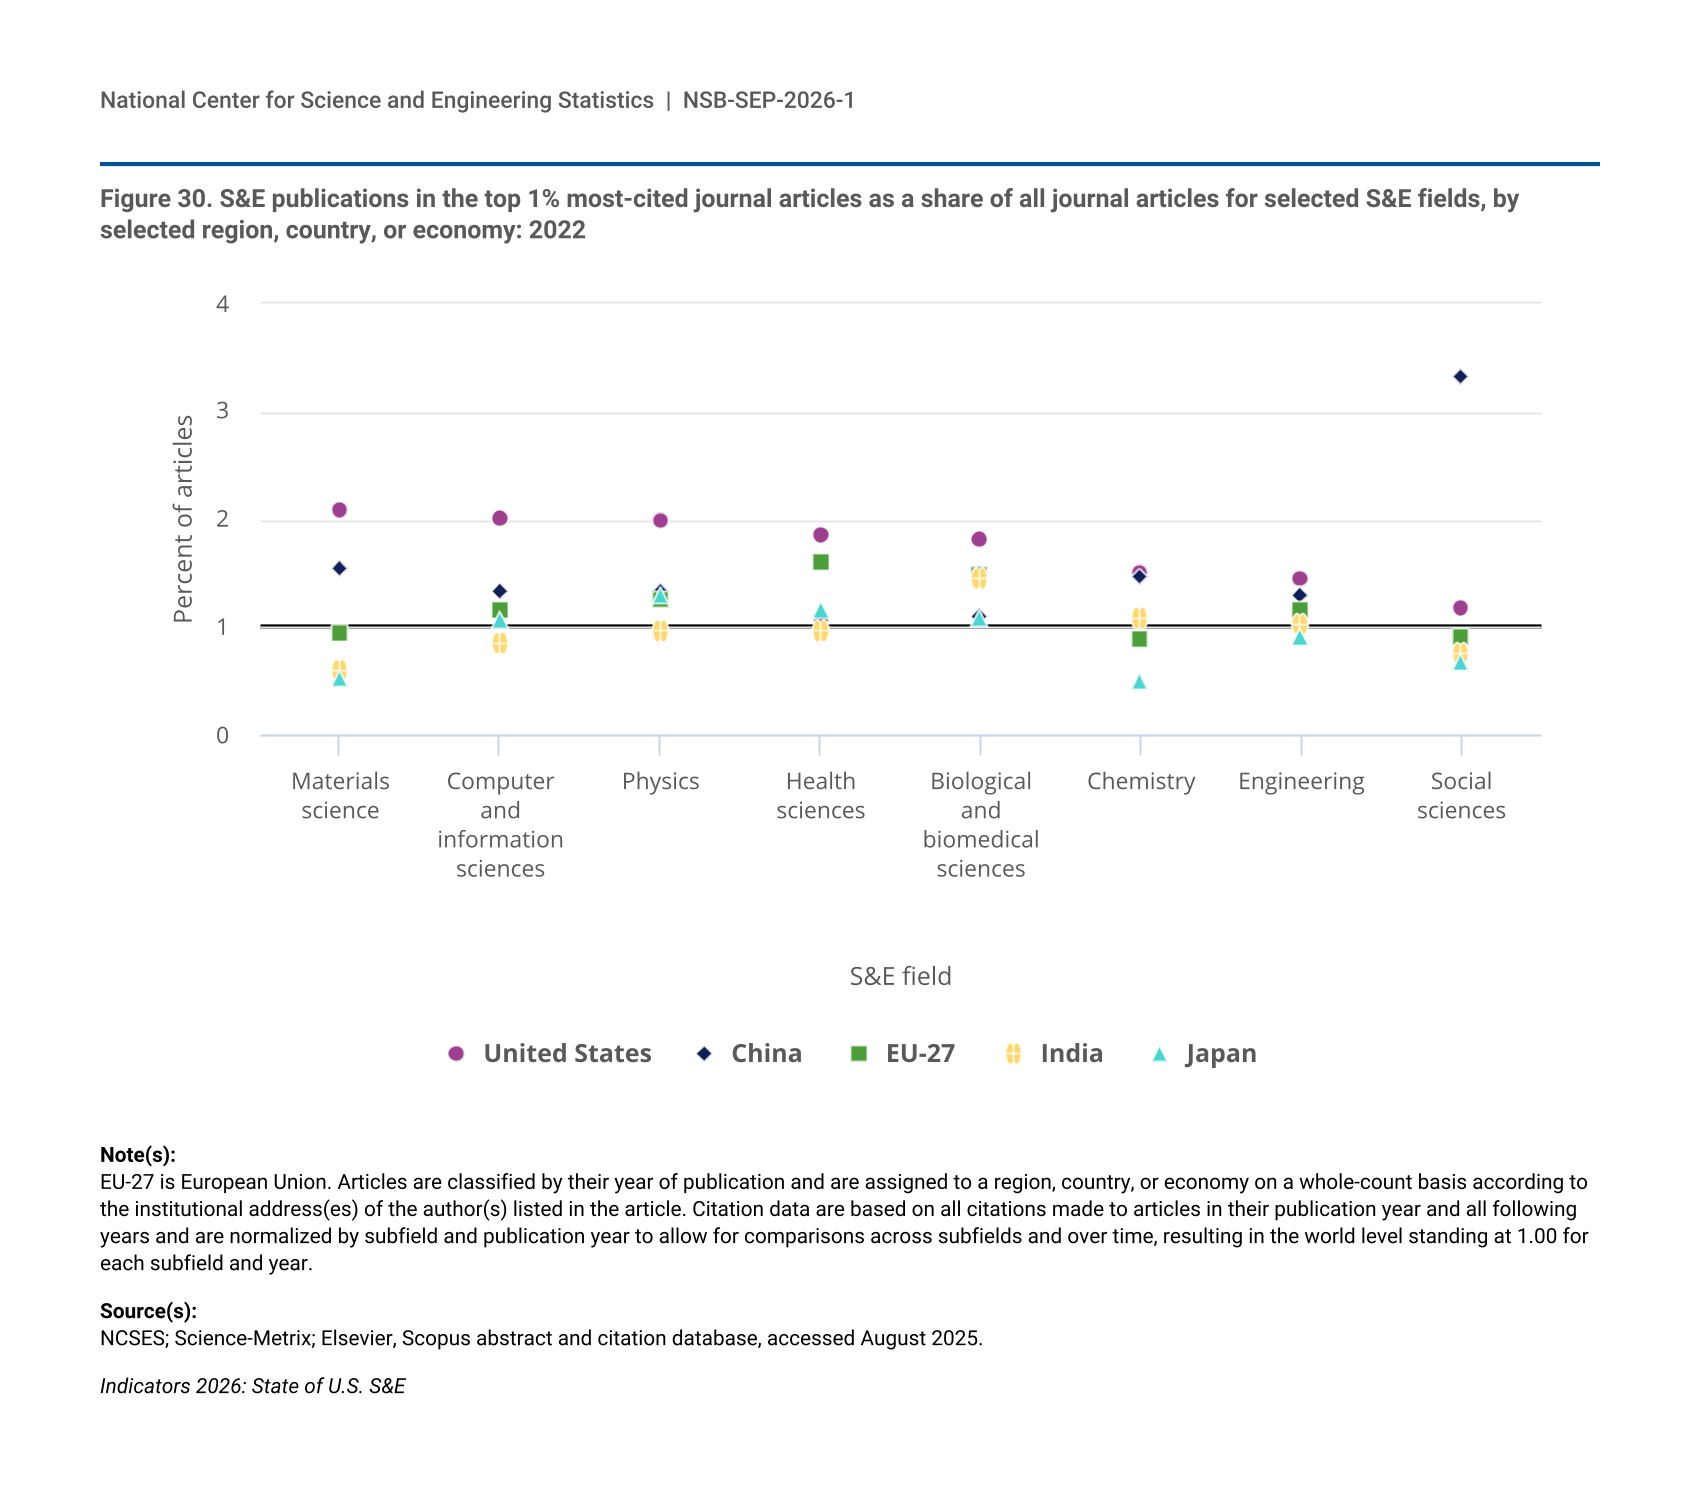
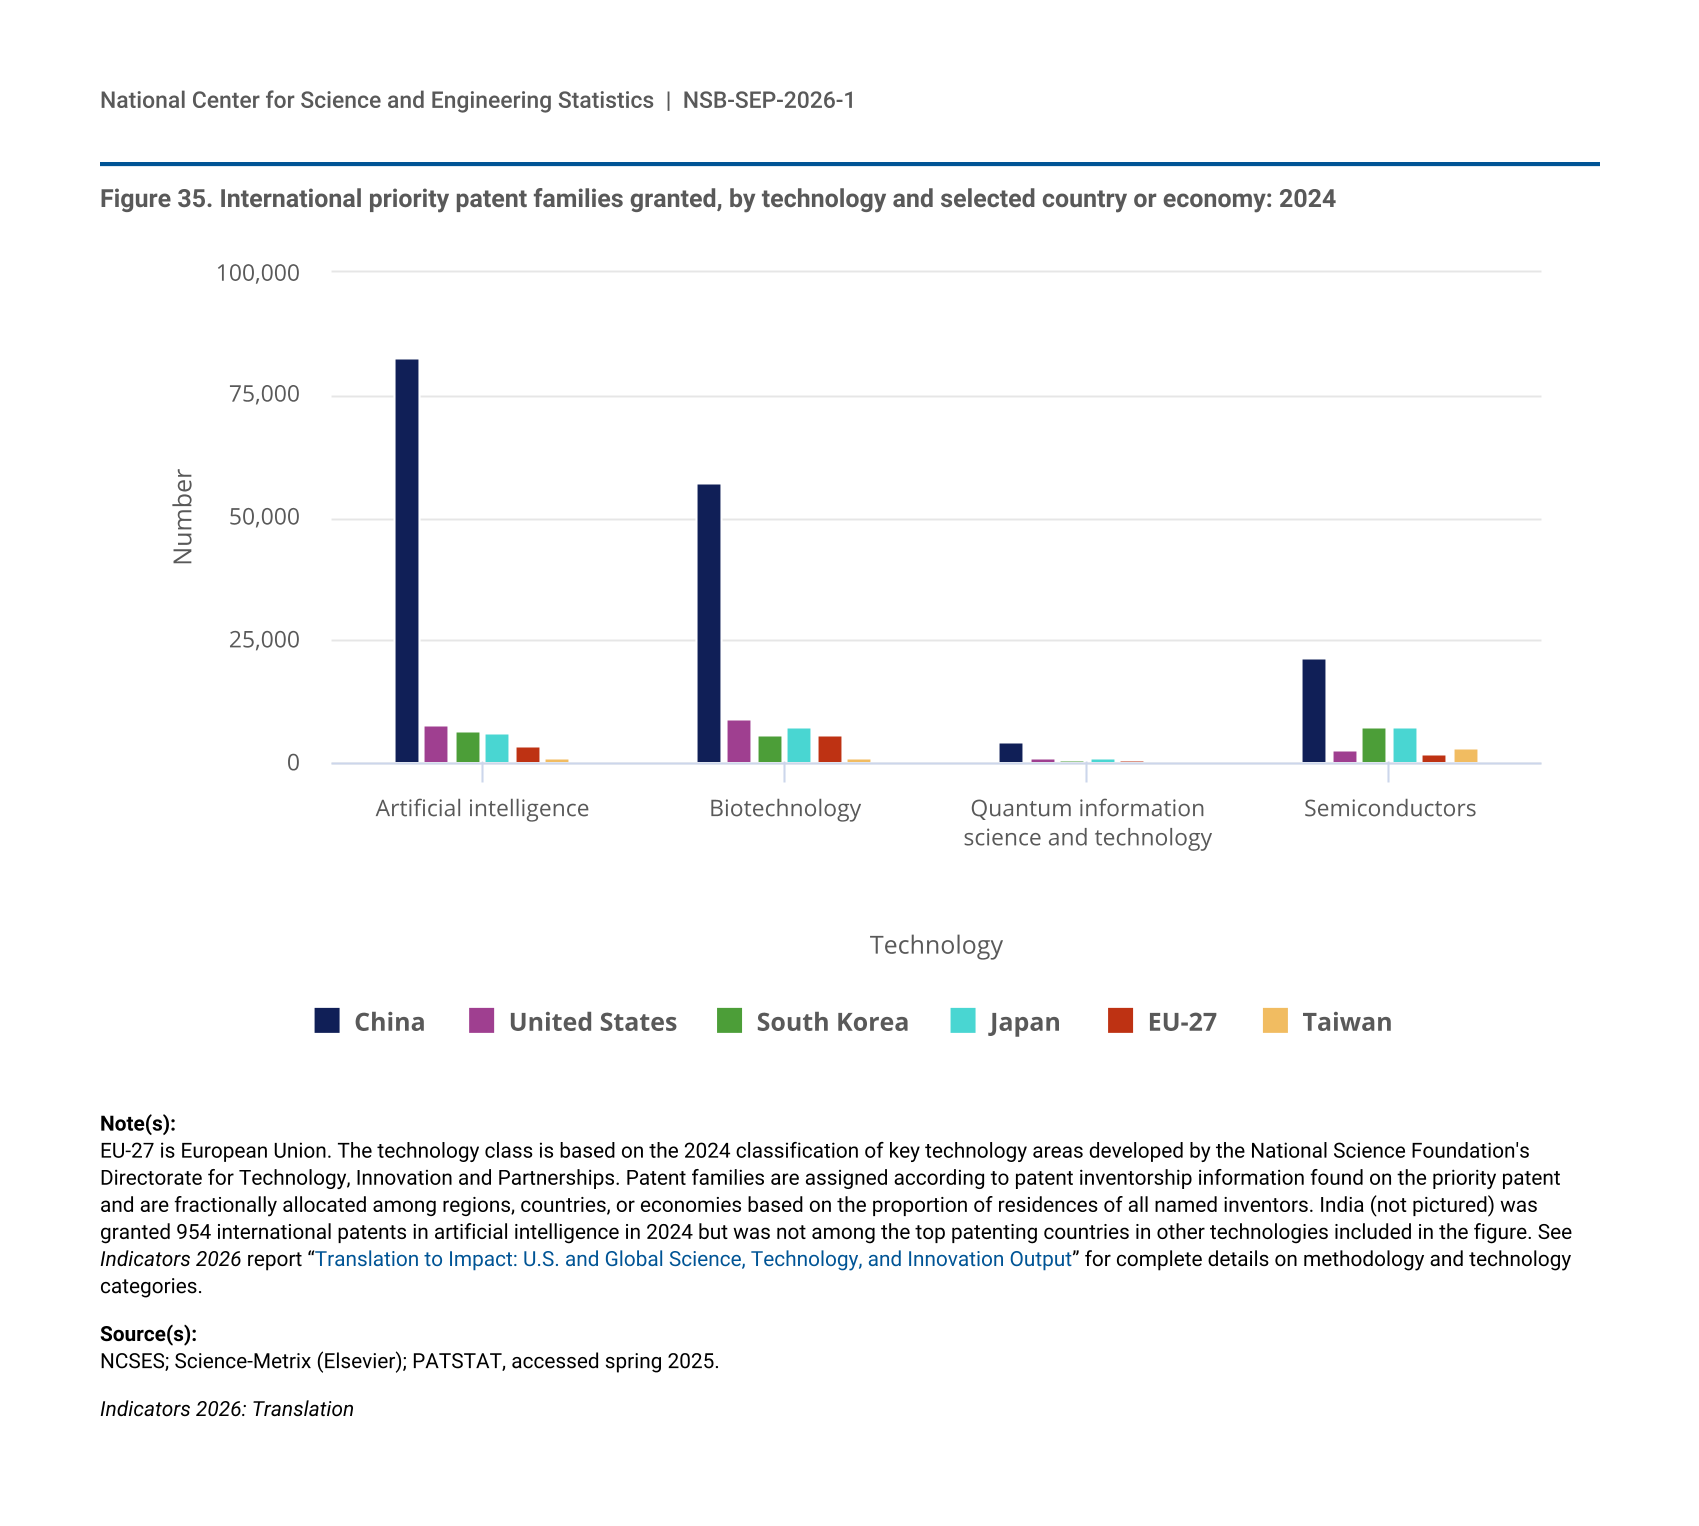
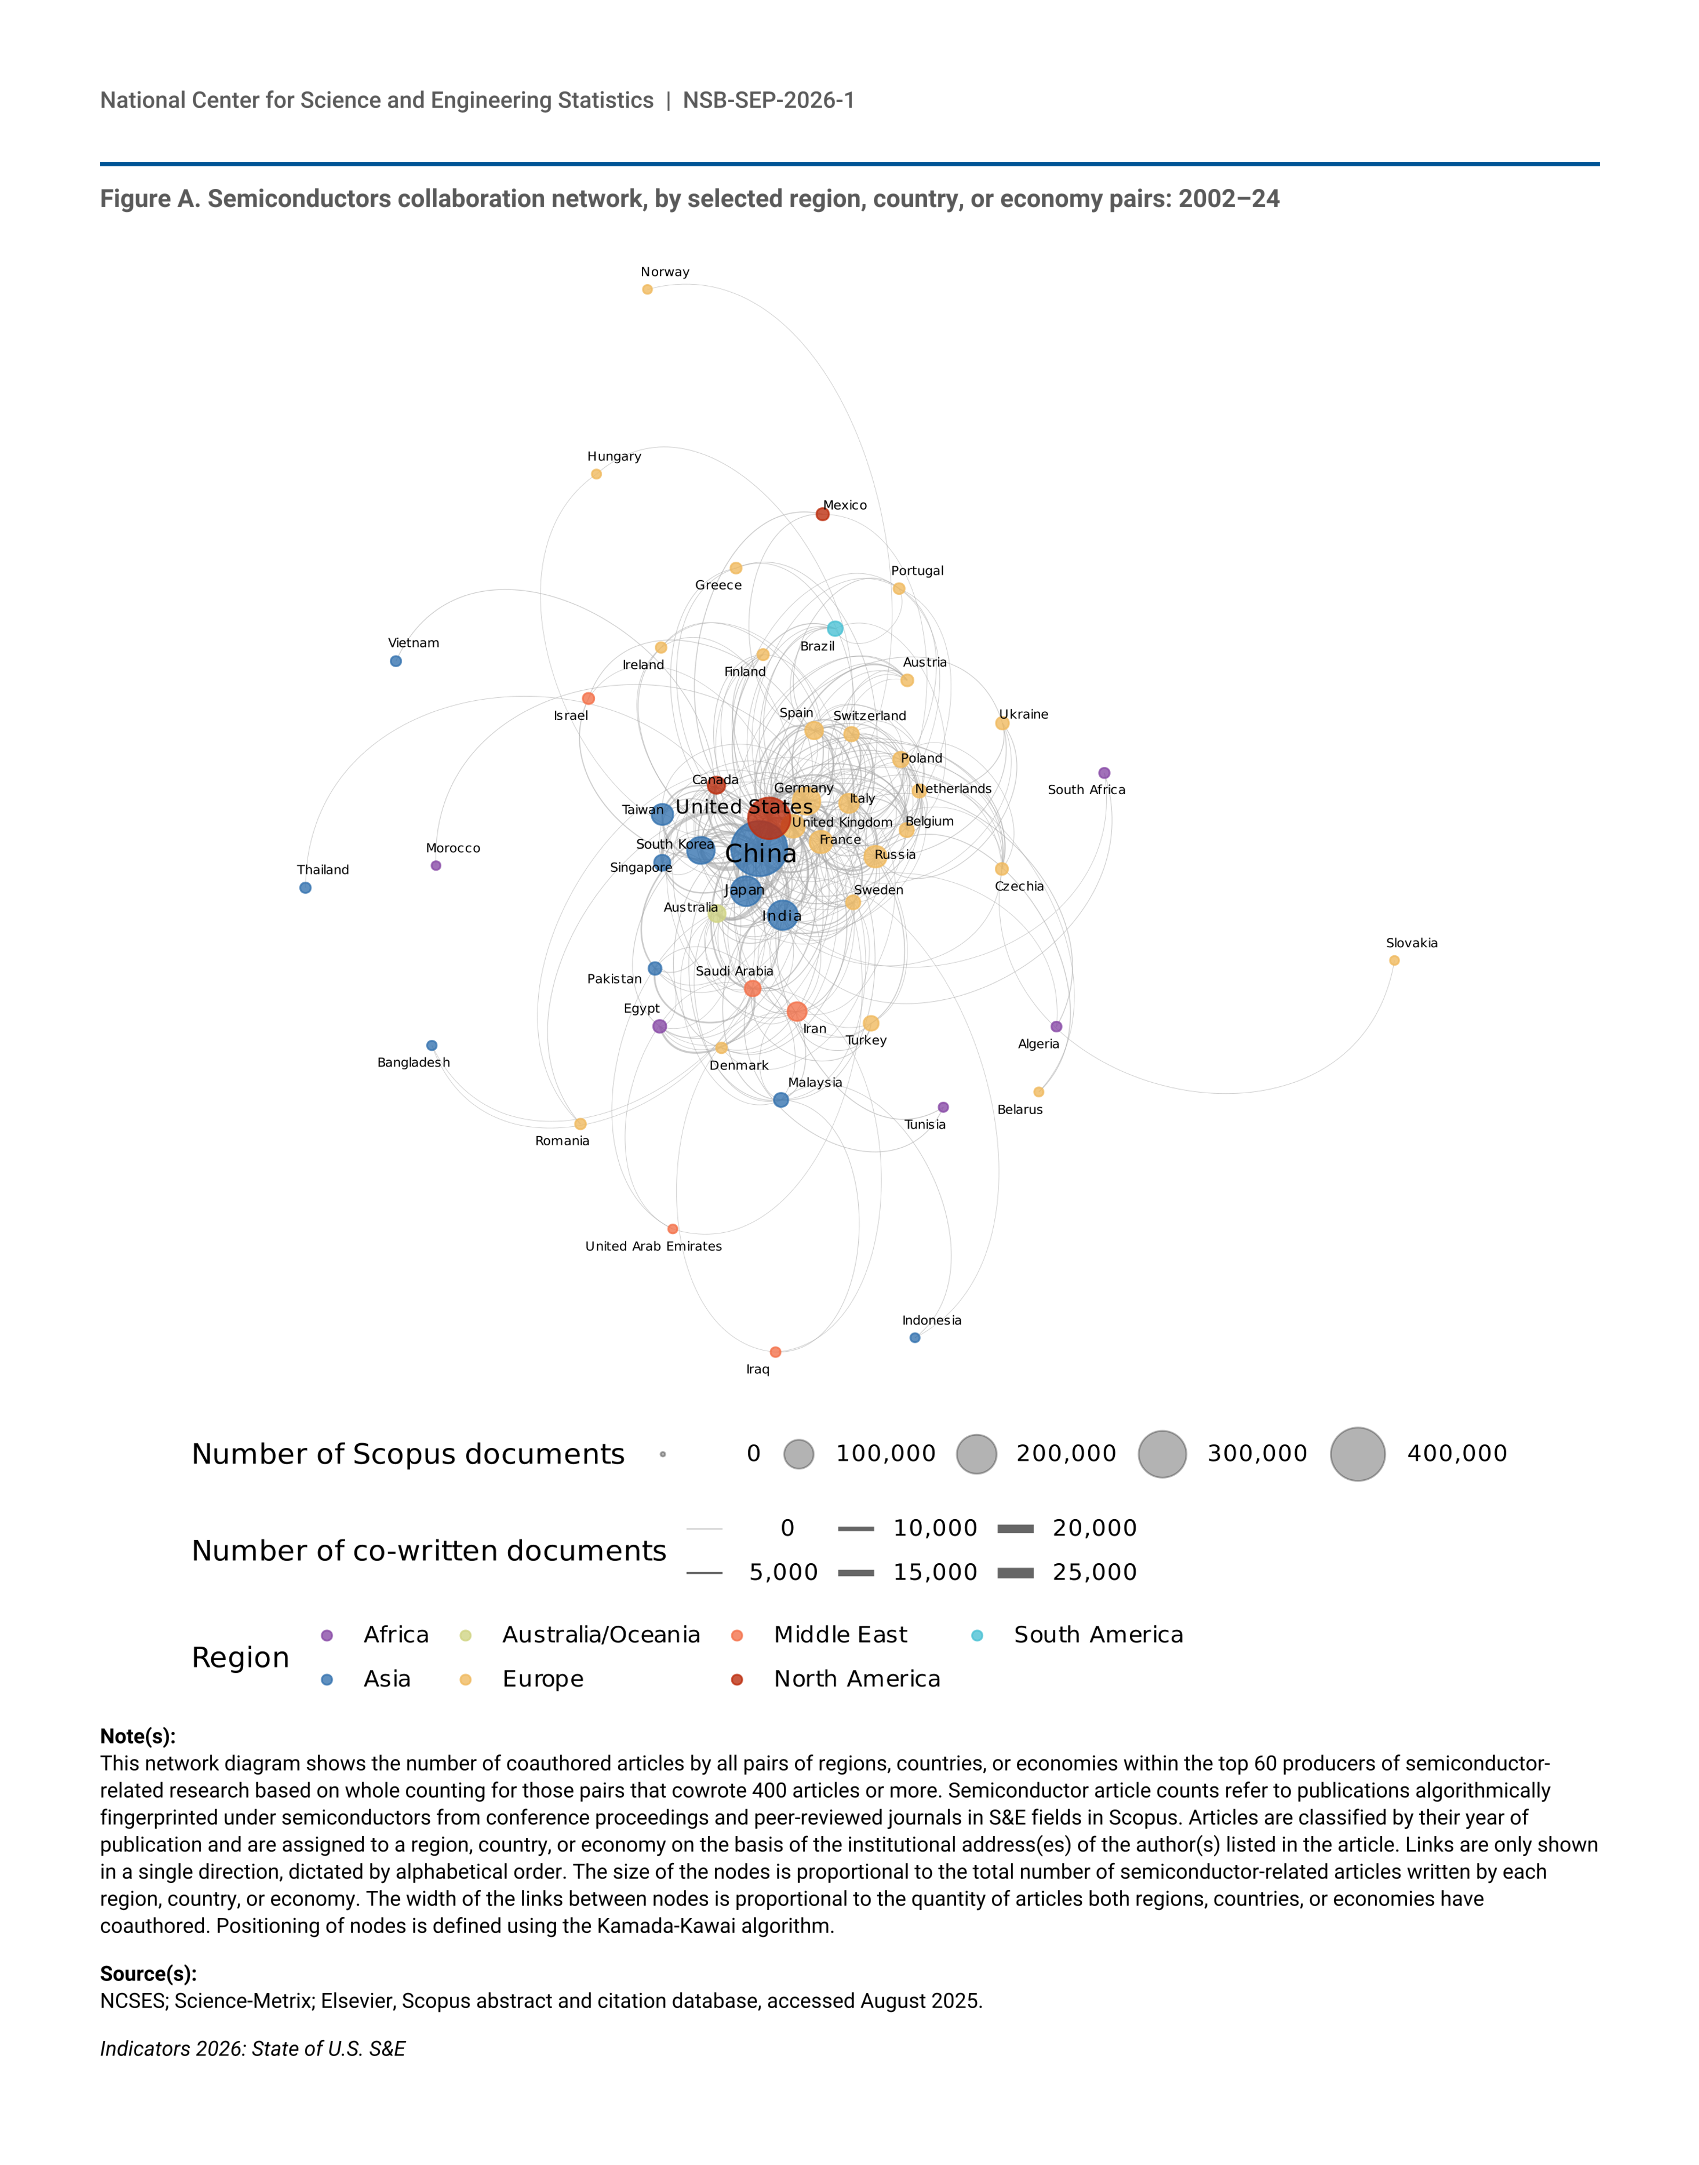
Since 2006, authors in the United States and the European Union (EU-27) have continued to publish large shares of highly cited S&E articles relative to their total output. During this period, the relative share of highly cited S&E articles published by authors in China has increased steadily, although it remains below those of authors in the United States and the EU-27 (Figure 6). In 2019, China surpassed the United States in the total number of S&E doctoral degrees awarded annually, a position it has held since then (Figure 7). Inventors from China received three-quarters of all AI international priority patents in 2024 (NSB 2026b: Figure TRN-8). In 2024, China led global semiconductor production, measured as value added, with a 30% share, followed by Taiwan (23%), the United States (19%), and South Korea (11%). Semiconductors are key enabling technologies in many CET areas such as AI, QIST, robotics, autonomous systems, and defense and aerospace technologies.
| Publication year | United States | EU-27 | China | India | Japan |
|---|---|---|---|---|---|
| 2006 | 1.87 | 1.10 | 0.42 | 0.62 | 0.65 |
| 2007 | 1.86 | 1.12 | 0.47 | 0.65 | 0.68 |
| 2008 | 1.93 | 1.09 | 0.50 | 0.68 | 0.63 |
| 2009 | 1.92 | 1.14 | 0.54 | 0.69 | 0.65 |
| 2010 | 1.93 | 1.19 | 0.58 | 0.62 | 0.69 |
| 2011 | 1.94 | 1.20 | 0.64 | 0.69 | 0.74 |
| 2012 | 1.93 | 1.22 | 0.68 | 0.63 | 0.71 |
| 2013 | 1.93 | 1.22 | 0.73 | 0.74 | 0.82 |
| 2014 | 1.94 | 1.24 | 0.79 | 0.69 | 0.80 |
| 2015 | 1.92 | 1.25 | 0.84 | 0.75 | 0.85 |
| 2016 | 1.93 | 1.24 | 0.89 | 0.84 | 0.88 |
| 2017 | 1.91 | 1.26 | 1.01 | 0.81 | 0.96 |
| 2018 | 1.88 | 1.26 | 1.09 | 0.83 | 0.92 |
| 2019 | 1.88 | 1.28 | 1.13 | 0.92 | 1.02 |
| 2020 | 1.78 | 1.27 | 1.21 | 1.03 | 1.00 |
| 2021 | 1.77 | 1.28 | 1.24 | 1.11 | 0.93 |
| 2022 | 1.72 | 1.33 | 1.29 | 1.11 | 1.06 |
EU-27 is European Union. Articles are classified by their year of publication and are assigned to a region, country, or economy on a whole-count basis according to the institutional address(es) of the author(s) listed in the article. Citation data are based on all citations made to articles in their publication year and all following years and are normalized by subfield and publication year to allow for comparisons across subfields and over time, resulting in the world level standing at 1.00 for each subfield and year.
NCSES; Science-Metrix; Elsevier, Scopus abstract and citation database, accessed August 2025.
Indicators 2026: State of U.S. S&E
| Year | China | United States | India | United Kingdom | Germany | Brazil | France | South Korea |
|---|---|---|---|---|---|---|---|---|
| 2015 | 34,440 | 39,933 | 16,216 | 15,338 | 15,957 | 9,414 | 10,020 | 6,240 |
| 2016 | 35,147 | 39,710 | 19,001 | 15,757 | 15,871 | 10,469 | 9,564 | 6,689 |
| 2017 | 37,506 | 40,319 | 24,383 | 16,372 | 15,761 | 10,752 | 9,755 | 6,903 |
| 2018 | 39,768 | 41,071 | 28,394 | 17,366 | 15,061 | 11,365 | 8,987 | 7,077 |
| 2019 | 41,890 | 41,333 | 26,443 | 17,439 | 15,309 | 11,817 | 8,683 | 7,504 |
| 2020 | 43,399 | 41,701 | 16,968 | 17,312 | 14,092 | 9,492 | 7,691 | 8,125 |
| 2021 | 47,069 | 40,615 | 22,515 | 14,640 | 14,380 | 9,683 | 7,934 | 8,201 |
| 2022 | 53,385 | 44,739 | NA | 16,017 | 14,019 | 10,571 | 10,411 | 8,571 |
| 2023 | NA | 45,085 | NA | 16,447 | 13,787 | 11,444 | 11,399 | 8,340 |
To facilitate international comparison, data for the United States are those reported to the Organisation for Economic Co-operation and Development, which vary from the National Center for Science and Engineering Statistics classification of fields presented in other sections of the report. Data for China are not available for 2023; data for India are not available for 2022–23.
OECD, Education at a Glance; National Bureau of Statistics of China, China Statistical Yearbook; People's Republic of China, Ministry of Education data; Government of India, Ministry of Education, Department of Higher Education, All India Survey on Higher Education.
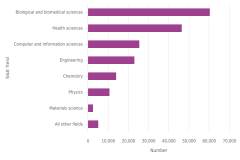
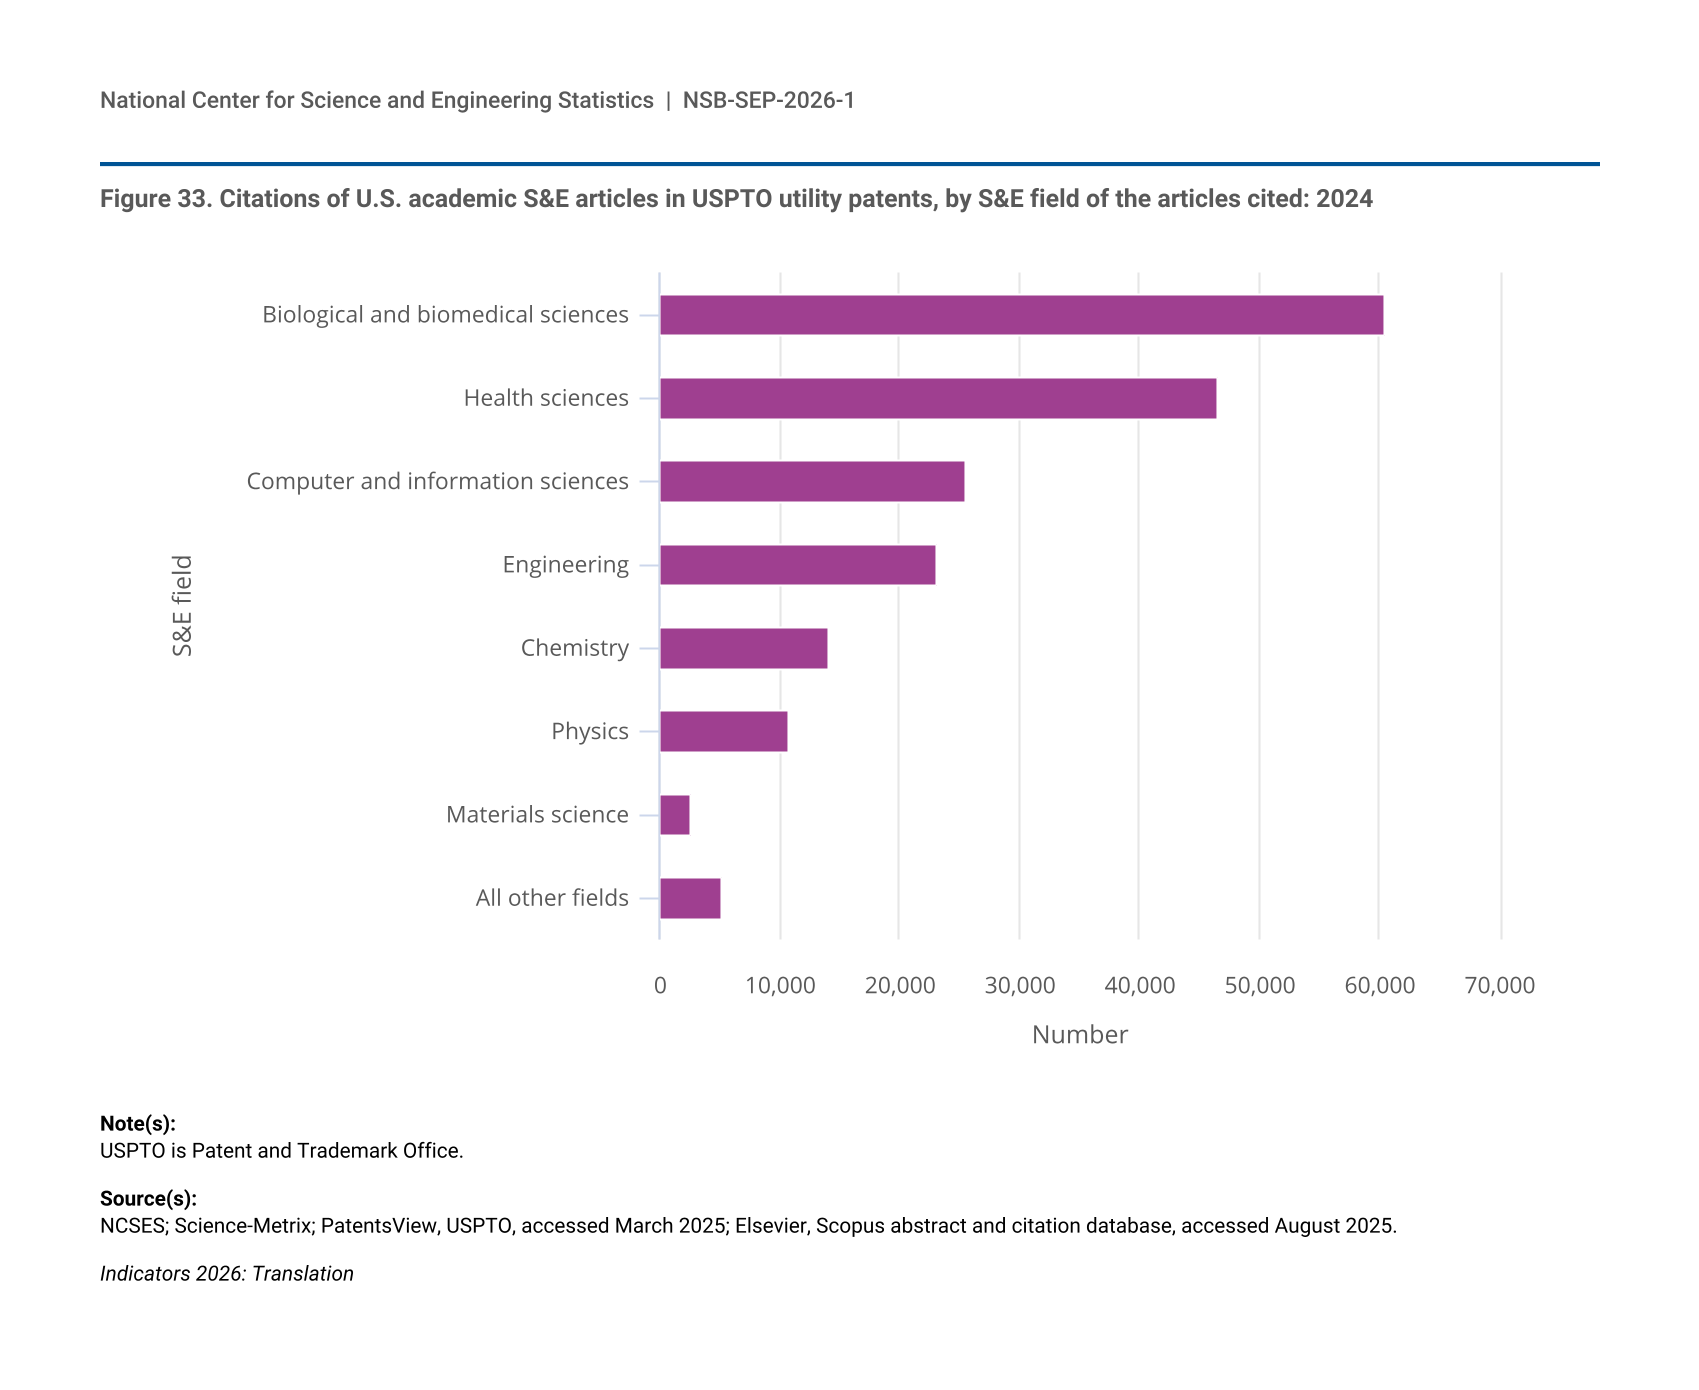
Despite international competition, the United States retains significant strengths and has one of the most R&D-intensive economies globally (3.4%), identified by R&D expenditures as a fraction of gross domestic product (GDP) (also known as GERD-to-GDP ratio) (Figure 4). U.S. researchers continue to produce disproportionately high shares of highly cited publications across most S&E fields. Articles from biological and biomedical sciences were cited in Patent and Trademark Office (USPTO) patents more frequently than any other S&E field between 2013 and 2024, accounting for 27% of all citations across the time period, with health sciences articles second at 25% (NSB 2026b: Figure TRN-6). Patents granted to U.S. inventors in critical technologies consistently demonstrate high impact, and they have the highest citation share globally in AI, biotechnology and related technologies, semiconductors, QIST, and advanced nuclear technologies (NSB 2026b: Figure TRN-10, Figure TRN-13, Figure TRN-16, Figure TRN-19, Figure TRN-22). While the share of highly cited patents in biotechnology and related technologies has risen for U.S. inventors between 2010 and 2021 (the last year that data are available), the share has declined for patents in AI, semiconductor technology, quantum science, and advanced nuclear technology during the same period, signaling intensifying competition in CET domains.
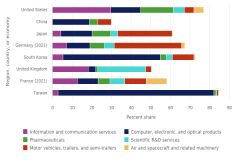
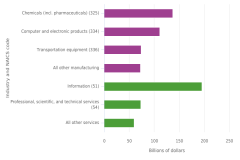
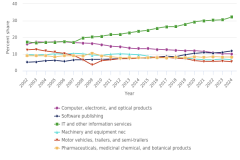
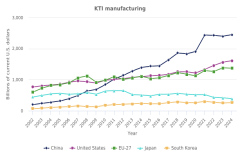
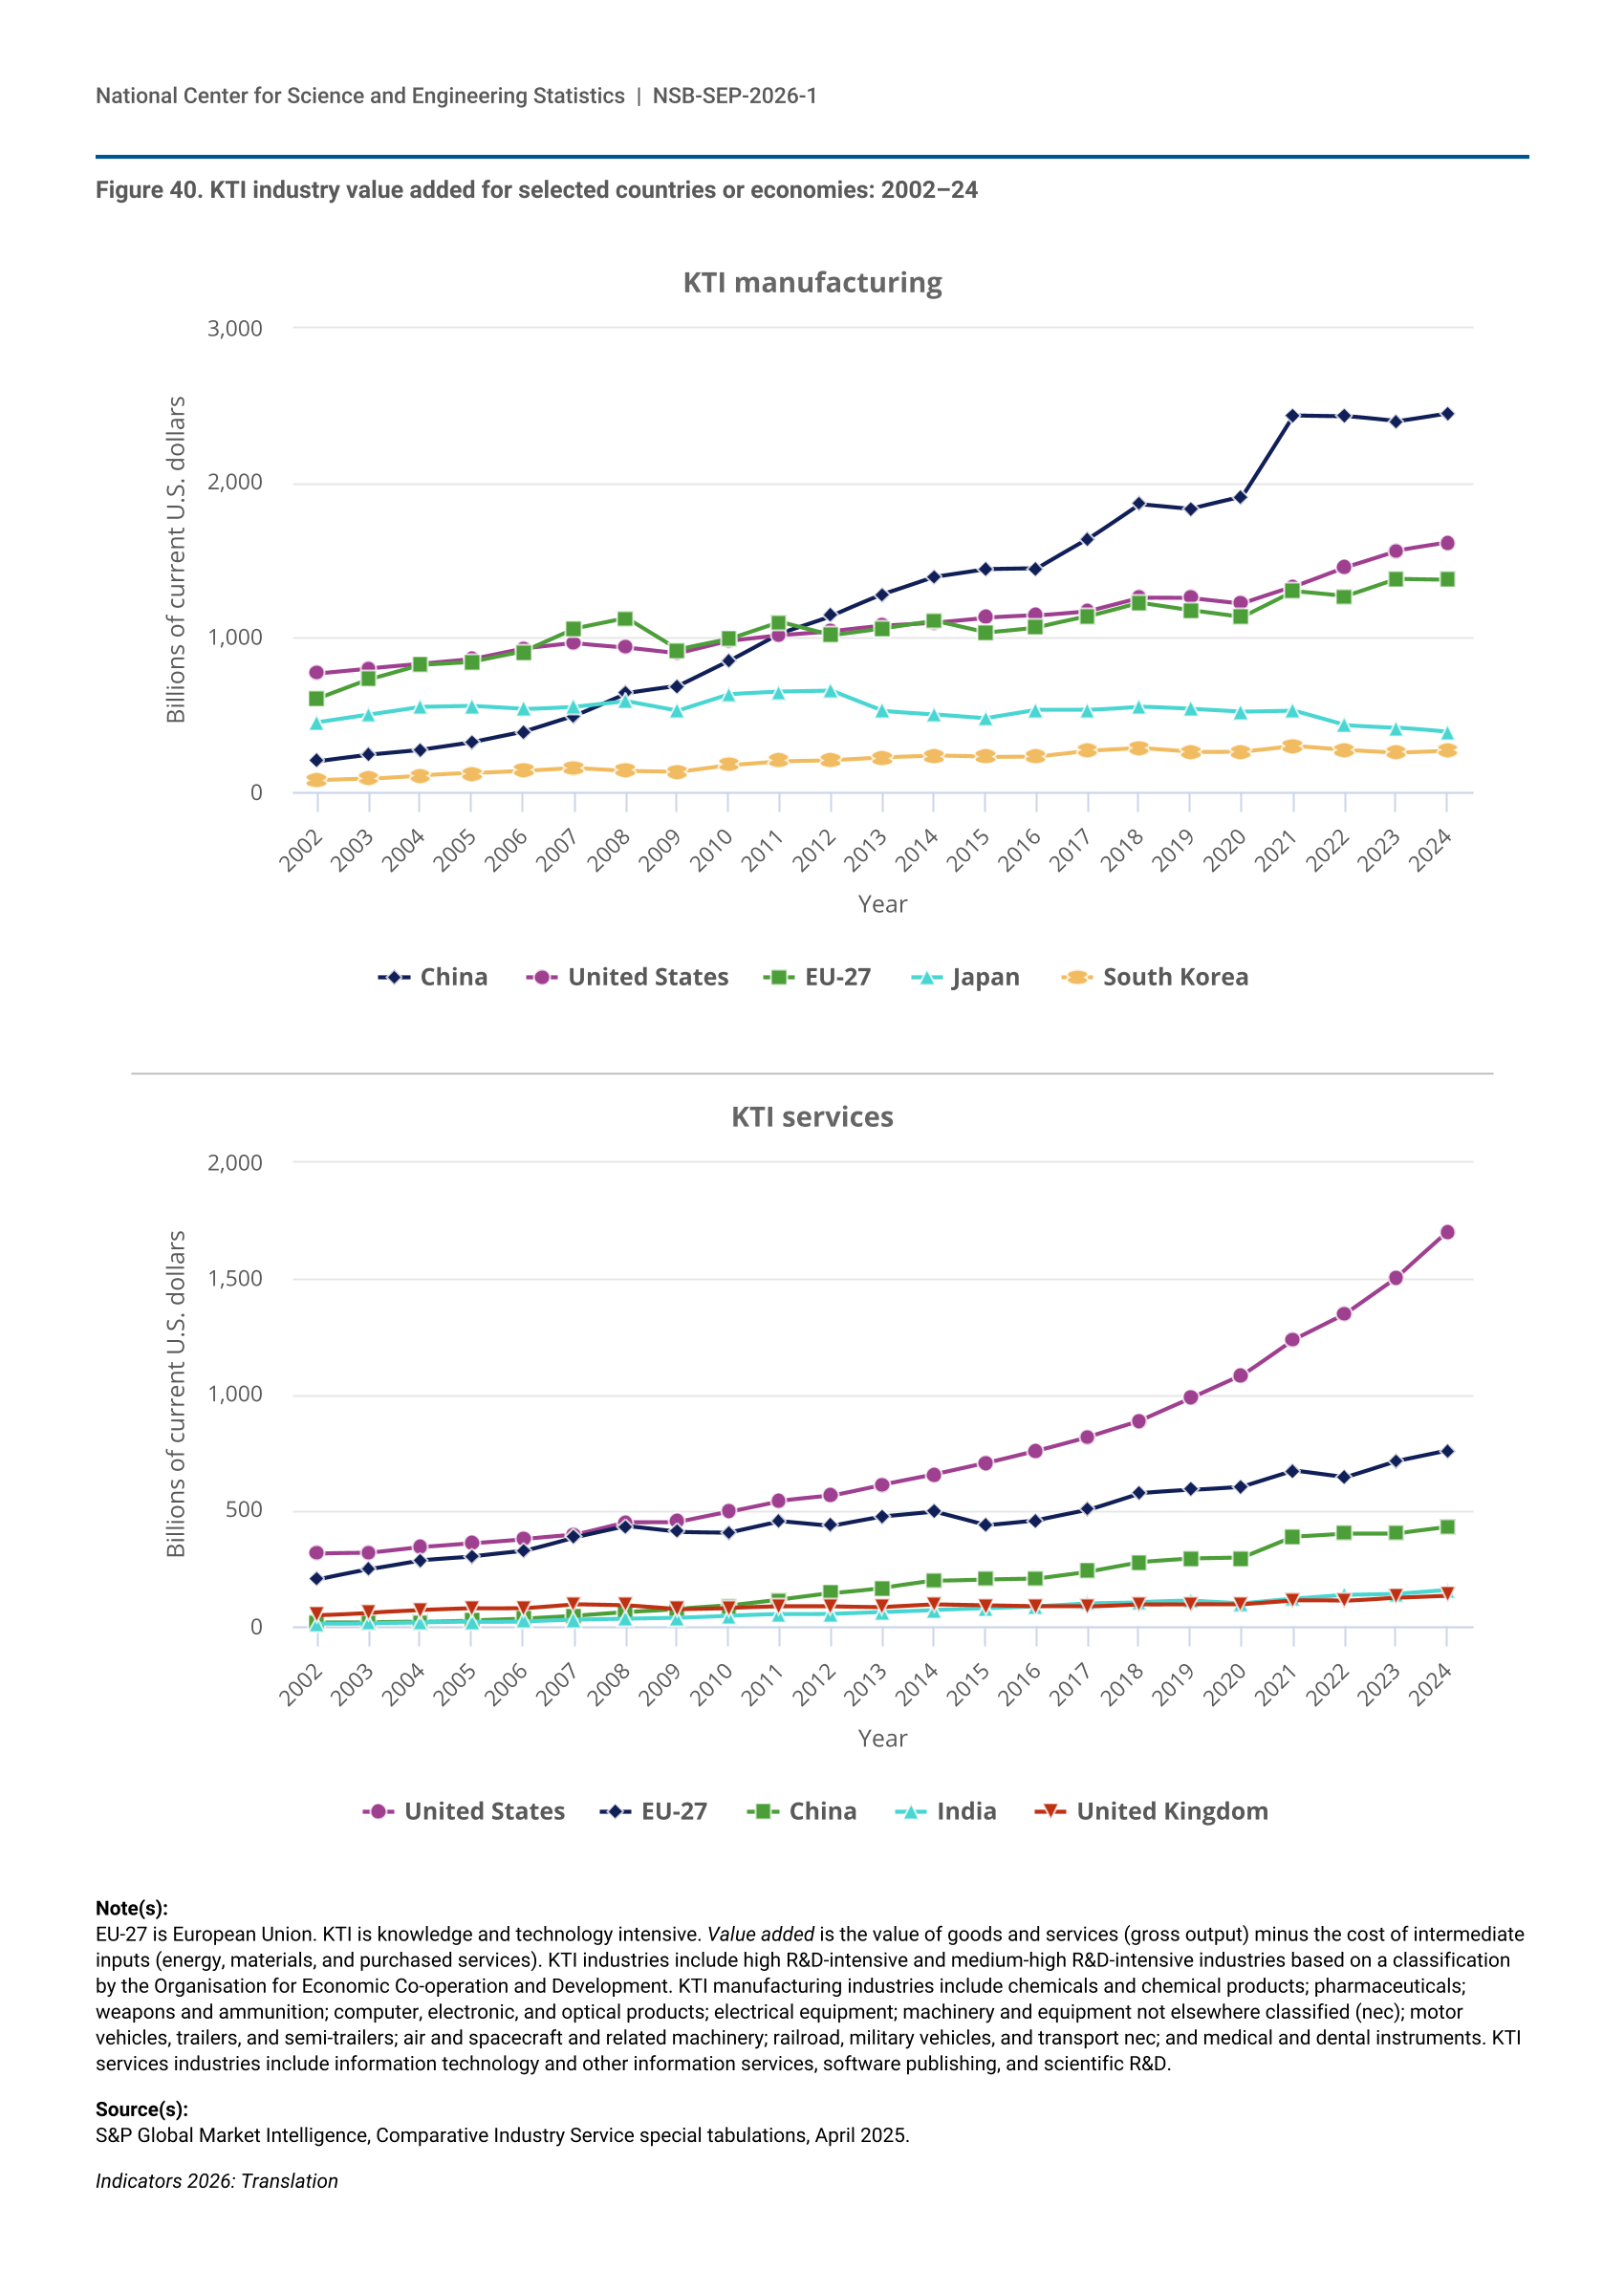
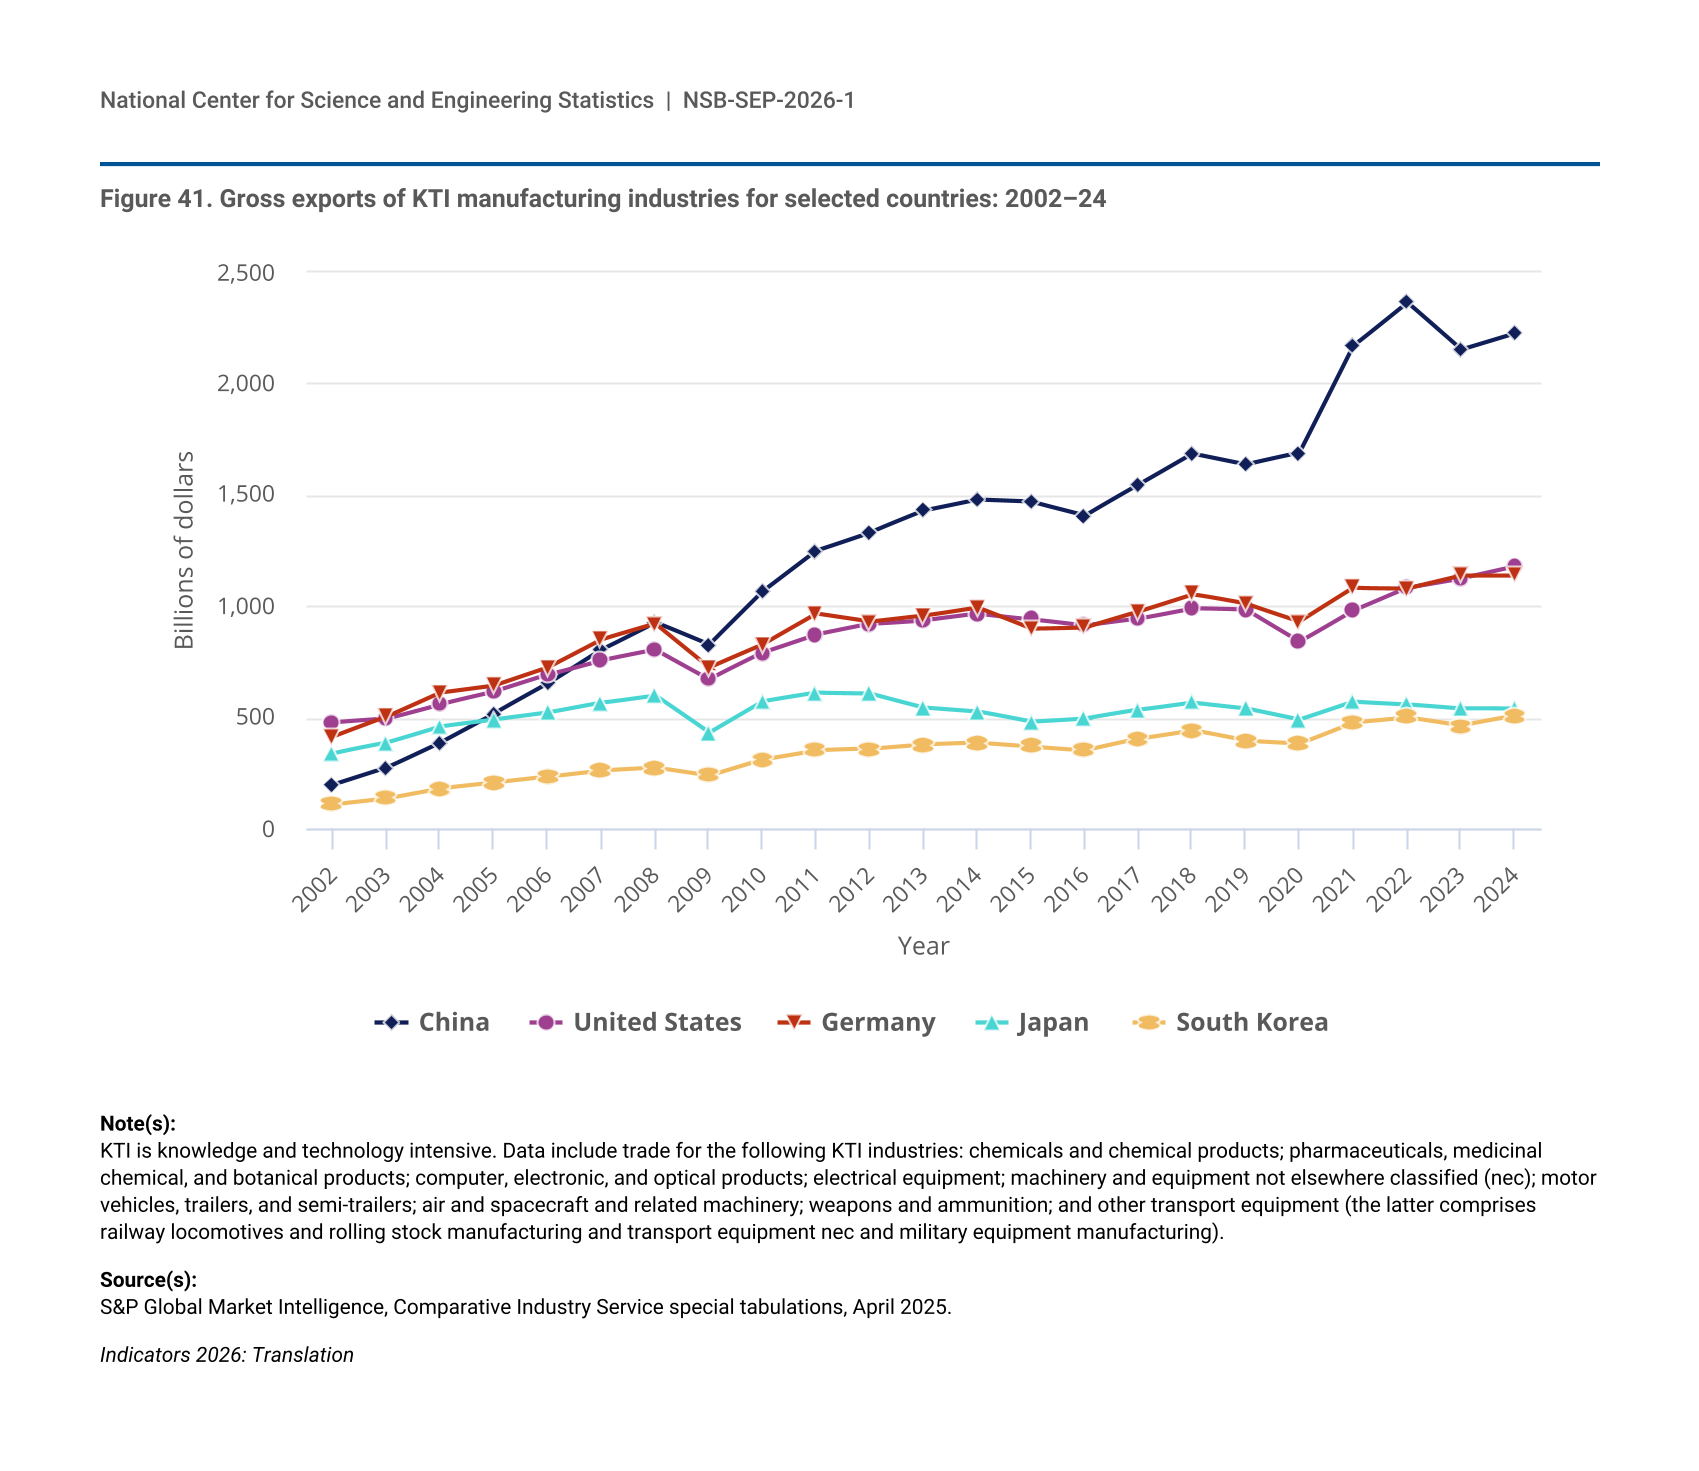
China has been the largest total knowledge- and technology-intensive (KTI) manufacturing producer since 2012, with the United States remaining the second-largest producer. However, the United States has retained the largest share of value-added production in four KTI manufacturing industries in 2024: air and spacecraft and related machinery, medical and dental instruments, pharmaceuticals, and weapons and ammunitions. The United States dominates KTI services production, holding a 43% global share in 2024 compared with China’s 11%. U.S. leadership is particularly pronounced in software publishing, where the United States holds 75% of global value added, followed by IT and information services at 44% (NSB 2026b: Figure TRN-35).
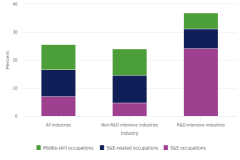
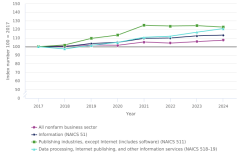
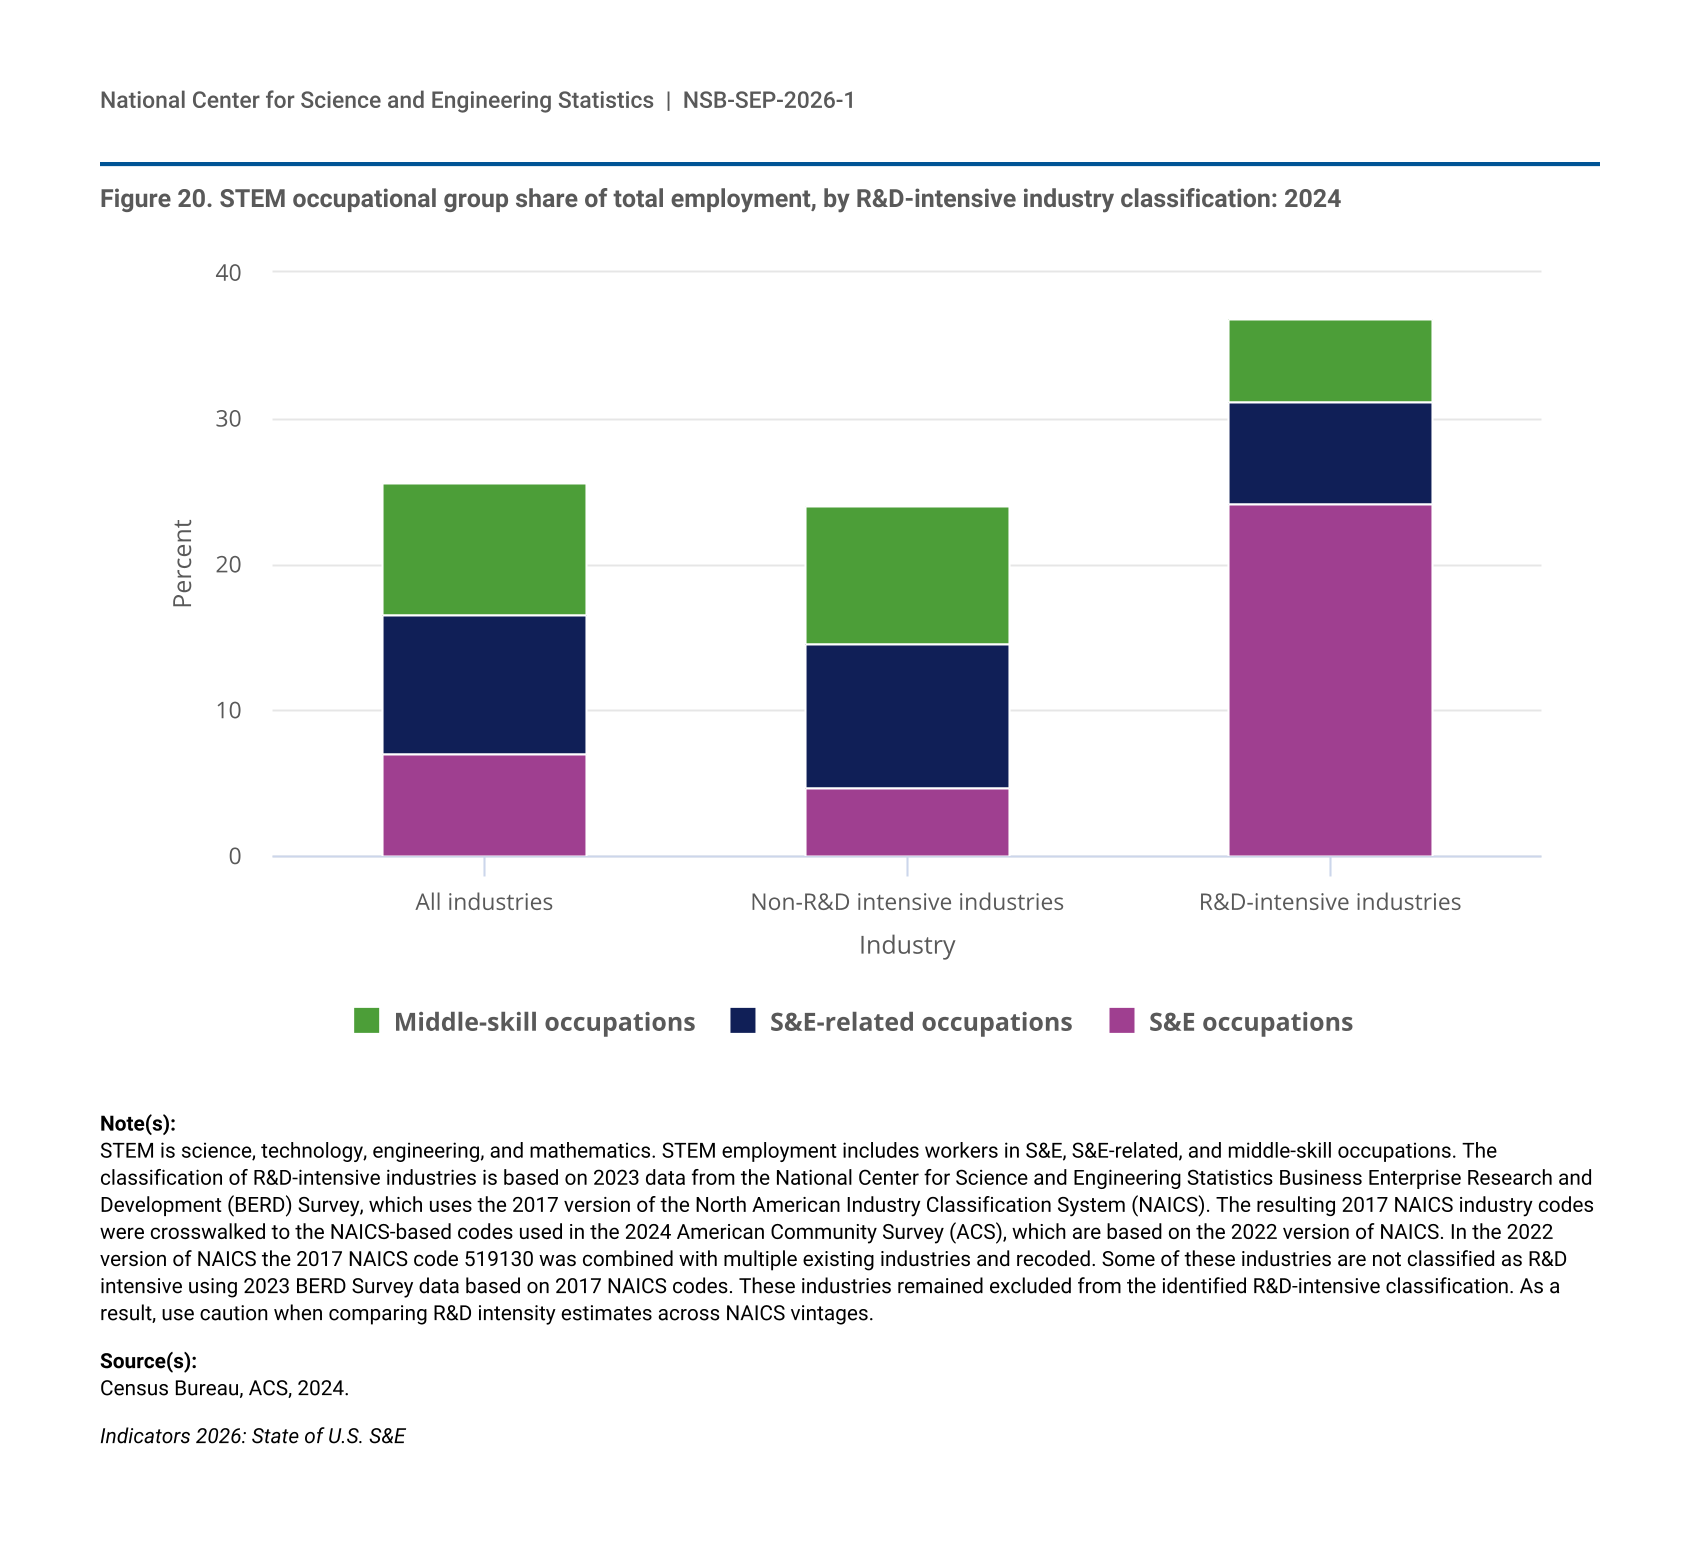
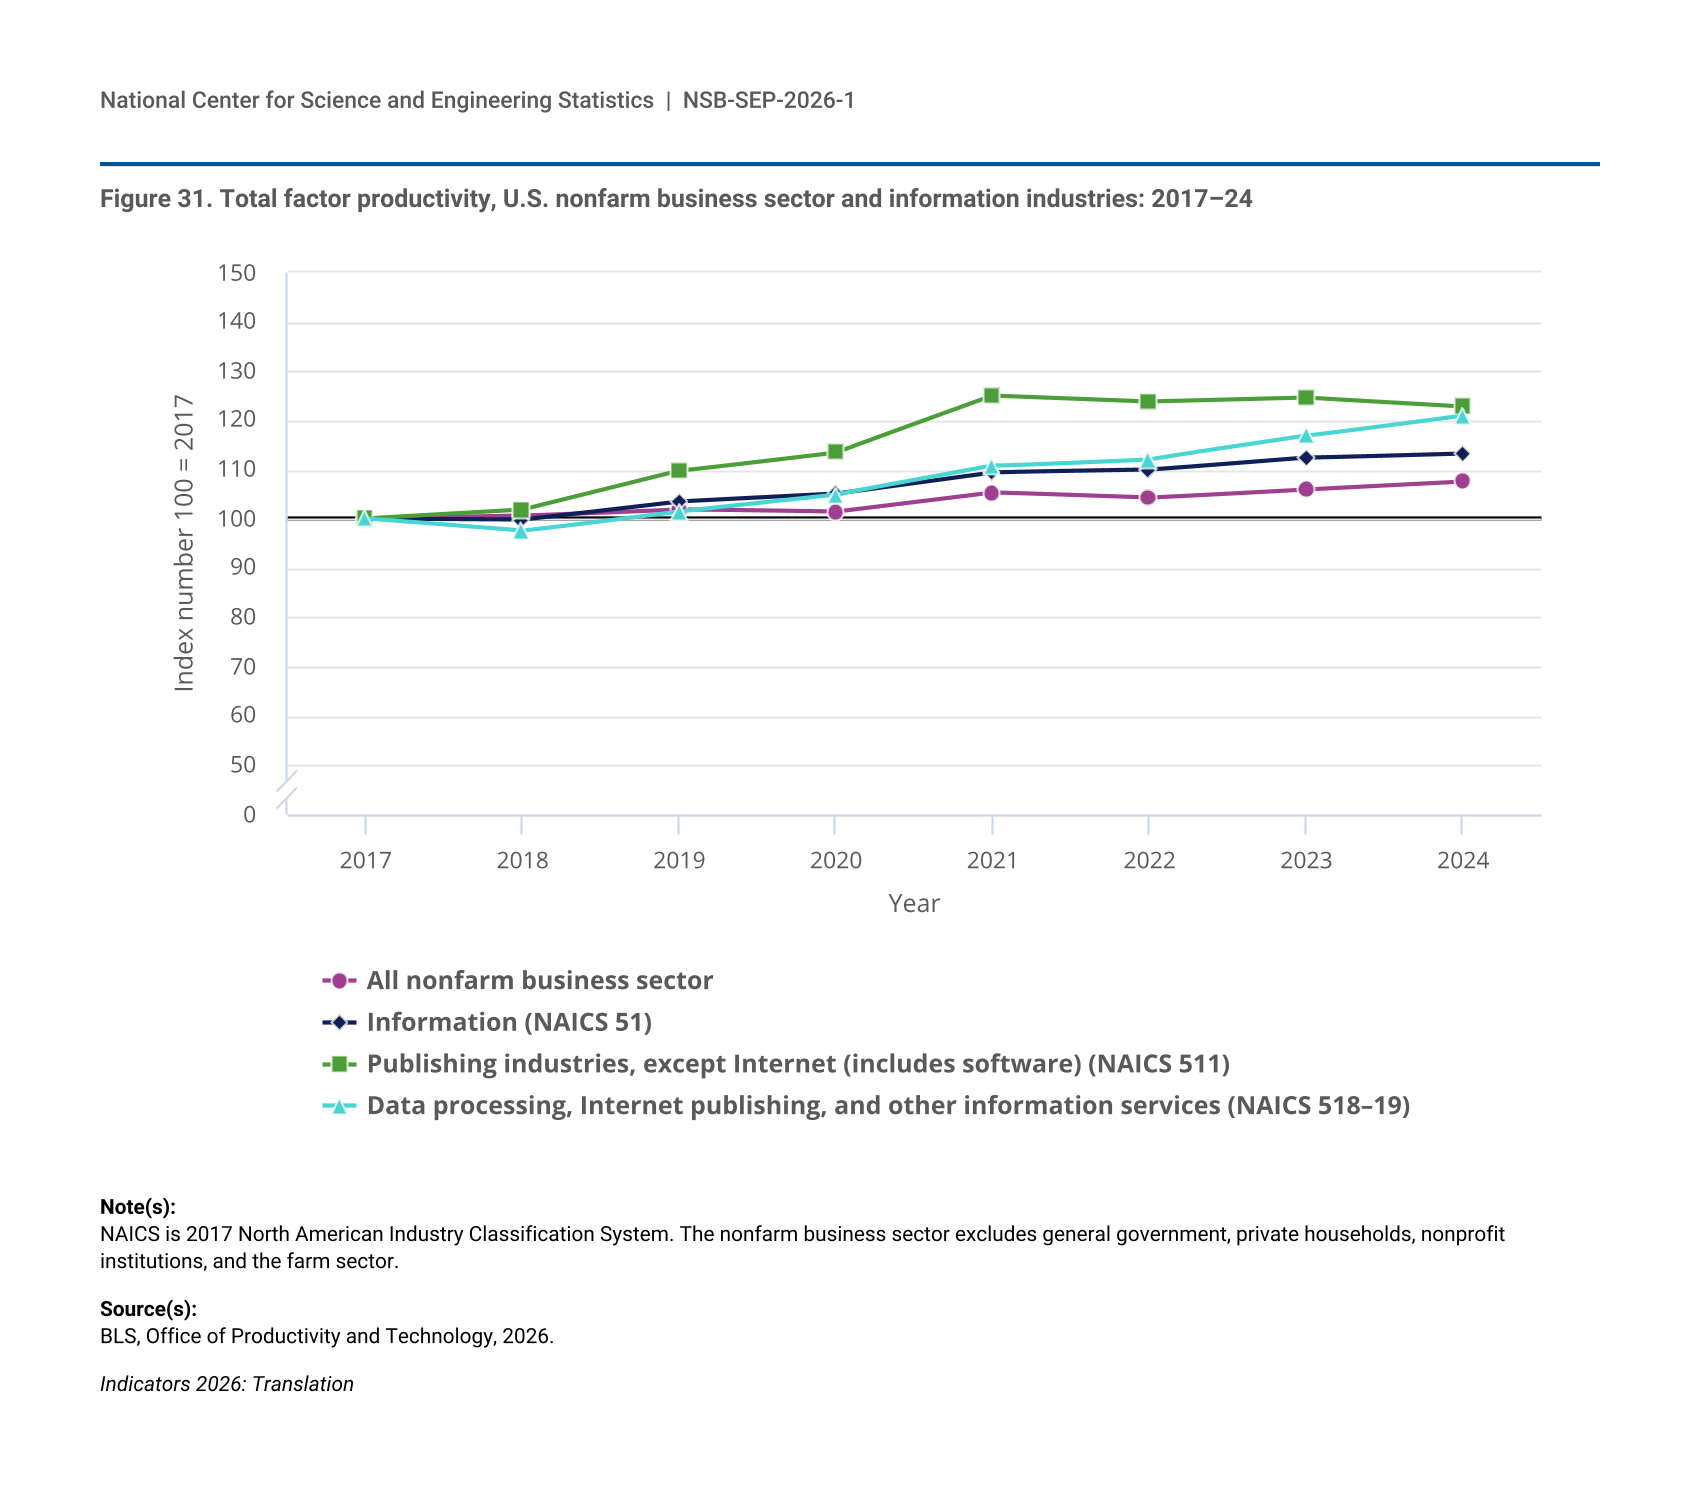
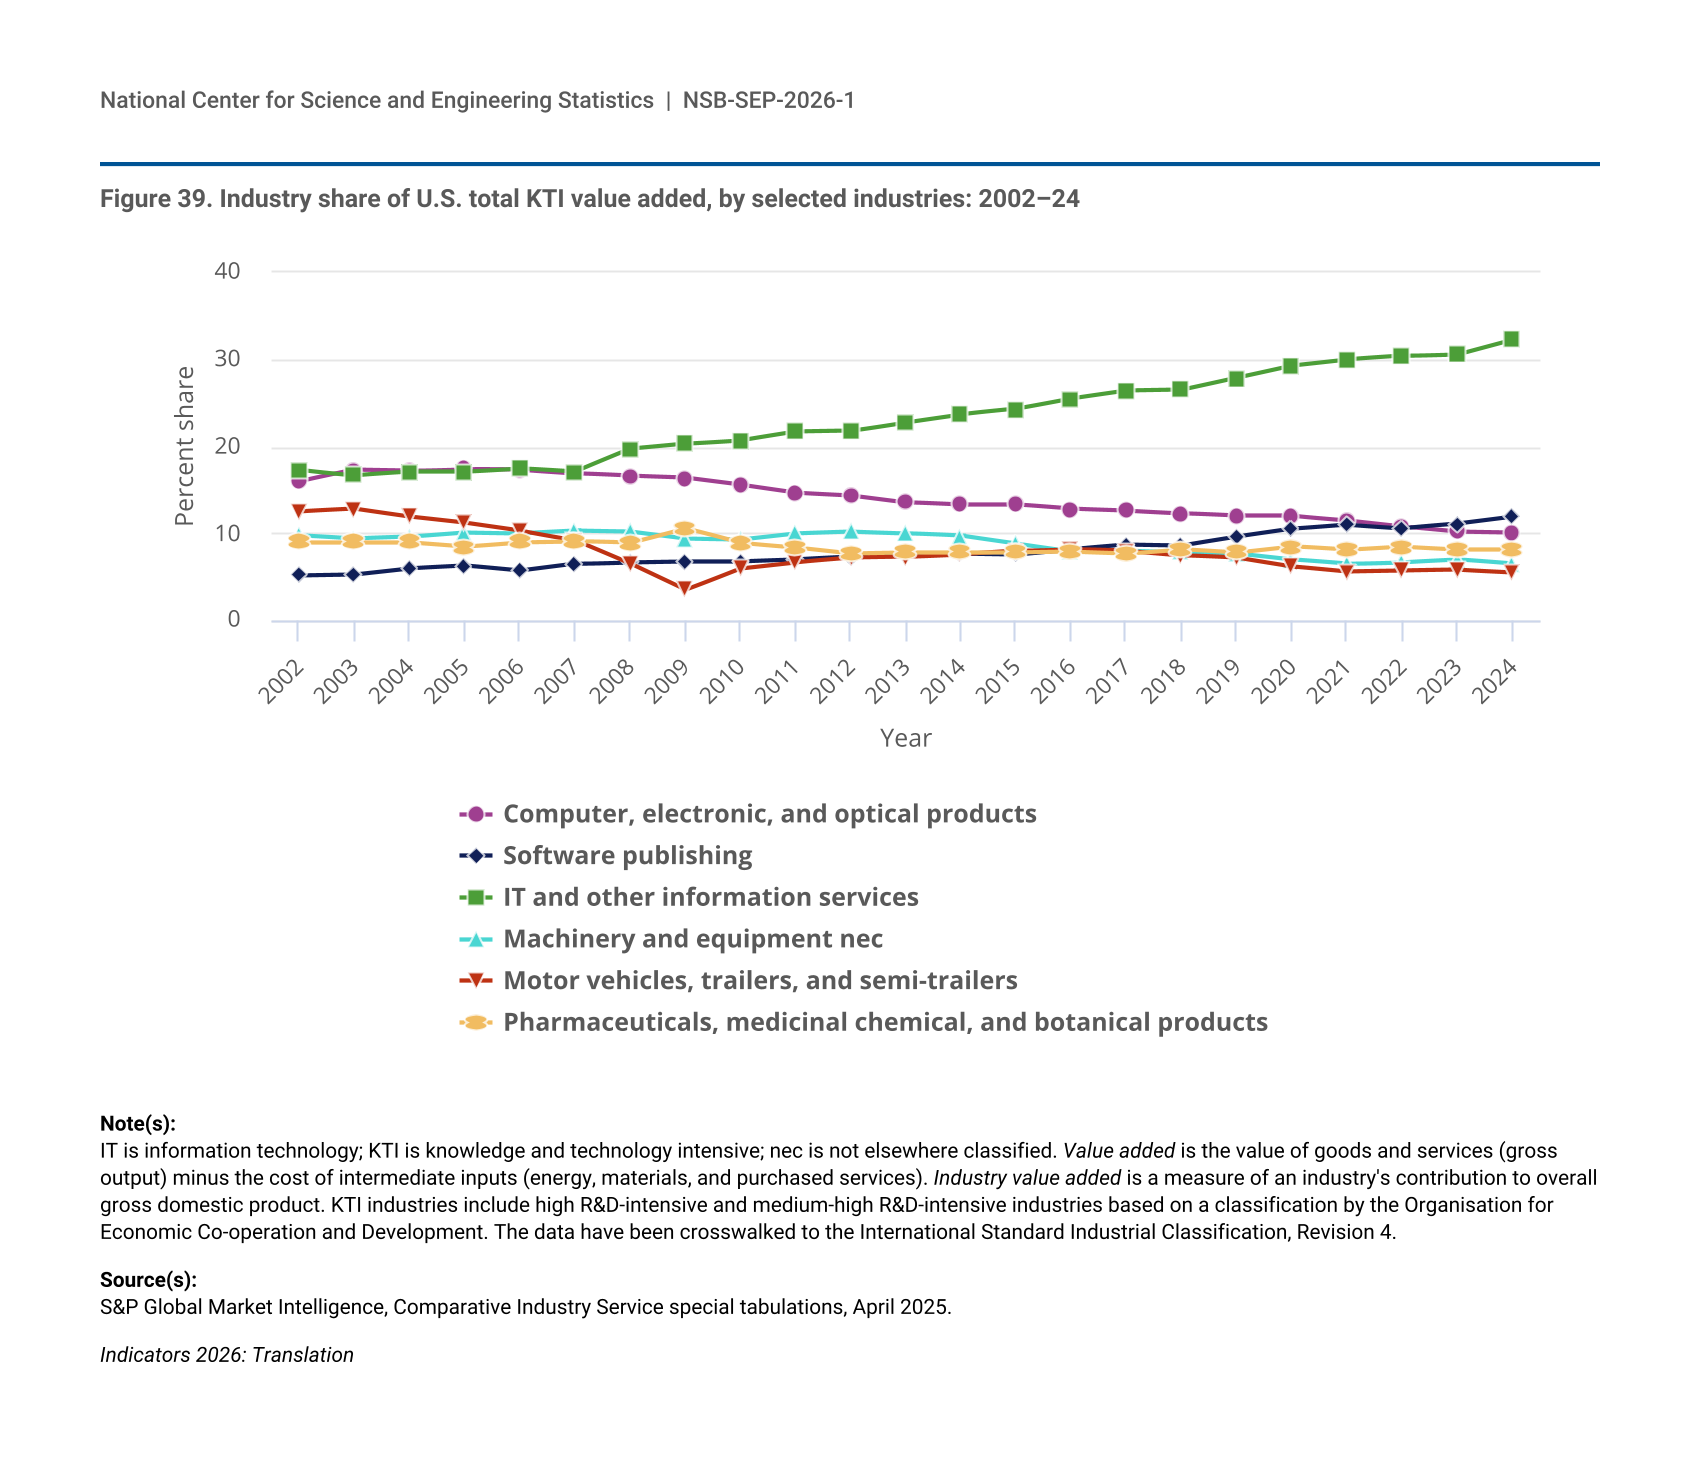
Between 2017 and 2024, TFP, an internationally comparable indicator of the impact of innovation and technological change on growth within an economy and its component industries, for the information sector grew faster (13%) than for the nonfarm business sector overall (8%). Within the information sector, TFP for publishing industries (including software) (23%) and for data processing, Internet publishing, and other information services (21%) have exhibited strong growth since 2017 (NSB 2026b: Figure TRN-1). These information sector industries are R&D-intensive, those industries where the ratio of R&D expenses to sales is higher than the average across all industries, and where STEM workers are highly represented. STEM workers accounted for 37% of employment in R&D-intensive industries in the United States in 2024, compared with 26% of all industries (see “STEM Workers in the Economy and R&D-Intensive Industries” section below).
The sectoral composition of the S&P 500, the large-cap (companies with high market capitalization, typically over $10 billion) segment of the U.S. equity market between 1995 and 2025, has shifted. According to S&P Dow Jones Indices, “index composition has evolved to reflect the increased importance of Information Technology companies and the reduction in Industrials and Energy companies.” The S&P Dow Jones Indices also reports that the information technology (IT) sector represents roughly a third of the companies in the index in 2025. In 1995, the five largest companies in the S&P 500 were General Electric, Exxon Mobil, AT&T, Coca Cola, and Royal Dutch Petroleum; in 2025, the five largest companies were Nvidia, Microsoft, Apple, Amazon, and Meta Platforms (S&P Dow Jones Indices 2025).
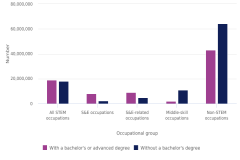
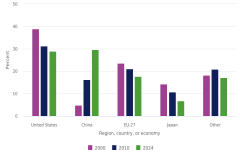
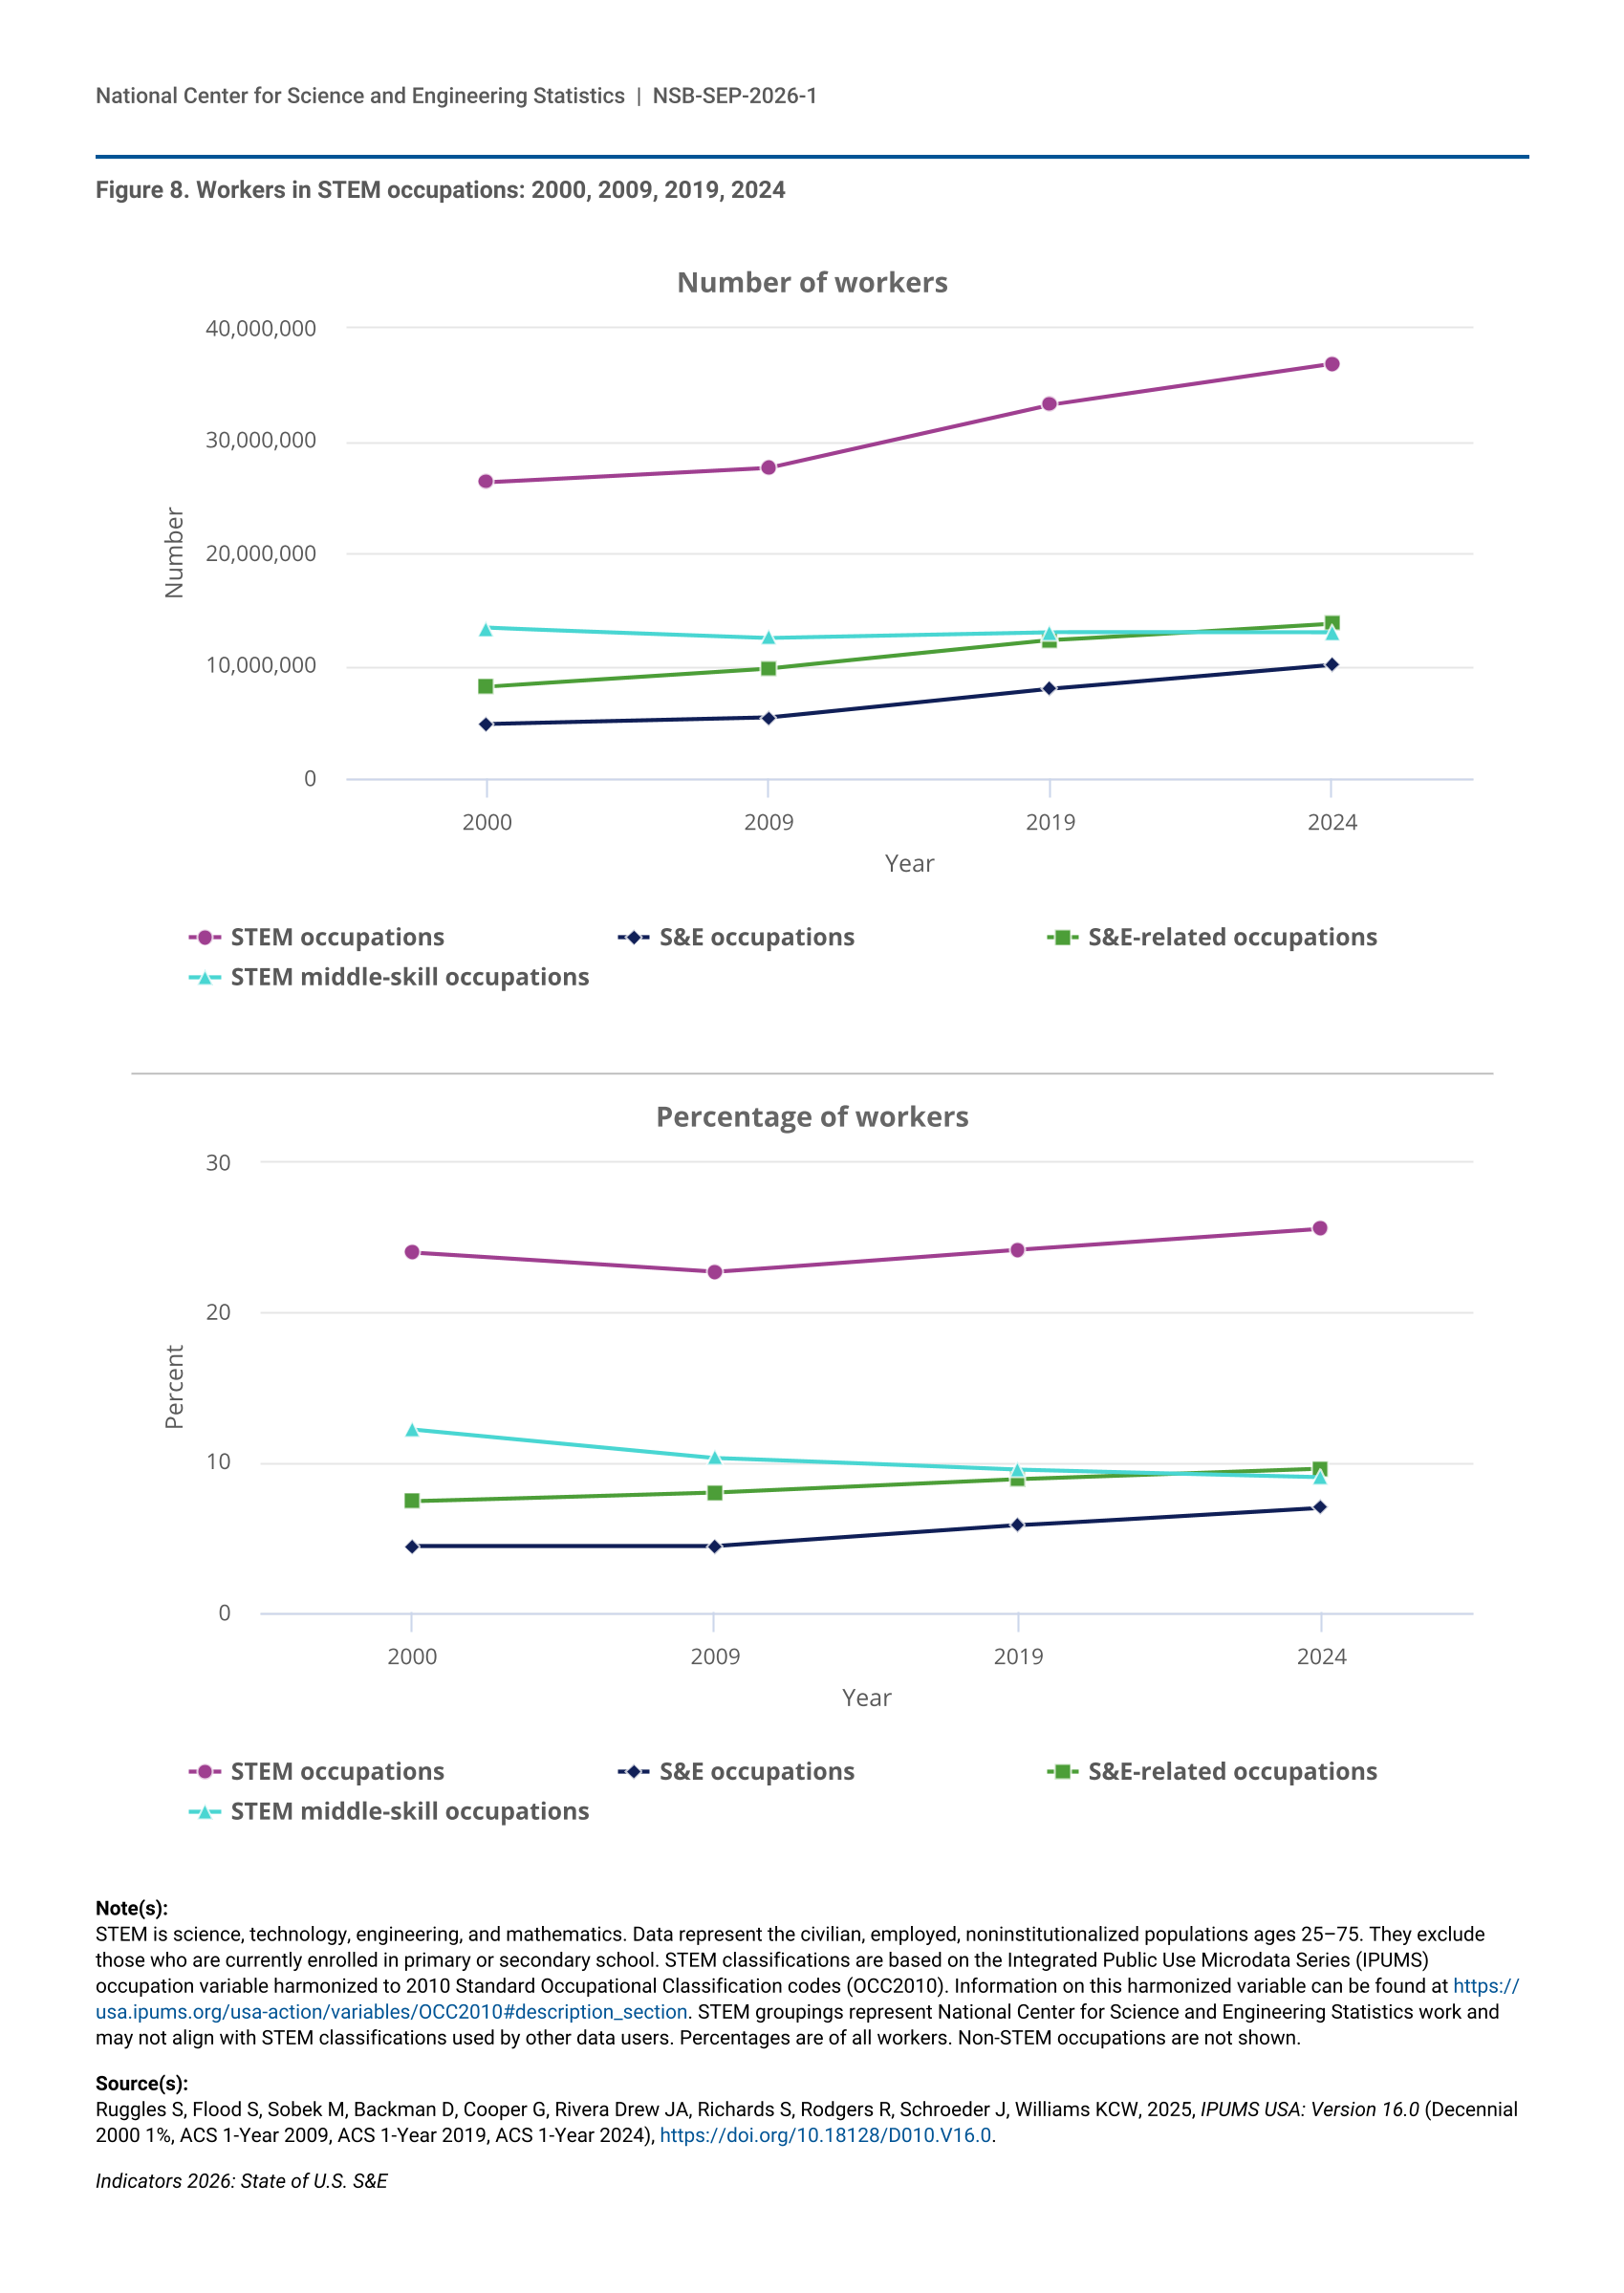
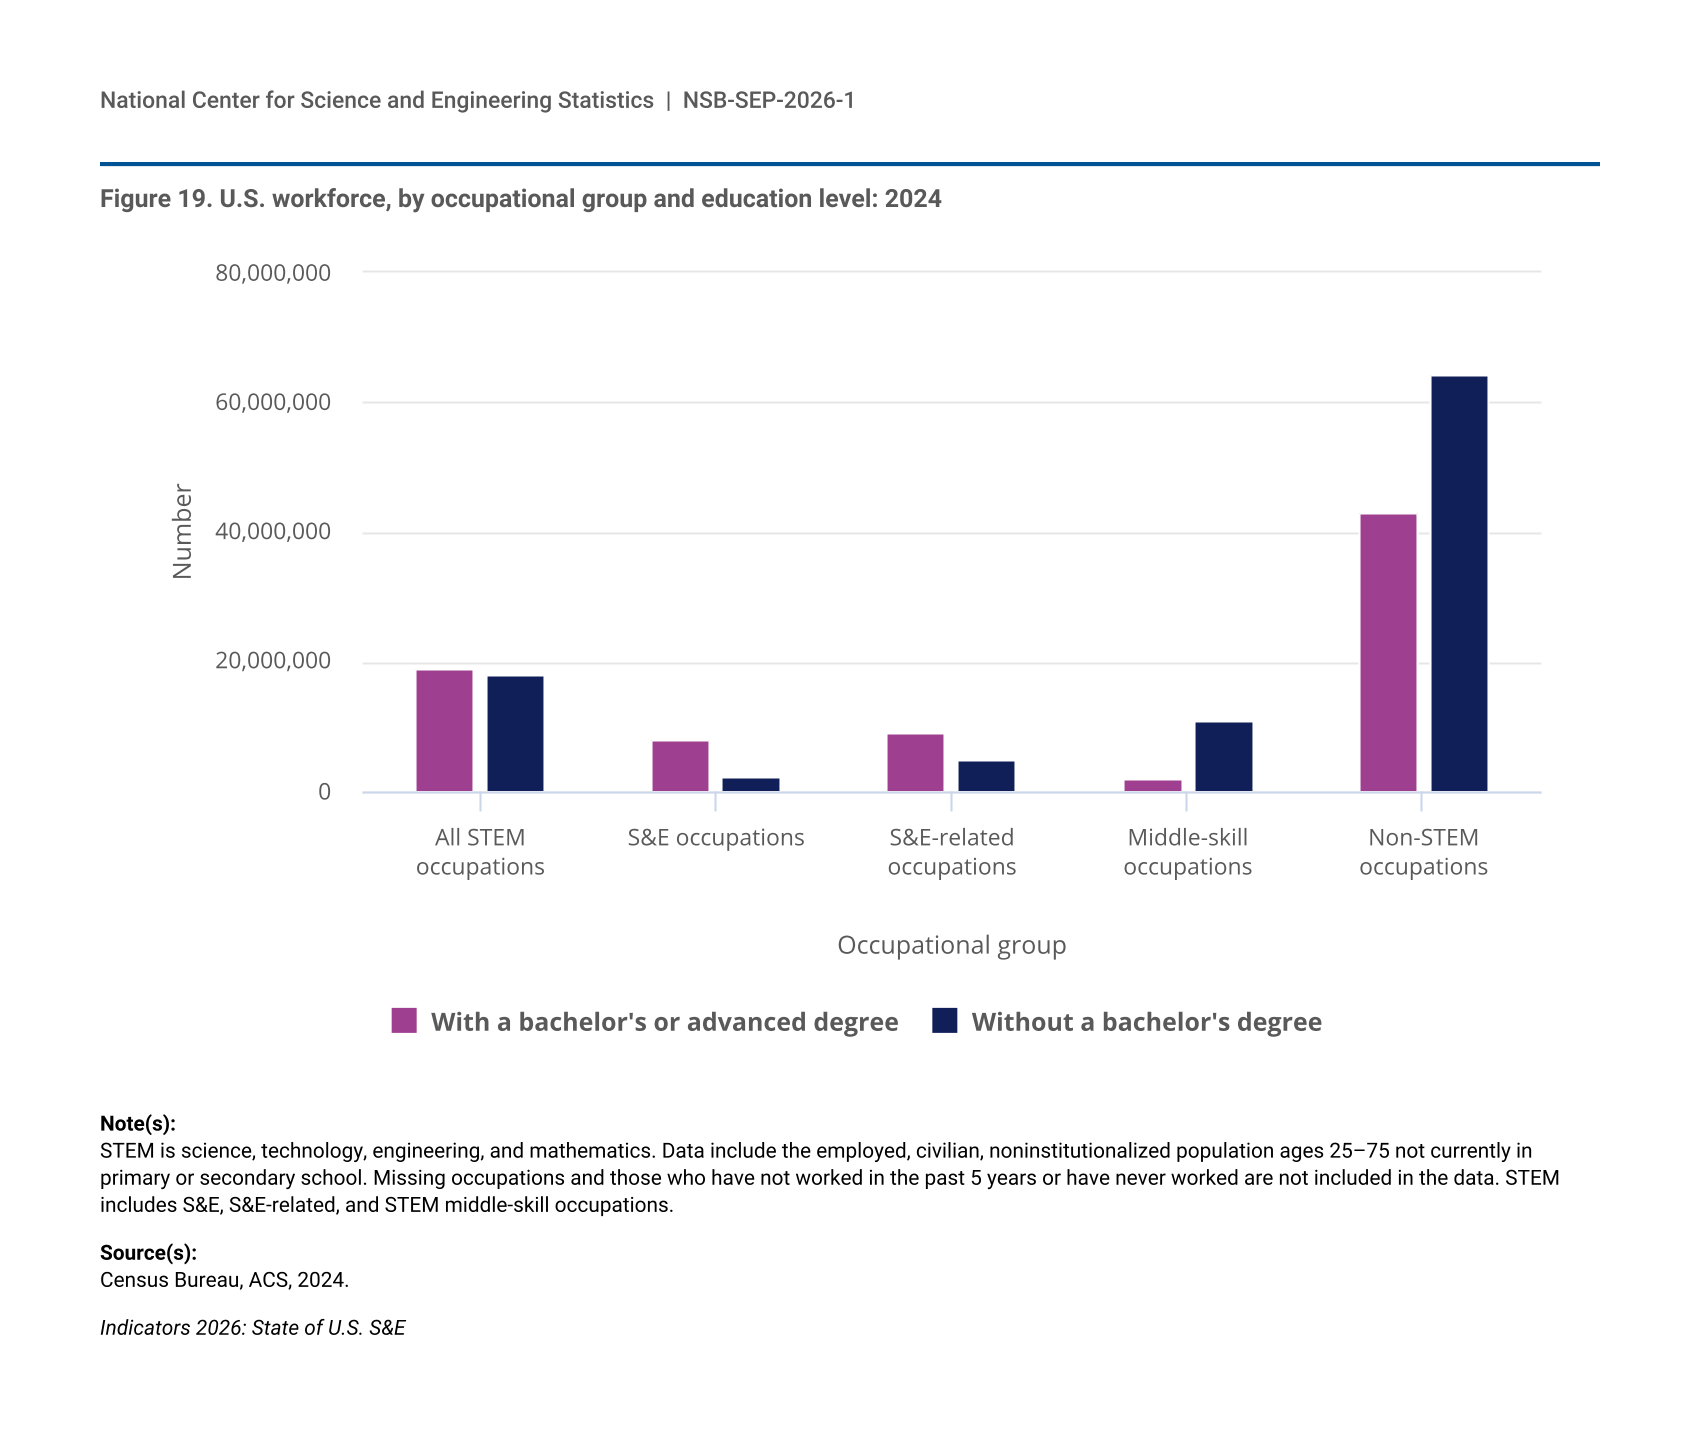
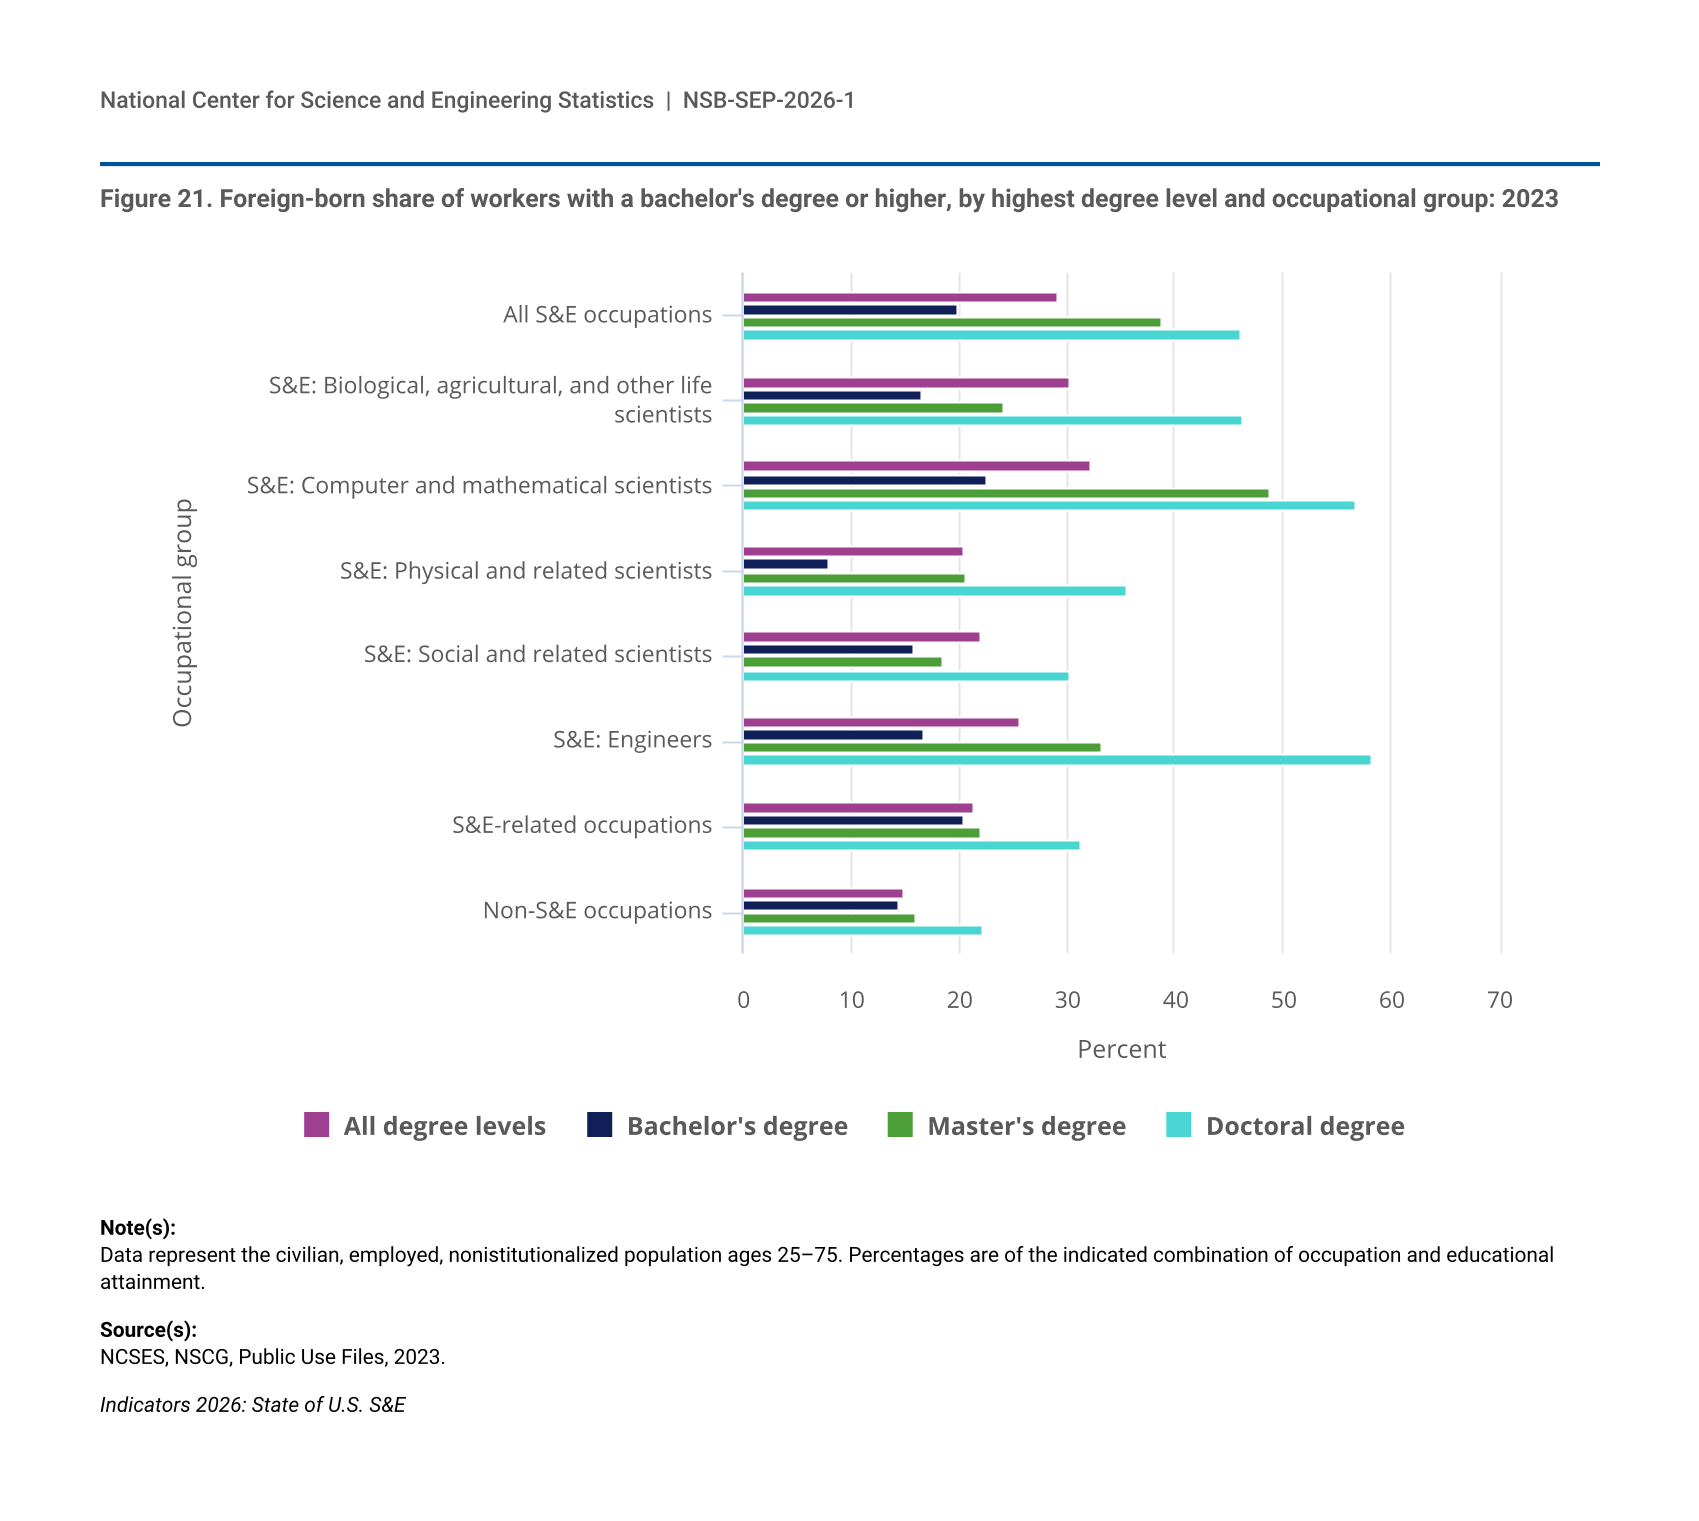
The STEM workforce is integral to the United States’ ability to meet persistent and emerging global challenges, including national security, health, economic development, and future research needs. It is sustained through the progression of individuals born in the United States as well as abroad and educated and trained at U.S. institutions, as well as individuals born abroad who enter directly into the domestic workforce. The 37 million STEM workers (Table 2) in the United States in 2024—representing 26% of all workers—have grown at nearly three times the rate of non-STEM workers since 2014, with foreign-born workers comprising 22% of this STEM workforce, over half (52%) of whom are naturalized U.S. citizens. While the overall STEM workforce in the United States has grown from 26 million workers in 2000 to 37 million in 2024 and has accounted for around a fifth to a quarter of the overall U.S. workforce during this period, its composition has changed (Figure 8). Workers employed in STEM middle-skill occupations declined from 12% to 9% of the total workforce between 2000 and 2024, while workers employed in S&E occupations grew from 4% to 7% and those employed in S&E-related occupations grew from 7% to 10% of the total workforce over the same period (see the “Glossary” section for definitions of S&E, S&E-related, and STEM middle-skill occupations).
STEM is science, technology, engineering, and mathematics. Please see https://ncses.nsf.gov/pubs/nsb20212/ for the expanded definition of STEM occupations; https://ncses.nsf.gov/pubs/nsb20212/table/SLBR-1 for the classification of STEM occupations; and https://ncses.nsf.gov/136/assets/0/files/ncses_workforcestatistics_onepager.pdf for an overview.
NSB, NSF, 2021, The STEM Labor Force of Today: Scientists, Engineers and Skilled Technical Workers, Science and Engineering Indicators 2022, NSB-2021-2, available at https://ncses.nsf.gov/pubs/nsb20212/; NCSES, 2022, Workforce Statistics, NCSES 2022-203, available at https://ncses.nsf.gov/136/assets/0/files/ncses_workforcestatistics_onepager.pdf.
Indicators 2026: State of U.S. S&E
| Year | STEM occupations | S&E occupations | S&E-related occupations | STEM middle-skill occupations |
|---|---|---|---|---|
| 2000 | 26,295,221 | 4,782,053 | 8,150,563 | 13,362,605 |
| 2009 | 27,597,243 | 5,369,883 | 9,746,164 | 12,481,196 |
| 2019 | 33,186,745 | 7,951,262 | 12,253,149 | 12,982,334 |
| 2024 | 36,819,236 | 10,096,704 | 13,763,270 | 12,959,262 |
| Year | STEM occupations | S&E occupations | S&E-related occupations | STEM middle-skill occupations |
|---|---|---|---|---|
| 2000 | 24.0 | 4.4 | 7.4 | 12.2 |
| 2009 | 22.7 | 4.4 | 8.0 | 10.3 |
| 2019 | 24.2 | 5.8 | 8.9 | 9.5 |
| 2024 | 25.6 | 7.0 | 9.6 | 9.0 |
STEM is science, technology, engineering, and mathematics. Data represent the civilian, employed, noninstitutionalized populations ages 25–75. They exclude those who are currently enrolled in primary or secondary school. STEM classifications are based on the Integrated Public Use Microdata Series (IPUMS) occupation variable harmonized to 2010 Standard Occupational Classification codes (OCC2010). Information on this harmonized variable can be found at https://usa.ipums.org/usa-action/variables/OCC2010#description_section. STEM groupings represent National Center for Science and Engineering Statistics work and may not align with STEM classifications used by other data users. Percentages are of all workers. Non-STEM occupations are not shown.
Ruggles S, Flood S, Sobek M, Backman D, Cooper G, Rivera Drew JA, Richards S, Rodgers R, Schroeder J, Williams KCW, 2025, IPUMS USA: Version 16.0 (Decennial 2000 1%, ACS 1-Year 2009, ACS 1-Year 2019, ACS 1-Year 2024), https://doi.org/10.18128/D010.V16.0.
Indicators 2026: State of U.S. S&E
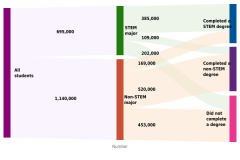
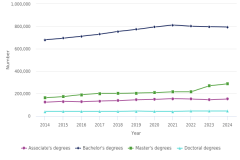
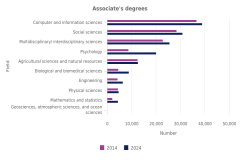
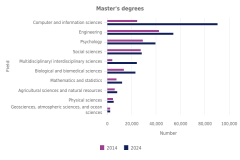
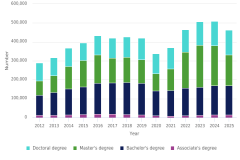
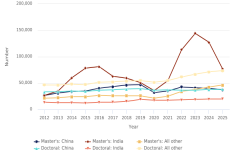
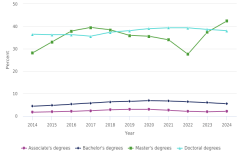
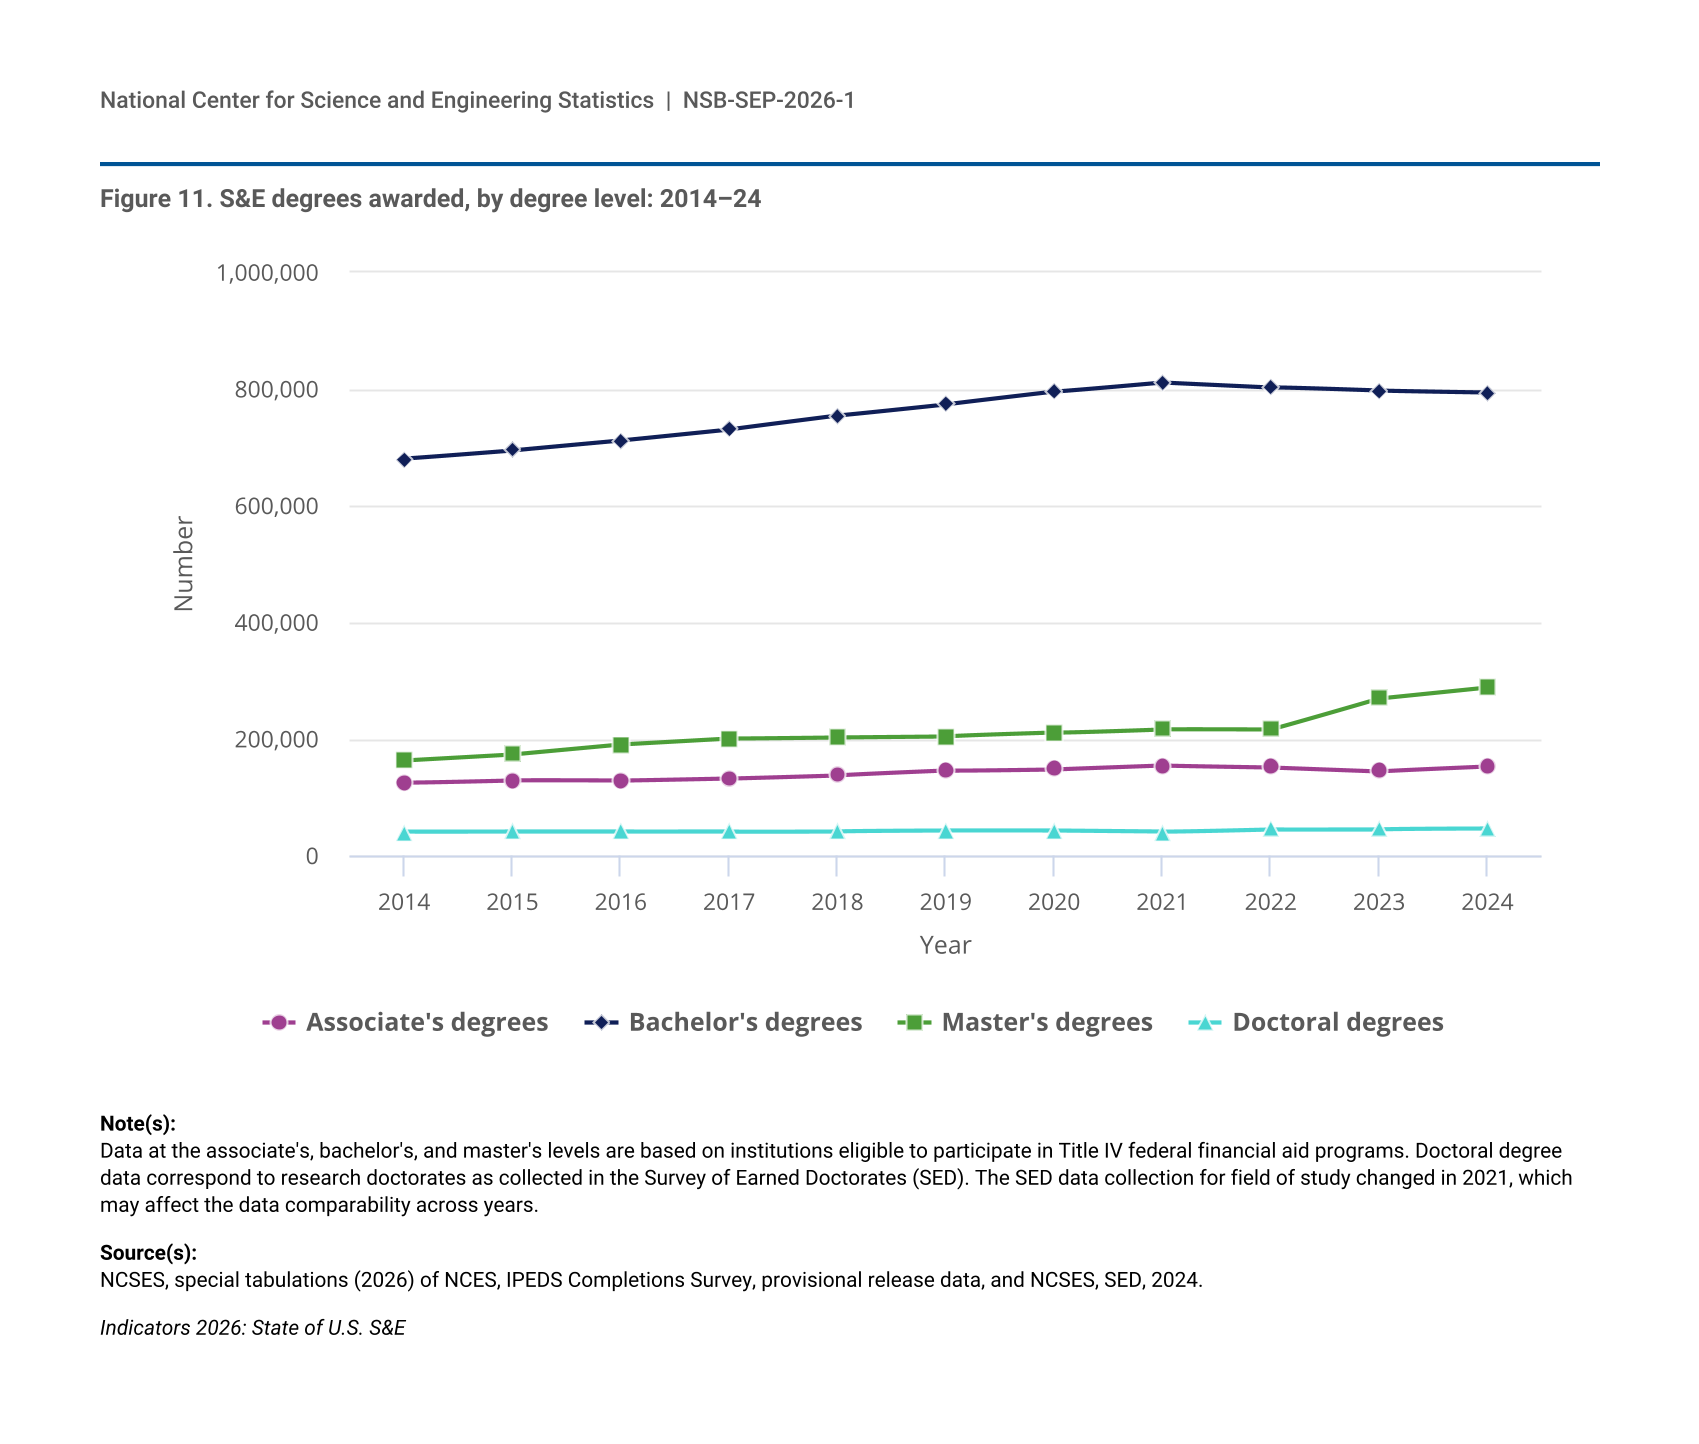
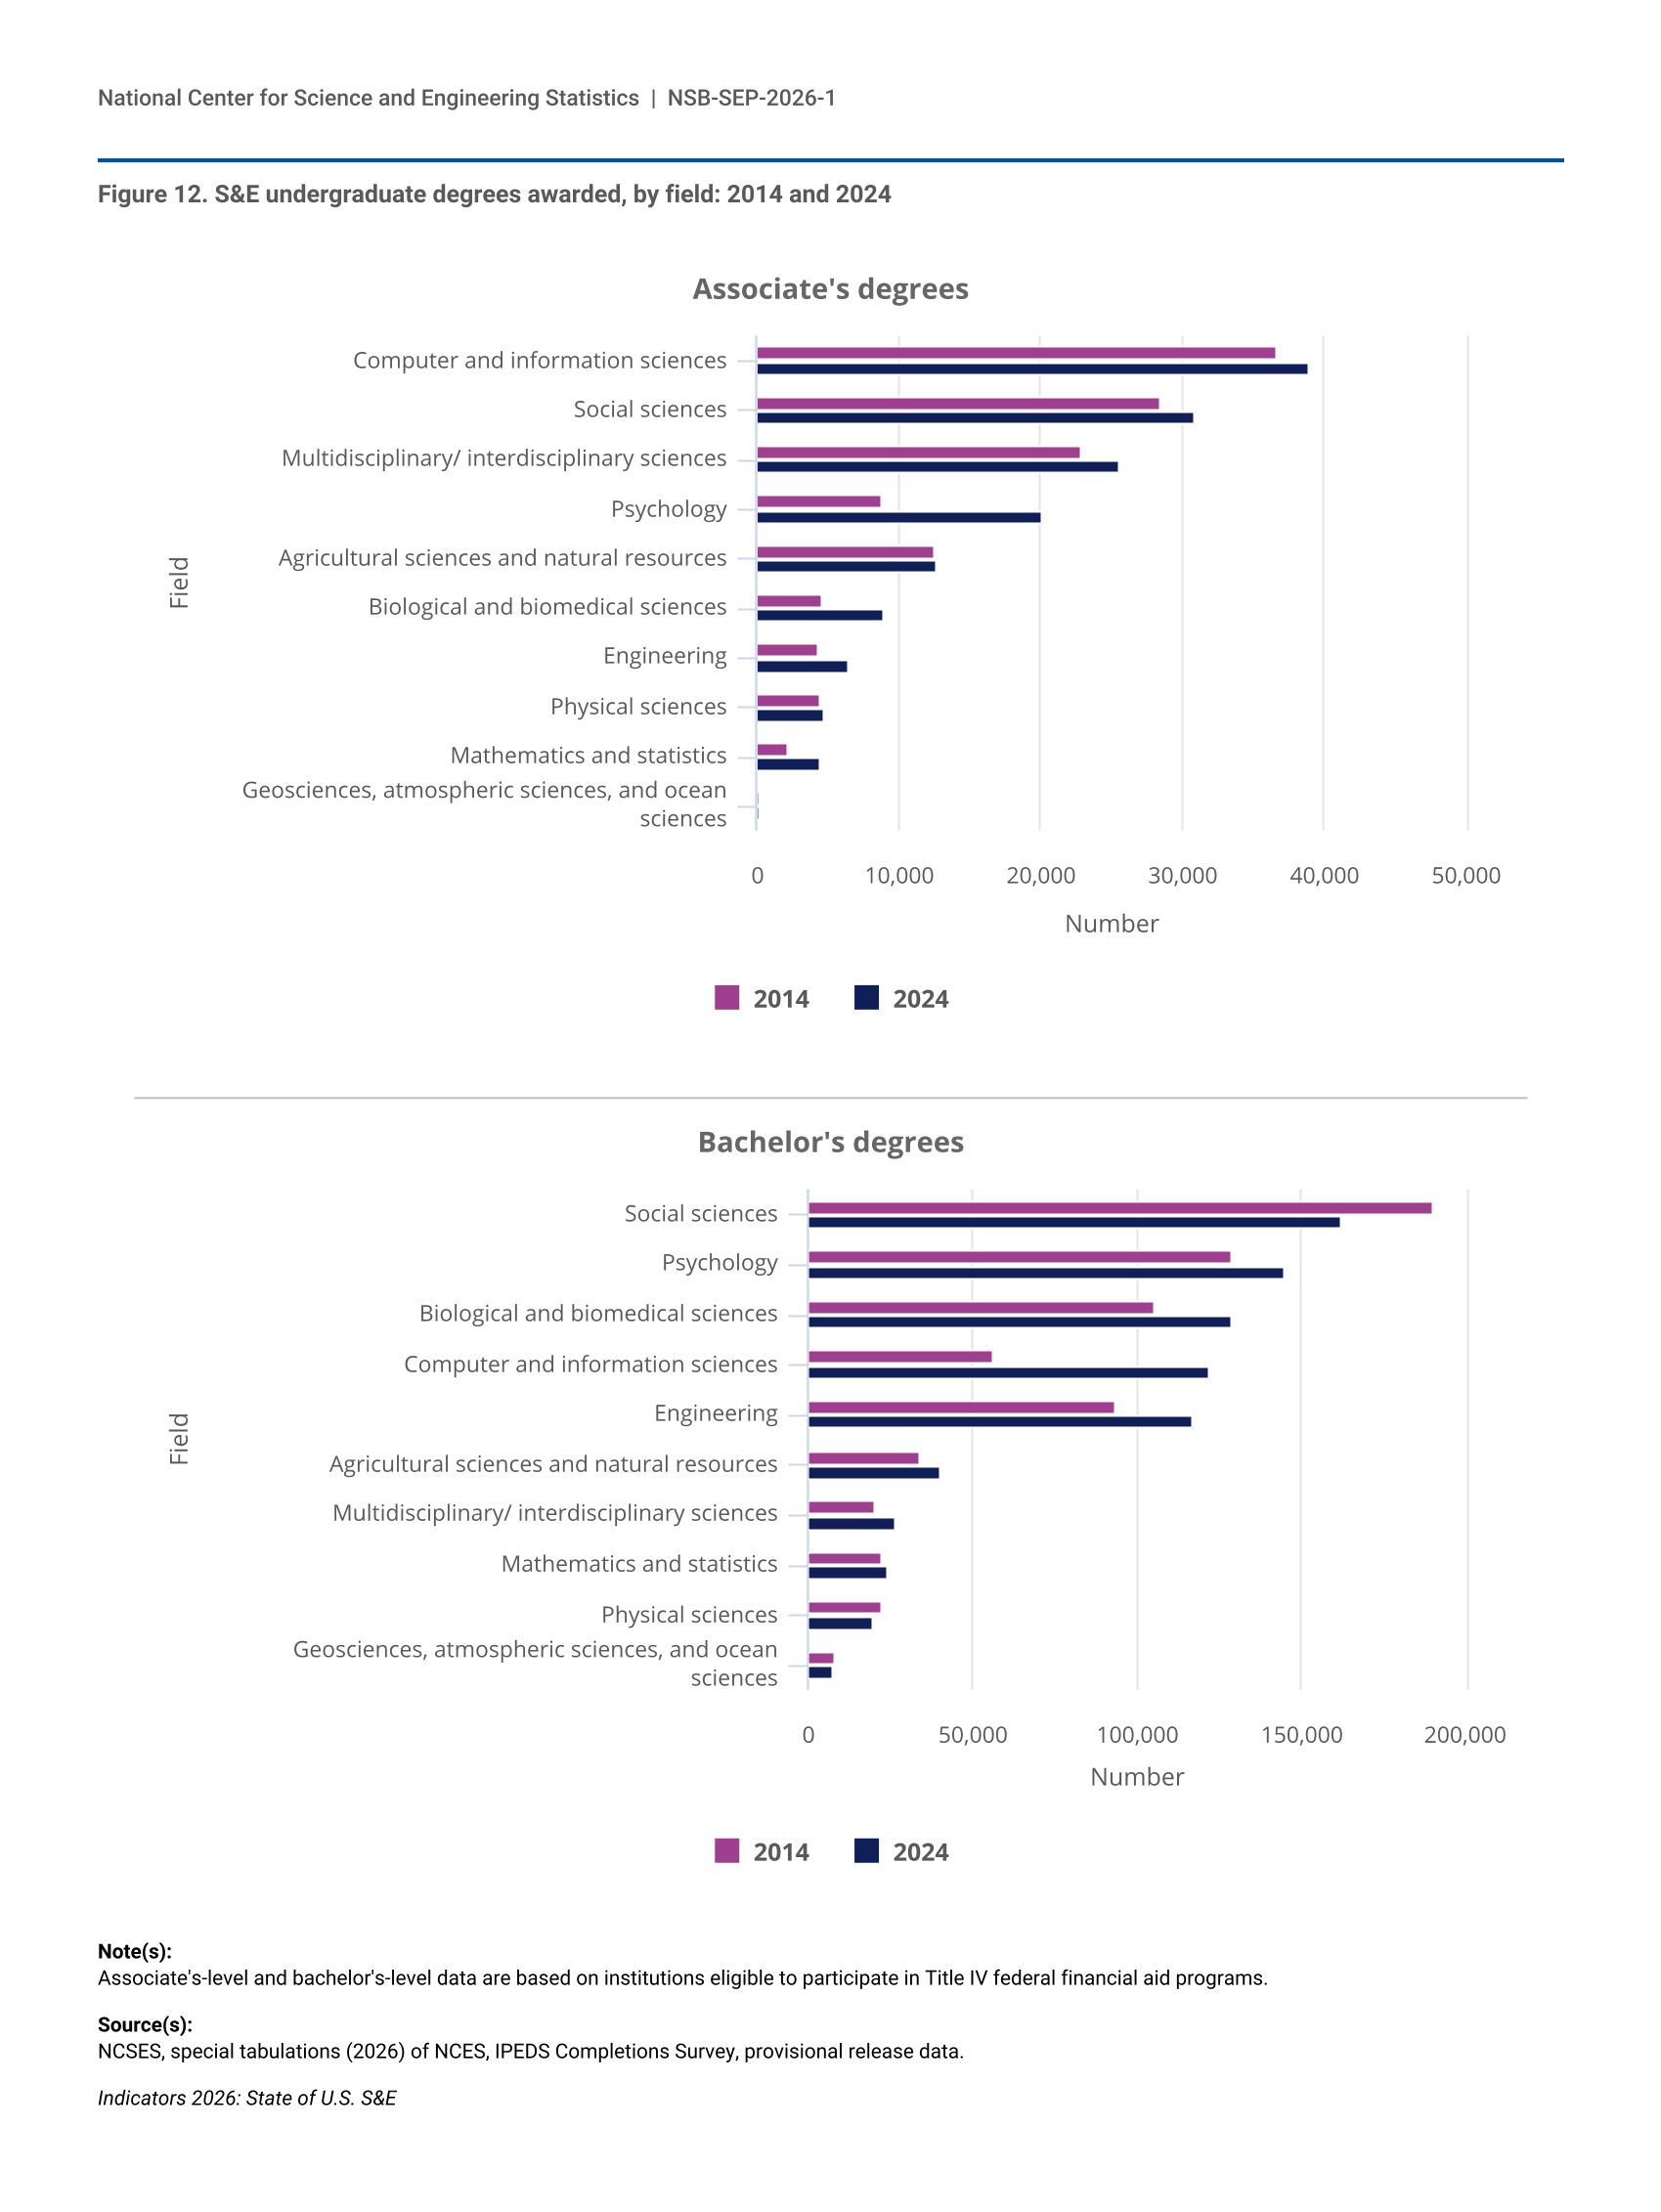
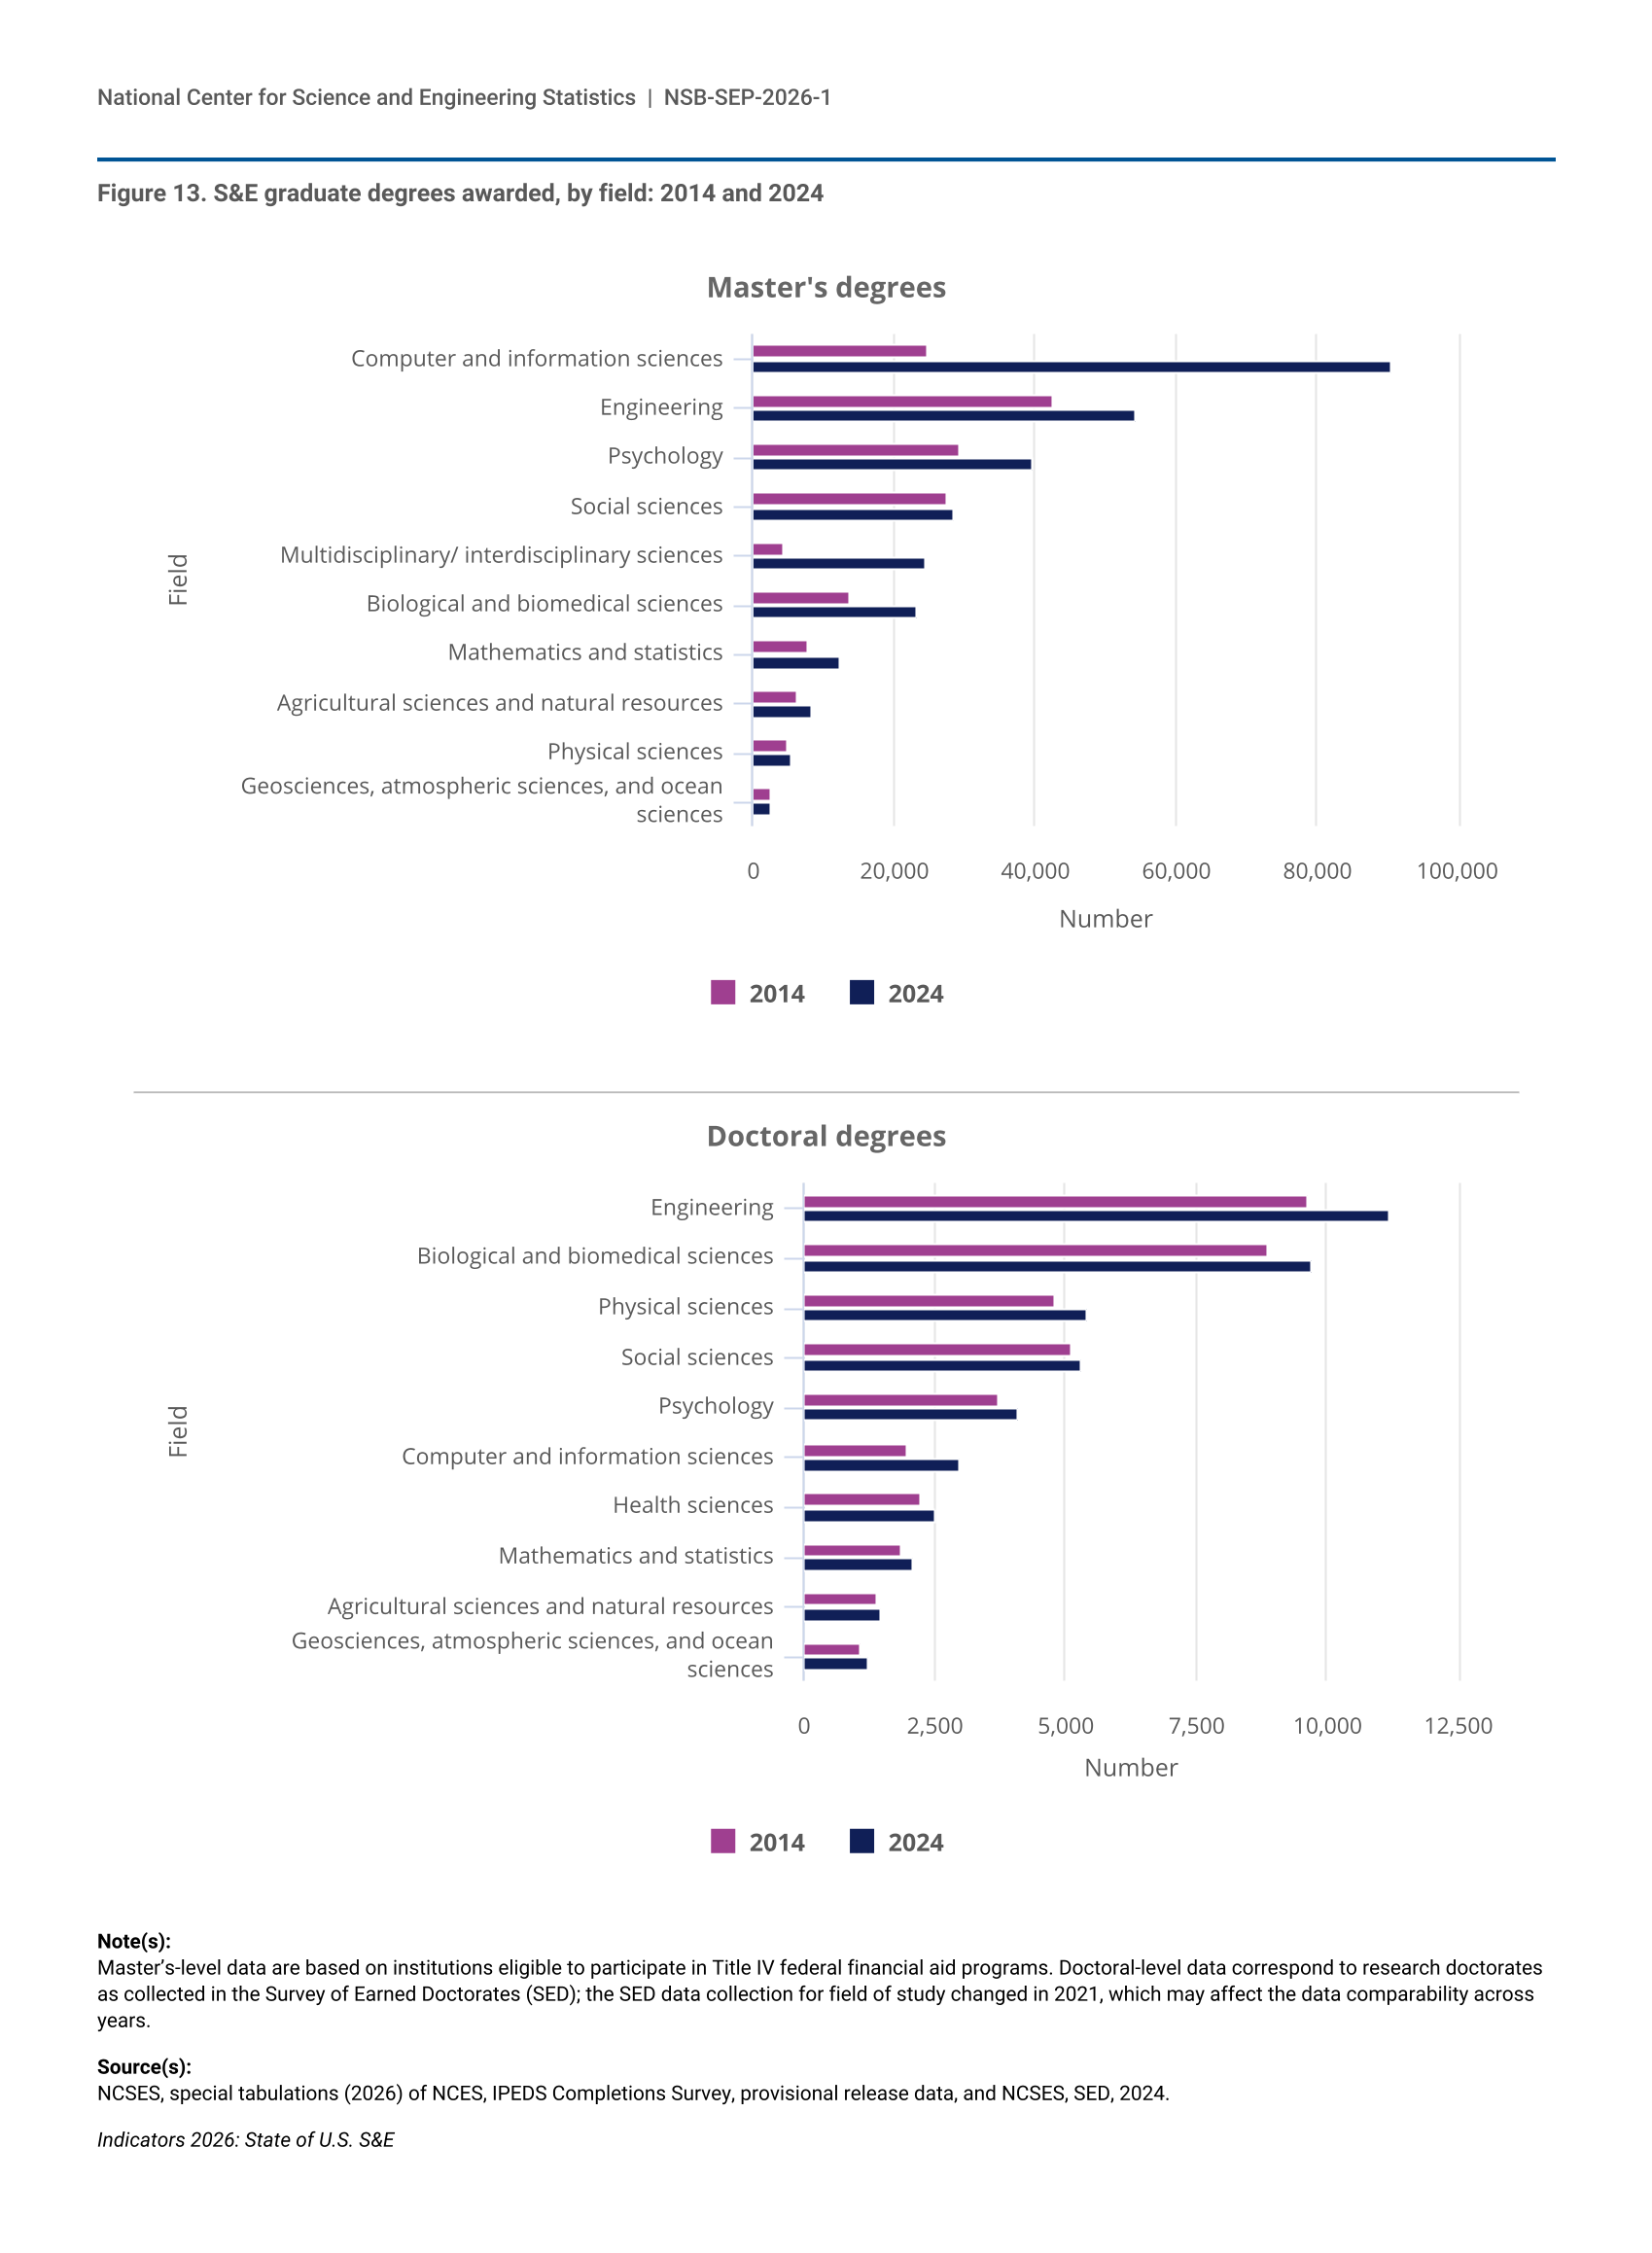
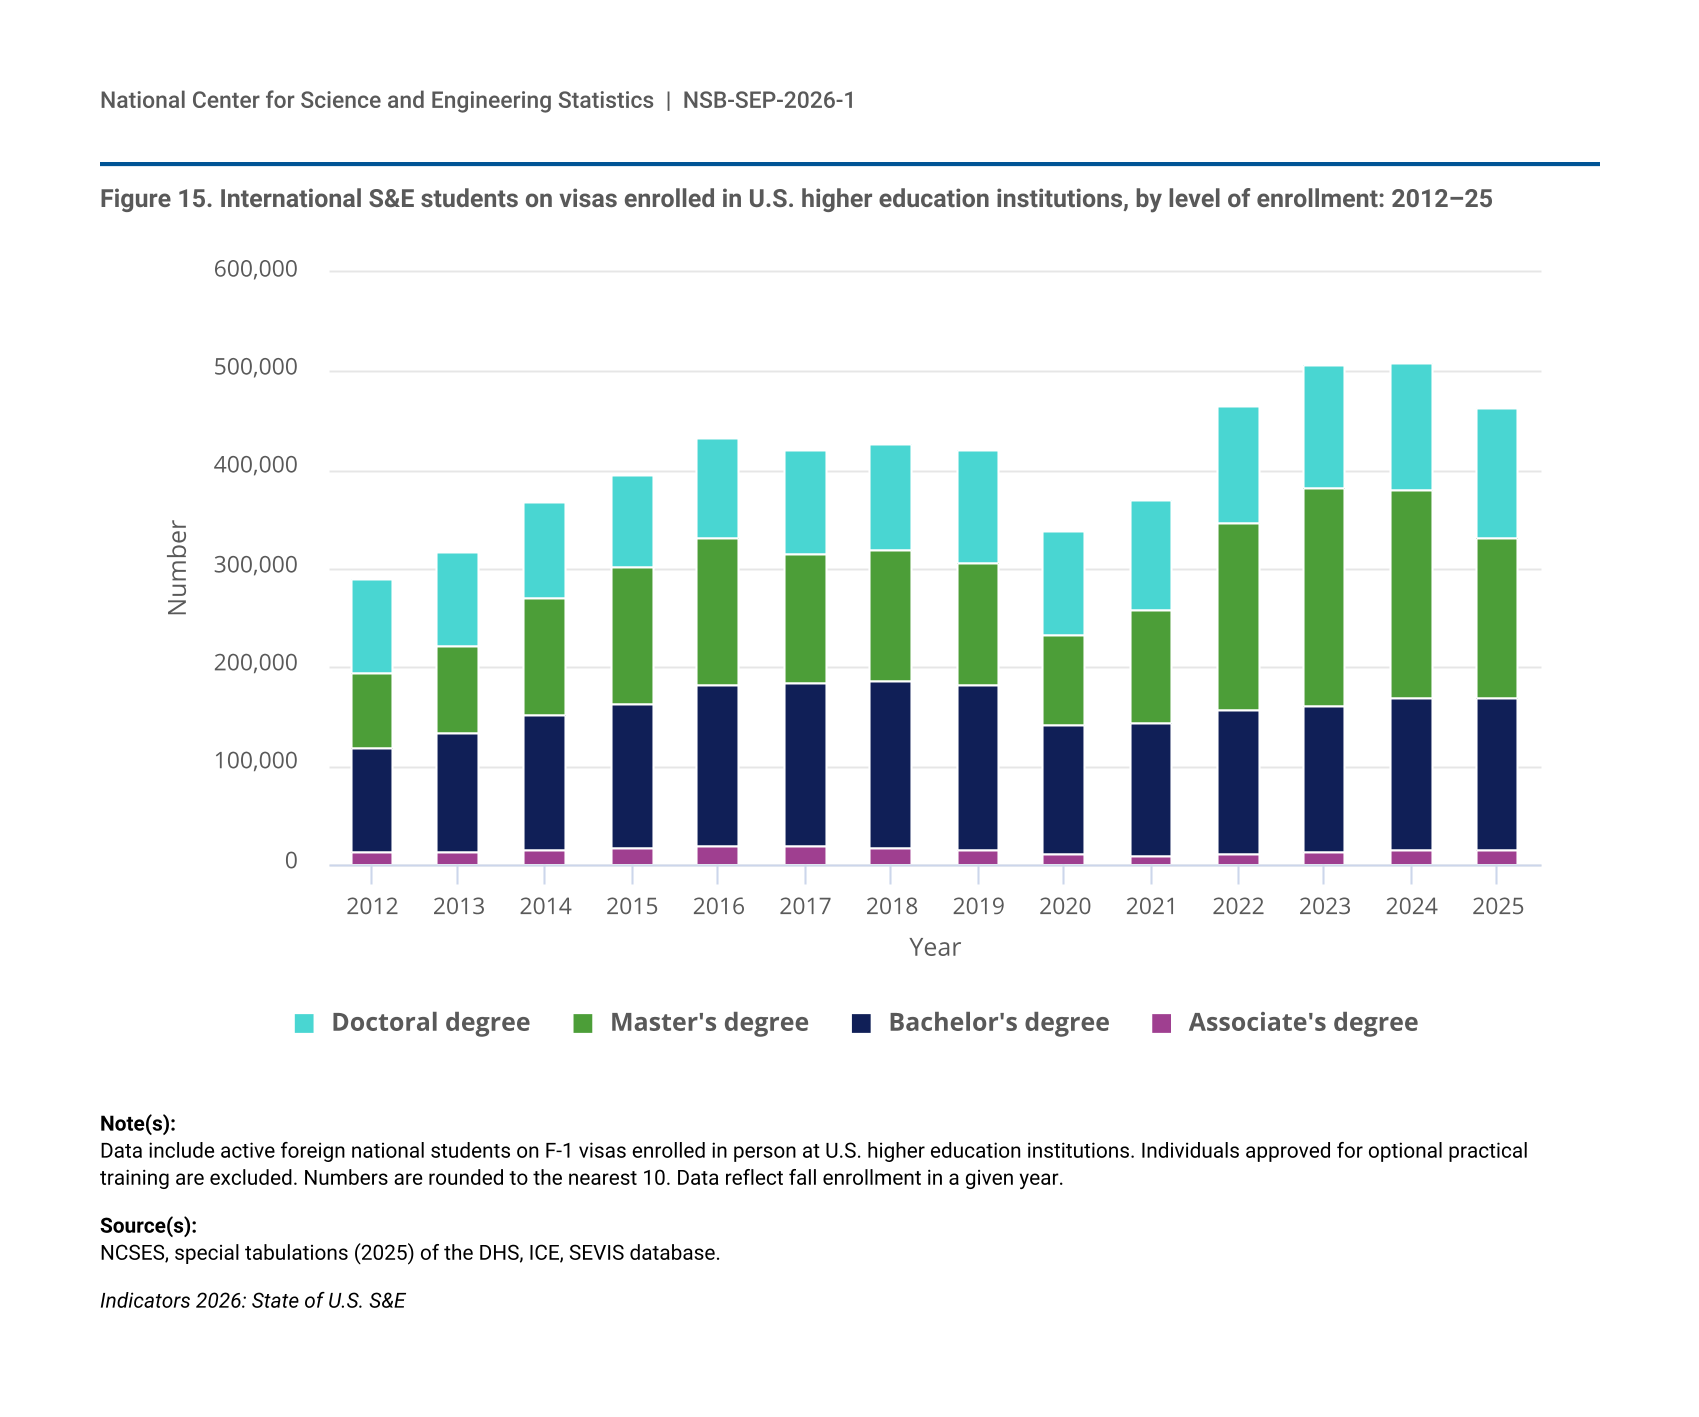
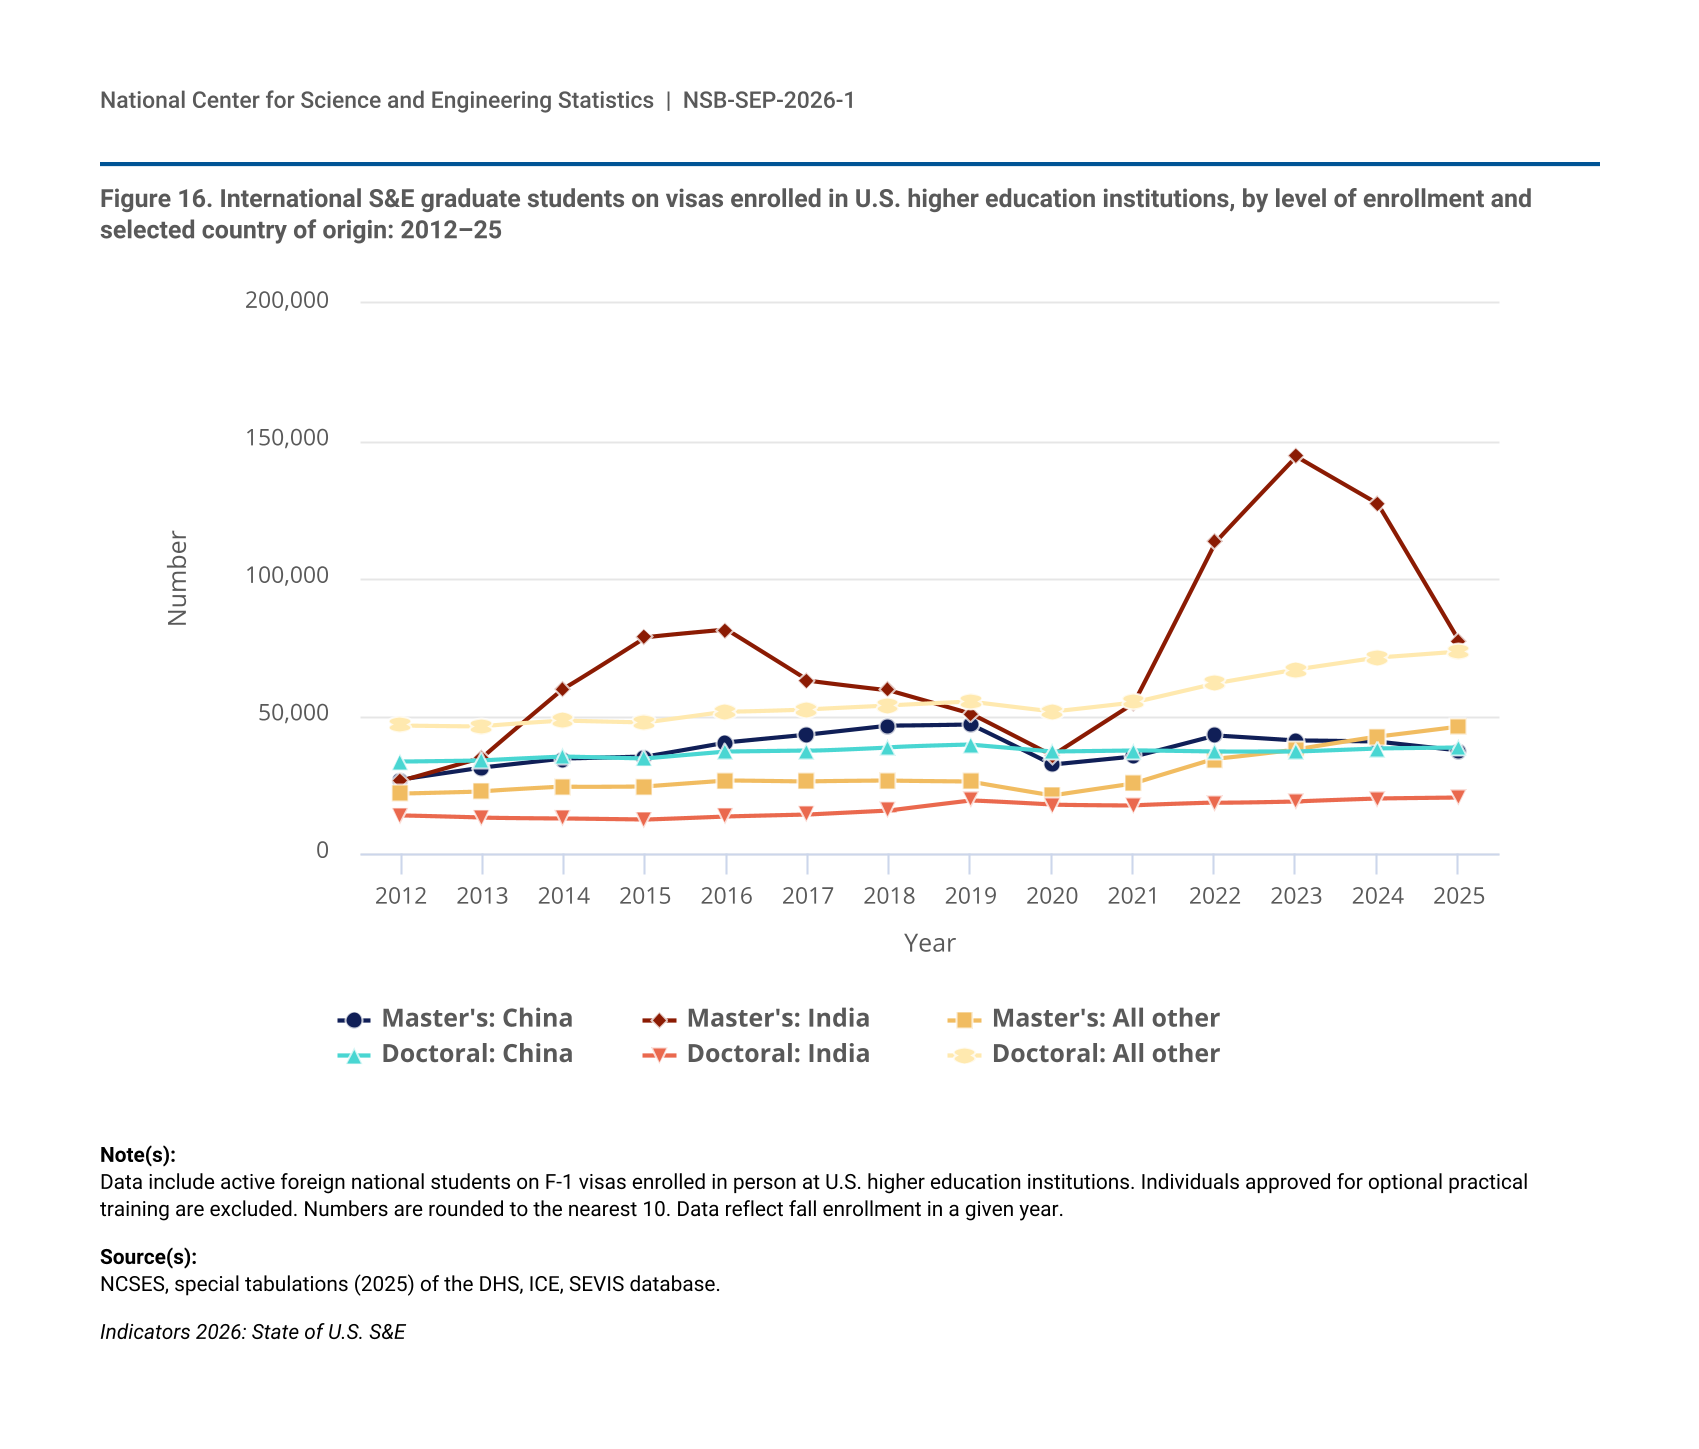
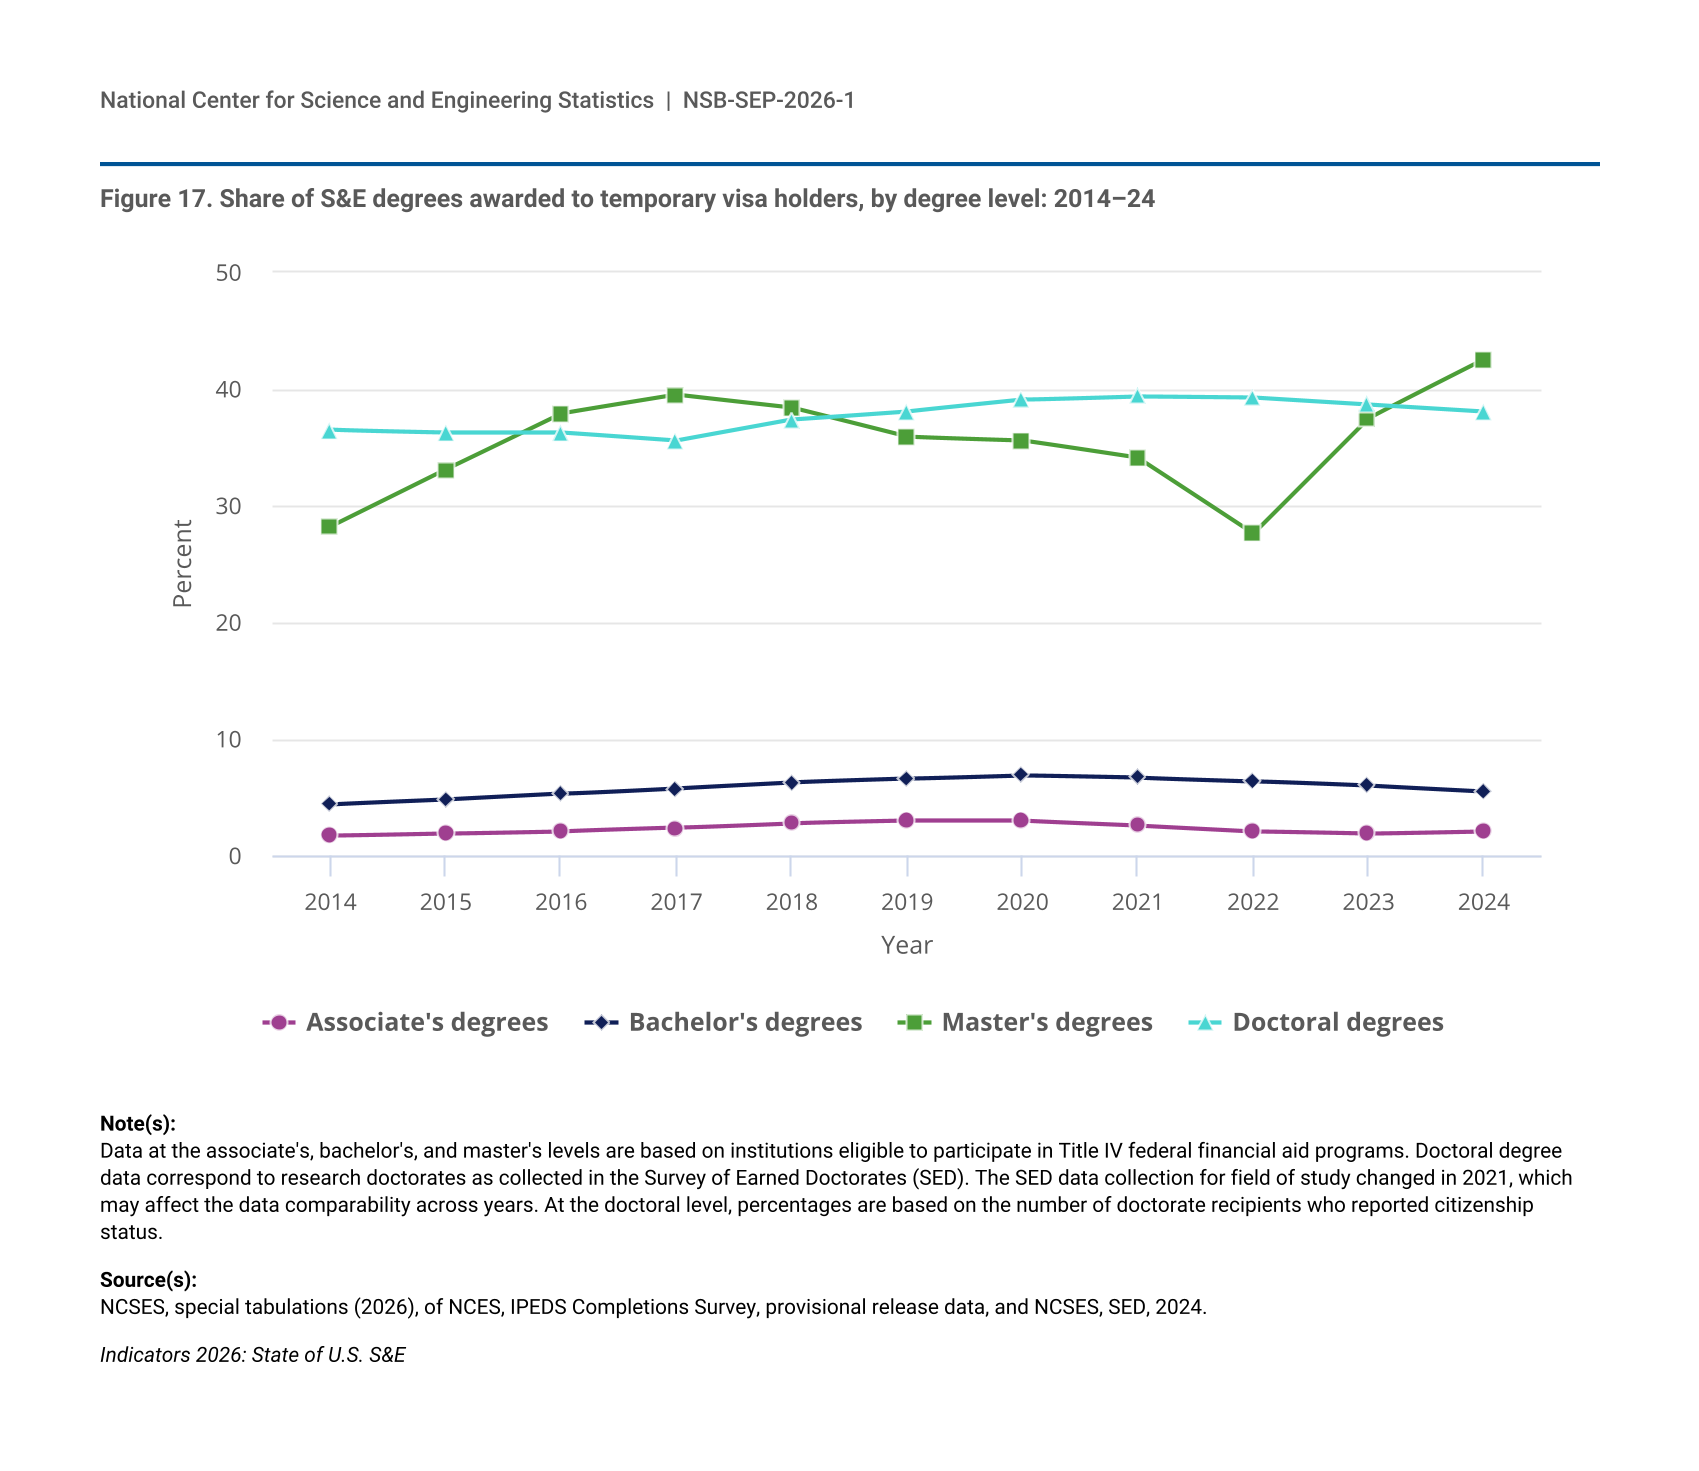
STEM employees enjoy an economic premium, with full-time, year-round workers (see “Glossary”) in STEM occupations receiving higher median annual earnings ($80,000) in 2024 than workers in non-STEM occupations ($60,000). Between 2014 and 2024, the number of S&E degrees awarded by U.S. institutions increased at all levels. At the associate’s, bachelor’s, and master’s degree levels, the growth in S&E degree completions during this period was higher than the growth in the college-age population, with computer and information sciences degrees at the bachelor’s and master’s levels exhibiting strong growth. The United States remained the most popular destination for internationally mobile postsecondary students in 2023, and temporary visa holders were highly represented among advanced degree awardees (master’s and doctoral levels) in technologically important fields—computer and information sciences, engineering, and mathematics and statistics.
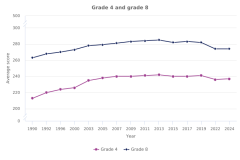
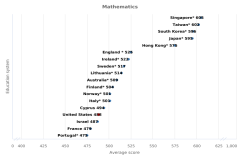
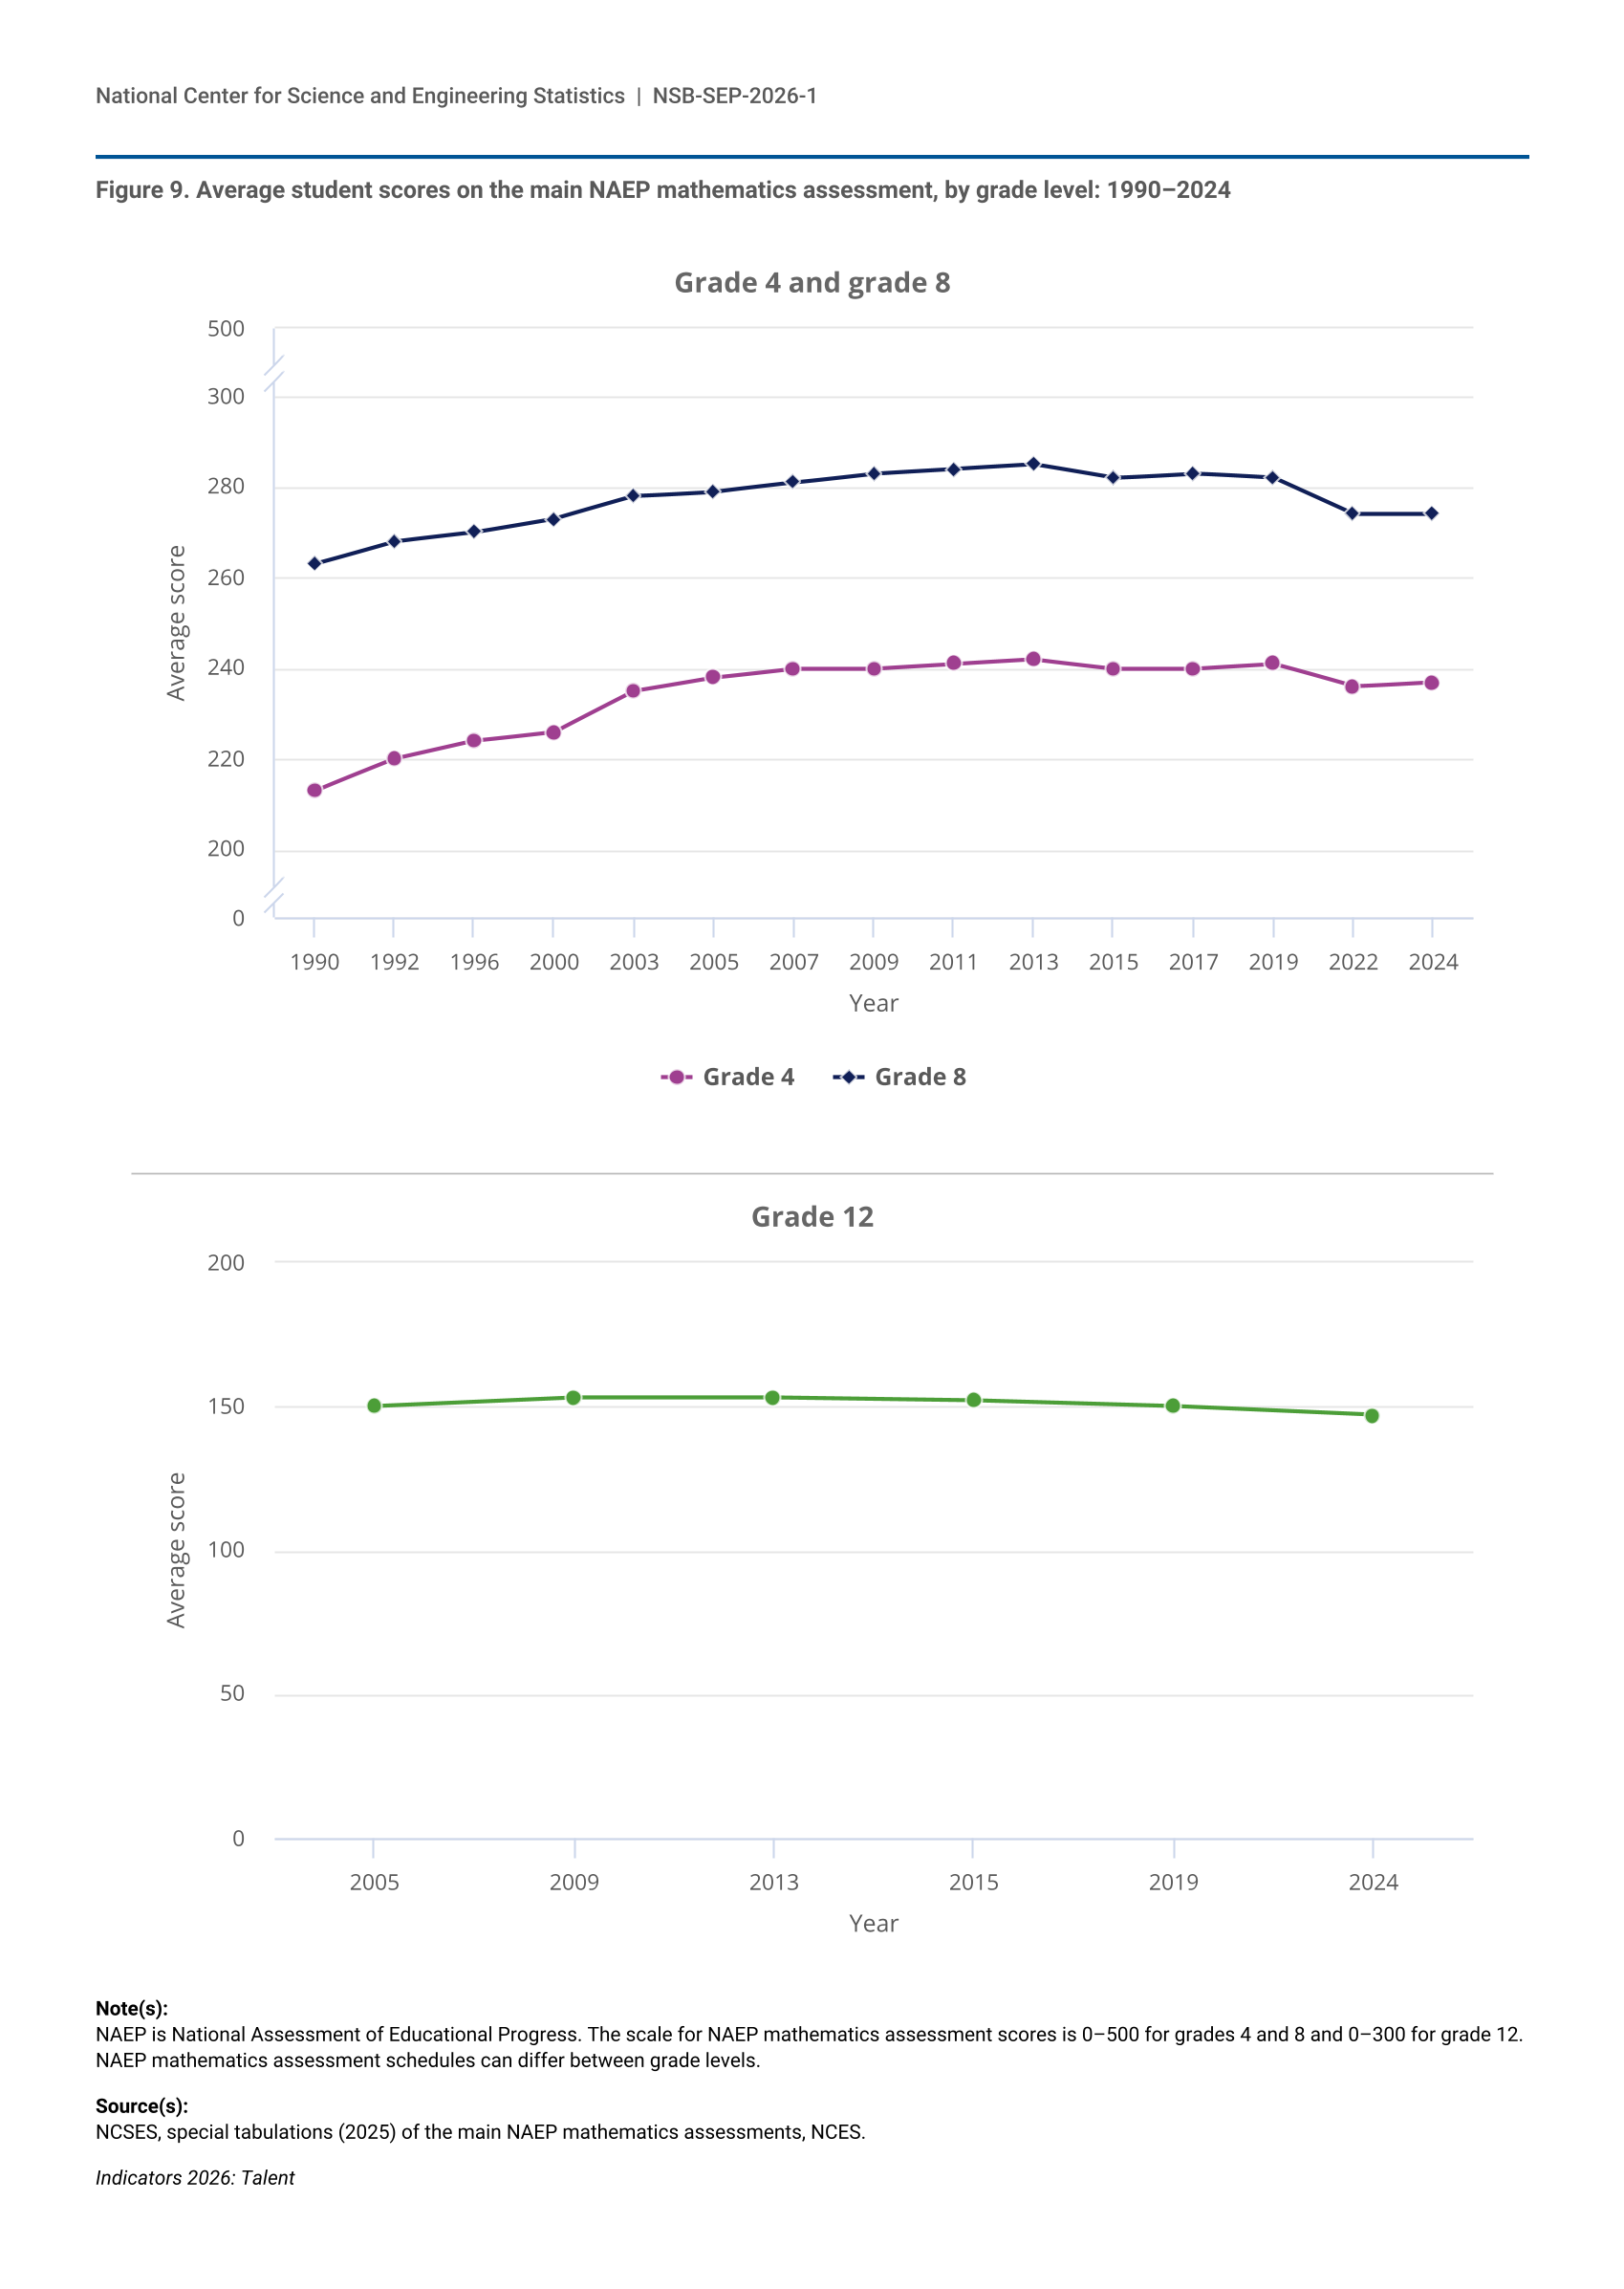
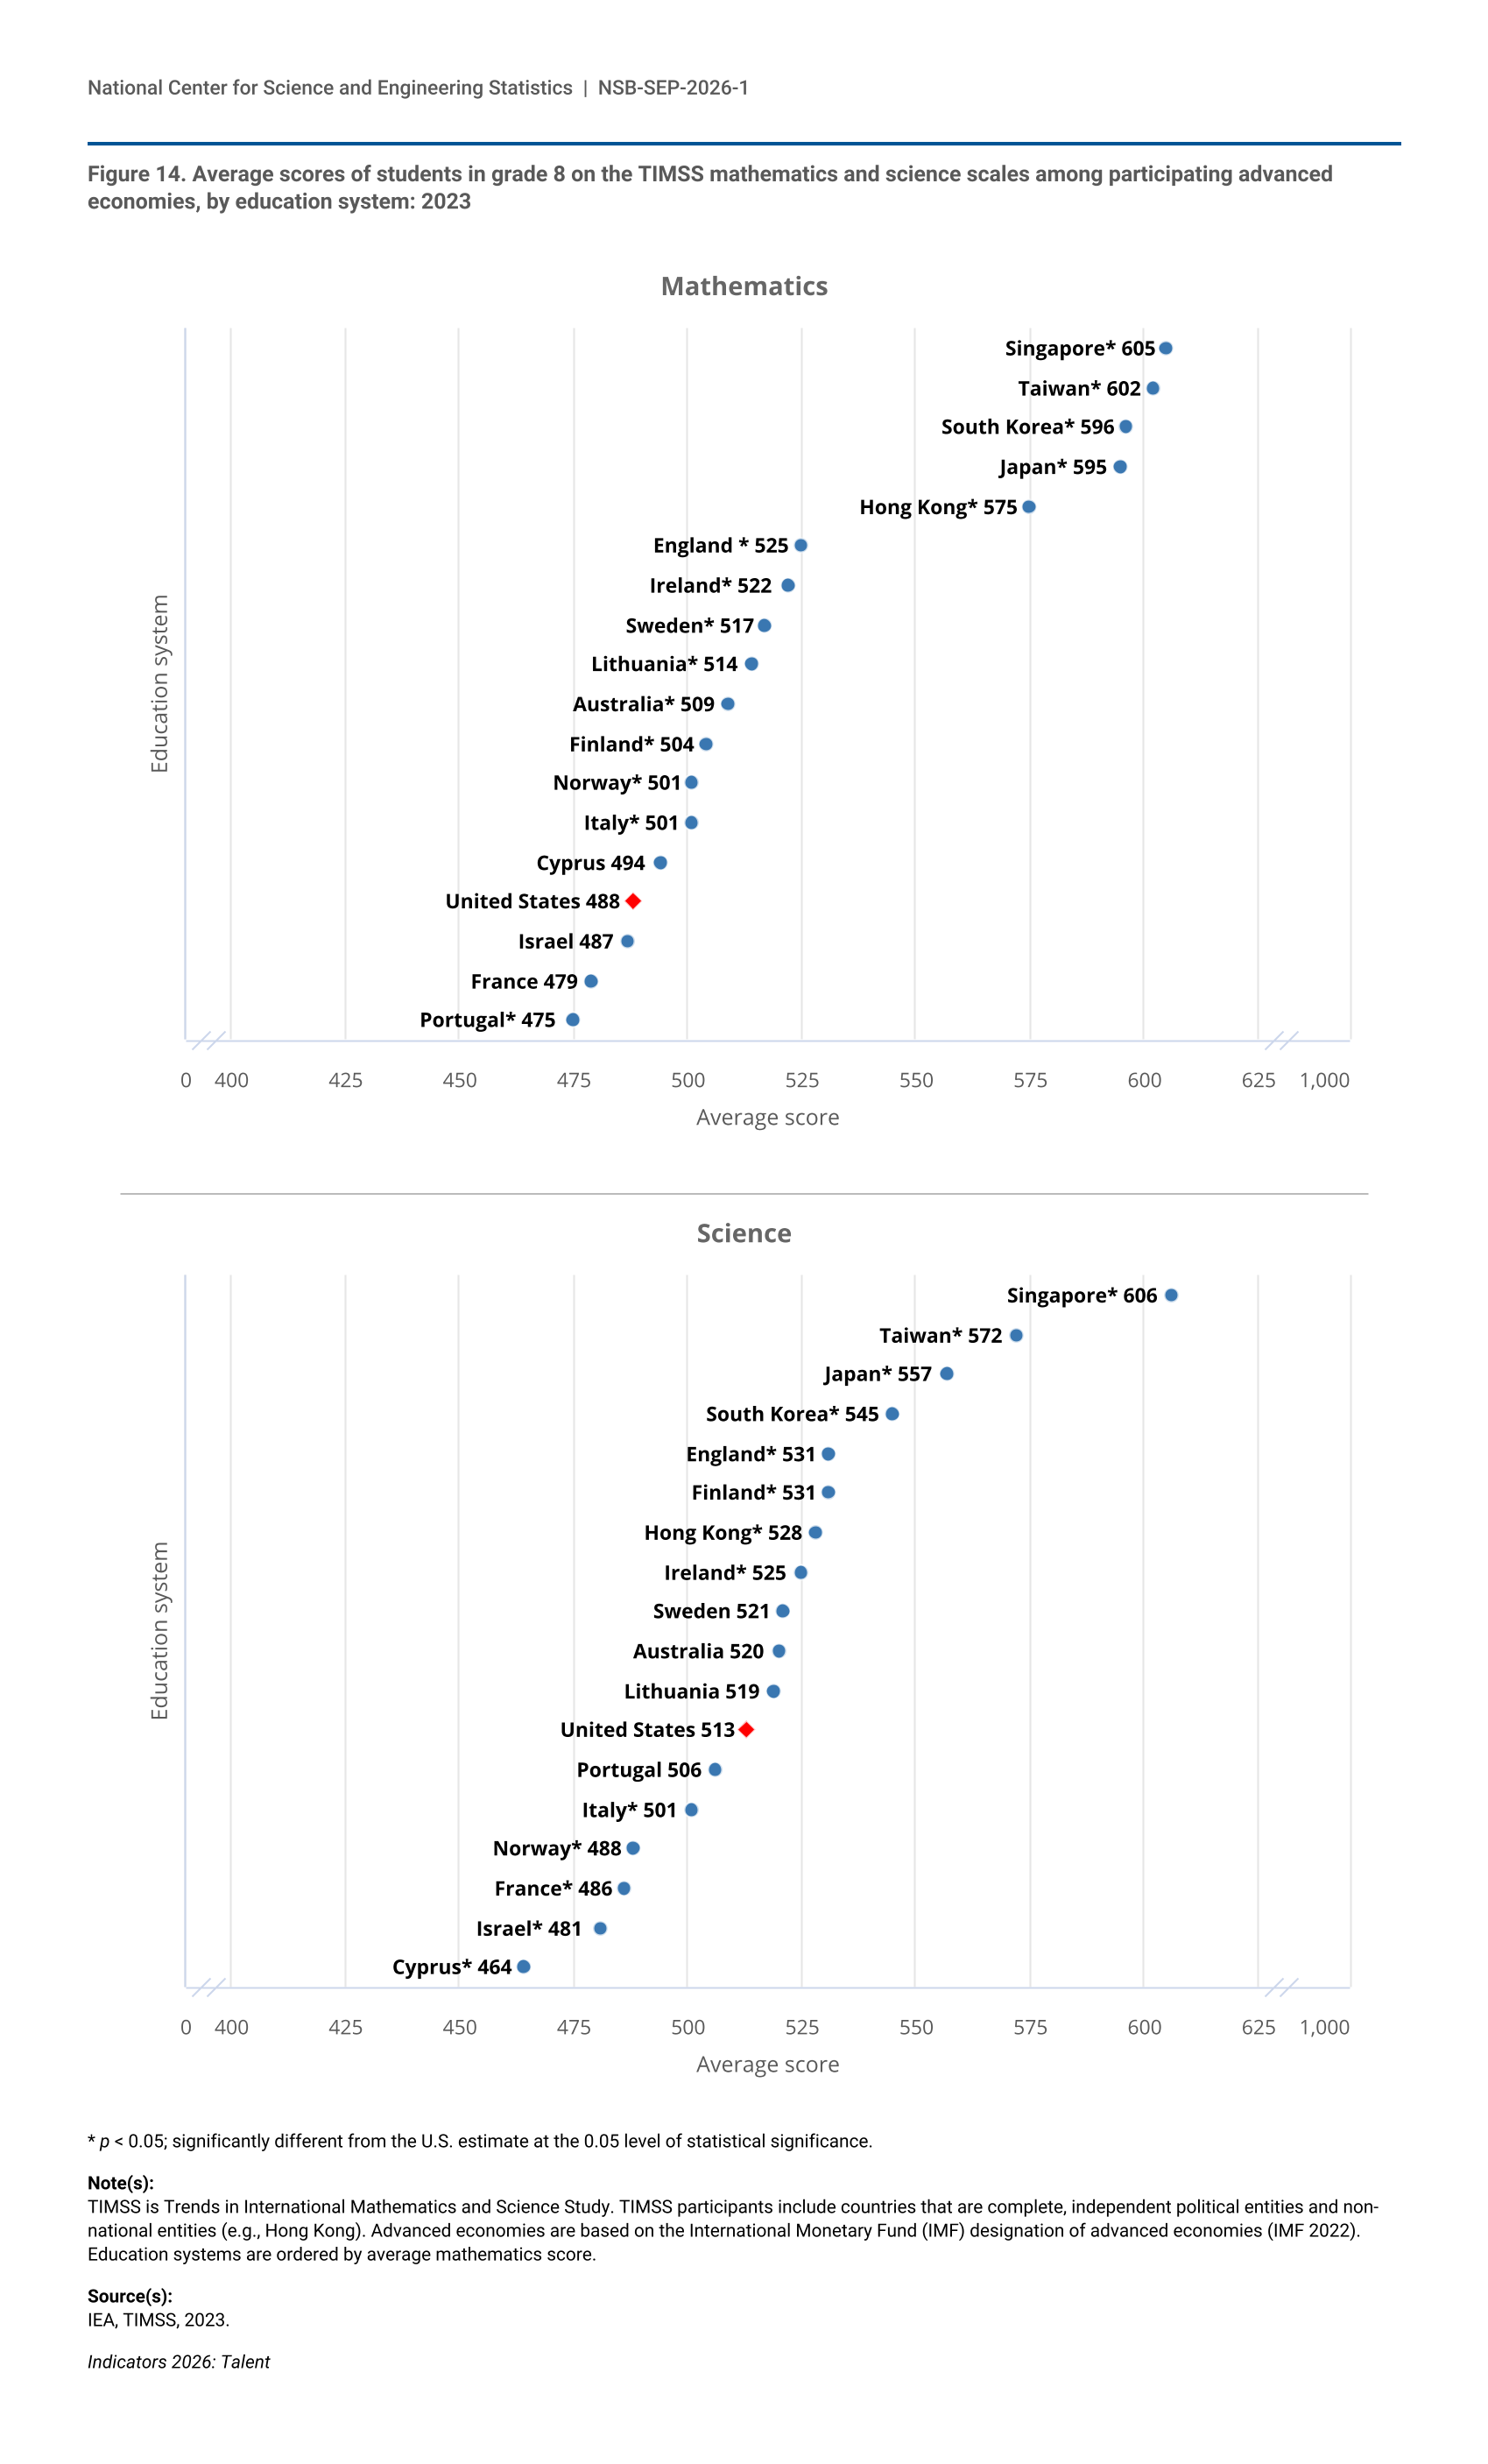
National and international elementary and secondary student assessments reveal limitations in the nation’s preparation of future STEM workers. Pandemic-related learning losses in mathematics remain unrecovered for all but the highest-performing students, while mathematics scores have dropped across all student groups (4th, 8th, and 12th grades) since pre-pandemic levels. U.S. eighth graders scored in the middle third among 18 advanced economies in science and in the bottom third in mathematics in 2023. Given that high school mathematics achievement is associated with STEM degree completion (NSB 2026a: Table TAL-14), these educational challenges may have implications for the nation’s future capacity to compete in an increasingly technology-driven global economy.
