 An official website of the United States government
 STEM Talent: Education, Training, and Workforce
Talent is the bedrock of the nation’s S&E enterprise and a key part of U.S. competitiveness. The STEM workforce is integral to the United States’ ability to meet persistent and emerging global challenges, including national security, health, economic development, and future research challenges. A globally competitive STEM education system equips Americans with the skills and knowledge needed to participate in the STEM workforce. Indicators of the performance of the domestic S&E enterprise—from STEM education and training to employment and attrition—highlight challenges.
Elementary and Secondary STEM Education
Mathematics and Science Achievement
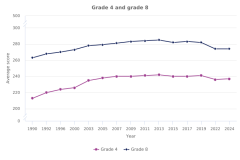
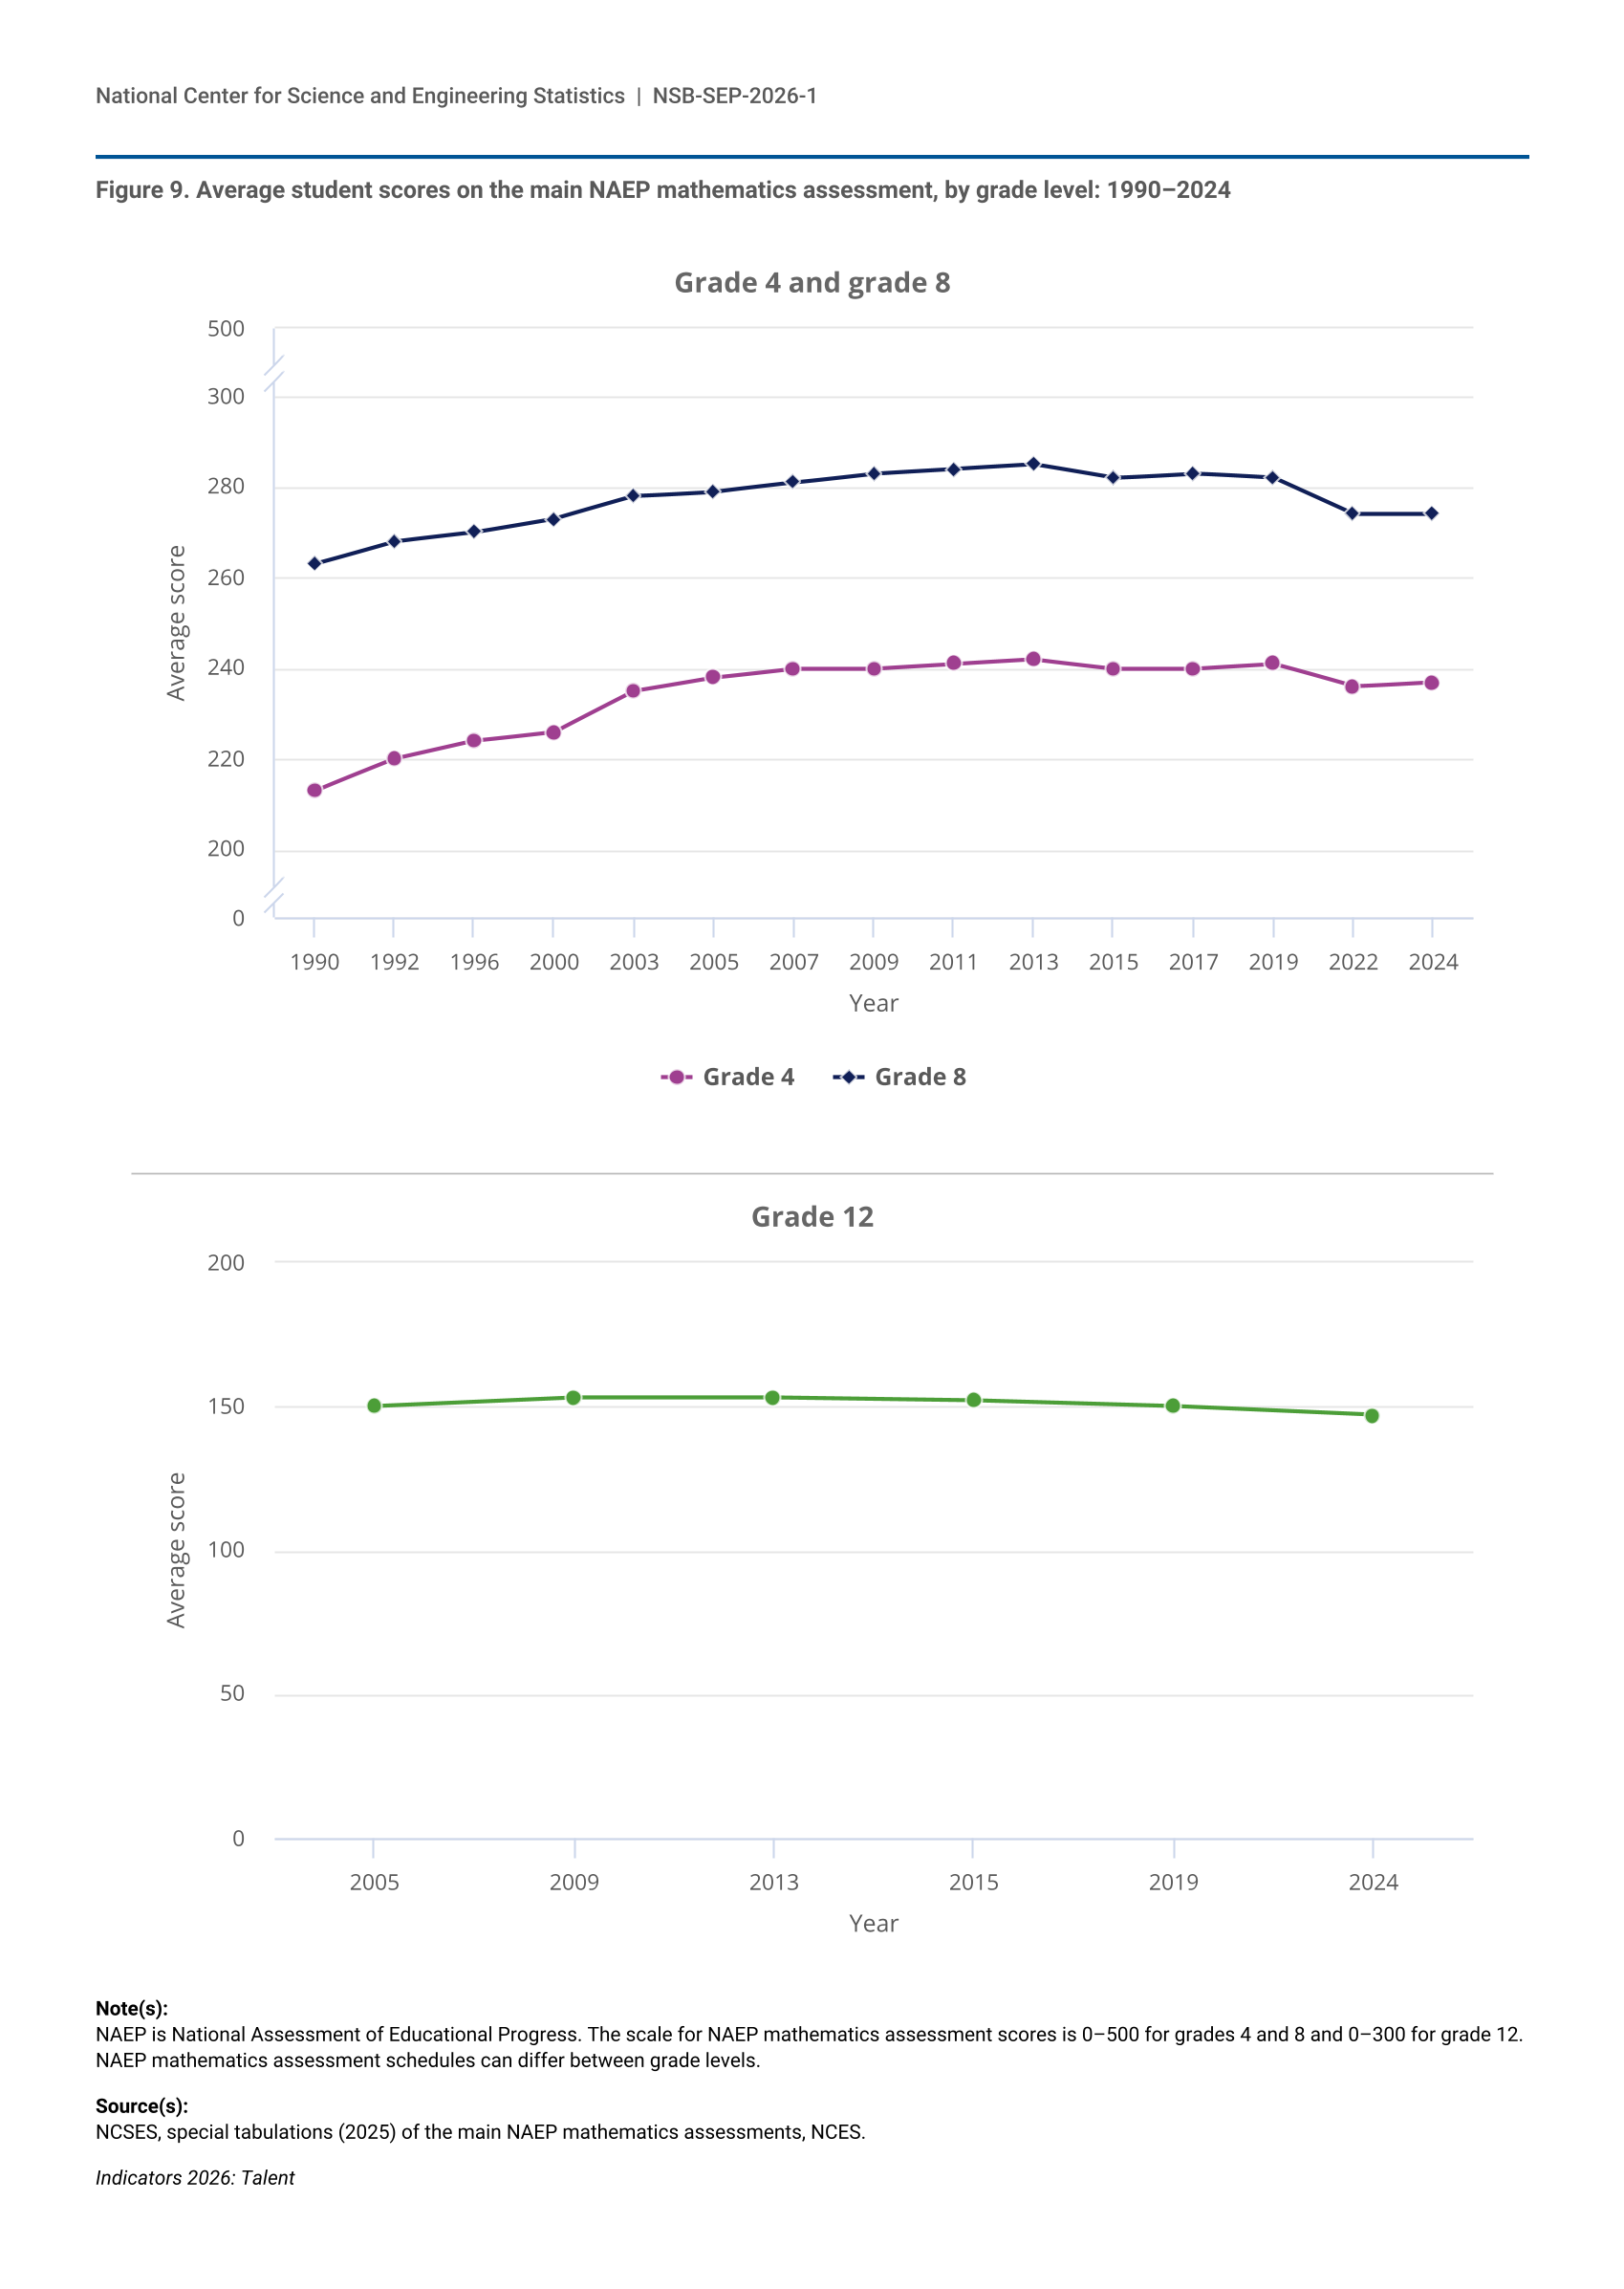
The results of the 2024 National Assessment of Educational Progress (NAEP) show overall significant declines in mathematics and science performance among U.S. elementary and secondary students since the COVID-19 pandemic. Average student scores on the main NAEP mathematics assessment for grades 4, 8, and 12 all declined significantly from 2019 to 2024 (Figure 9). The 2024 data indicate a slight recovery in average mathematics performance among 4th graders when compared with the scores from 2022 and no recovery among 8th graders when compared with the scores from 2022 and the pre-pandemic benchmark of 2019. The average student score in 2024 on the grade 12 mathematics assessment—which is administered less frequently and uses a different score scale—declined to its lowest level among all assessments under the current mathematics framework, which was first administered in 2005.
| Year | Grade 4 | Grade 8 |
|---|---|---|
| 1990 | 213 | 263 |
| 1992 | 220 | 268 |
| 1996 | 224 | 270 |
| 2000 | 226 | 273 |
| 2003 | 235 | 278 |
| 2005 | 238 | 279 |
| 2007 | 240 | 281 |
| 2009 | 240 | 283 |
| 2011 | 241 | 284 |
| 2013 | 242 | 285 |
| 2015 | 240 | 282 |
| 2017 | 240 | 283 |
| 2019 | 241 | 282 |
| 2022 | 236 | 274 |
| 2024 | 237 | 274 |
| Year | Grade 12 |
|---|---|
| 2005 | 150 |
| 2009 | 153 |
| 2013 | 153 |
| 2015 | 152 |
| 2019 | 150 |
| 2024 | 147 |
NAEP is National Assessment of Educational Progress. The scale for NAEP mathematics assessment scores is 0–500 for grades 4 and 8 and 0–300 for grade 12. NAEP mathematics assessment schedules can differ between grade levels.
NCSES, special tabulations (2025) of the main NAEP mathematics assessments, NCES.
Trends in mathematics performance have differed for lower- and higher-performing students since the pandemic. Fourth- and 8th-grade student NAEP mathematics scores at the 10th and 25th percentiles in 2024 showed either a decline or no change from 2022, whereas scores at the 75th and 90th percentiles at both grade levels increased from 2022 to 2024. These results suggest some learning recovery for higher-performing students but no recovery for lower-performing students. For the grade 12 mathematics assessment, in addition to a decrease in the average score, scores at the 10th, 25th, and 75th percentiles each declined from 2019 to 2024. However, the score for high-performing students (90th percentile) held steady from 2019 to 2024.
The NAEP science assessment results show a significant decline in student performance from 2019 to 2024, the first assessment year since the pandemic. From 2019 to 2024, the average science score for 8th-grade students dropped to its level first observed in 2009, the initial assessment year under the current science framework (Table 3). Science scores declined across lower- and higher-performing students, as measured by the decrease in the 10th, 25th, 50th, 75th, and 90th percentile scores from 2019 to 2024.
NAEP is National Assessment of Educational Progress. The scale for NAEP science assessment scores is 0–300.
NCES, NAEP, various years, 2009–24 science assessments.
Indicators 2026: State of U.S. S&E
Average student performance on the 2024 NAEP mathematics assessments differed by a variety of student and school factors. Male students scored higher than female students on the 4th-, 8th-, and 12th-grade mathematics assessments, as did high socioeconomic status (SES) students compared with low SES students. Asian and White students posted the highest scores at all three grade levels. Students with more-experienced teachers scored higher than students with less-experienced teachers at both the 4th- and 8th-grade levels, as did students taught by teachers with traditional certifications rather than teachers with alternative certifications. Fourth- and 8th-grade students in suburban and rural areas scored higher than students in those grades in towns and urban areas. Average student performance on the 2024 NAEP science assessment showed similar patterns by student factors to the mathematics assessment. Male students scored higher than female students, high SES students scored higher than low SES students, and Asian and White students posted the highest scores.
STEM Course Access and Enrollment
Access to STEM courses in elementary and secondary education may be a factor in a student’s future higher education or employment decisions, as these courses are often prerequisites for further education in STEM fields or training for STEM occupations. During the 2020–21 school year, more than 80% of U.S. public high schools offered algebra I, algebra II, geometry, and biology; 75% offered chemistry; 67% offered advanced mathematics; 61% offered physics; 49% offered computer science; and 48% offered calculus. Access to these courses varied by student and school characteristics. At the student level, 69% of Asian students, 55% of White students, 51% of Hispanic students, and 47% of Black students attended high schools that offered a full range of mathematics, science, and computer science courses.
Public high school student enrollment in advanced STEM courses included approximately 2.9 million students in at least one Advanced Placement (AP) course in mathematics, science, or computer science. Student enrollment in AP STEM courses differed by race and ethnicity. For example, Asian students made up 5% of total high school student enrollment but accounted for 17% of students enrolled in AP science and AP mathematics courses. Black students made up 15% of enrollment but accounted for 8% of students enrolled in AP science and 6% of students enrolled in AP mathematics courses.
STEM Higher Education in the United States
Persistence and Attrition in STEM Education
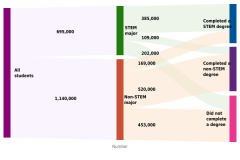
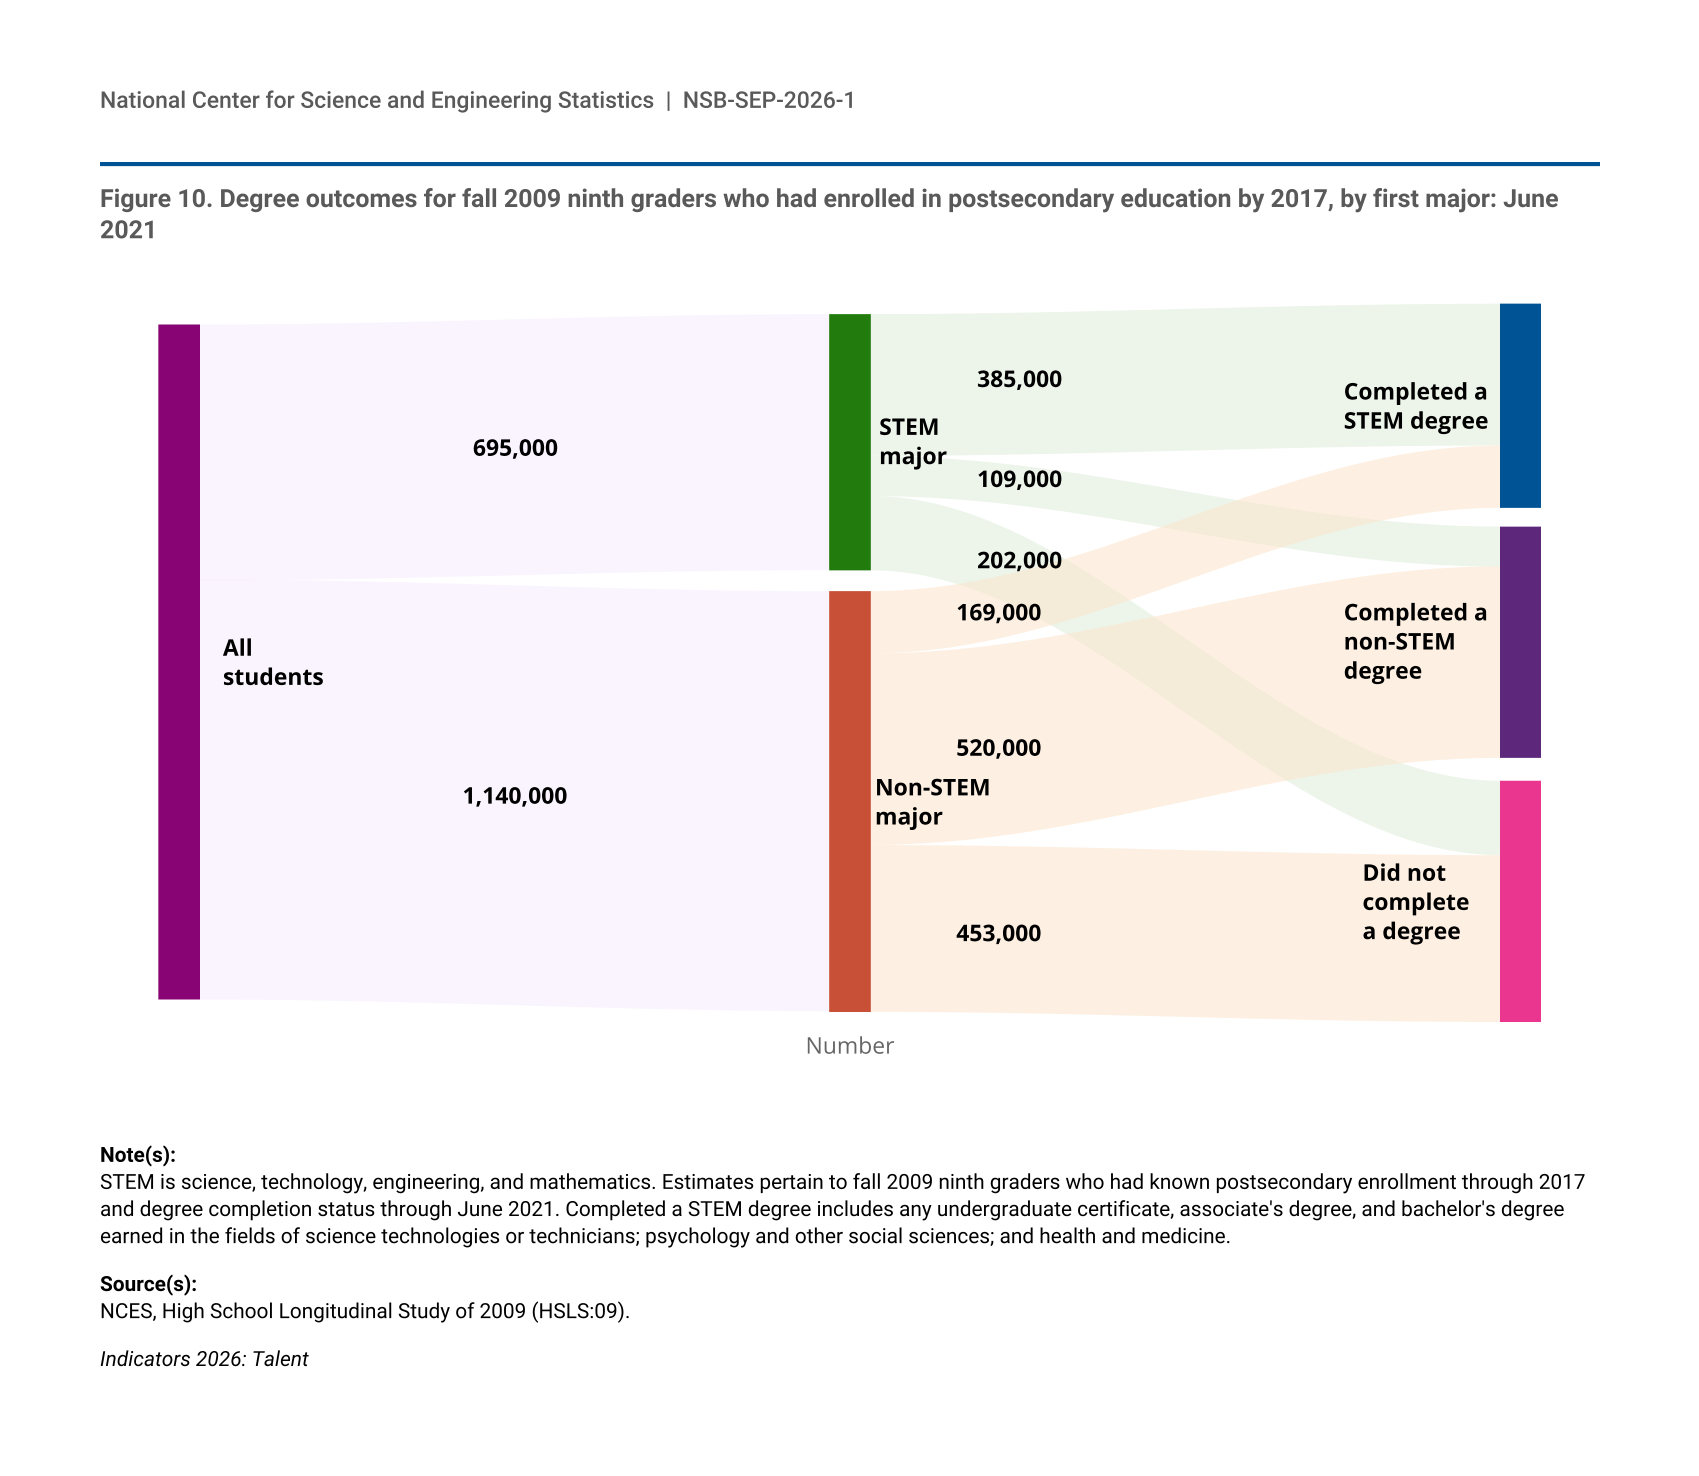
The attrition of higher education students out of STEM—that is, students who begin studying STEM fields while enrolled in post-secondary education but switch to non-STEM fields or leave higher education altogether without completing any degree—may limit the development of the domestic STEM workforce. Approximately 1.8 million U.S. ninth graders in fall 2009 had enrolled in a postsecondary certificate or degree program by 2017; of these students, 695,000 (38%) first declared a STEM major (Figure 10).
| First major | Number |
|---|---|
| All students | 1,840,000 |
| STEM major | 695,000 |
| Completed a STEM degree | 385,000 |
| Completed a non-STEM degree | 109,000 |
| Did not complete a degree | 202,000 |
| Non-STEM major | 1,140,000 |
| Completed a STEM degree | 169,000 |
| Completed a non-STEM degree | 520,000 |
| Did not complete a degree | 453,000 |
STEM is science, technology, engineering, and mathematics. Estimates pertain to fall 2009 ninth graders who had known postsecondary enrollment through 2017 and degree completion status through June 2021. Completed a STEM degree includes any undergraduate certificate, associate's degree, and bachelor's degree earned in the fields of science technologies or technicians; psychology and other social sciences; and health and medicine.
NCES, High School Longitudinal Study of 2009 (HSLS:09).
Among students who began STEM majors, 55% completed a STEM undergraduate certificate or degree (in any STEM field), 16% completed a non-STEM degree, and 29% did not complete a degree. The share of STEM majors who completed a STEM degree (55%) was higher than the share of non-STEM majors who completed a non-STEM degree (46%). Due to the movement of non-STEM majors into STEM fields, 31% of students completing a STEM degree were not initially enrolled in STEM fields. Students’ mathematics achievement in high school was associated with postsecondary STEM degree completion. STEM majors who had scored in the highest quintile in mathematics in grade 11 completed STEM degrees at a rate of 71%, significantly higher than the share of STEM majors who had scored in the lowest quintile (34%) (NCES 2024a; NSB 2026a: Table TAL-14).
S&E Degree Awards by Level and Field
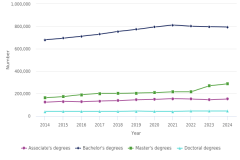
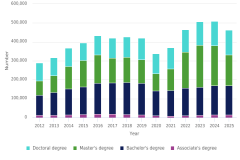
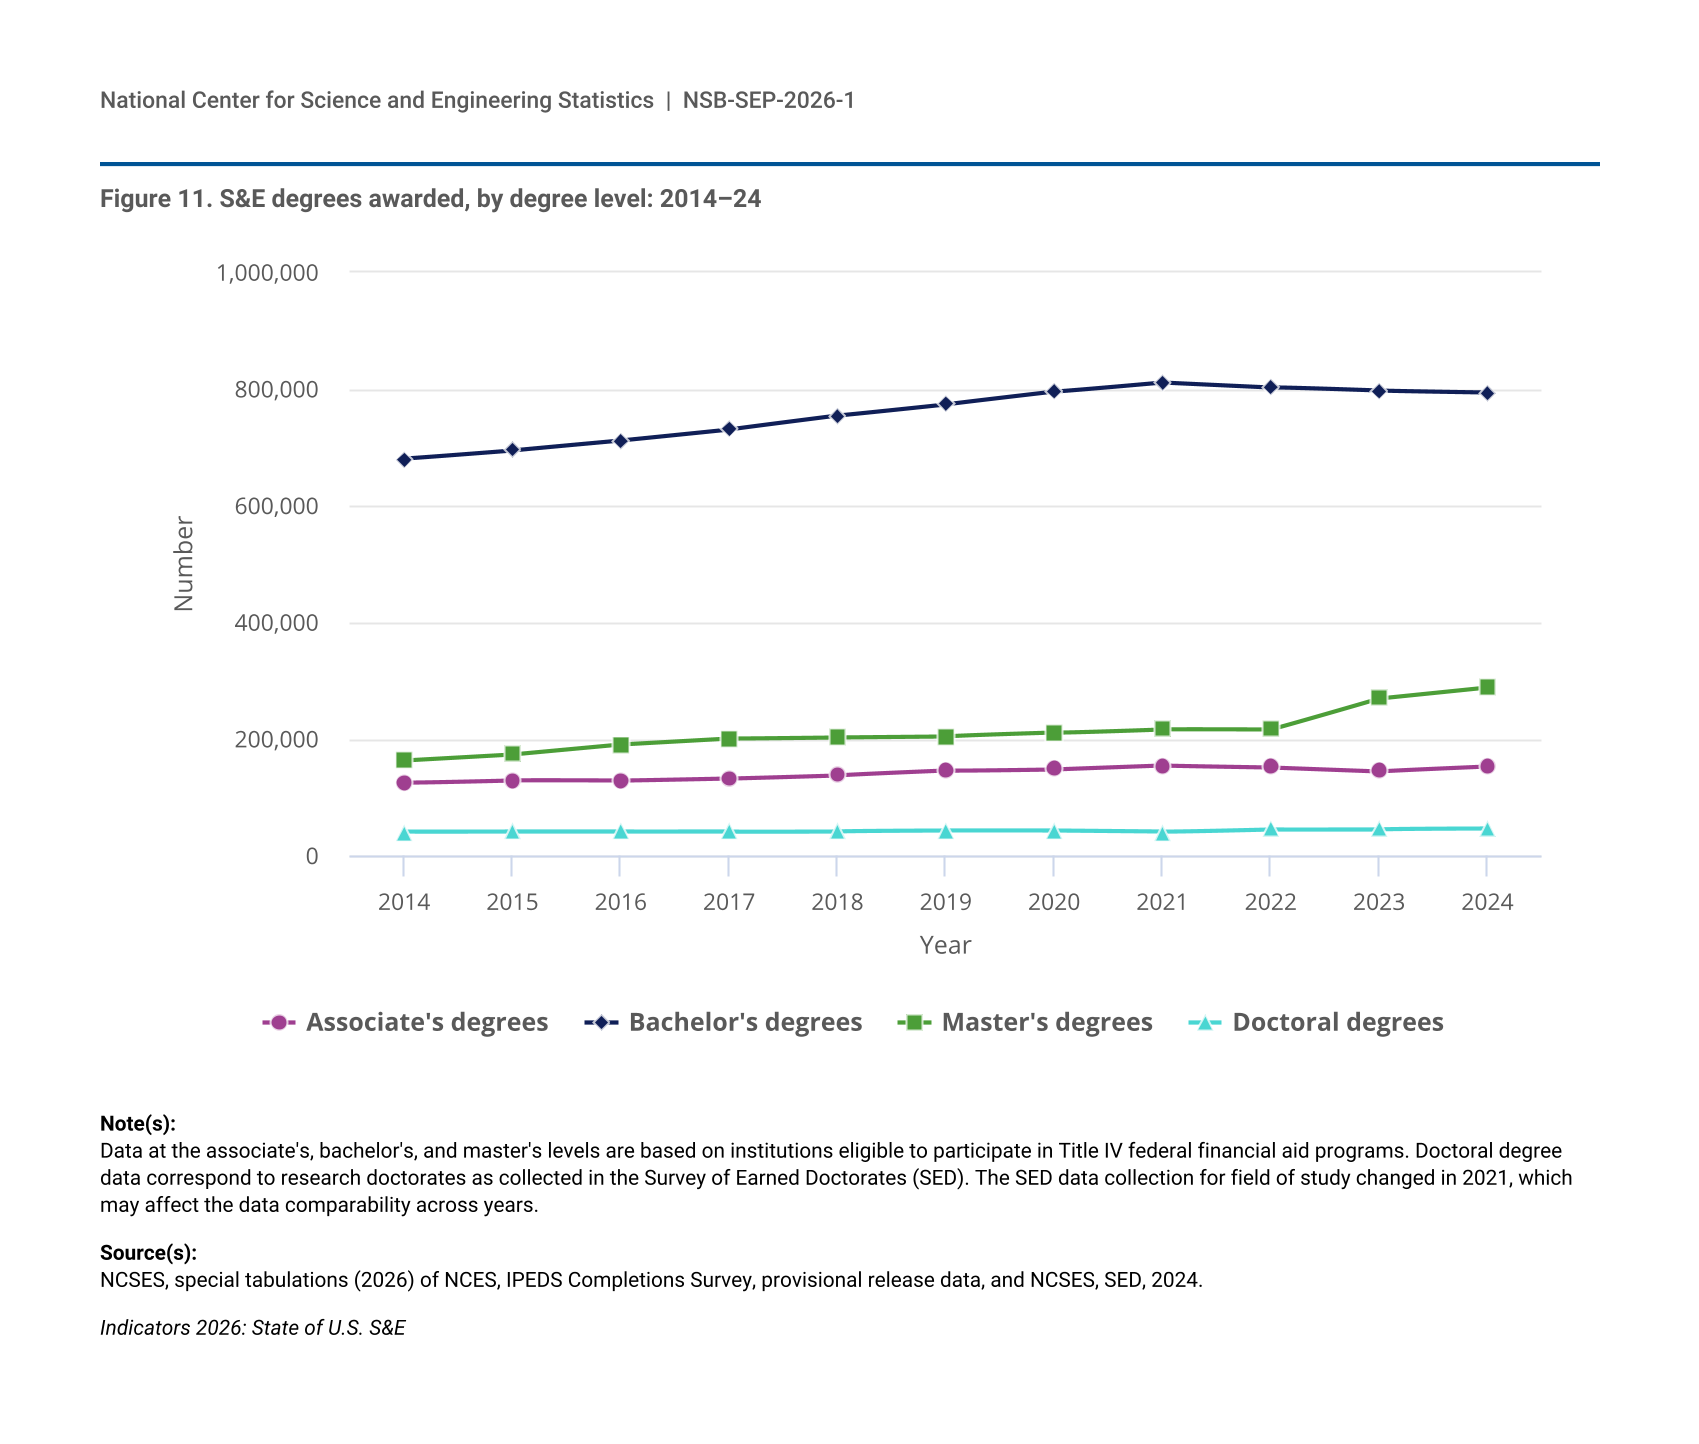
The number of S&E degrees awarded by U.S. higher education institutions increased at all degree levels between 2014 and 2024 (Figure 11) (see the “Glossary” section for a list of S&E fields). S&E associate’s and S&E bachelor’s degree awards increased by 22% and 17%, respectively, during this period, and S&E doctoral degrees increased by 13%. By contrast, the number of S&E master’s degrees awarded increased by 77%. During this time, the share of all degrees awarded in S&E fields increased at every degree level, most substantially for master’s degrees, where the S&E share rose from 22% in 2014 to 31% in 2024 (Table S1). Doctoral degrees in S&E fields accounted for the vast majority (79%) of all doctoral degrees awarded in 2024, whereas S&E degrees did not account for the majority of degrees awarded at any other level.
| Year | Associate's degrees | Bachelor's degrees | Master's degrees | Doctoral degrees |
|---|---|---|---|---|
| 2014 | 124,916 | 680,302 | 163,584 | 40,708 |
| 2015 | 129,468 | 694,701 | 173,854 | 41,247 |
| 2016 | 128,526 | 711,624 | 191,012 | 41,306 |
| 2017 | 132,433 | 730,573 | 201,311 | 41,364 |
| 2018 | 137,984 | 754,094 | 203,441 | 42,144 |
| 2019 | 145,685 | 773,662 | 205,067 | 42,897 |
| 2020 | 148,449 | 795,235 | 210,637 | 42,561 |
| 2021 | 155,029 | 811,706 | 217,146 | 40,818 |
| 2022 | 152,024 | 803,211 | 216,243 | 45,393 |
| 2023 | 145,187 | 796,772 | 270,133 | 45,493 |
| 2024 | 153,019 | 793,867 | 289,091 | 45,929 |
Data at the associate's, bachelor's, and master's levels are based on institutions eligible to participate in Title IV federal financial aid programs. Doctoral degree data correspond to research doctorates as collected in the Survey of Earned Doctorates (SED). The SED data collection for field of study changed in 2021, which may affect the data comparability across years.
NCSES, special tabulations (2026) of NCES, IPEDS Completions Survey, provisional release data, and NCSES, SED, 2024.
Indicators 2026: State of U.S. S&E
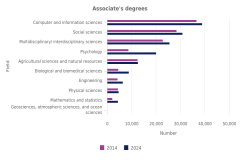
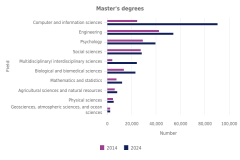
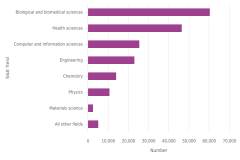
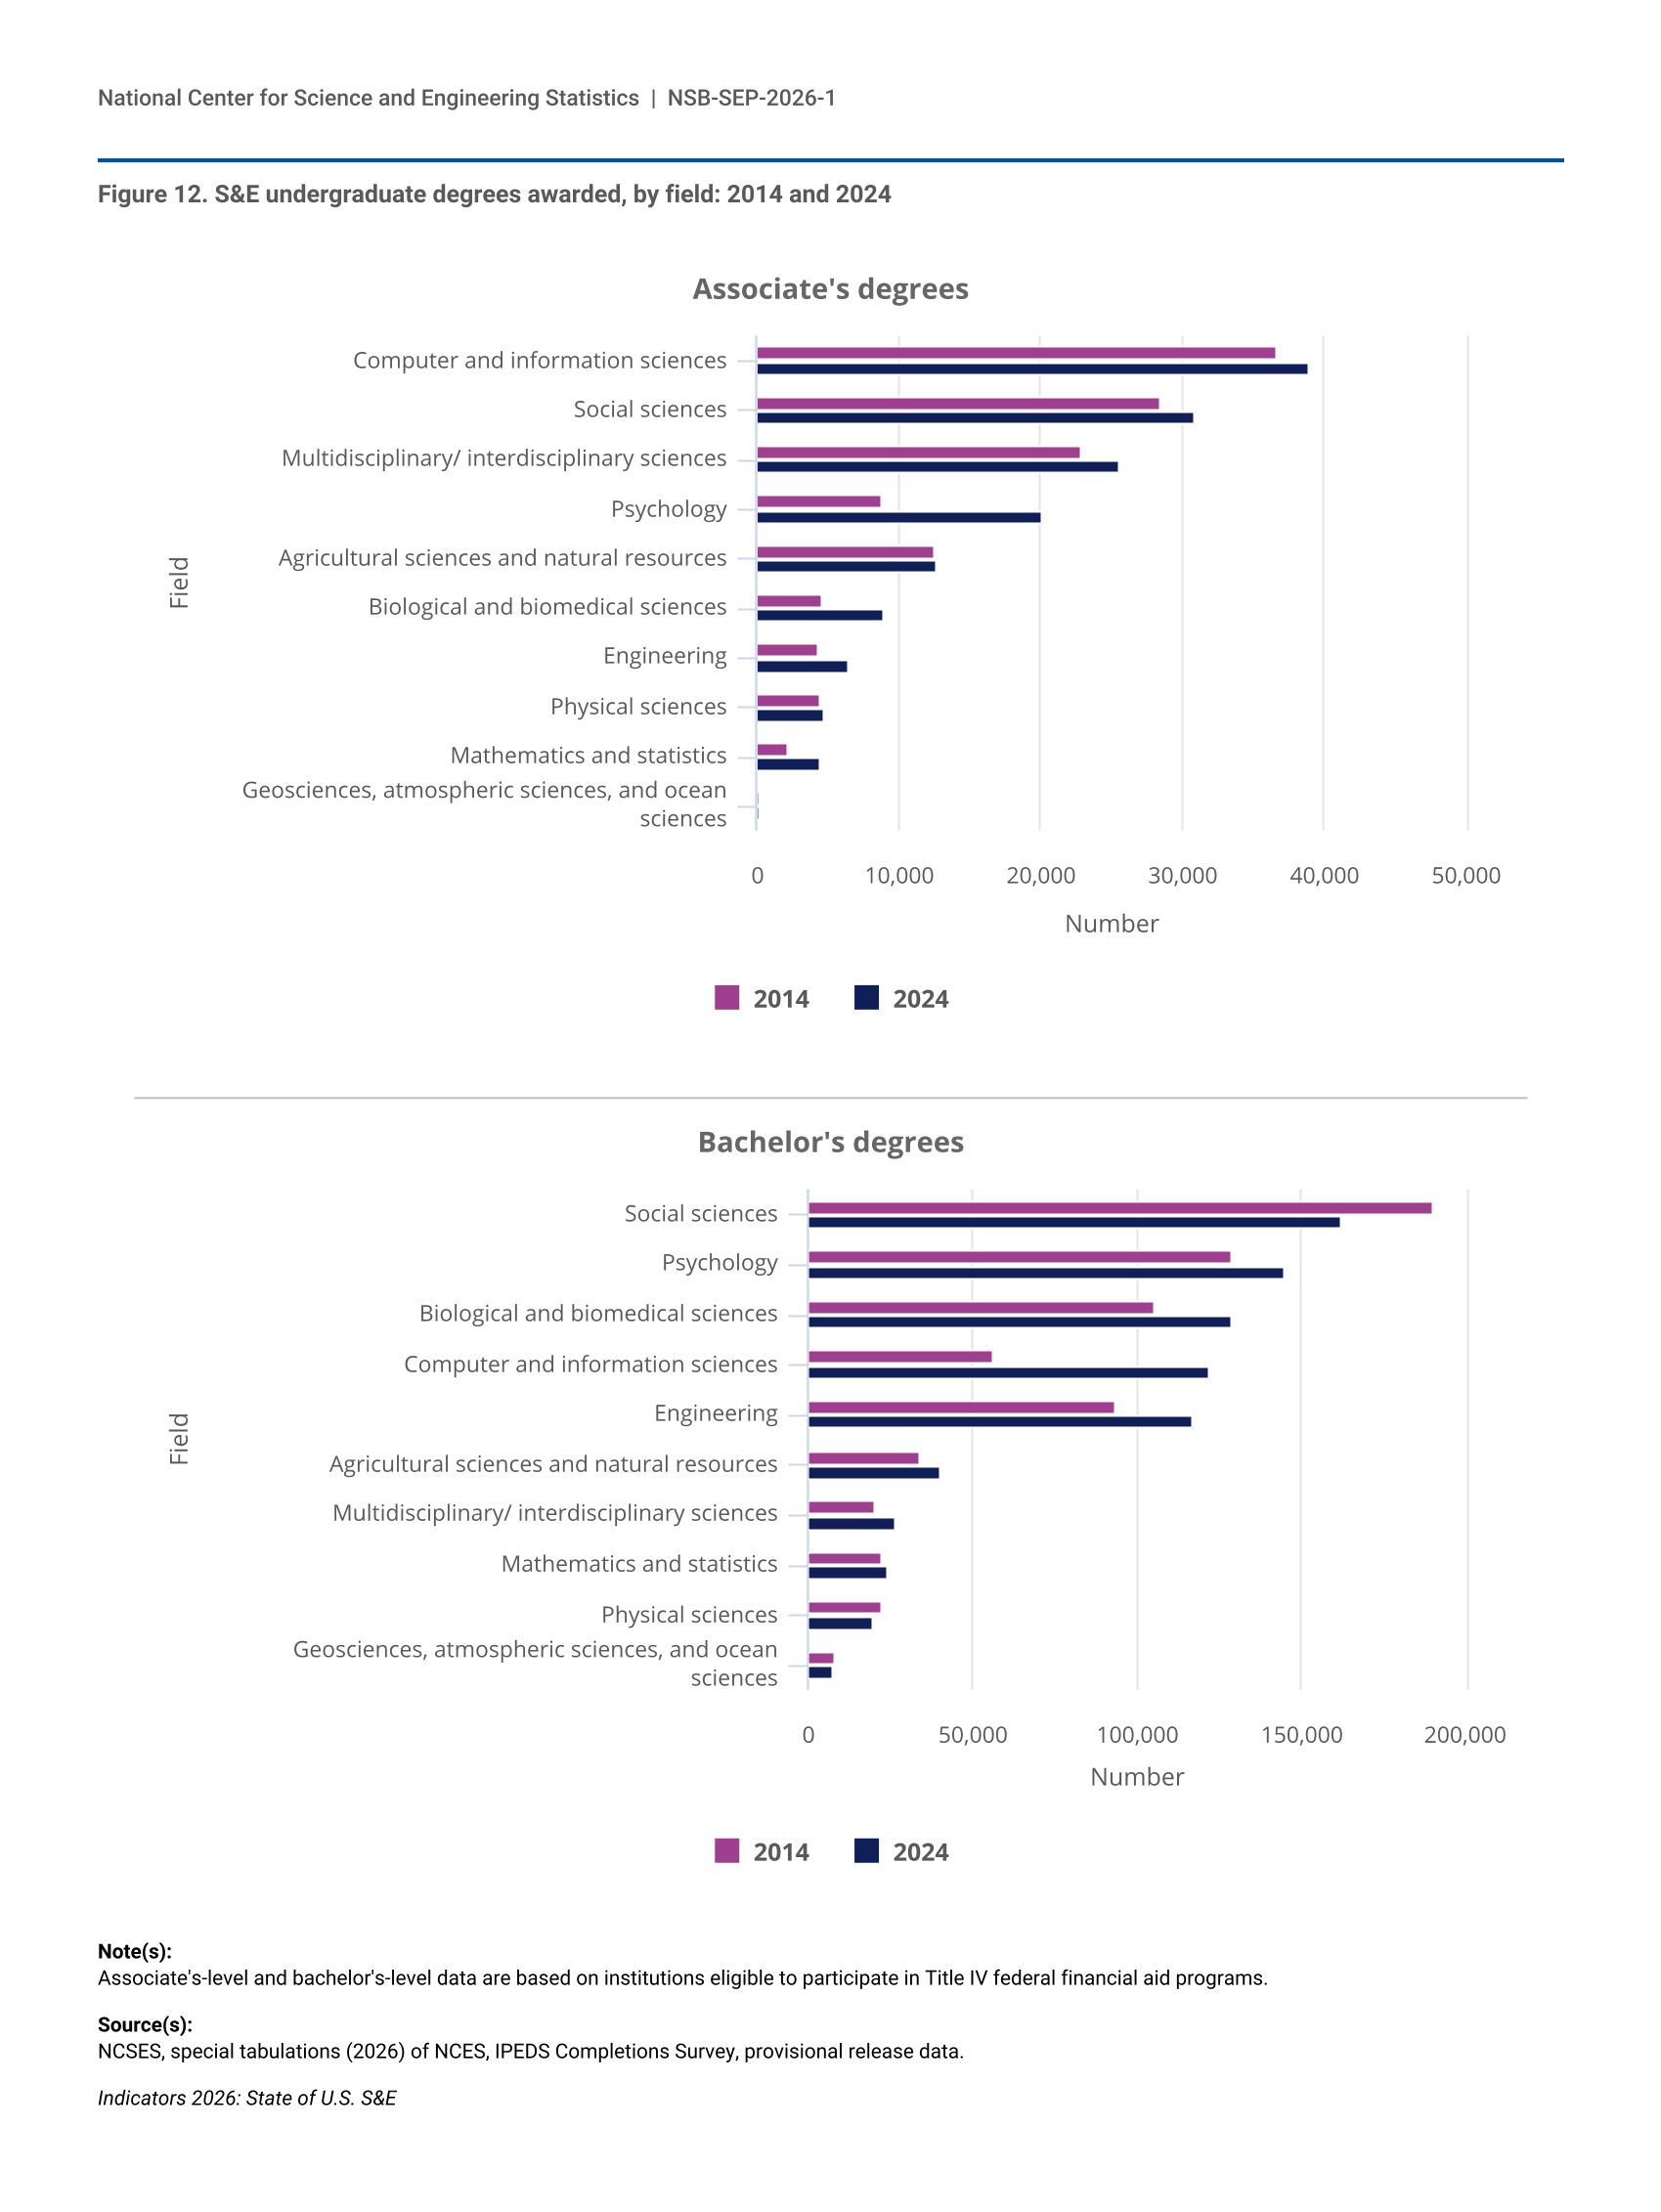
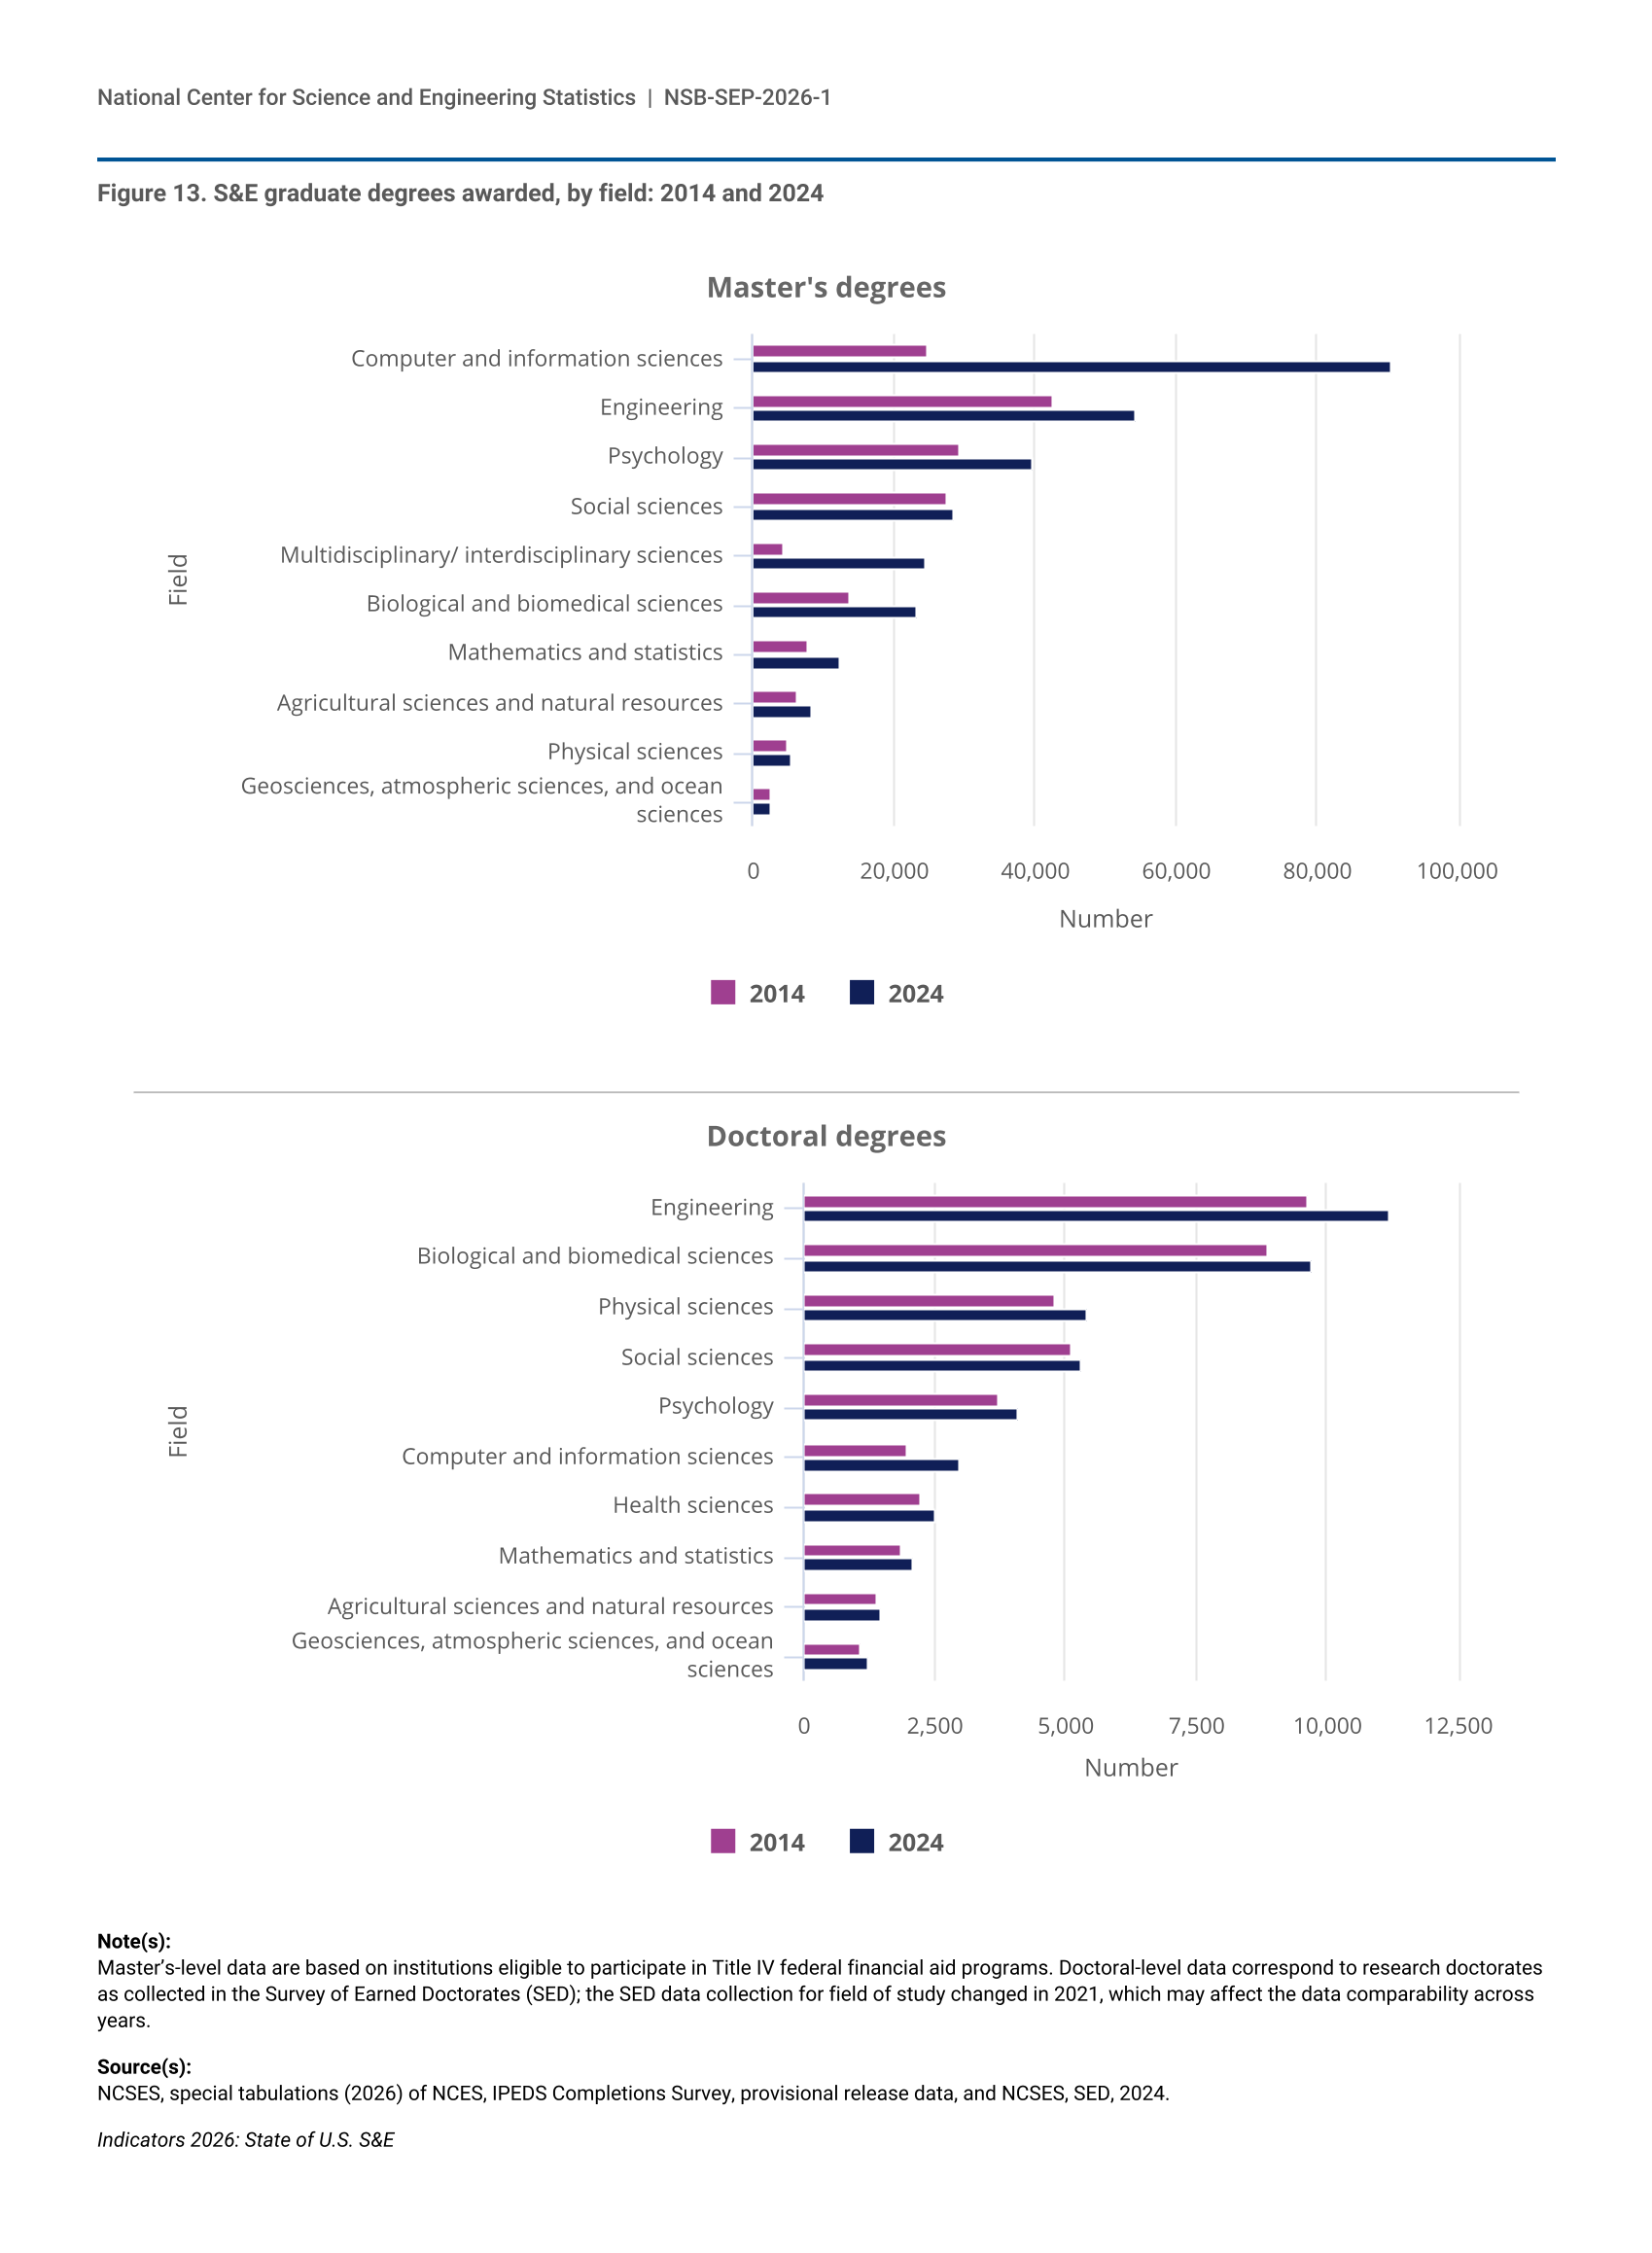
The distribution of S&E degrees among S&E fields varies according to degree level and has changed over time. In 2024, computer and information sciences, social sciences, and multidisciplinary and interdisciplinary sciences were the most common S&E fields for associate’s degrees. At the bachelor’s level, social sciences, psychology, and biological and biomedical sciences were the most common S&E fields (Figure 12). The number of degrees awarded in computer and information sciences—a field closely associated with CET areas such as AI and QIST—has increased rapidly over the last decade. From 2014 to 2024, computer and information sciences degrees more than doubled at the bachelor’s level, increasing from about 56,000 degrees to about 122,000 degrees, and more than tripled at the master’s level, from about 25,000 degrees to about 91,000 degrees (Figure 12; Table S2). Computer and information sciences was the most popular S&E degree field at the master’s level in 2024, followed by engineering, psychology, and social sciences (Figure 13). At the doctoral level, degrees in computer and information sciences were comparatively less common, and engineering and biological and biomedical sciences were the most popular S&E degree fields in both 2014 and 2024.
| Field | 2014 | 2024 |
|---|---|---|
| Computer and information sciences | 36,693 | 38,923 |
| Social sciences | 28,420 | 30,938 |
| Multidisciplinary/ interdisciplinary sciences | 22,899 | 25,600 |
| Psychology | 8,798 | 20,137 |
| Agricultural sciences and natural resources | 12,501 | 12,633 |
| Biological and biomedical sciences | 4,556 | 8,943 |
| Engineering | 4,334 | 6,434 |
| Physical sciences | 4,410 | 4,798 |
| Mathematics and statistics | 2,140 | 4,431 |
| Geosciences, atmospheric sciences, and ocean sciences | 165 | 182 |
| Field | 2014 | 2024 |
|---|---|---|
| Social sciences | 190,128 | 161,938 |
| Psychology | 128,539 | 145,096 |
| Biological and biomedical sciences | 105,143 | 128,702 |
| Computer and information sciences | 56,055 | 121,836 |
| Engineering | 93,264 | 117,332 |
| Agricultural sciences and natural resources | 34,101 | 40,027 |
| Multidisciplinary/ interdisciplinary sciences | 20,587 | 26,842 |
| Mathematics and statistics | 22,142 | 24,334 |
| Physical sciences | 22,340 | 20,033 |
| Geosciences, atmospheric sciences, and ocean sciences | 8,003 | 7,727 |
Associate's-level and bachelor's-level data are based on institutions eligible to participate in Title IV federal financial aid programs.
NCSES, special tabulations (2026) of NCES, IPEDS Completions Survey, provisional release data.
Indicators 2026: State of U.S. S&E
| Field | 2014 | 2024 |
|---|---|---|
| Computer and information sciences | 24,635 | 90,655 |
| Engineering | 42,551 | 54,224 |
| Psychology | 29,330 | 39,745 |
| Social sciences | 27,656 | 28,351 |
| Multidisciplinary/ interdisciplinary sciences | 4,231 | 24,307 |
| Biological and biomedical sciences | 13,803 | 23,144 |
| Mathematics and statistics | 7,678 | 12,386 |
| Agricultural sciences and natural resources | 6,424 | 8,327 |
| Physical sciences | 4,770 | 5,455 |
| Geosciences, atmospheric sciences, and ocean sciences | 2,506 | 2,497 |
| Field | 2014 | 2024 |
|---|---|---|
| Engineering | 9,626 | 11,169 |
| Biological and biomedical sciences | 8,868 | 9,700 |
| Physical sciences | 4,812 | 5,401 |
| Social sciences | 5,102 | 5,285 |
| Psychology | 3,724 | 4,083 |
| Computer and information sciences | 1,988 | 2,982 |
| Health sciences | 2,236 | 2,509 |
| Mathematics and statistics | 1,874 | 2,093 |
| Agricultural sciences and natural resources | 1,380 | 1,478 |
| Geosciences, atmospheric sciences, and ocean sciences | 1,098 | 1,229 |
Master’s-level data are based on institutions eligible to participate in Title IV federal financial aid programs. Doctoral-level data correspond to research doctorates as collected in the Survey of Earned Doctorates (SED); the SED data collection for field of study changed in 2021, which may affect the data comparability across years.
NCSES, special tabulations (2026) of NCES, IPEDS Completions Survey, provisional release data, and NCSES, SED, 2024.
Indicators 2026: State of U.S. S&E
S&E Degree Awards by Geography and Student Characteristics
The availability of S&E training and the relative concentration of higher education degrees awarded in S&E fields vary geographically throughout the United States. The share of bachelor’s degrees awarded in S&E fields in 2024 ranged from 27% for institutions in Arizona to 54% for institutions in Maryland. Generally, states awarded considerably larger shares of degrees in S&E fields at the doctoral level than at the bachelor’s level. Vermont, Alaska, New Hampshire, Montana, and Delaware, had the highest share of doctoral degrees awarded in S&E fields of any state, 90% or higher. California, Texas, and New York, the most populous states in the United States, are also the top states for S&E doctorate awards (SED 2024: Table 7-6). In 2024, West Virginia and Mississippi awarded the lowest proportion of doctoral degrees in S&E fields (66% and 67%, respectively).
Male and female students account for different shares of S&E degree recipients, depending on the degree field and degree level (Table S3; Table S4). In 2024, across all degree levels—associate’s, bachelor’s, master’s, and doctoral—male students earned a larger proportion of degrees than their female counterparts in engineering, computer and information sciences, mathematics and statistics, and physical sciences. In contrast, female students earned a majority of degrees in psychology, biological and biomedical sciences, agricultural sciences and natural resources, and social sciences at all degree levels. In terms of race and ethnicity, White students earned a lower proportion of S&E associate’s degrees (40%) in 2024 than their share of the 20- to 34-year-old U.S. population (52%) (Table S5). However, compared with their share of this population group, White students accounted for a similar share of S&E bachelor’s degree recipients (53%), a proportionally slightly higher share (56%) of S&E master’s degree recipients, and a much higher share of S&E doctoral degree (65%) recipients. Asian students earned larger proportions of S&E degrees at all levels than their share of the U.S. population ages 20–34 years. At the bachelor’s degree level and higher, American Indian or Alaska Native, Black, and Hispanic students earned lower shares of S&E degrees than their respective shares of this population group.
International Comparisons and Global Competitiveness
International Elementary and Secondary STEM Assessments
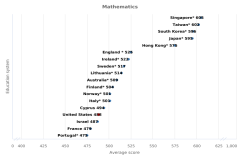
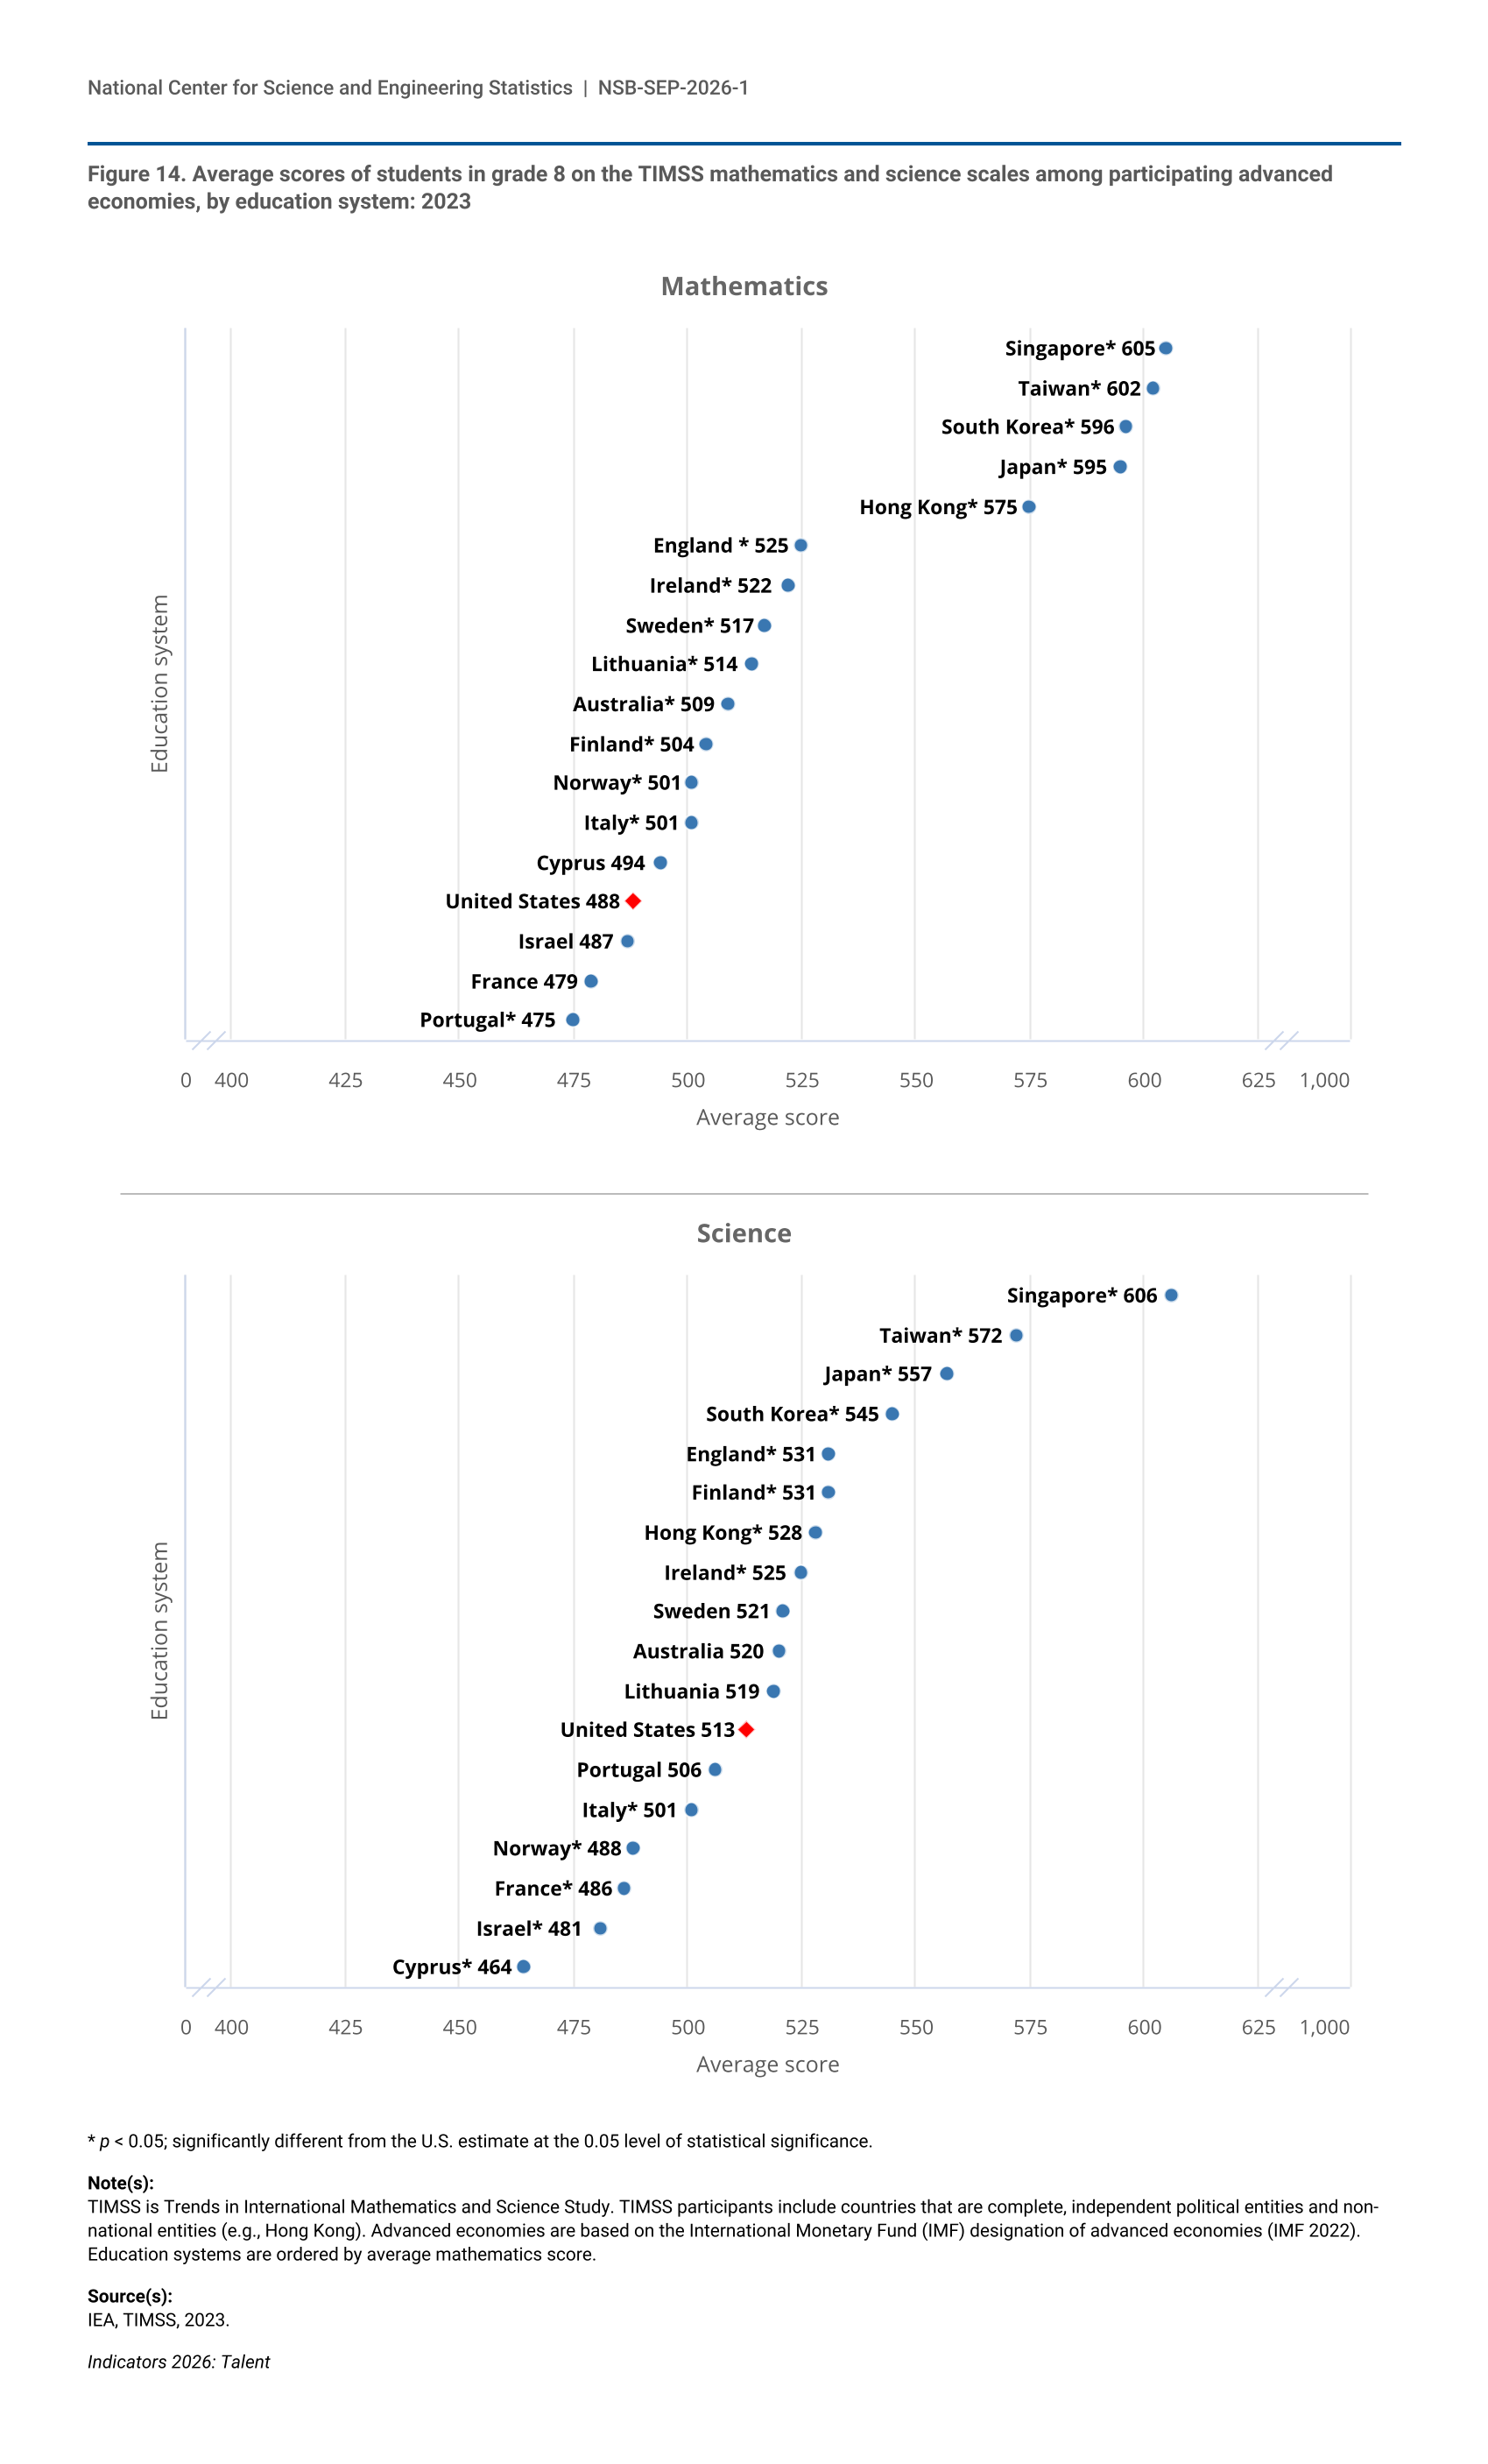
U.S. eighth graders perform better in science than they do in mathematics on international tests, according to the Trends in International Mathematics and Science Study (TIMSS) 2023 assessment. Among the advanced economies participating in the grade 8 TIMSS assessment, most (13 of 18) had statistically significantly higher average mathematics scores than the average U.S. score, and only one education system had a significantly lower average score (Figure 14). U.S. students scored comparatively better in science, closer to the middle of advanced economies, where 8 of 18 education systems had statistically higher average scores.
| Education system | Average score |
|---|---|
| Singapore* | 605 |
| Taiwan* | 602 |
| South Korea* | 596 |
| Japan* | 595 |
| Hong Kong* | 575 |
| England* | 525 |
| Ireland* | 522 |
| Sweden* | 517 |
| Lithuania* | 514 |
| Australia* | 509 |
| Finland* | 504 |
| Norway* | 501 |
| Italy* | 501 |
| Cyprus | 494 |
| United States | 488 |
| Israel | 487 |
| France | 479 |
| Portugal* | 475 |
| Education system | Average score |
|---|---|
| Singapore* | 606 |
| Taiwan* | 572 |
| Japan* | 557 |
| South Korea* | 545 |
| England* | 531 |
| Finland* | 531 |
| Hong Kong* | 528 |
| Ireland* | 525 |
| Sweden | 521 |
| Australia | 520 |
| Lithuania | 519 |
| United States | 513 |
| Portugal | 506 |
| Italy* | 501 |
| Norway* | 488 |
| France* | 486 |
| Israel* | 481 |
| Cyprus* | 464 |
* p < 0.05; significantly different from the U.S. estimate at the 0.05 level of statistical significance.
TIMSS is Trends in International Mathematics and Science Study. TIMSS participants include countries that are complete, independent political entities and non-national entities (e.g., Hong Kong). Advanced economies are based on the International Monetary Fund (IMF) designation of advanced economies (IMF 2022). Education systems are ordered by average mathematics score.
IEA, TIMSS, 2023.
Similar to the NAEP, U.S. student mathematics performance on TIMSS has declined significantly since the COVID-19 pandemic. Average mathematics scores of eighth-grade U.S. students decreased by 27 points between the 2019 and 2023 TIMSS assessments. However, average U.S. student scores on the TIMSS science assessment did not change significantly from 2019 to 2023 (NSB 2026a: Figure TAL-40).
The International Computer and Information Literacy Study (ICILS) measures eighth-grade student performance in computer and information literacy (the ability to use computers effectively in everyday life at home, work, and school) and in computational thinking (the use of computers to solve problems; this includes such skills as programming) (NCES 2024b; NSB 2026a: Table STAL-23). In 2023, the average computer and information literacy score of U.S. students (482) was similar to the average across all education systems (476) participating in the ICILS. However, in computational thinking, U.S. students scored statistically lower (461) than the ICILS average (483). South Korea, Taiwan, and Czechia were among the highest-scoring countries and had significantly higher average student scores than the United States on both assessments.
International Student Enrollment in U.S. S&E Higher Education
International students play a significant role in U.S. higher education. U.S. services exports of education-related travel—expenditures of foreign students in the United States—were $49.3 billion in 2023 and $54.8 billion in 2024 (BEA 2025b). According to internationally comparable definitions, the United States enrolled about 957,000 internationally mobile tertiary (postsecondary) students across all fields of study in 2023, more than any other country (OECD 2025a). Other popular destinations for internationally mobile students were the United Kingdom (748,000), Australia (467,000), Germany (423,000), and Canada (389,000). Between 2017 and 2023, the number of internationally mobile students in the United States decreased by 3%, while enrollment grew in Canada by 85%, in the United Kingdom by 72%, in Germany by 63%, and Australia by 23% during the same period (NSB 2026a: Table TAL-19).
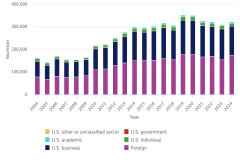
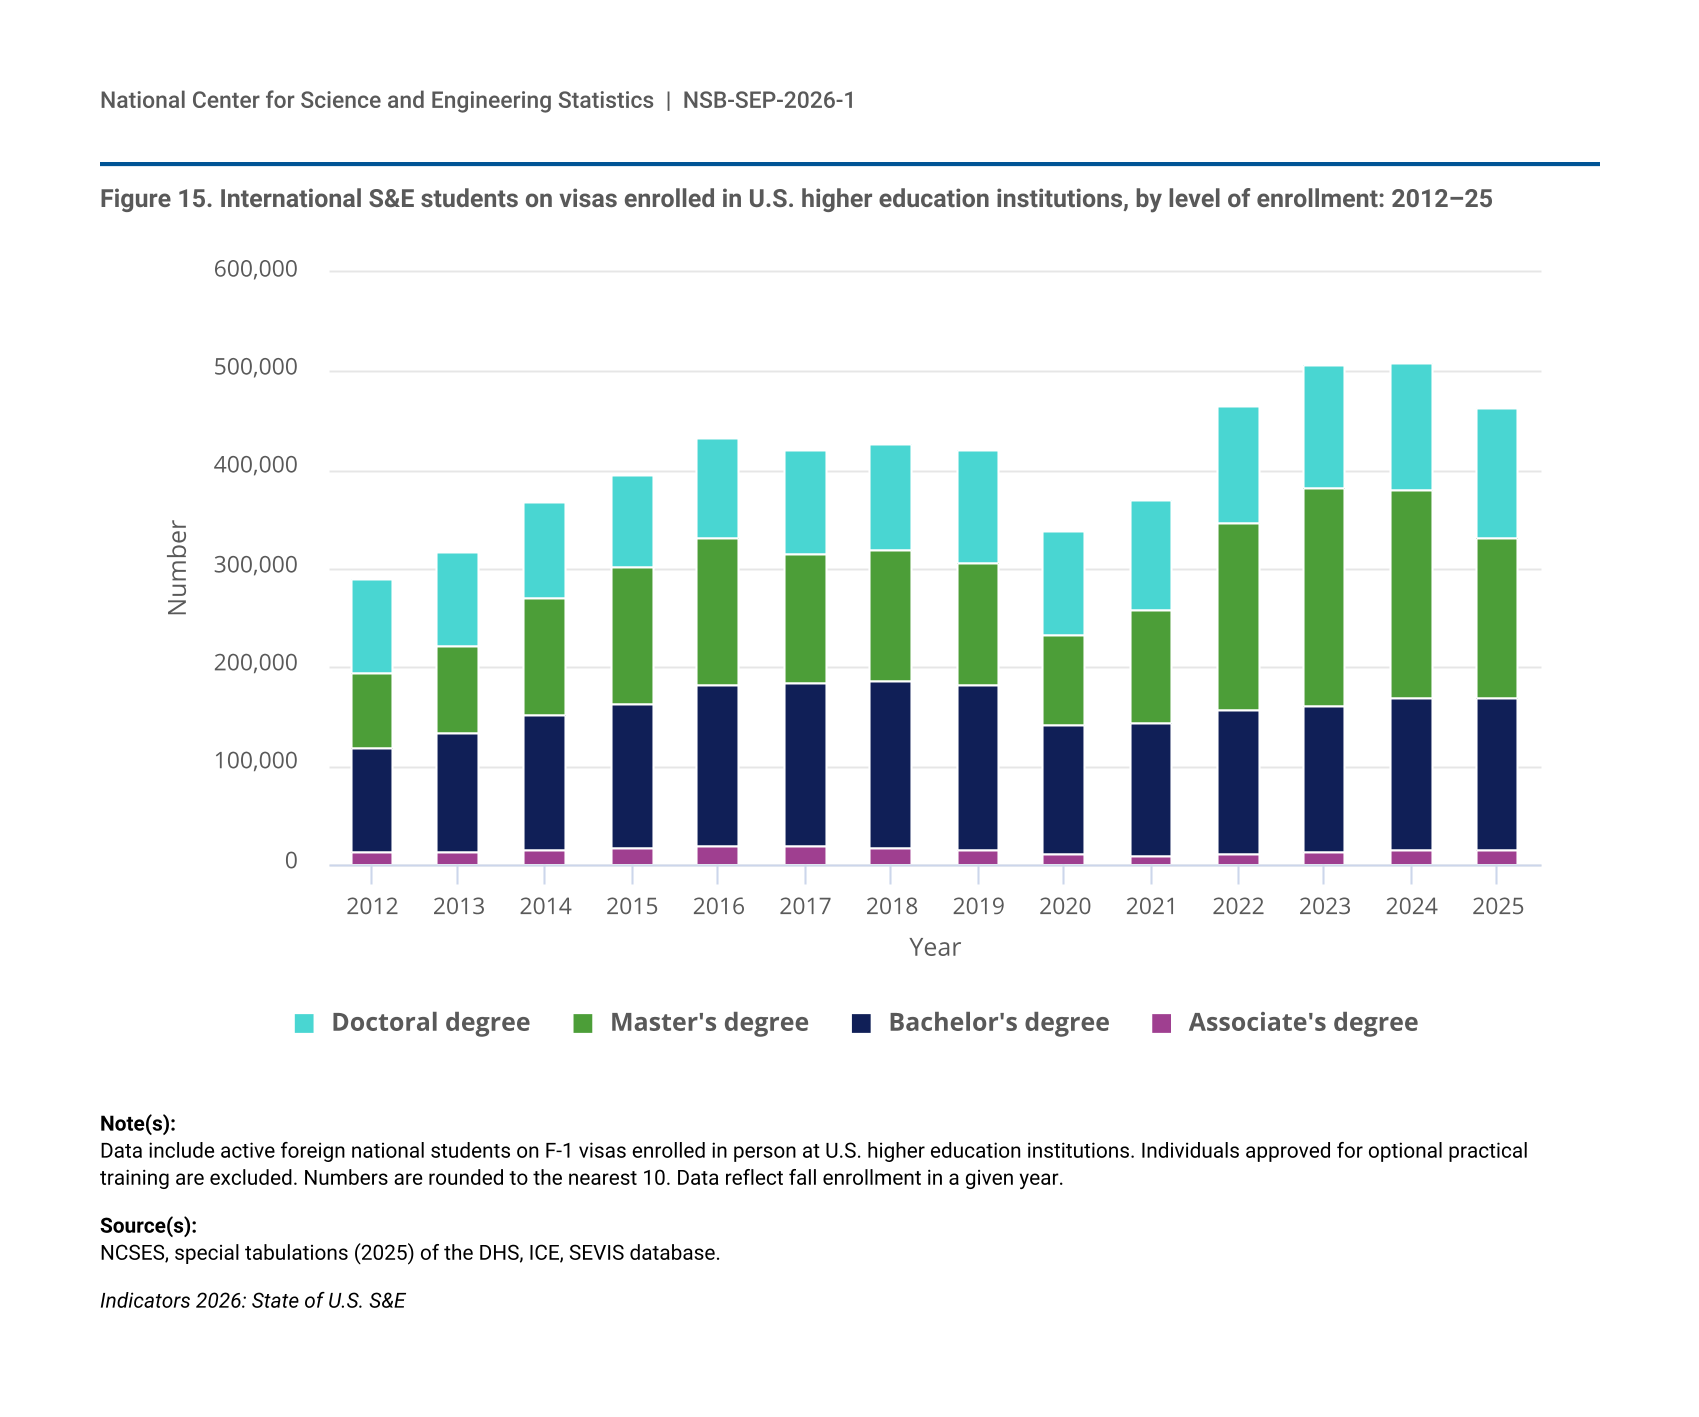
Enrollment of international students traveling to the United States for postsecondary degrees in S&E fields totaled approximately 463,000 across all degree levels in fall 2025, a 9% decrease from its 2024 level. Enrollment trends differ substantially depending on the degree level, with master’s enrollment exhibiting the most variability (Figure 15). International S&E master’s enrollment more than doubled from its COVID-era low in 2020 (89,000) to its peak in 2023 (224,000) before declining slightly in 2024 (211,000). Master’s enrollment dropped by nearly a quarter (24%) from 2024 to 2025, driving the overall decline in total international S&E enrollment across all degree levels. In contrast, there was little change in enrollment at other degree levels from 2024 to 2025.
| Year | Associate's degree | Bachelor's degree | Master's degree | Doctoral degree |
|---|---|---|---|---|
| 2012 | 12,910 | 106,290 | 75,280 | 94,130 |
| 2013 | 13,650 | 120,030 | 88,960 | 93,410 |
| 2014 | 15,490 | 136,560 | 118,640 | 96,370 |
| 2015 | 17,130 | 145,530 | 138,460 | 94,590 |
| 2016 | 19,770 | 162,490 | 148,450 | 102,240 |
| 2017 | 18,920 | 164,240 | 132,340 | 104,290 |
| 2018 | 17,520 | 168,090 | 132,460 | 108,490 |
| 2019 | 15,720 | 165,630 | 124,240 | 114,140 |
| 2020 | 11,550 | 130,620 | 89,370 | 106,580 |
| 2021 | 8,830 | 134,370 | 115,530 | 110,150 |
| 2022 | 10,660 | 145,660 | 190,760 | 117,390 |
| 2023 | 13,210 | 146,500 | 223,540 | 123,010 |
| 2024 | 14,780 | 154,980 | 210,630 | 129,480 |
| 2025 | 15,140 | 154,680 | 160,980 | 132,340 |
Data include active foreign national students on F-1 visas enrolled in person at U.S. higher education institutions. Individuals approved for optional practical training are excluded. Numbers are rounded to the nearest 10. Data reflect fall enrollment in a given year.
NCSES, special tabulations (2025) of the DHS, ICE, SEVIS database.
Indicators 2026: State of U.S. S&E
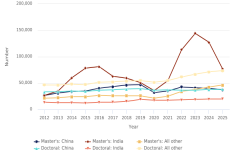
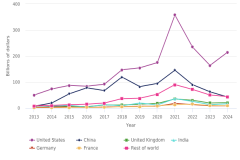
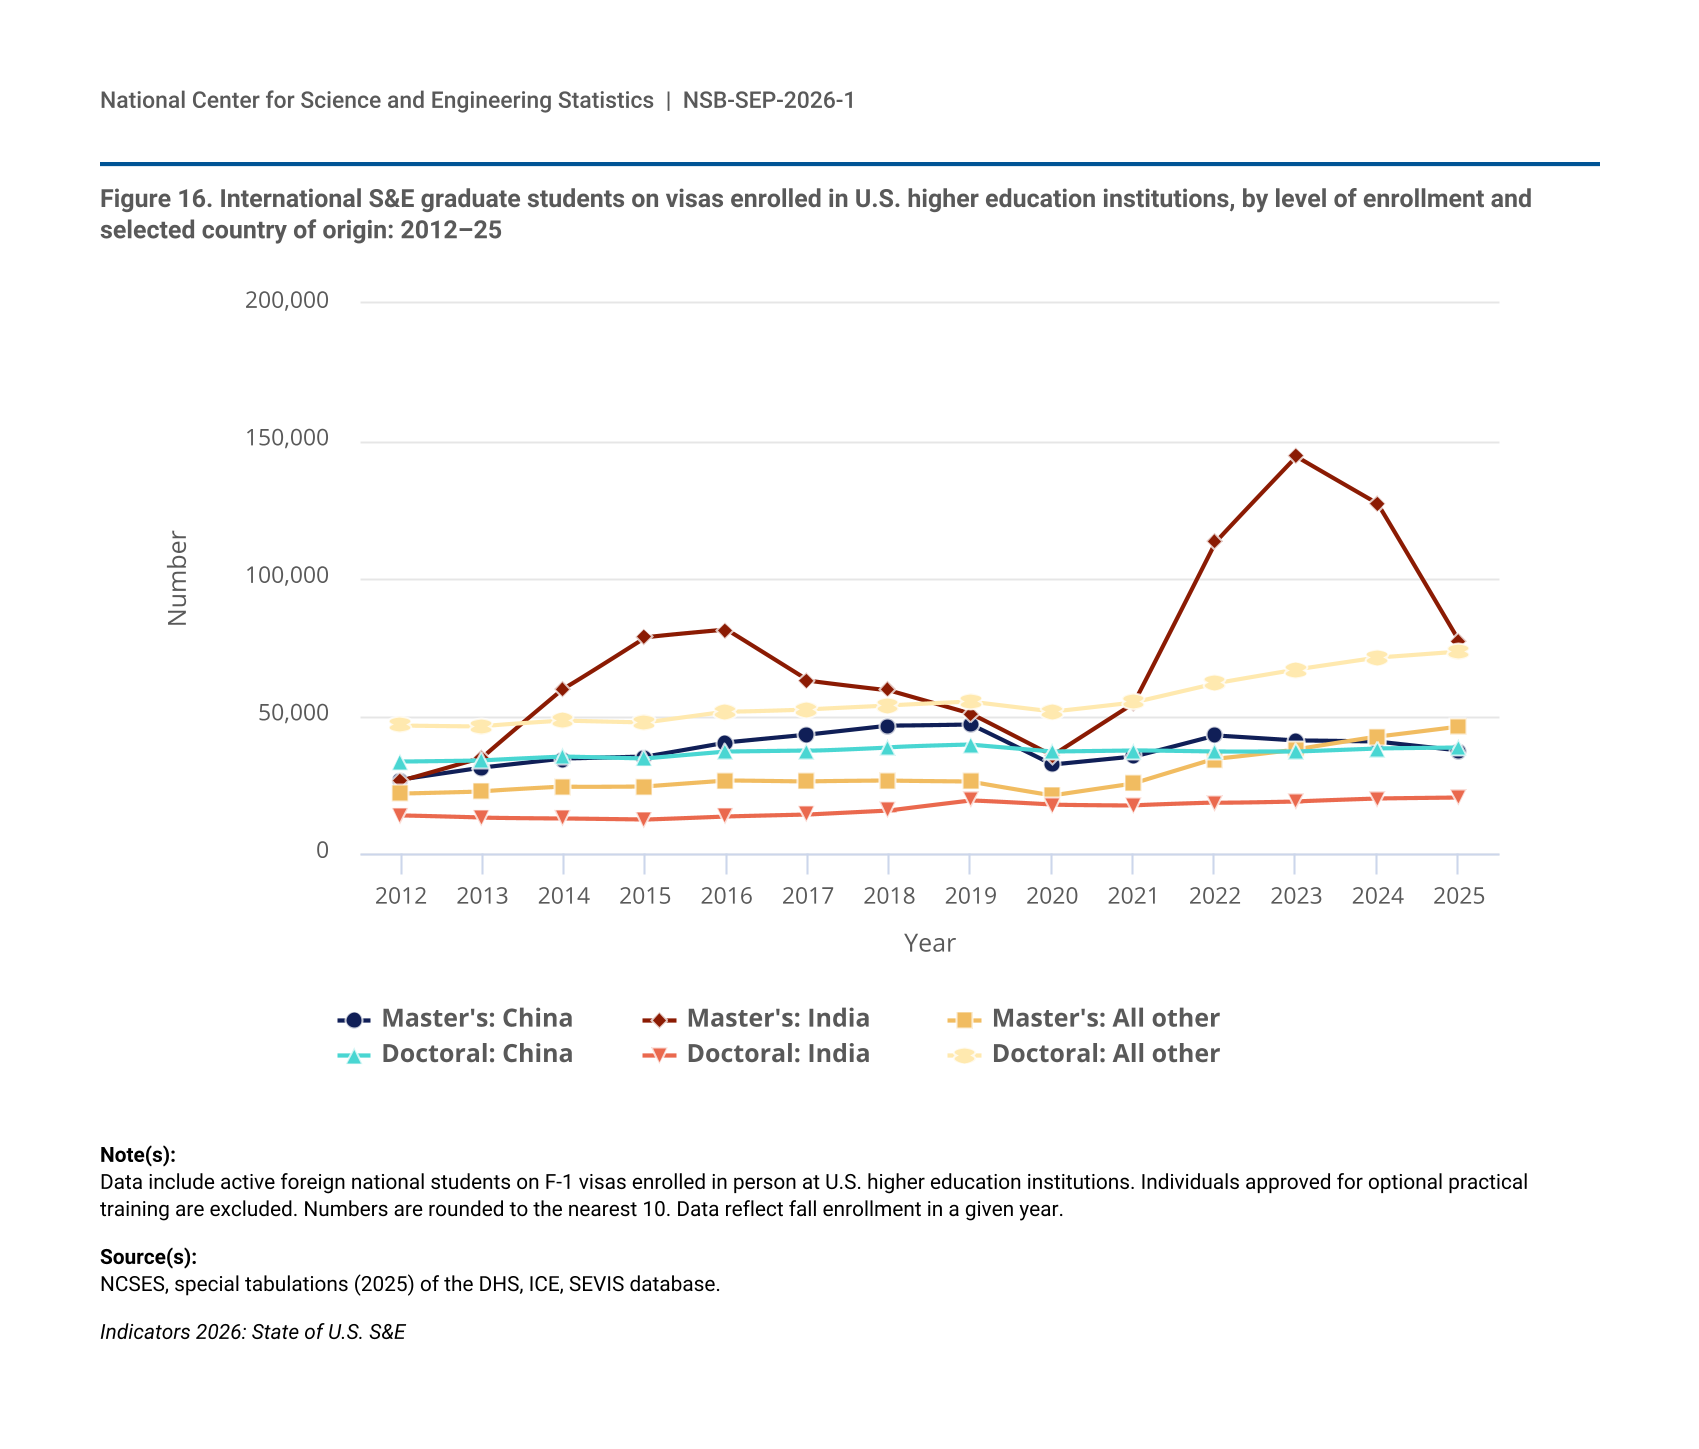
China and India are the most common countries of origin for international S&E graduate students on visas in the United States, and graduate students from these countries predominantly study computer and information sciences and engineering. In 2025, China and India combined accounted for 71% of international S&E master’s enrollment and 44% of international S&E doctoral enrollment (Figure 16). China was the leading country of origin for international S&E doctoral students (about 38,000 in 2025), and India was by far the leading source for S&E master’s students (77,000). The 24% decline in international S&E master’s enrollment from 2024 to 2025 was driven by a 39% decrease in S&E master’s students from India; enrollment of S&E master’s students from China decreased by a comparatively small amount (8%) over this period, and enrollment from all other countries collectively increased by 9%.
| Year | Master's: China | Master's: India | Master's: All other | Doctoral: China | Doctoral: India | Doctoral: All other |
|---|---|---|---|---|---|---|
| 2012 | 26,850 | 26,540 | 21,890 | 33,500 | 13,910 | 46,730 |
| 2013 | 31,180 | 35,100 | 22,690 | 33,910 | 13,090 | 46,410 |
| 2014 | 34,450 | 59,940 | 24,250 | 35,230 | 12,890 | 48,240 |
| 2015 | 35,210 | 78,750 | 24,500 | 34,510 | 12,500 | 47,580 |
| 2016 | 40,420 | 81,390 | 26,640 | 37,000 | 13,660 | 51,580 |
| 2017 | 43,230 | 62,910 | 26,210 | 37,370 | 14,330 | 52,580 |
| 2018 | 46,550 | 59,480 | 26,430 | 38,780 | 15,790 | 53,920 |
| 2019 | 47,050 | 51,040 | 26,160 | 39,540 | 19,340 | 55,270 |
| 2020 | 32,380 | 35,770 | 21,230 | 37,100 | 17,740 | 51,730 |
| 2021 | 35,310 | 54,690 | 25,530 | 37,470 | 17,560 | 55,120 |
| 2022 | 43,050 | 113,300 | 34,420 | 36,980 | 18,430 | 61,990 |
| 2023 | 41,160 | 144,330 | 38,060 | 37,000 | 19,070 | 66,940 |
| 2024 | 40,700 | 127,290 | 42,640 | 38,130 | 20,060 | 71,280 |
| 2025 | 37,490 | 77,140 | 46,350 | 38,430 | 20,390 | 73,520 |
Data include active foreign national students on F-1 visas enrolled in person at U.S. higher education institutions. Individuals approved for optional practical training are excluded. Numbers are rounded to the nearest 10. Data reflect fall enrollment in a given year.
NCSES, special tabulations (2025) of the DHS, ICE, SEVIS database.
Indicators 2026: State of U.S. S&E
The majority of S&E master’s students from India have been concentrated in computer and information sciences over the last decade, and enrollment in this field has been especially volatile in recent years. Enrollment of computer and information sciences master’s students from India more than quadrupled from 2020 (about 21,000) to 2023 (94,000) and then dropped to less than half this peak by 2025 (43,000).
U.S. S&E Degree Awards to International Students
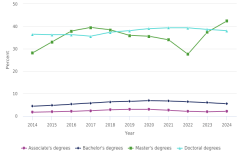
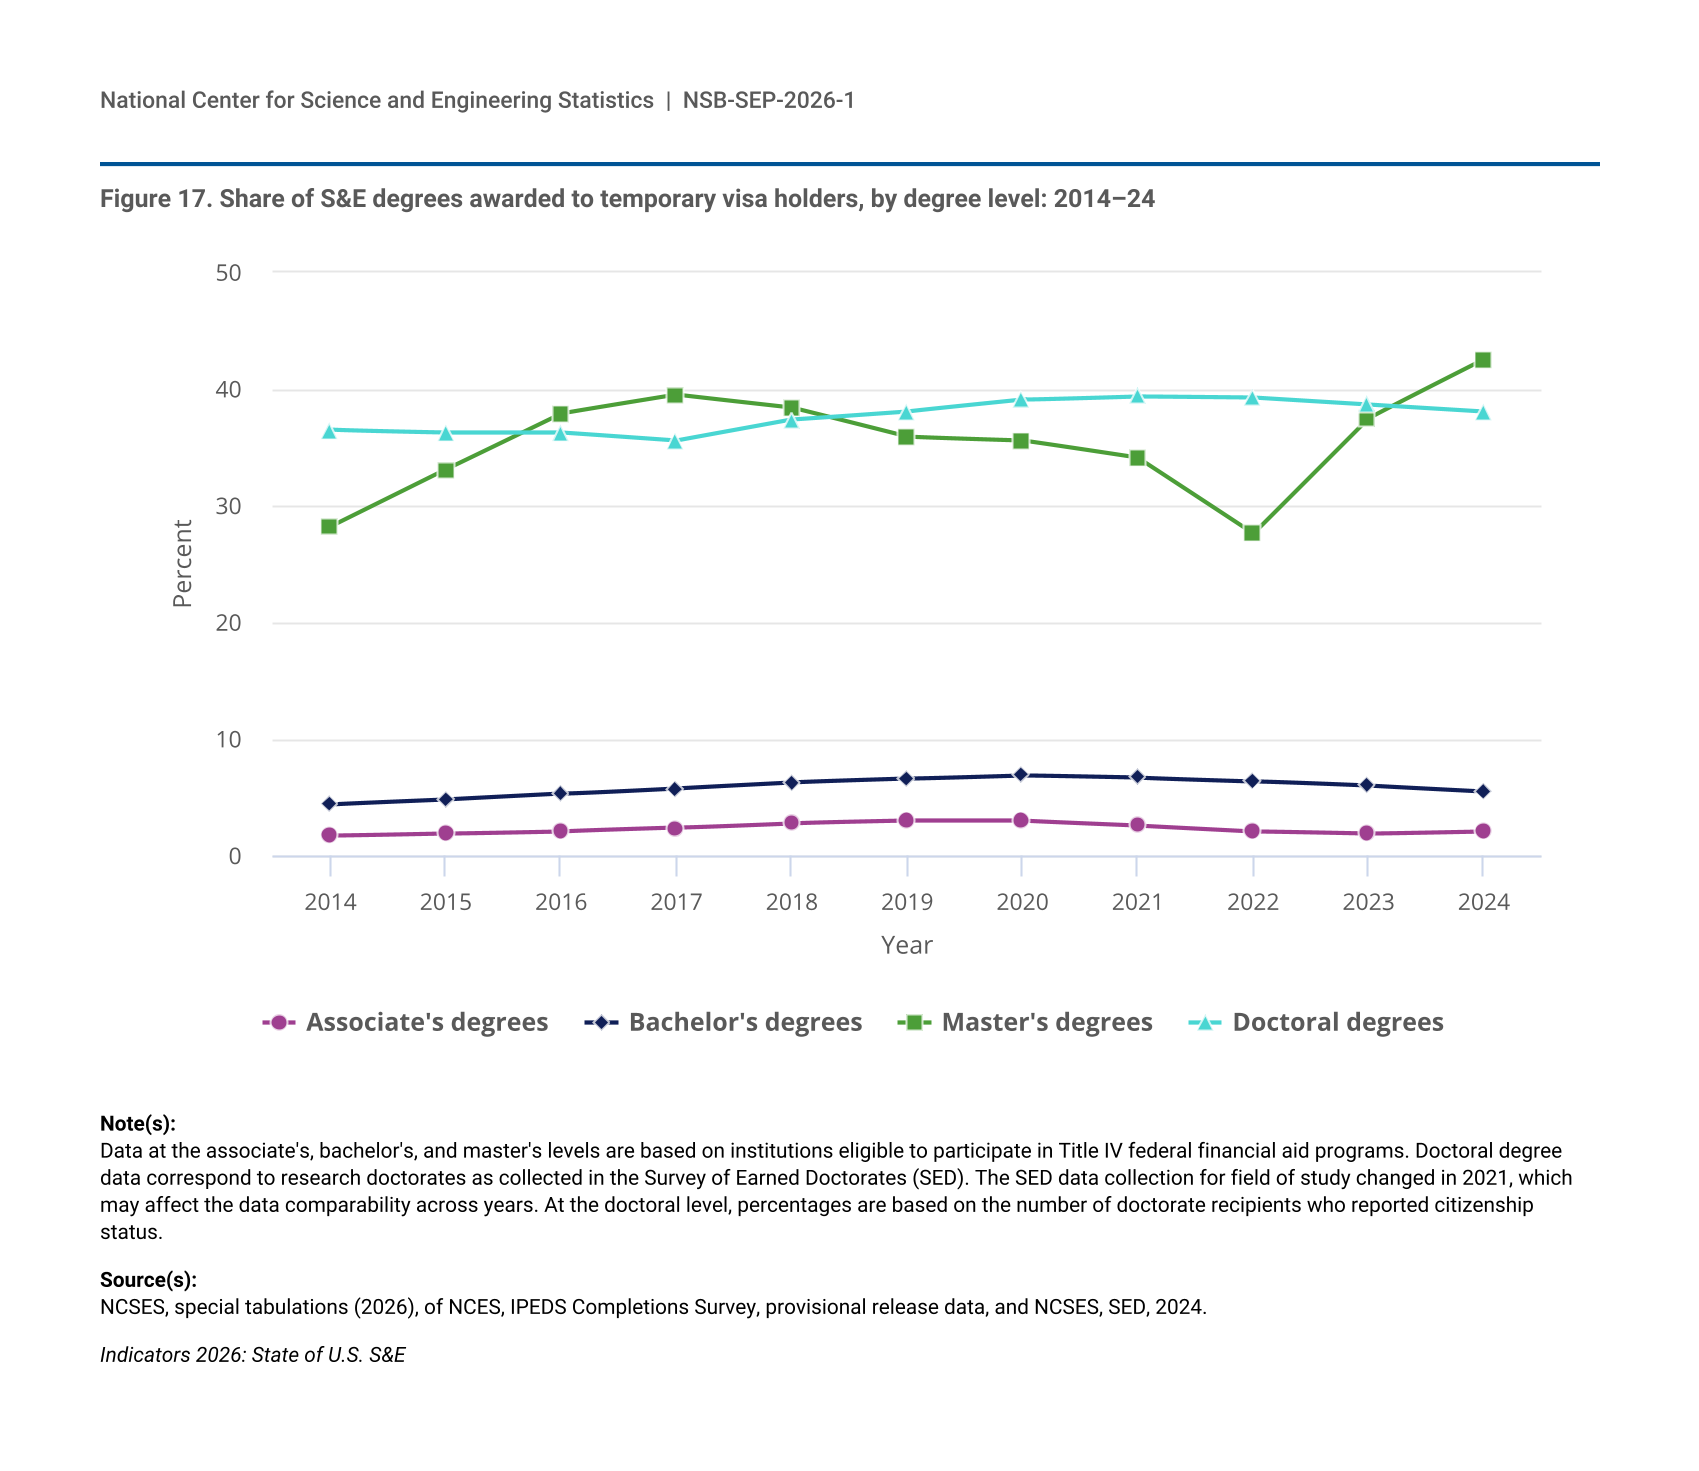
International students earn low shares of S&E undergraduate degrees awarded by U.S. higher education institutions but much higher shares of S&E graduate degrees. In 2024, temporary visa holders earned 2% of S&E associate’s degrees, 6% of S&E bachelor’s degrees, 42% of S&E master’s degrees, and 38% of S&E doctoral degrees (Figure 17). The share of S&E master’s degrees awarded to temporary visa holders has been more variable than the relatively stable shares at other degree levels. Temporary visa holders’ share of S&E master’s degrees dropped sharply from 34% in 2021 to 28% in 2022 (2 years after the beginning of the COVID-19 pandemic) before climbing to 38% in 2023 and further to 42% in 2024.
| Year | Associate's degrees | Bachelor's degrees | Master's degrees | Doctoral degrees |
|---|---|---|---|---|
| 2014 | 1.7 | 4.4 | 28.2 | 36.5 |
| 2015 | 1.9 | 4.8 | 33.1 | 36.3 |
| 2016 | 2.1 | 5.3 | 37.9 | 36.3 |
| 2017 | 2.4 | 5.8 | 39.5 | 35.6 |
| 2018 | 2.8 | 6.3 | 38.4 | 37.4 |
| 2019 | 3.0 | 6.6 | 35.9 | 38.1 |
| 2020 | 3.0 | 6.9 | 35.6 | 39.1 |
| 2021 | 2.6 | 6.7 | 34.1 | 39.4 |
| 2022 | 2.1 | 6.4 | 27.6 | 39.3 |
| 2023 | 1.9 | 6.0 | 37.5 | 38.7 |
| 2024 | 2.1 | 5.5 | 42.5 | 38.1 |
Data at the associate's, bachelor's, and master's levels are based on institutions eligible to participate in Title IV federal financial aid programs. Doctoral degree data correspond to research doctorates as collected in the Survey of Earned Doctorates (SED). The SED data collection for field of study changed in 2021, which may affect the data comparability across years. At the doctoral level, percentages are based on the number of doctorate recipients who reported citizenship status.
NCSES, special tabulations (2026), of NCES, IPEDS Completions Survey, provisional release data, and NCSES, SED, 2024.
Indicators 2026: State of U.S. S&E
The overall high presence of temporary visa holders among advanced S&E degree recipients varies greatly by S&E field (Table S6). In 2024, temporary visa holders earned 9% of doctoral degrees in psychology and 23% of those in health sciences but received more than half of doctoral degrees in computer and information sciences (61%), engineering (54%), and mathematics and statistics (52%). Temporary visa holders also accounted for more than half of the master’s degrees awarded in each of these three fields.
Stay Rates of U.S.-Trained Doctoral Scientists and Engineers
The share of S&E doctorate recipients on temporary visas intending to stay after graduation remained relatively stable at about three-fourths from 2012 to 2023 (NSB 2026a: Table TAL-17; Figure TAL-44). Longitudinal data confirm that most of these individuals do remain in the United States after earning their degrees. Among temporary visa holders earning S&E doctorates between 2017 and 2019, the short-term stay rate (approximately 5 years after graduation) was about 73% in 2023. Based on 2023 data, the long-term stay rate (approximately 10 years after graduating) for those earning degrees between 2012 and 2014 was about 68%. Short-term stay rates for S&E doctorate holders in biological, agricultural, and environmental life sciences and in health, computer and mathematical sciences, physical sciences, and engineering were roughly between 75% and 80%. Social sciences doctorate holders had a short-term stay rate of 49%. S&E doctorate holders from China, the most common country of origin, had similar short- and long-term stay rates (about 84%). In contrast, S&E doctorate holders from India, the second most common country of origin, had higher short-term stay rates (86%) than long-term stay rates (75%).
International Comparisons of S&E Doctoral Degrees
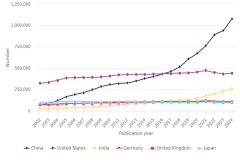
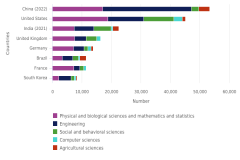
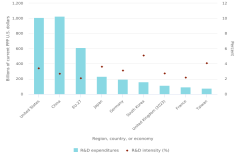
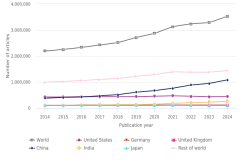
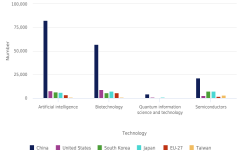
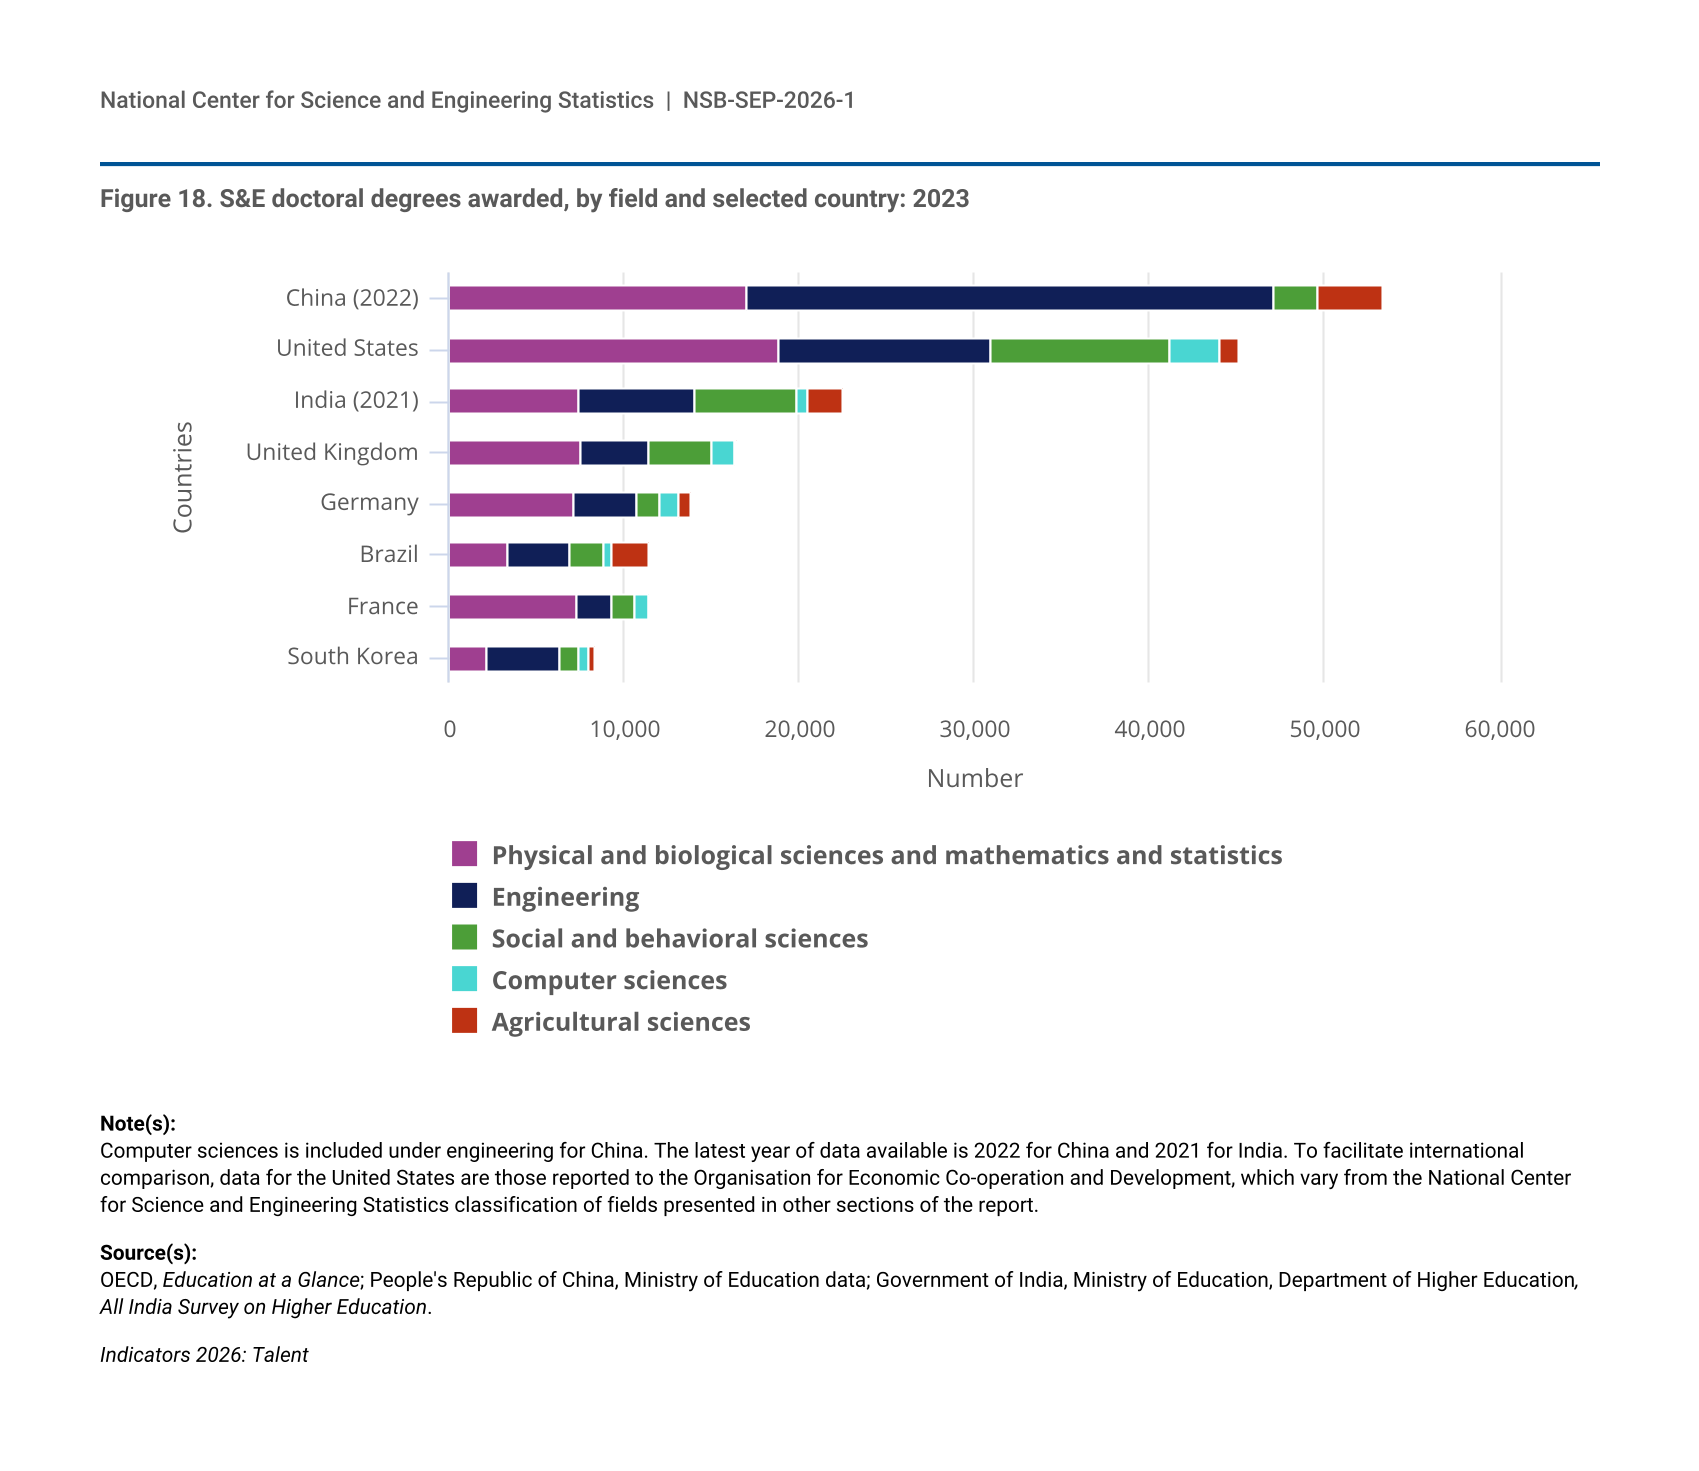
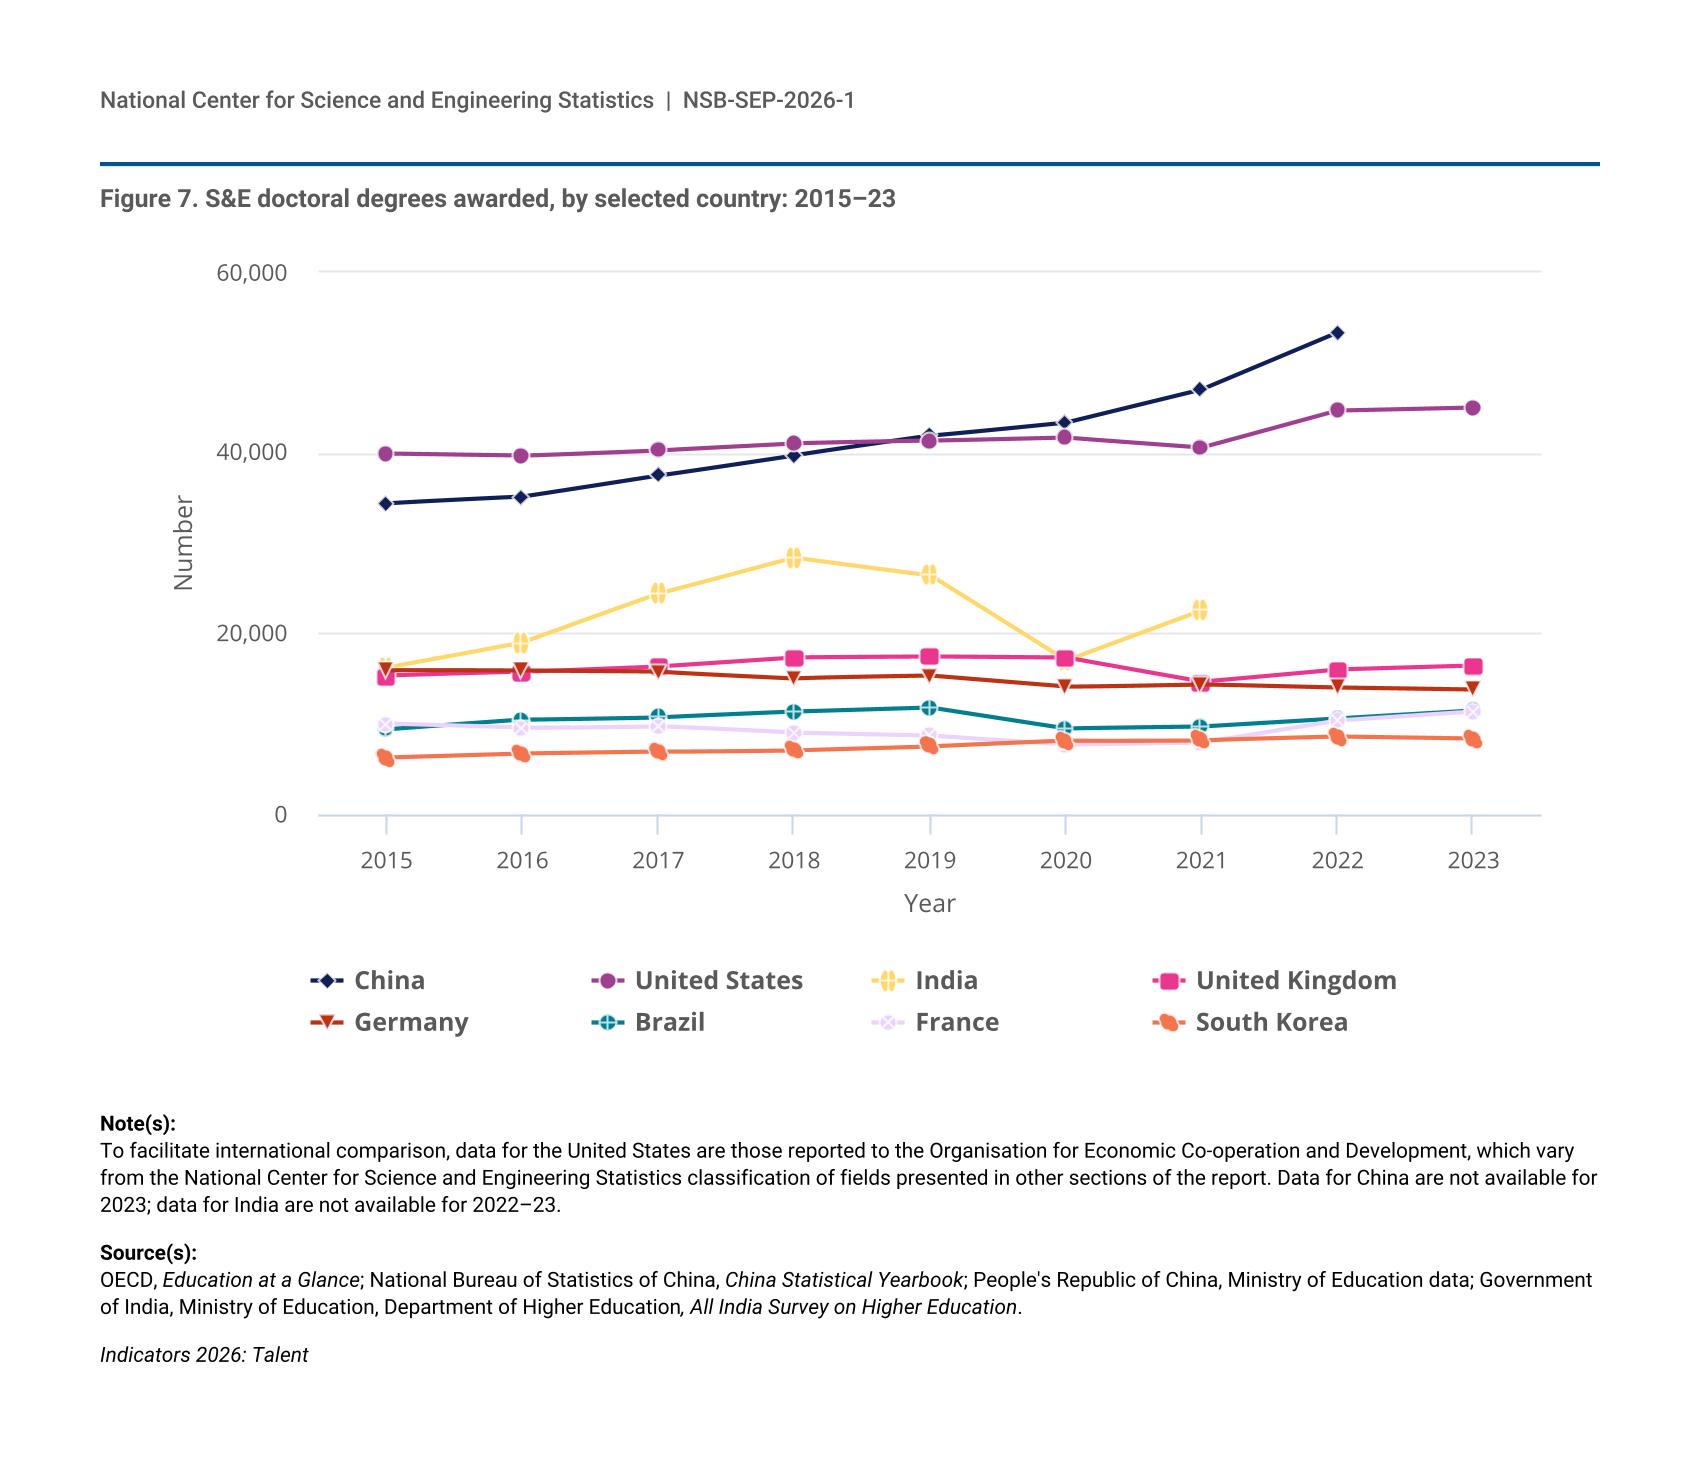
China awarded approximately 53,000 S&E doctoral degrees in 2022 (the latest data available), more than any other country. The United States, which China surpassed in 2019, was the second-highest producer of S&E doctorates, with 45,000 degrees awarded in 2023 (Figure 7). According to 2021 data (the latest available), India awarded the next-largest number of S&E doctorates (23,000). In general, physical and biological sciences and mathematics and statistics collectively accounted for the largest share of S&E doctoral degrees among the top countries (Figure 18). A majority of the S&E doctorates awarded in China (56% in 2022) and South Korea (57% in 2023) were in computer sciences or engineering. In 2022, the last year that data are available for China, it awarded 30,000 doctorates in engineering, which includes computer sciences doctorates, compared with the 15,000 combined engineering and computer science doctorates awarded in the United States in 2023.
| Countries | Physical and biological sciences and mathematics and statistics | Engineering | Social and behavioral sciences | Computer sciences | Agricultural sciences |
|---|---|---|---|---|---|
| China (2022) | 17,063 | 30,121 | 2,415 | NA | 3,786 |
| United States | 18,804 | 12,197 | 10,173 | 2,874 | 1,037 |
| India (2021) | 7,408 | 6,610 | 5,822 | 621 | 2,054 |
| United Kingdom | 7,528 | 3,933 | 3,583 | 1,218 | 184 |
| Germany | 7,174 | 3,510 | 1,361 | 1,004 | 738 |
| Brazil | 3,378 | 3,542 | 1,893 | 419 | 2,212 |
| France | 7,303 | 2,001 | 1,266 | 830 | 0 |
| South Korea | 2,145 | 4,150 | 1,095 | 585 | 365 |
Computer sciences is included under engineering for China. The latest year of data available is 2022 for China and 2021 for India. To facilitate international comparison, data for the United States are those reported to the Organisation for Economic Co-operation and Development, which vary from the National Center for Science and Engineering Statistics classification of fields presented in other sections of the report.
OECD, Education at a Glance; People's Republic of China, Ministry of Education data; Government of India, Ministry of Education, Department of Higher Education, All India Survey on Higher Education.
The STEM Workforce
Size and Composition of the U.S. STEM Workforce
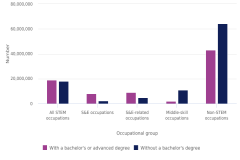
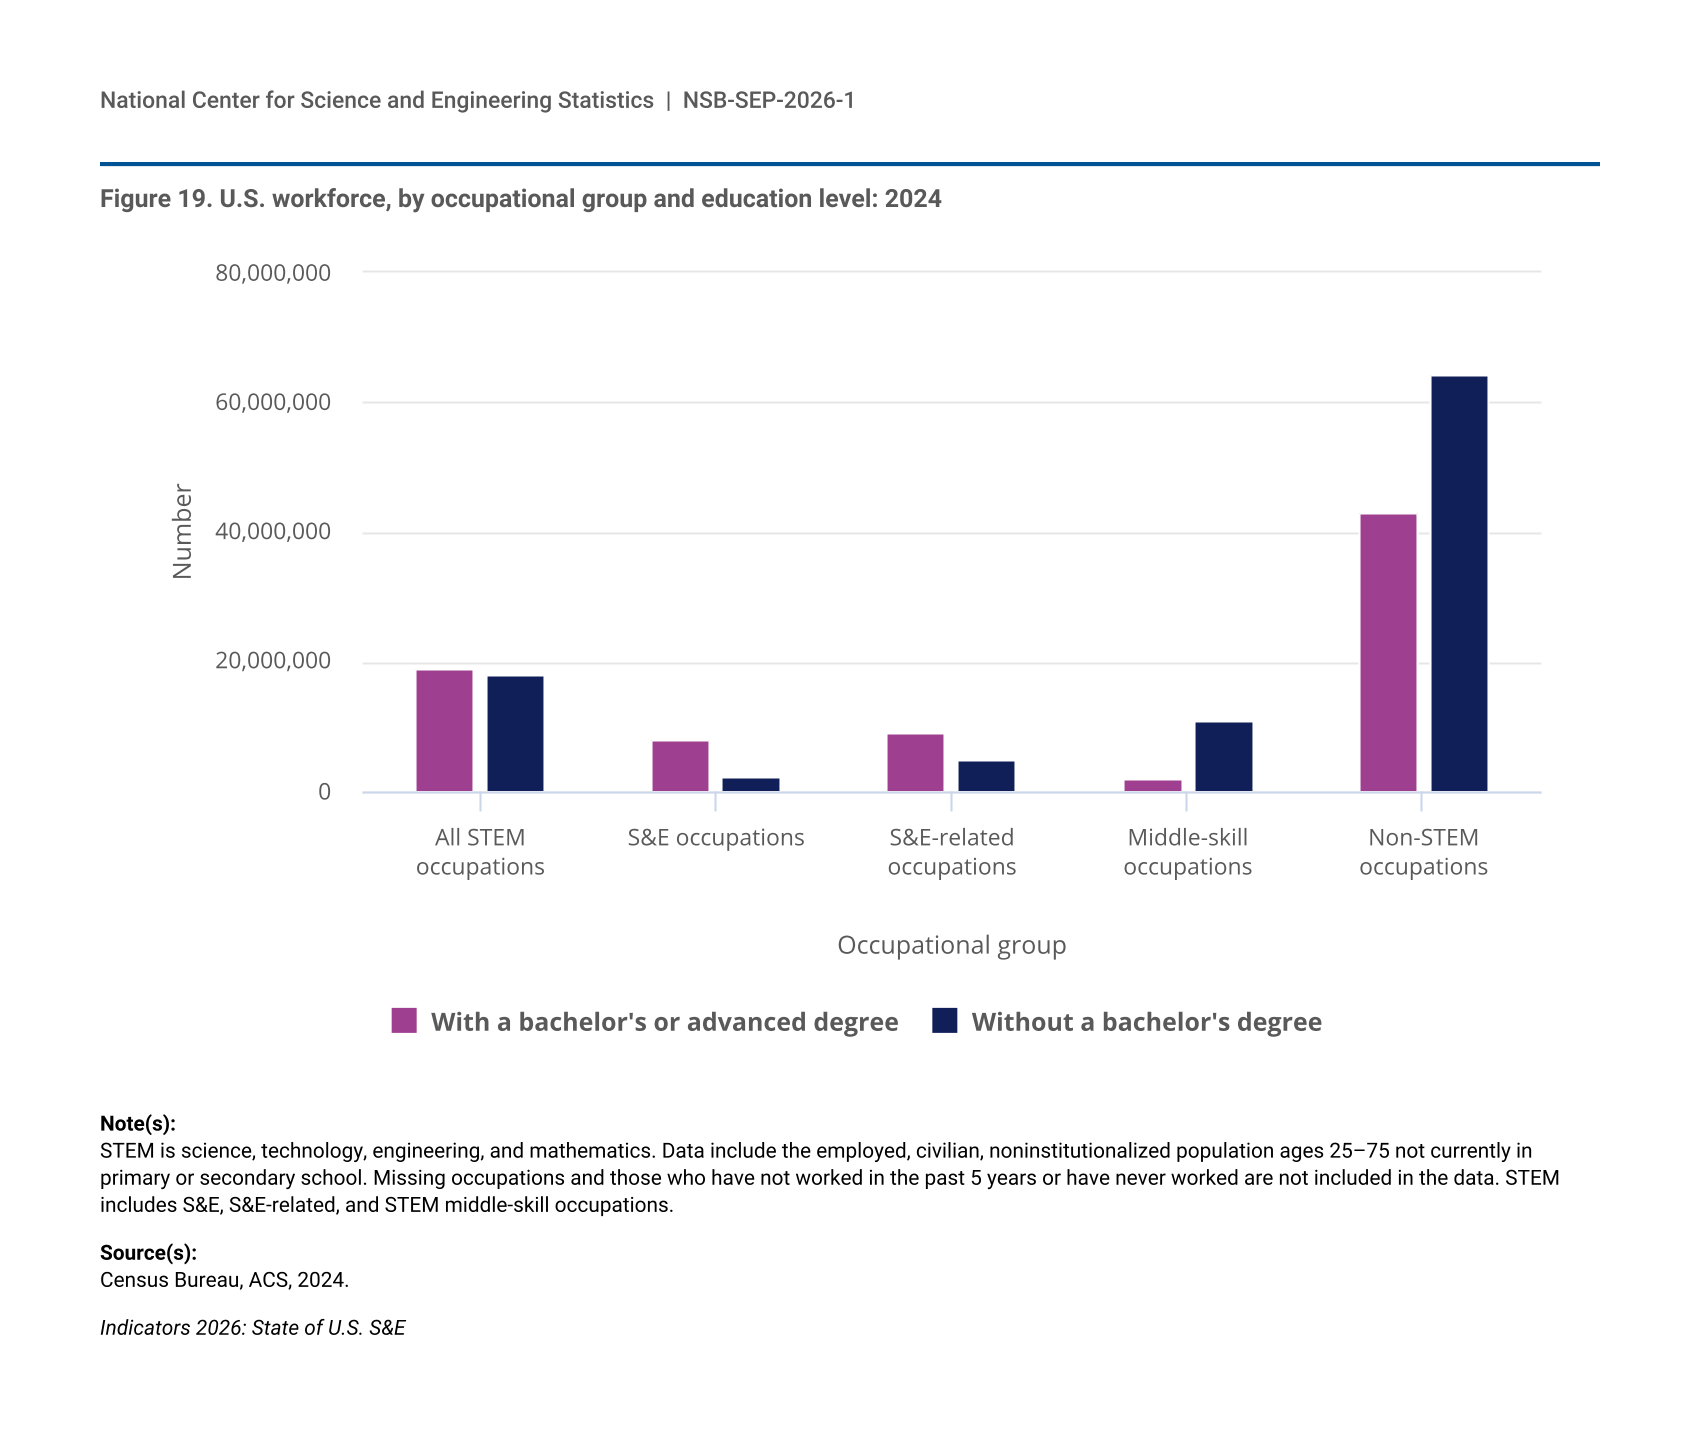
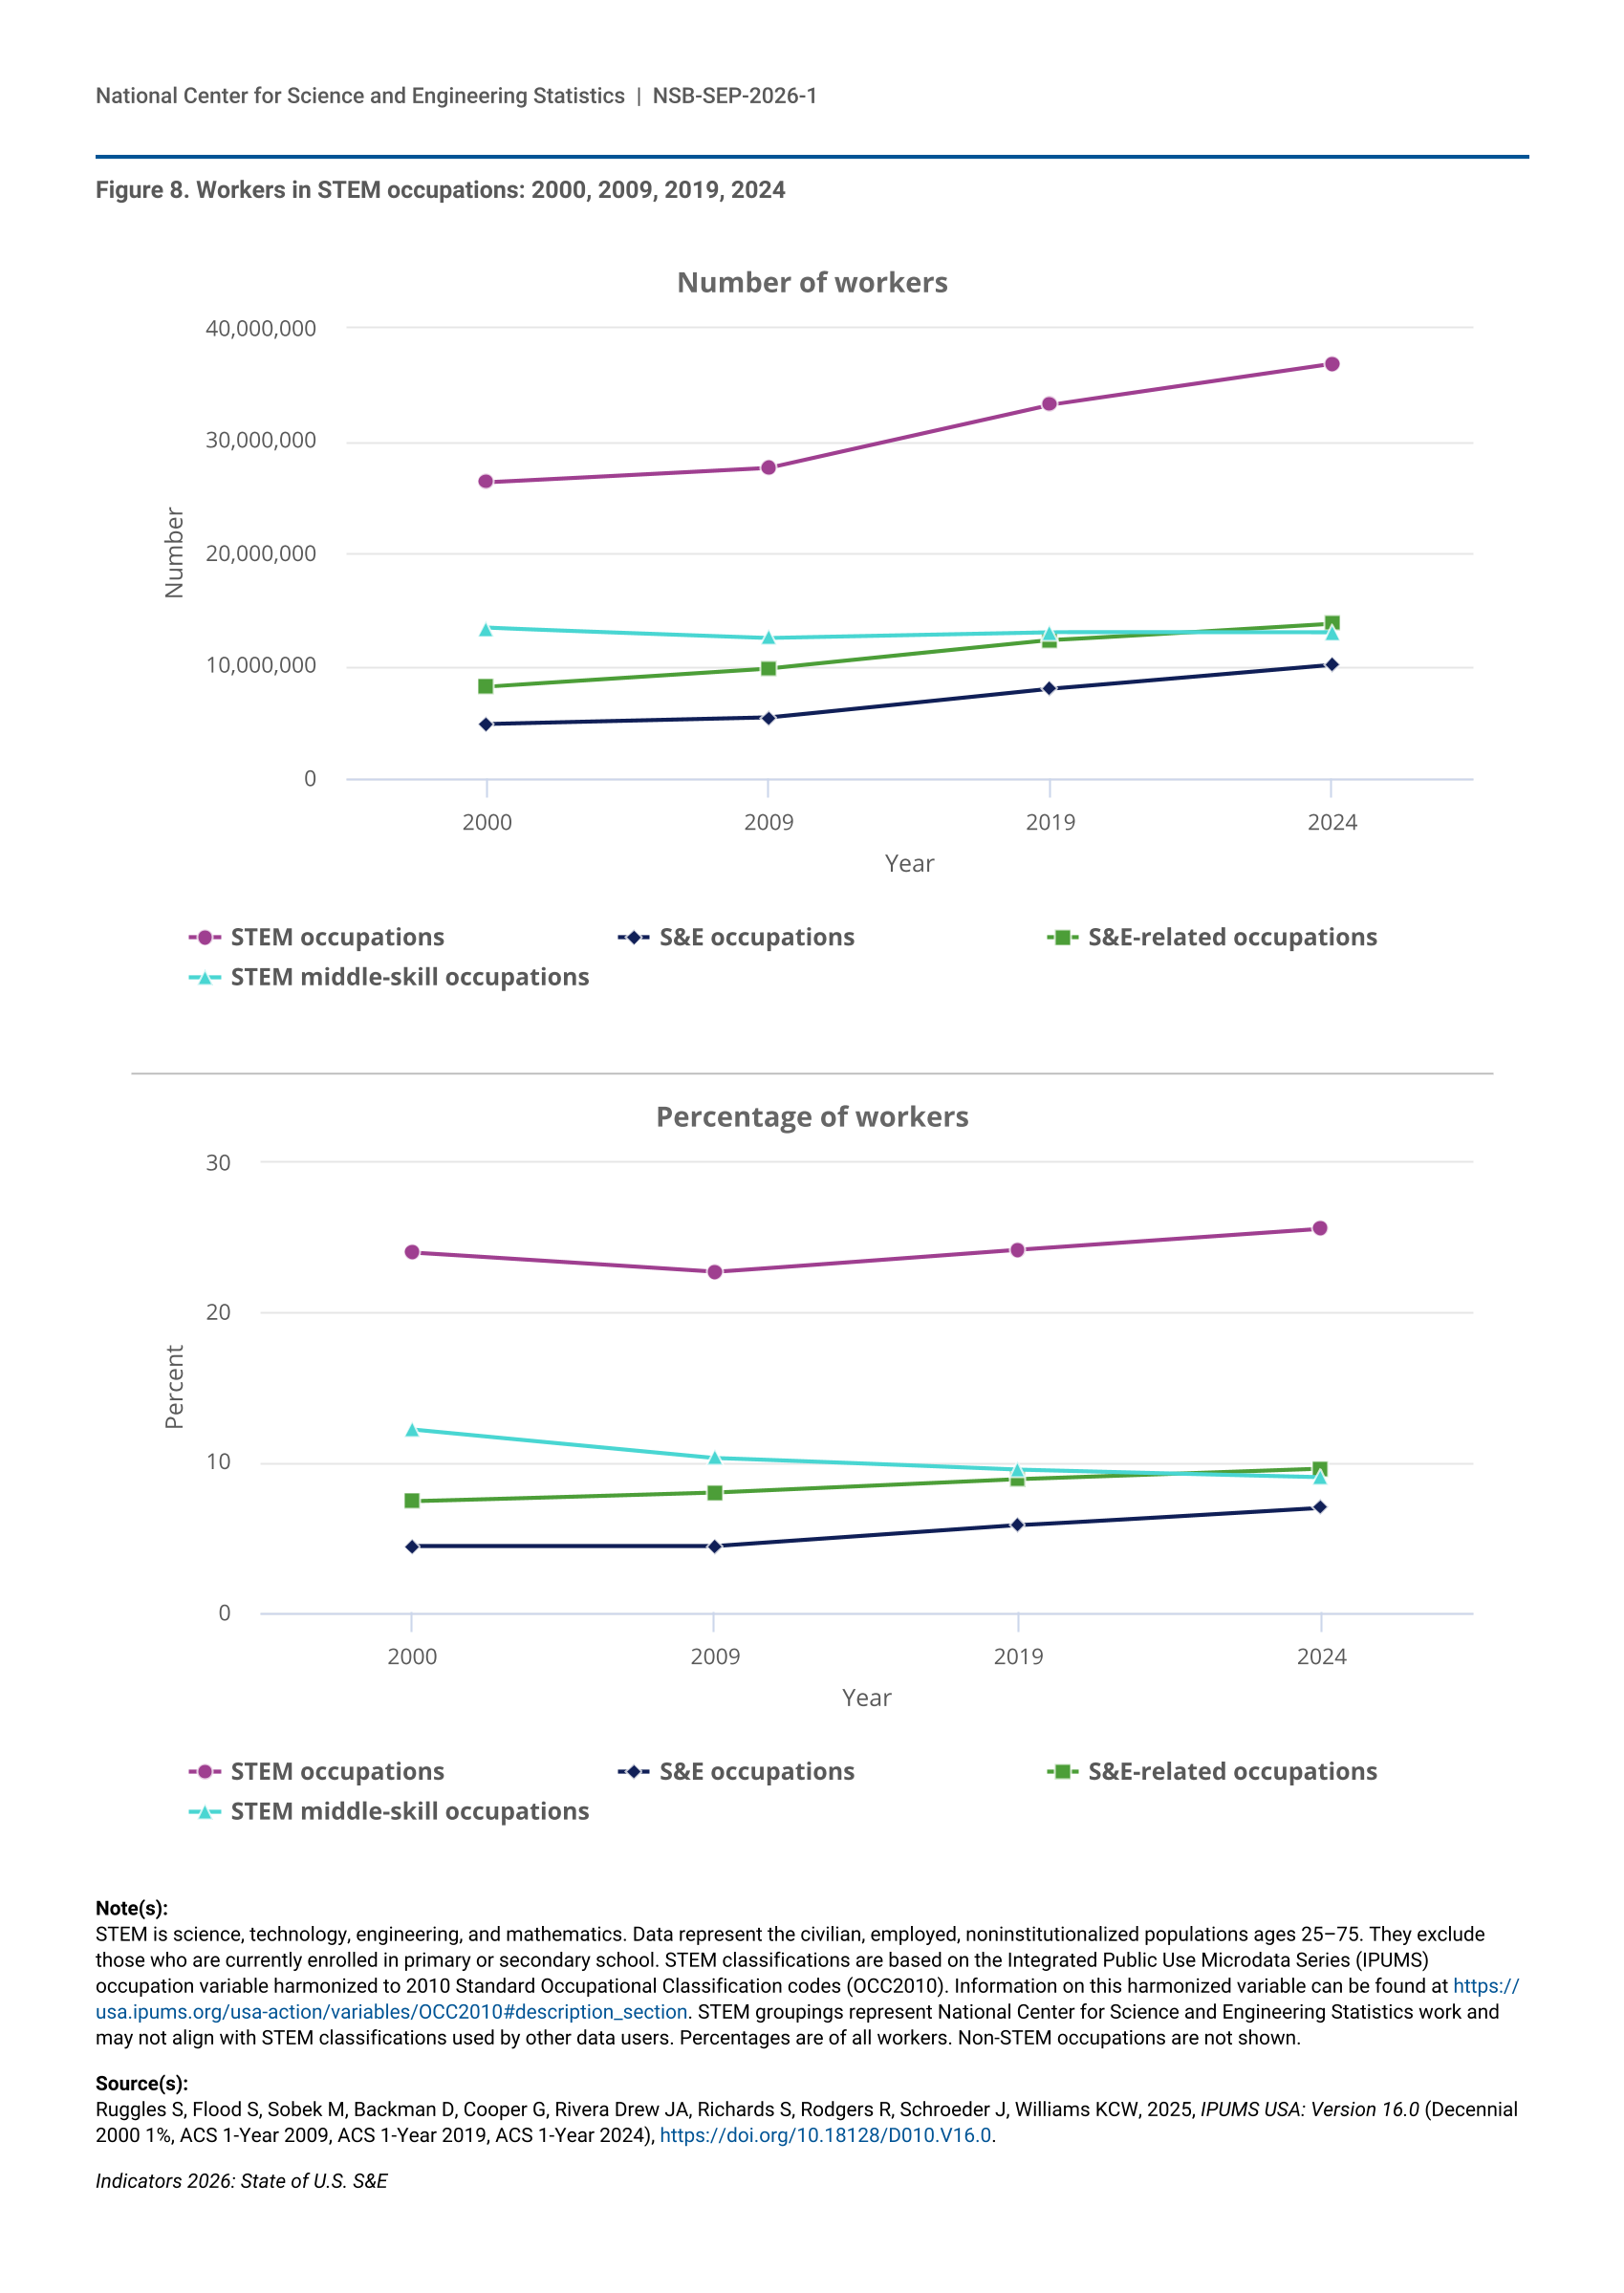
The U.S. STEM workforce included 37 million workers in 2024, making up 26% of the total U.S. workforce (Figure 19). The STEM workforce encompasses workers who use STEM skills in the primary function of their jobs, regardless of degree level. It includes S&E occupations and S&E-related occupations, as well as STEM middle-skill occupations that require STEM skills but typically do not require a bachelor’s degree for entry (see the “Glossary” section for definitions of S&E, S&E-related, and STEM middle-skill occupations). Among STEM workers, 27% were employed in S&E occupations, 37% in S&E-related occupations, and 35% in STEM middle-skill occupations. In 2024, about half (49%) of the STEM workforce did not have a bachelor’s or an advanced degree; of these workers, 62% were employed in STEM middle-skill occupations. A large majority of workers in S&E occupations had a bachelor’s or an advanced degree (79%), higher than the shares of these degrees among workers in S&E-related (65%), STEM middle-skill (15%), and non-STEM (40%) occupations.
| Occupational group | With a bachelor's or advanced degree | Without a bachelor's degree |
|---|---|---|
| All STEM occupations | 18,839,480 | 17,983,963 |
| S&E occupations | 7,965,300 | 2,131,404 |
| S&E-related occupations | 8,991,976 | 4,771,294 |
| Middle-skill occupations | 1,882,204 | 11,081,265 |
| Non-STEM occupations | 43,033,393 | 64,247,412 |
STEM is science, technology, engineering, and mathematics. Data include the employed, civilian, noninstitutionalized population ages 25–75 not currently in primary or secondary school. Missing occupations and those who have not worked in the past 5 years or have never worked are not included in the data. STEM includes S&E, S&E-related, and STEM middle-skill occupations.
Census Bureau, ACS, 2024.
Indicators 2026: State of U.S. S&E
Growth of the STEM Workforce
The STEM workforce grew from 29 million in 2014 to 37 million workers in 2024 (Table S7). Over this period, the STEM workforce increased at a faster rate than the non-STEM workforce; as a result, the STEM workforce’s share of the total U.S. workforce increased from 23% in 2014 to 26% in 2024. Within STEM occupations, the number of workers employed in S&E occupations increased most (65%) during this period, followed by S&E-related occupations (26%) and STEM middle-skill occupations (5%). According to employment projections from BLS, general employment is projected to grow by 5.2 million jobs (3%) between 2024 and 2034, with employment in STEM occupations projected to grow by 6% (Table S8). Employment in S&E occupations is expected to grow by 9% during this period, the fastest among STEM occupations, followed by S&E-related (8%) and STEM middle-skill occupations (3%).
The STEM Labor Market: Unemployment and Earnings
Labor market conditions are generally favorable for workers in STEM occupations (S&E, S&E-related, or STEM middle-skill occupations) compared with those in non-STEM occupations. In 2024, STEM workers overall had an unemployment rate of 2.4%, compared with 3.5% for non-STEM workers; the unemployment rate was lower for those in STEM occupations than for those in non-STEM occupations each year from 2014 to 2024 (Table S9). Within STEM occupation groups, S&E and S&E-related workers consistently had lower unemployment rates than workers in STEM middle-skill occupations over this period.
Full-time, year-round workers in STEM occupations had higher median annual earnings ($80,000) than workers in non-STEM occupations ($60,000) in 2024 (Table 4). Among STEM workers, those in STEM middle-skill occupations had the lowest earnings ($60,000). Workers in S&E occupations had the highest overall median earnings ($104,000) and, for the most part, had the highest earnings among all STEM occupational groups at each level of educational attainment. For all occupational groups, median earnings generally increased with each degree level.
STEM is science, technology, engineering, and mathematics. Data include the civilian, noninstitutionalized population ages 25–75 not currently in primary or secondary school. Missing occupations and those who have not worked in the past 5 years or have never worked are not included in the workforce data. STEM includes S&E, S&E-related, and middle-skill occupations.
Census Bureau, ACS, 2024.
Indicators 2026: State of U.S. S&E
Geographic Patterns of the STEM Workforce
In 2024, the three states with the largest working-age populations—California, Texas, and Florida—were also the states with the largest numbers of STEM workers (Table S10). Together, these three states made up about a quarter (26%) of the nation’s STEM workforce. Among the 50 states and the District of Columbia, Vermont and Washington had the highest shares of their workforce in STEM occupations (29% each), and Nevada (21%) had the lowest share. West Virginia had the largest share of STEM workers without a bachelor’s degree (65%). The District of Columbia had the highest share of STEM workers with a bachelor’s or an advanced degree (86%), followed by Massachusetts (63%). In 2023, equal proportions of rural and urban workers were employed in STEM occupations (25%), although the distribution of STEM occupational groups differed. STEM middle-skill occupations accounted for 13% of all workers in rural areas and for 9% in urban areas. S&E occupations were less common in rural areas: whereas 3% of rural workers were in S&E occupations, 7% of urban workers were in S&E occupations.
STEM Workers in the Economy and R&D-Intensive Industries
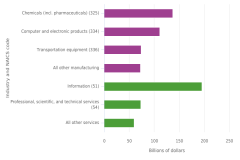
All major industries of the U.S. economy employ STEM workers, but they do so at differing rates. In 2024, the health care and social assistance sector (47%) and the utilities sector (45%) had the highest shares of workers in STEM occupations among major industrial sectors (Table S11). Within the STEM workforce, the professional, scientific, and technical services sector (26%) and the information sector (17%) employed the highest shares of workers in S&E occupations. The health care and social assistance sector, which accounted for over a quarter (27%) of the total STEM workforce, employed the highest share of S&E-related workers, accounting for 43% of its workforce. The construction sector (36%) and the agriculture, forestry, fishing, and hunting sector (35%) employed the highest share of workers in STEM middle-skill occupations.
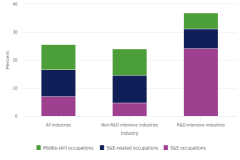
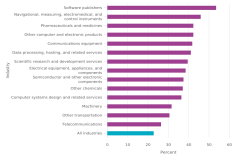
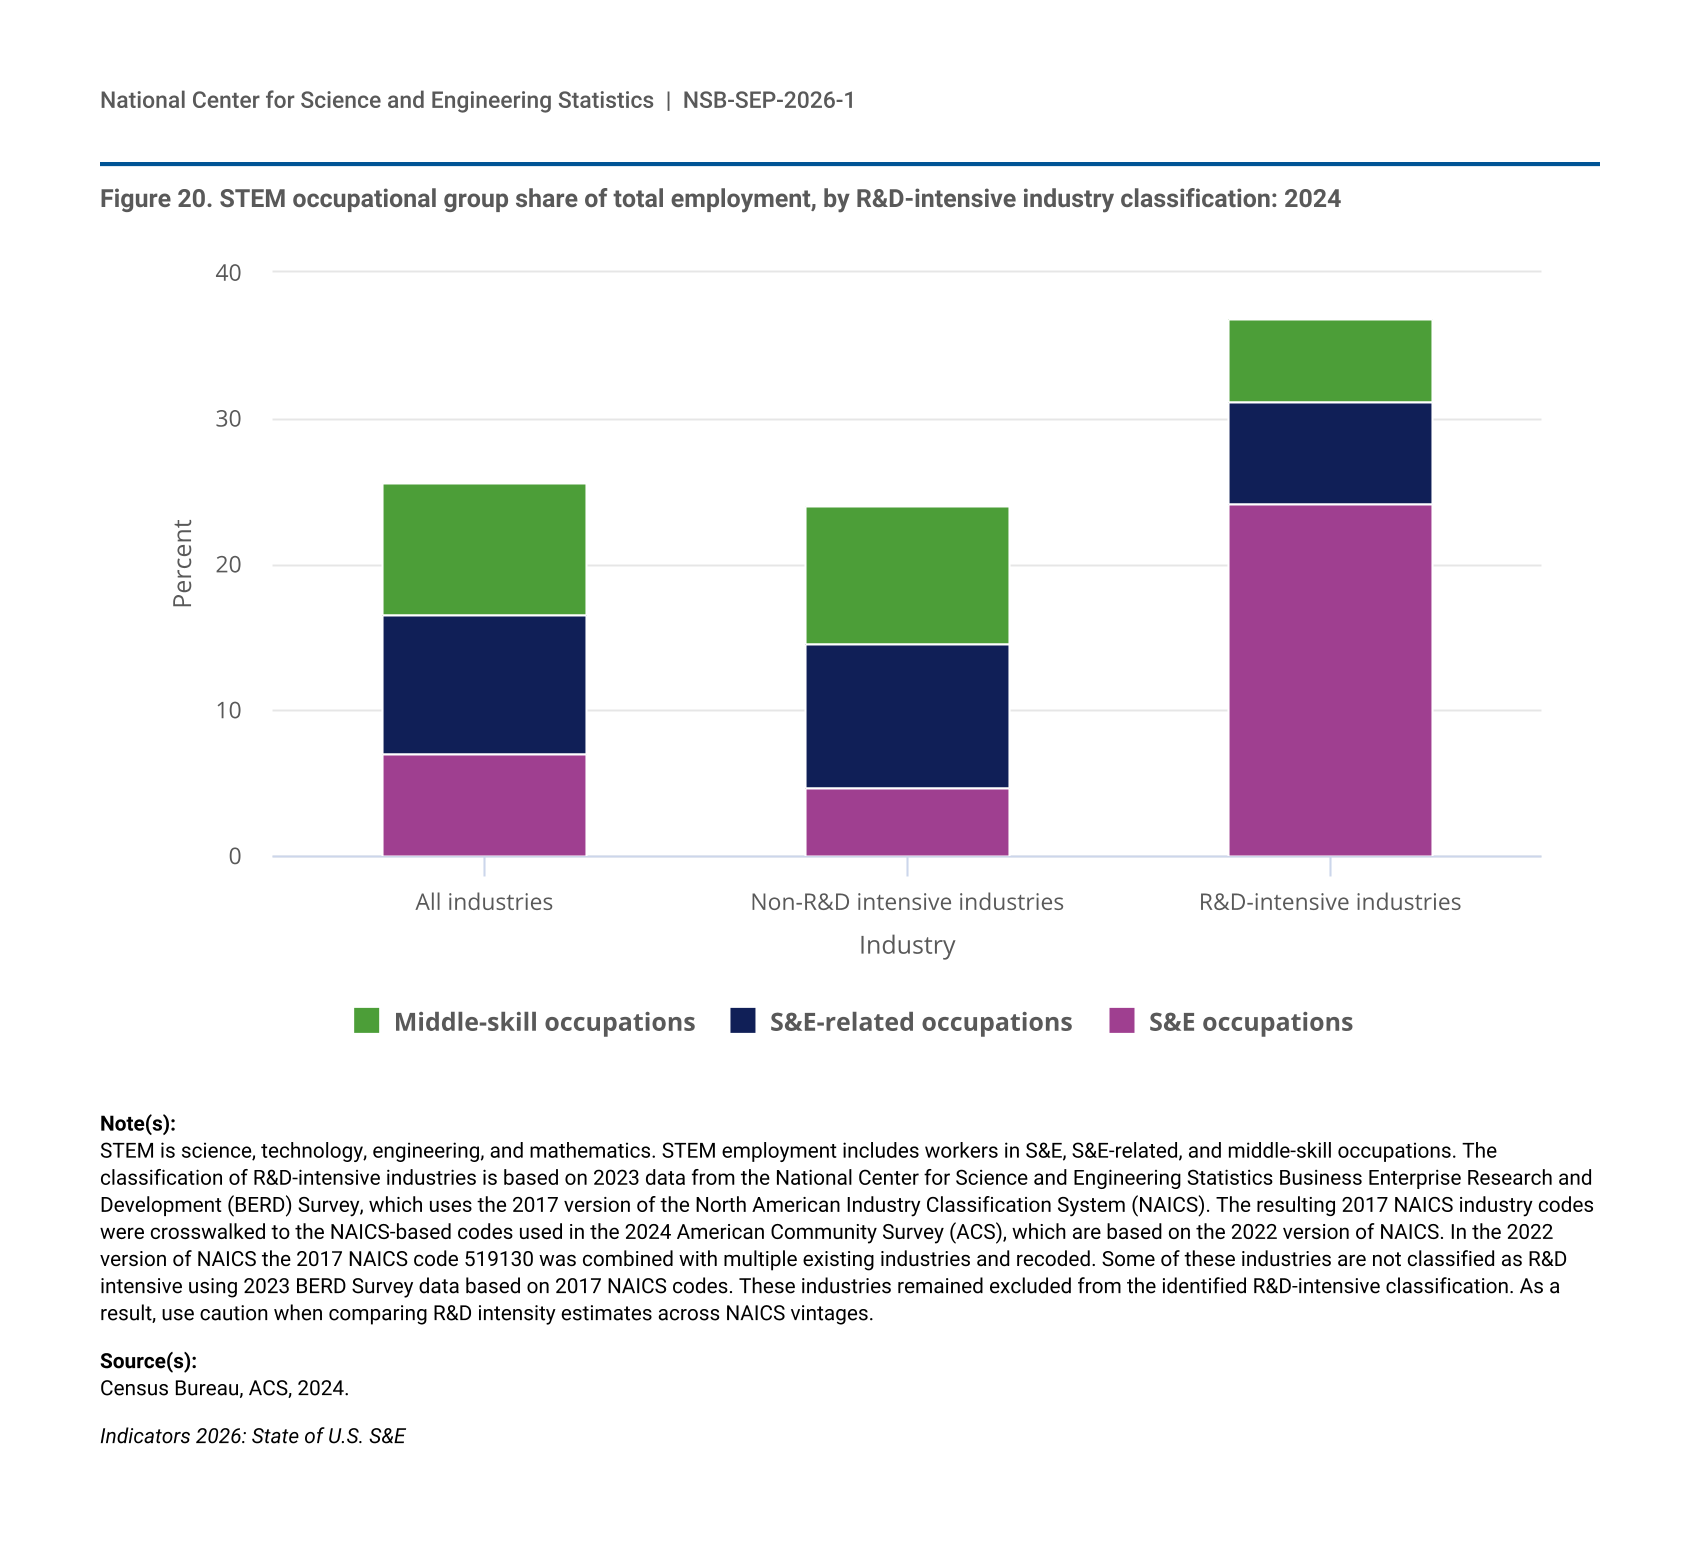
R&D-intensive industries are an important component of the nation’s innovation system (see the “Glossary” section for the definition of R&D intensity and Table S12 for a list of industries with higher than average R&D intensity). In 2024, 12% of the total workforce and 17% of the STEM workforce were employed in R&D-intensive industries (Table S13). The percentage of STEM workers employed in R&D-intensive industries varied by occupational group: 40% of workers in S&E occupations were employed in R&D-intensive industries, compared with 8% of workers in S&E-related occupations and 7% of workers in STEM middle-skill occupations. STEM workers are integral to R&D-intensive industries, where they accounted for 37% of employment in R&D-intensive industries in 2024, compared with 26% of all industries (Figure 20). Workers in S&E occupations have a particularly pronounced role in R&D-intensive industries, where they account for 24% of total employment in R&D-intensive industries, nearly five times their share of non-R&D intensive industry employment (5%).
| Industry | S&E occupations | S&E-related occupations | Middle-skill occupations |
|---|---|---|---|
| All industries | 7.0 | 9.6 | 9.0 |
| Non-R&D intensive industries | 4.7 | 9.9 | 9.4 |
| R&D-intensive industries | 24.2 | 6.9 | 5.7 |
STEM is science, technology, engineering, and mathematics. STEM employment includes workers in S&E, S&E-related, and middle-skill occupations. The classification of R&D-intensive industries is based on 2023 data from the National Center for Science and Engineering Statistics Business Enterprise Research and Development (BERD) Survey, which uses the 2017 version of the North American Industry Classification System (NAICS). The resulting 2017 NAICS industry codes were crosswalked to the NAICS-based codes used in the 2024 American Community Survey (ACS), which are based on the 2022 version of NAICS. In the 2022 version of NAICS the 2017 NAICS code 519130 was combined with multiple existing industries and recoded. Some of these industries are not classified as R&D intensive using 2023 BERD Survey data based on 2017 NAICS codes. These industries remained excluded from the identified R&D-intensive classification. As a result, use caution when comparing R&D intensity estimates across NAICS vintages.
Census Bureau, ACS, 2024.
Indicators 2026: State of U.S. S&E
Demographics of the STEM Workforce
Participation in the STEM workforce varies by sex and by race and ethnicity. The STEM workforce overall is predominantly male: of the 37 million STEM workers in 2024, 64% were men (Table S14). Male workers accounted for about three-fourths (72%) of those employed in S&E occupations and the vast majority of those in STEM middle-skill occupations (89%), whereas most individuals employed in S&E-related occupations were female workers (65%). In 2024, 39% of all Asian workers were employed in STEM occupations, the highest share of any racial or ethnic group, followed by White workers at 27%. Between 20% and 22% of Black or African American, Hispanic or Latino, American Indian or Alaska Native, and Native Hawaiian or Other Pacific Islander workers were employed in STEM occupations.
Veterans in the STEM Workforce
A higher share of veterans than nonveterans were employed in the domestic STEM workforce. In 2024, the overall domestic workforce employed a lower share of military veterans (59%) than nonveterans (69%) among the civilian, noninstitutionalized, population ages 25–75. However, among those employed, a higher proportion of military veterans (33%) than nonveterans (25%) were employed in STEM occupations (Table 5). Among occupational groups, higher shares of veterans were employed in STEM middle-skill occupations (15%) and S&E occupations (10%), compared with their nonveteran counterparts (9% and 7%, respectively). Majorities of employed veterans (63%) and nonveterans (57%) in the workforce did not have a bachelor’s degree, but among workers without a bachelor’s degree, a higher proportion of veterans (32%) than nonveterans (21%) were employed in STEM occupations, particularly in STEM middle-skill occupations (20% and 13%, respectively).
STEM is science, technology, engineering, and mathematics. Data include the civilian, noninstitutionalized population ages 25–75 and exclude those with military occupations, those missing occupation data, and those currently enrolled in primary or secondary school. Workforce estimates include those who are currently employed.
Census Bureau, ACS, 2024, 1-Year Public Use Files.
Indicators 2026: State of U.S. S&E
Foreign-Born STEM Workers
Foreign-born workers—individuals born outside of the United States and its territories, regardless of citizenship status—are more highly represented in the STEM workforce than in the general workforce. In 2024 foreign-born individuals accounted for 21% (30 million) of the 144 million workers in the United States, and 22% (8 million) of the 37 million STEM workers (Table S15). Within the STEM workforce, the foreign-born share of workers was 19% in S&E-related occupations, 22% in STEM middle-skill occupations, and 28% in S&E occupations. Mexico was the largest country of origin for foreign-born workers in STEM occupations overall (1.4 million), although only 10% of these workers were in S&E occupations. India and China were the top countries of origin for workers in S&E occupations, where they accounted for 29% and 12%, respectively, of all foreign-born workers in S&E occupations.
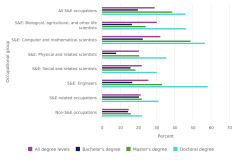
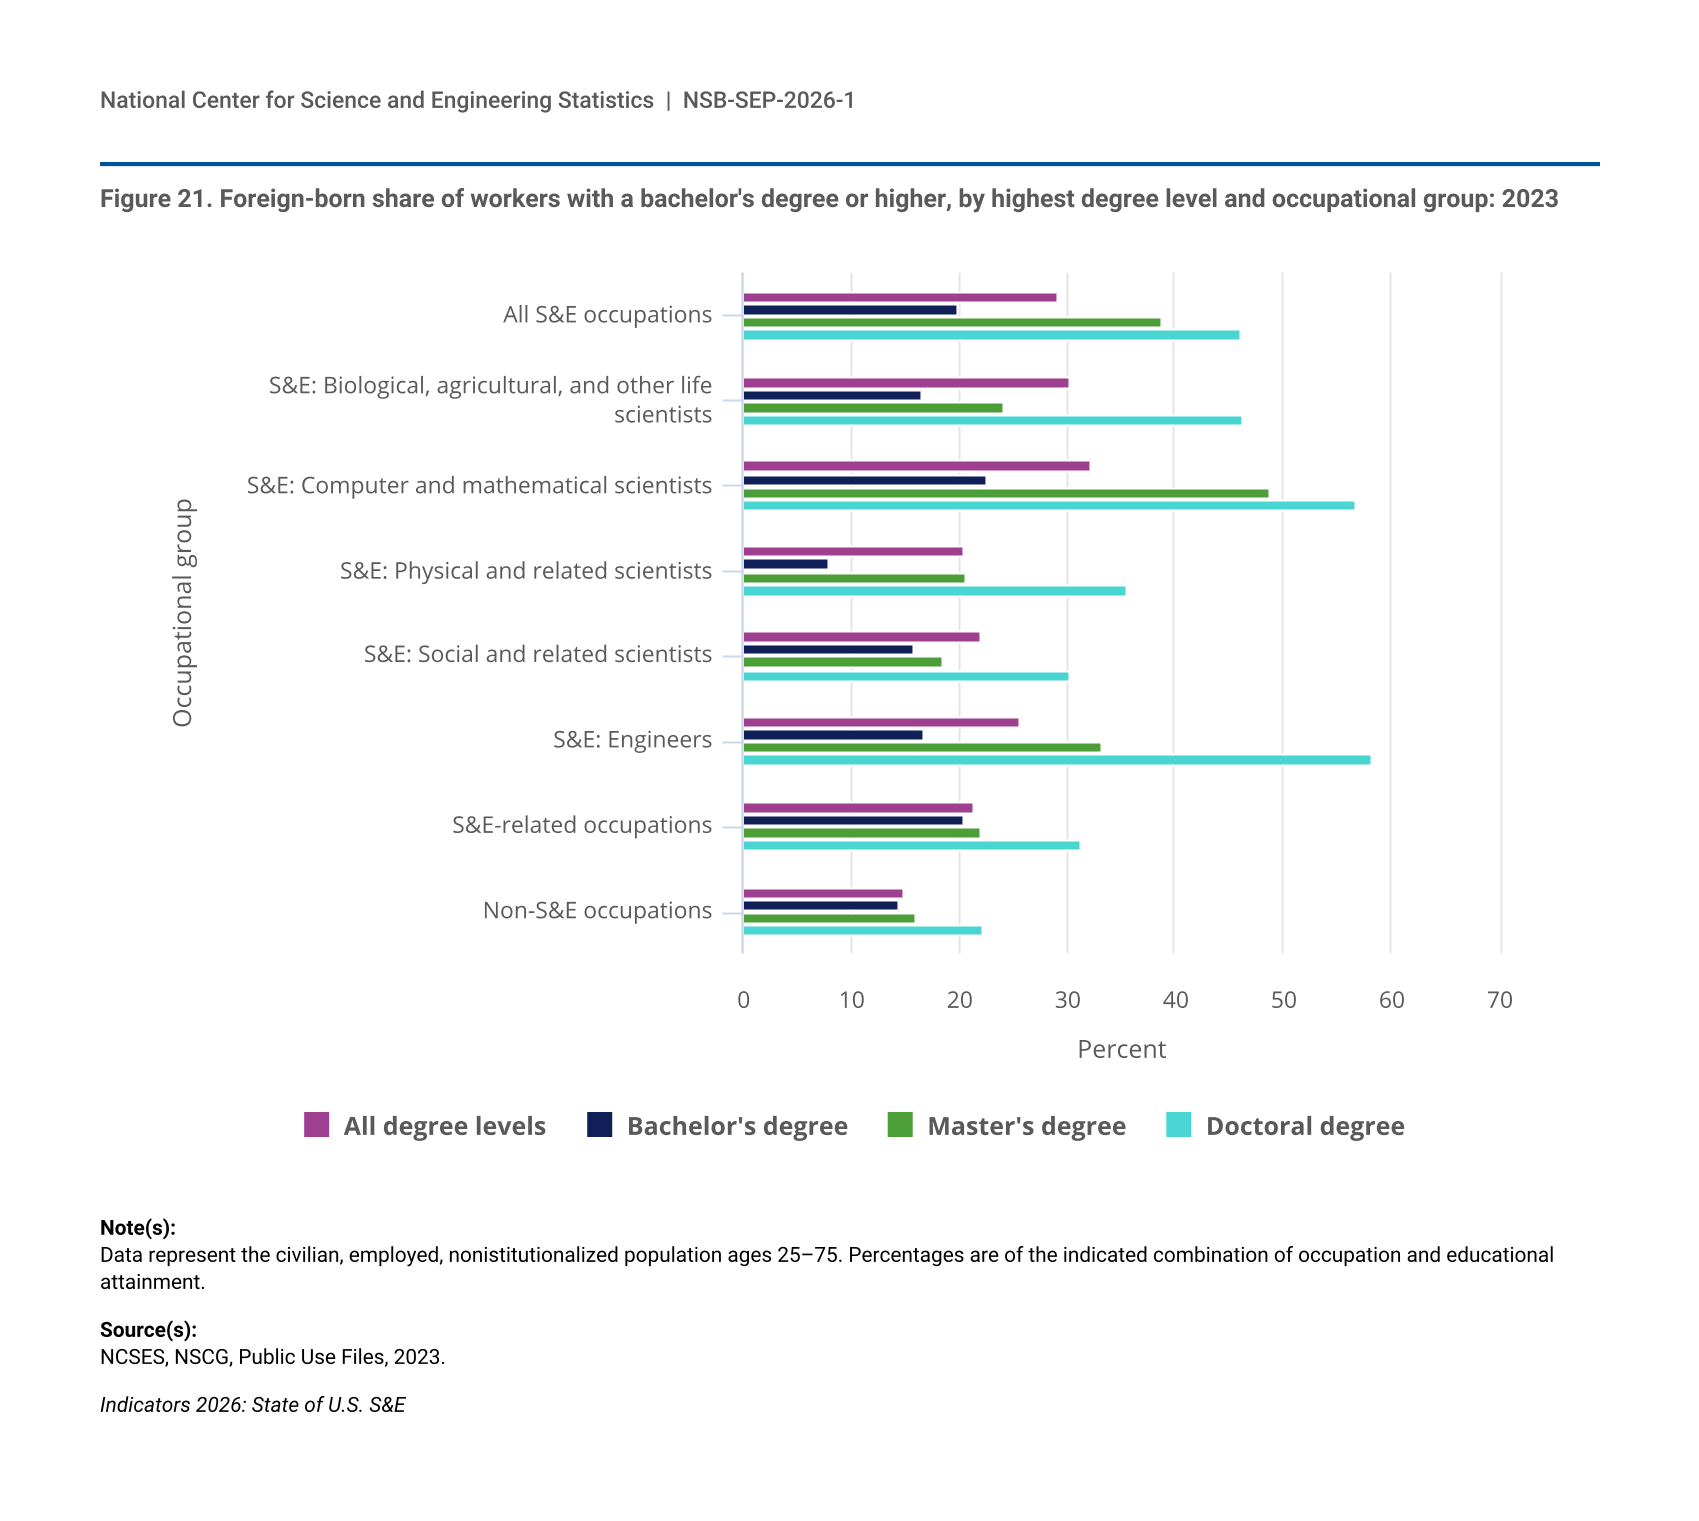
Foreign-born individuals make up an especially large share of U.S. S&E workers with higher levels of educational attainment. In 2023, they accounted for 20% of S&E workers with a bachelor’s degree as their highest degree, 39% with a master’s degree, and 46% with a doctoral degree (Figure 21). The majority of doctoral-level computer and mathematical scientists (57%) and engineers (58%) working in the United States in 2023 were born outside the country. About half (49%) of computer and mathematical scientists with master’s degrees were foreign born.
| Occupational group | All degree levels | Bachelor's degree | Master's degree | Doctoral degree |
|---|---|---|---|---|
| All S&E occupations | 29.1 | 19.9 | 38.8 | 46.0 |
| S&E: Biological, agricultural, and other life scientists | 30.3 | 16.6 | 24.1 | 46.2 |
| S&E: Computer and mathematical scientists | 32.3 | 22.5 | 48.8 | 56.6 |
| S&E: Physical and related scientists | 20.5 | 8.0 | 20.7 | 35.4 |
| S&E: Social and related scientists | 22.0 | 15.8 | 18.6 | 30.2 |
| S&E: Engineers | 25.6 | 16.7 | 33.1 | 58.3 |
| S&E-related occupations | 21.5 | 20.5 | 22.0 | 31.2 |
| Non-S&E occupations | 14.9 | 14.4 | 16.1 | 22.1 |
Data represent the civilian, employed, nonistitutionalized population ages 25–75. Percentages are of the indicated combination of occupation and educational attainment.
NCSES, NSCG, Public Use Files, 2023.
Indicators 2026: State of U.S. S&E
Foreign-born individuals collectively account for 29% of the nation’s college-educated S&E workforce, but a comparatively small share of individuals working in S&E occupations are non-U.S. citizens on temporary visas (Figure 21; Table S16). In 2023, temporary residents accounted for 3% of all S&E workers at the bachelor’s level, 11% at the master’s level, and 10% at the doctorate level (Table S16). Combined, over three-quarters of foreign-born S&E workers in the United States in 2023 were naturalized citizens (55%) or permanent residents (21%), temporary visa holders accounted for 24%. Additionally, across degree levels (bachelor’s, master’s, and doctoral) and broad S&E occupations, native-born and naturalized citizens combined account for most S&E workers. In 2023, 71% of computer and mathematical scientists and 73% of engineers at the doctorate level were either native-born or naturalized U.S. citizens.
