 An official website of the United States government
 Discovery: R&D Activity and Research Publications
R&D and one of its early outputs, research publications, are important indicators of the performance of the U.S. S&E ecosystem in a global context. R&D contributes to economic output and productivity growth and supports a range of national policy priorities. Research publications, in the form of peer-reviewed journal articles and conference proceedings, are important media for sharing scientific discoveries and contribute to a corpus of scientific knowledge that provides a foundation for future research and innovation.
Global R&D
Total R&D Expenditures
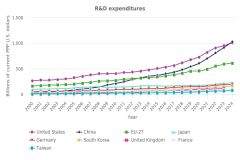
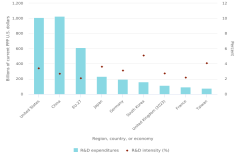
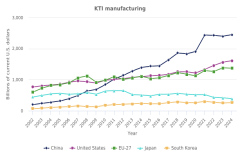
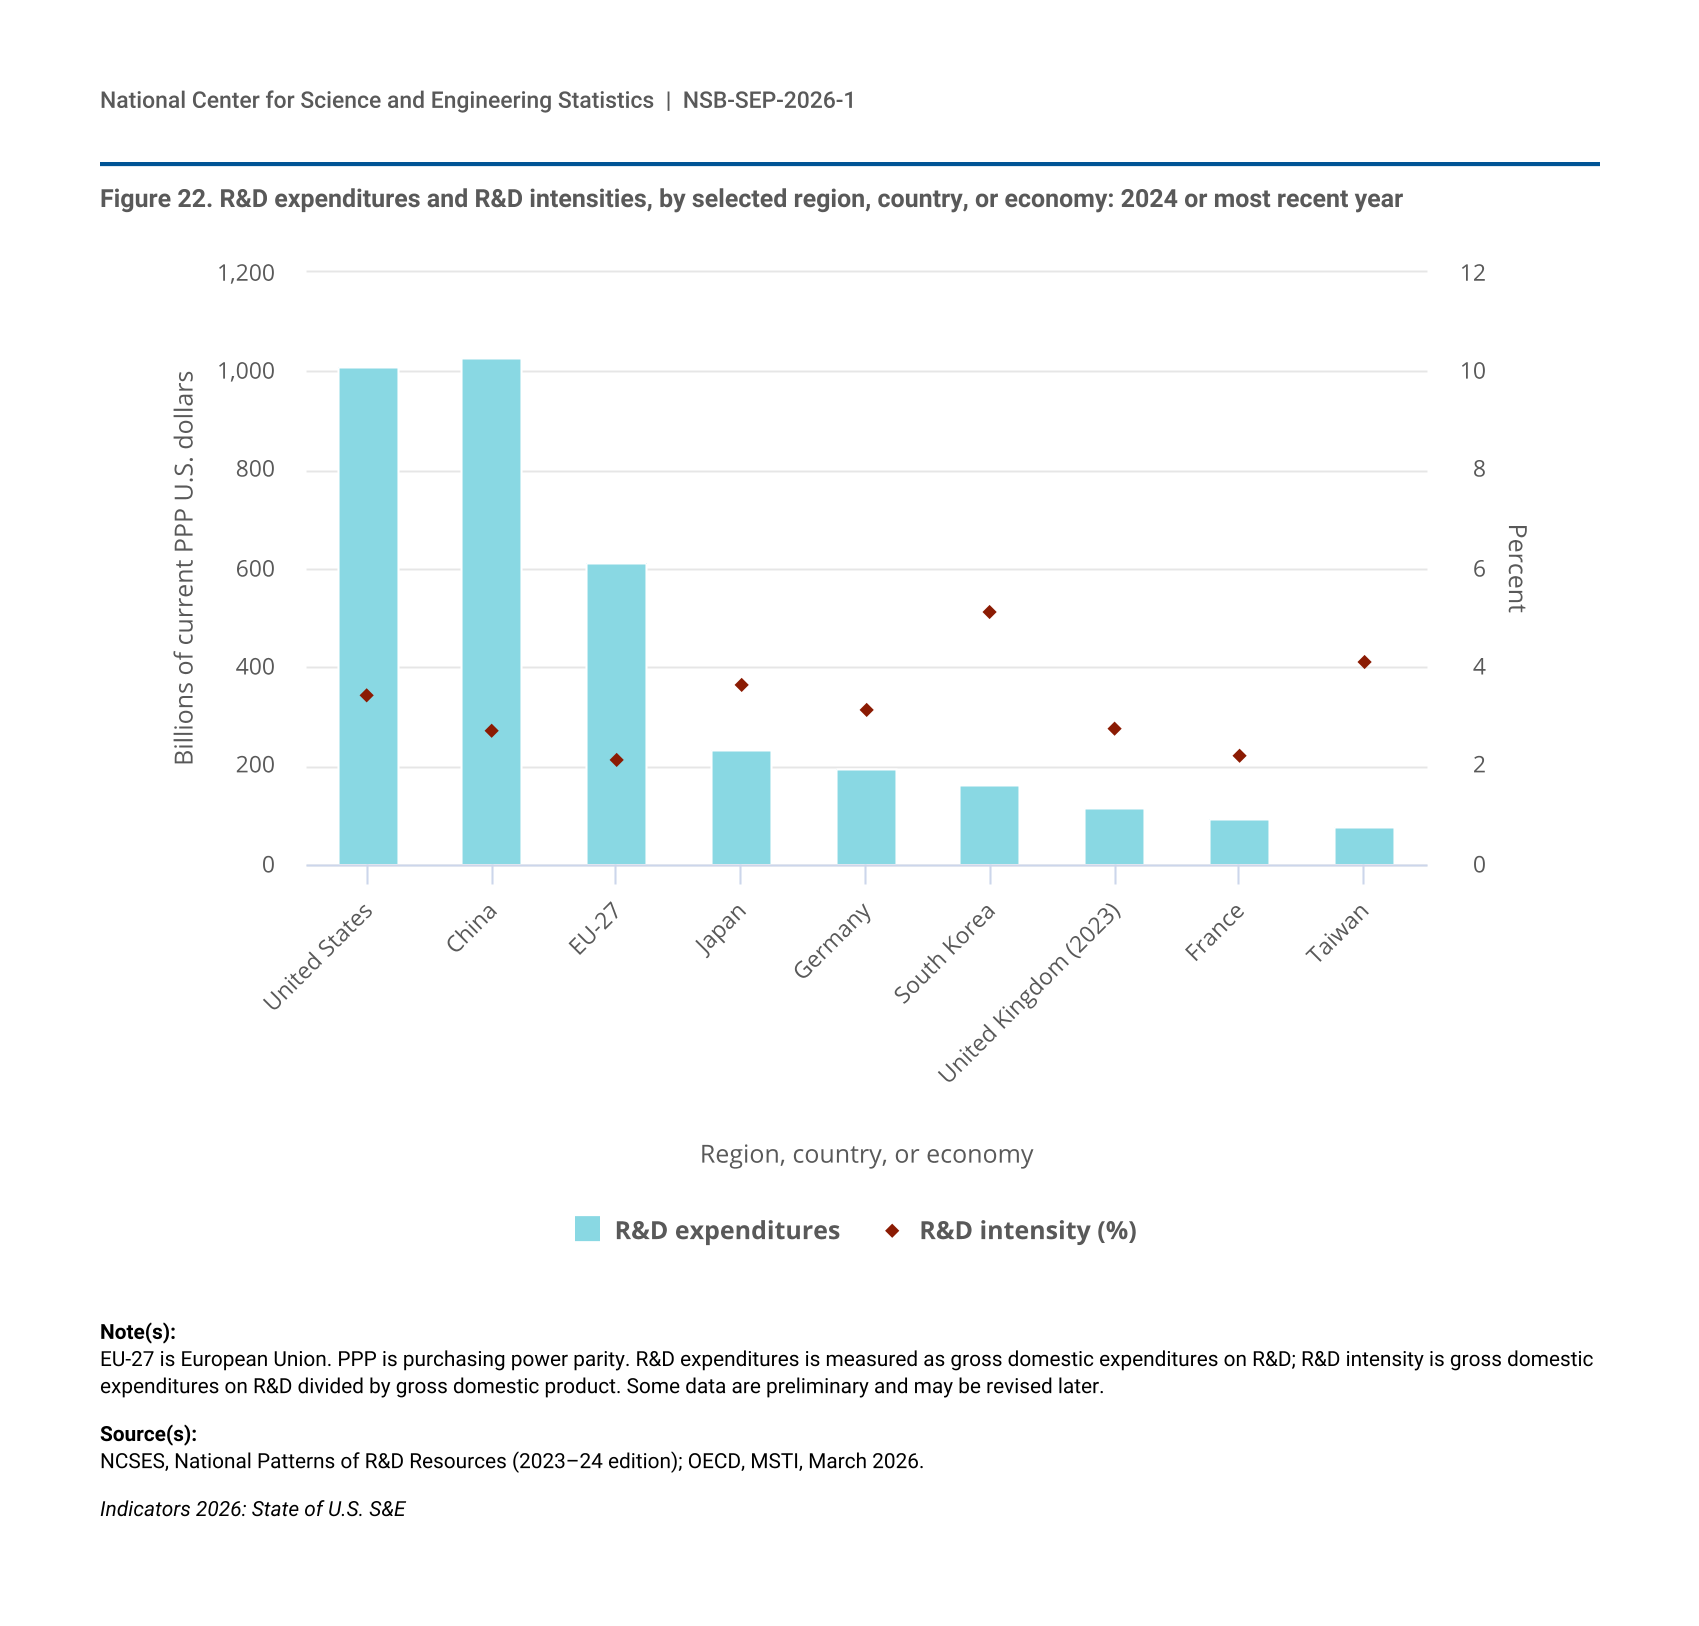
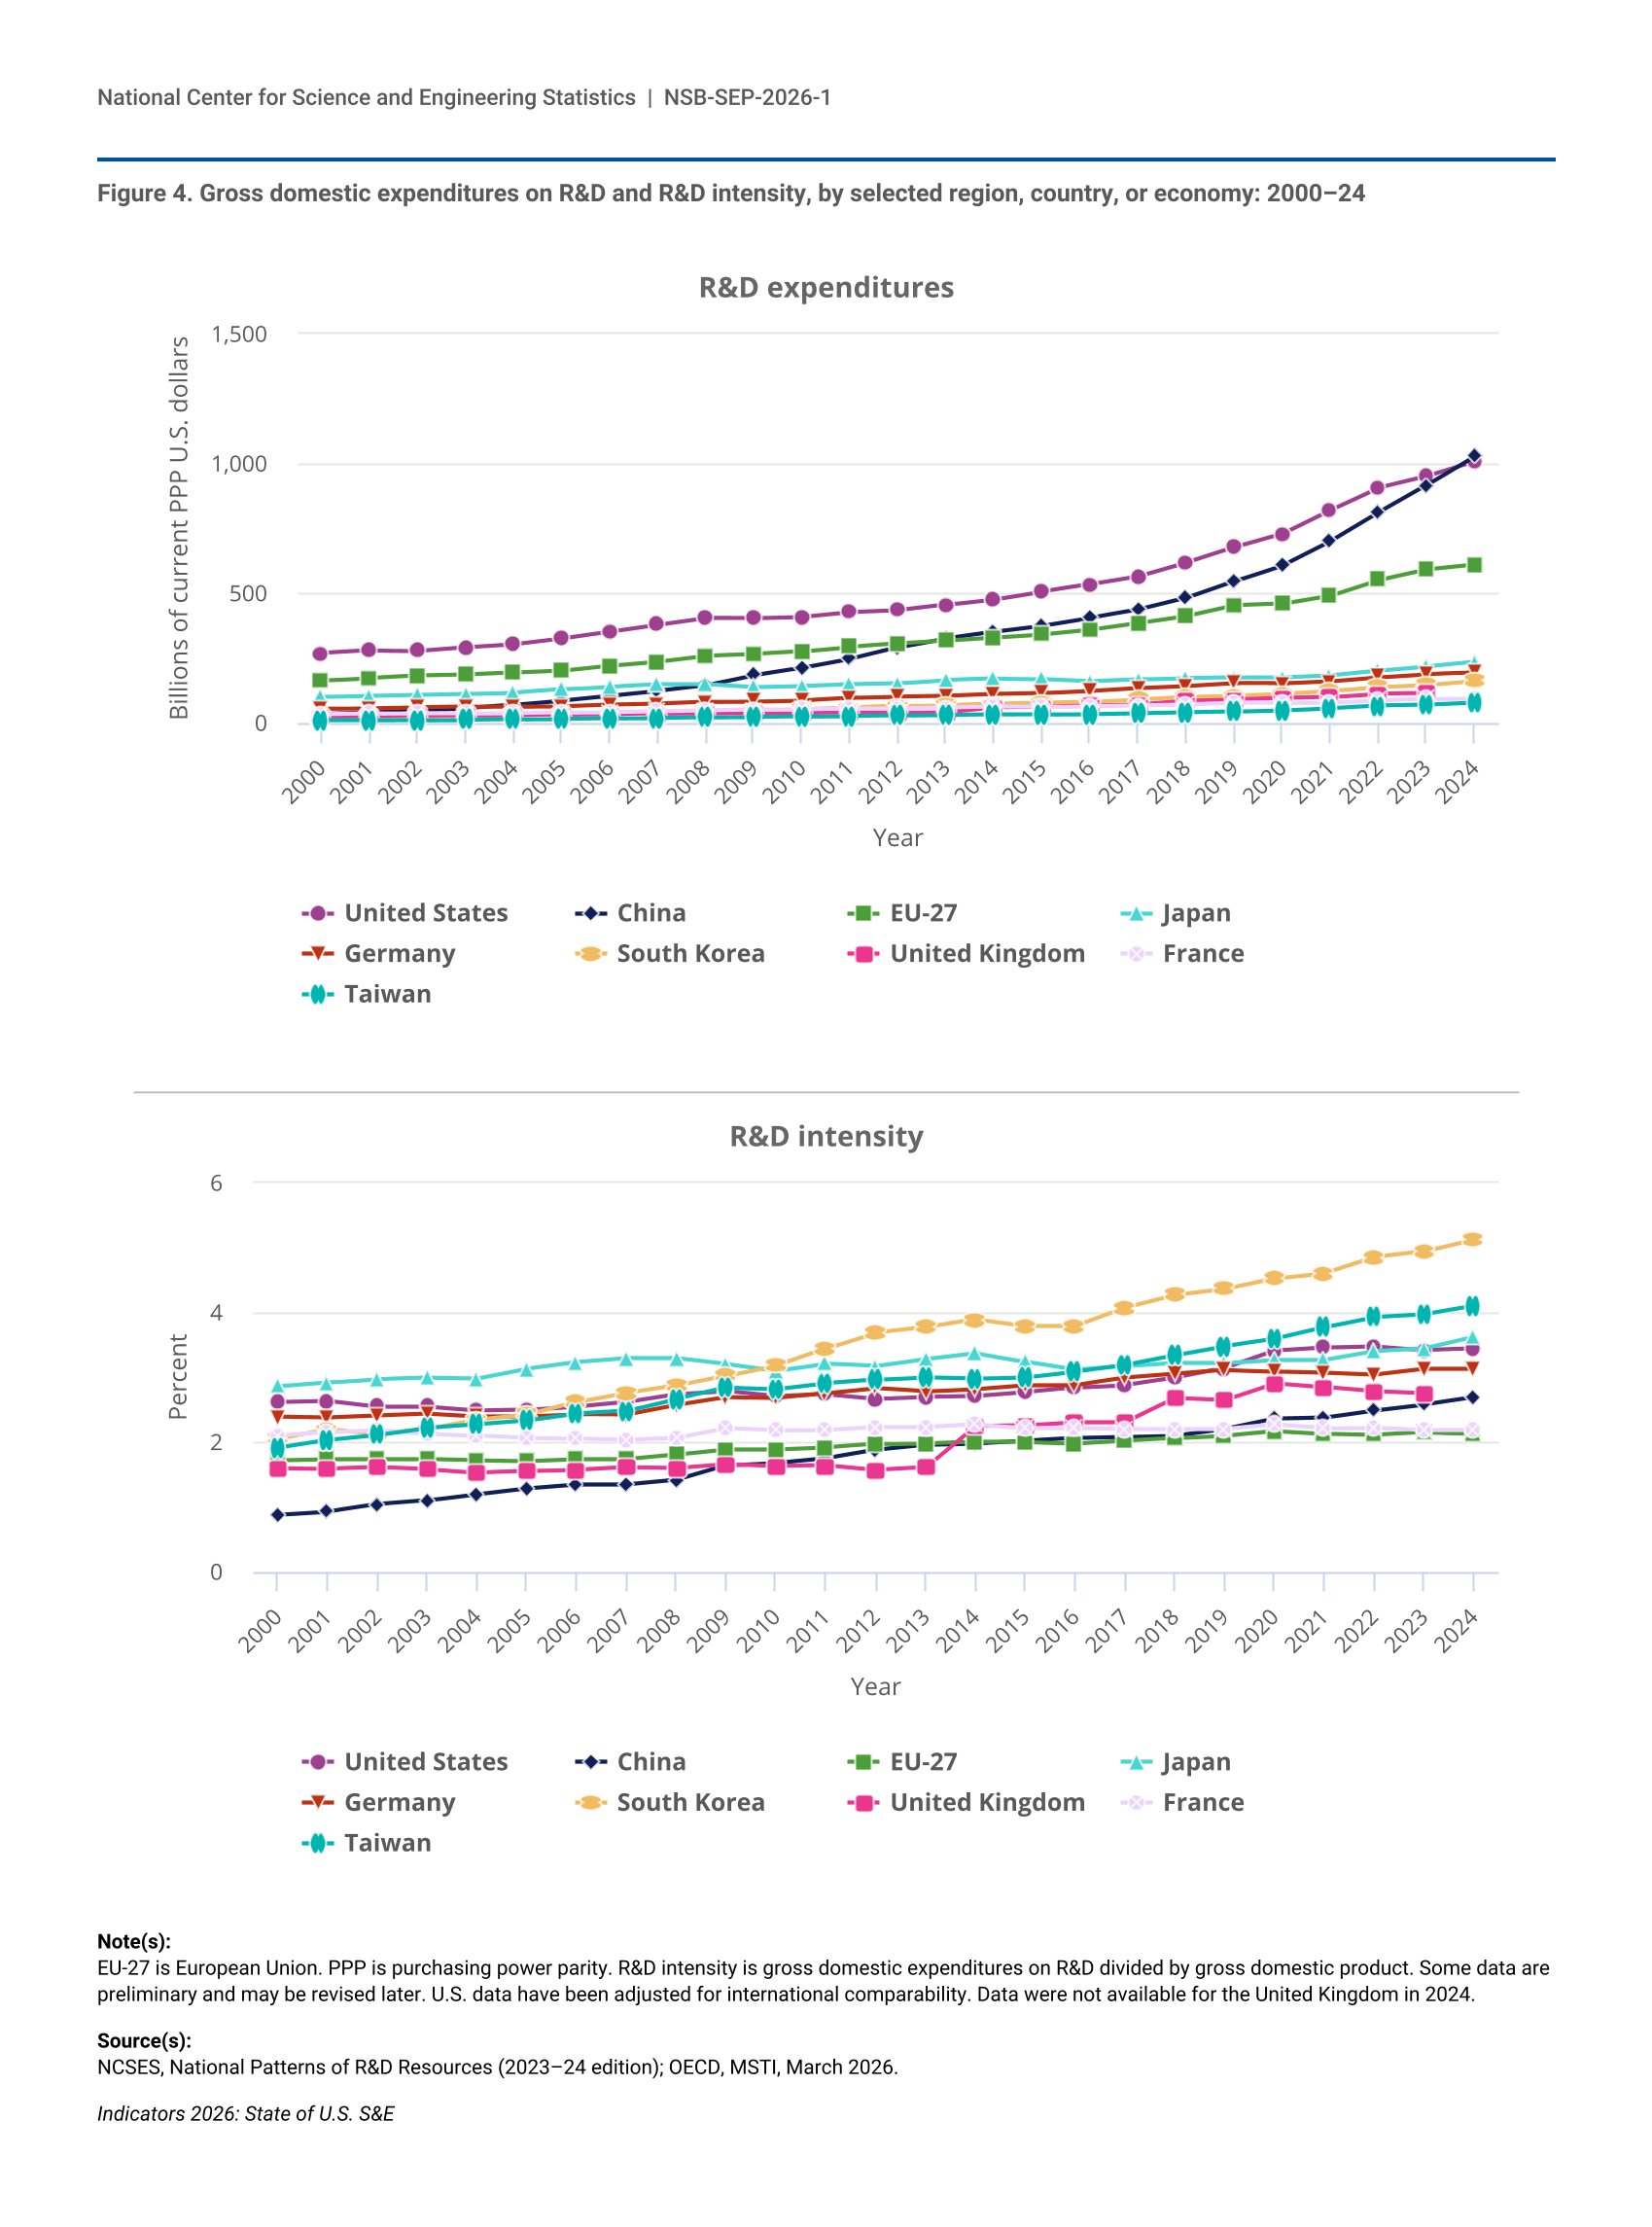
Worldwide R&D expenditures totaled $3.48 trillion in 2024, based on available data from OECD member countries and select non-OECD economies. Adjusted for international comparability, China had $1.028 trillion in gross domestic expenditures on R&D in 2024, followed by the United States with $1.009 trillion in R&D expenditures (Figure 22). China (30%) and the United States (29%) together accounted for over half of global R&D performance. Other top R&D-performing countries include Japan ($234 billion), Germany ($193 billion), and South Korea ($162 billion). As a group, the EU-27 collectively had $612 billion in total R&D expenditures in 2024, placing it third behind the United States and China.
| Region, country, or economy | R&D expenditures | R&D intensity (%) |
|---|---|---|
| United States | 1,009 | 3.44 |
| China | 1,028 | 2.69 |
| EU-27 | 612 | 2.13 |
| Japan | 234 | 3.62 |
| Germany | 193 | 3.13 |
| South Korea | 162 | 5.13 |
| United Kingdom (2023) | 115 | 2.75 |
| France | 93 | 2.18 |
| Taiwan | 77 | 4.10 |
EU-27 is European Union. PPP is purchasing power parity. R&D expenditures is measured as gross domestic expenditures on R&D; R&D intensity is gross domestic expenditures on R&D divided by gross domestic product. Some data are preliminary and may be revised later.
NCSES, National Patterns of R&D Resources (2023–24 edition); OECD, MSTI, March 2026.
Indicators 2026: State of U.S. S&E
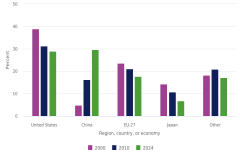
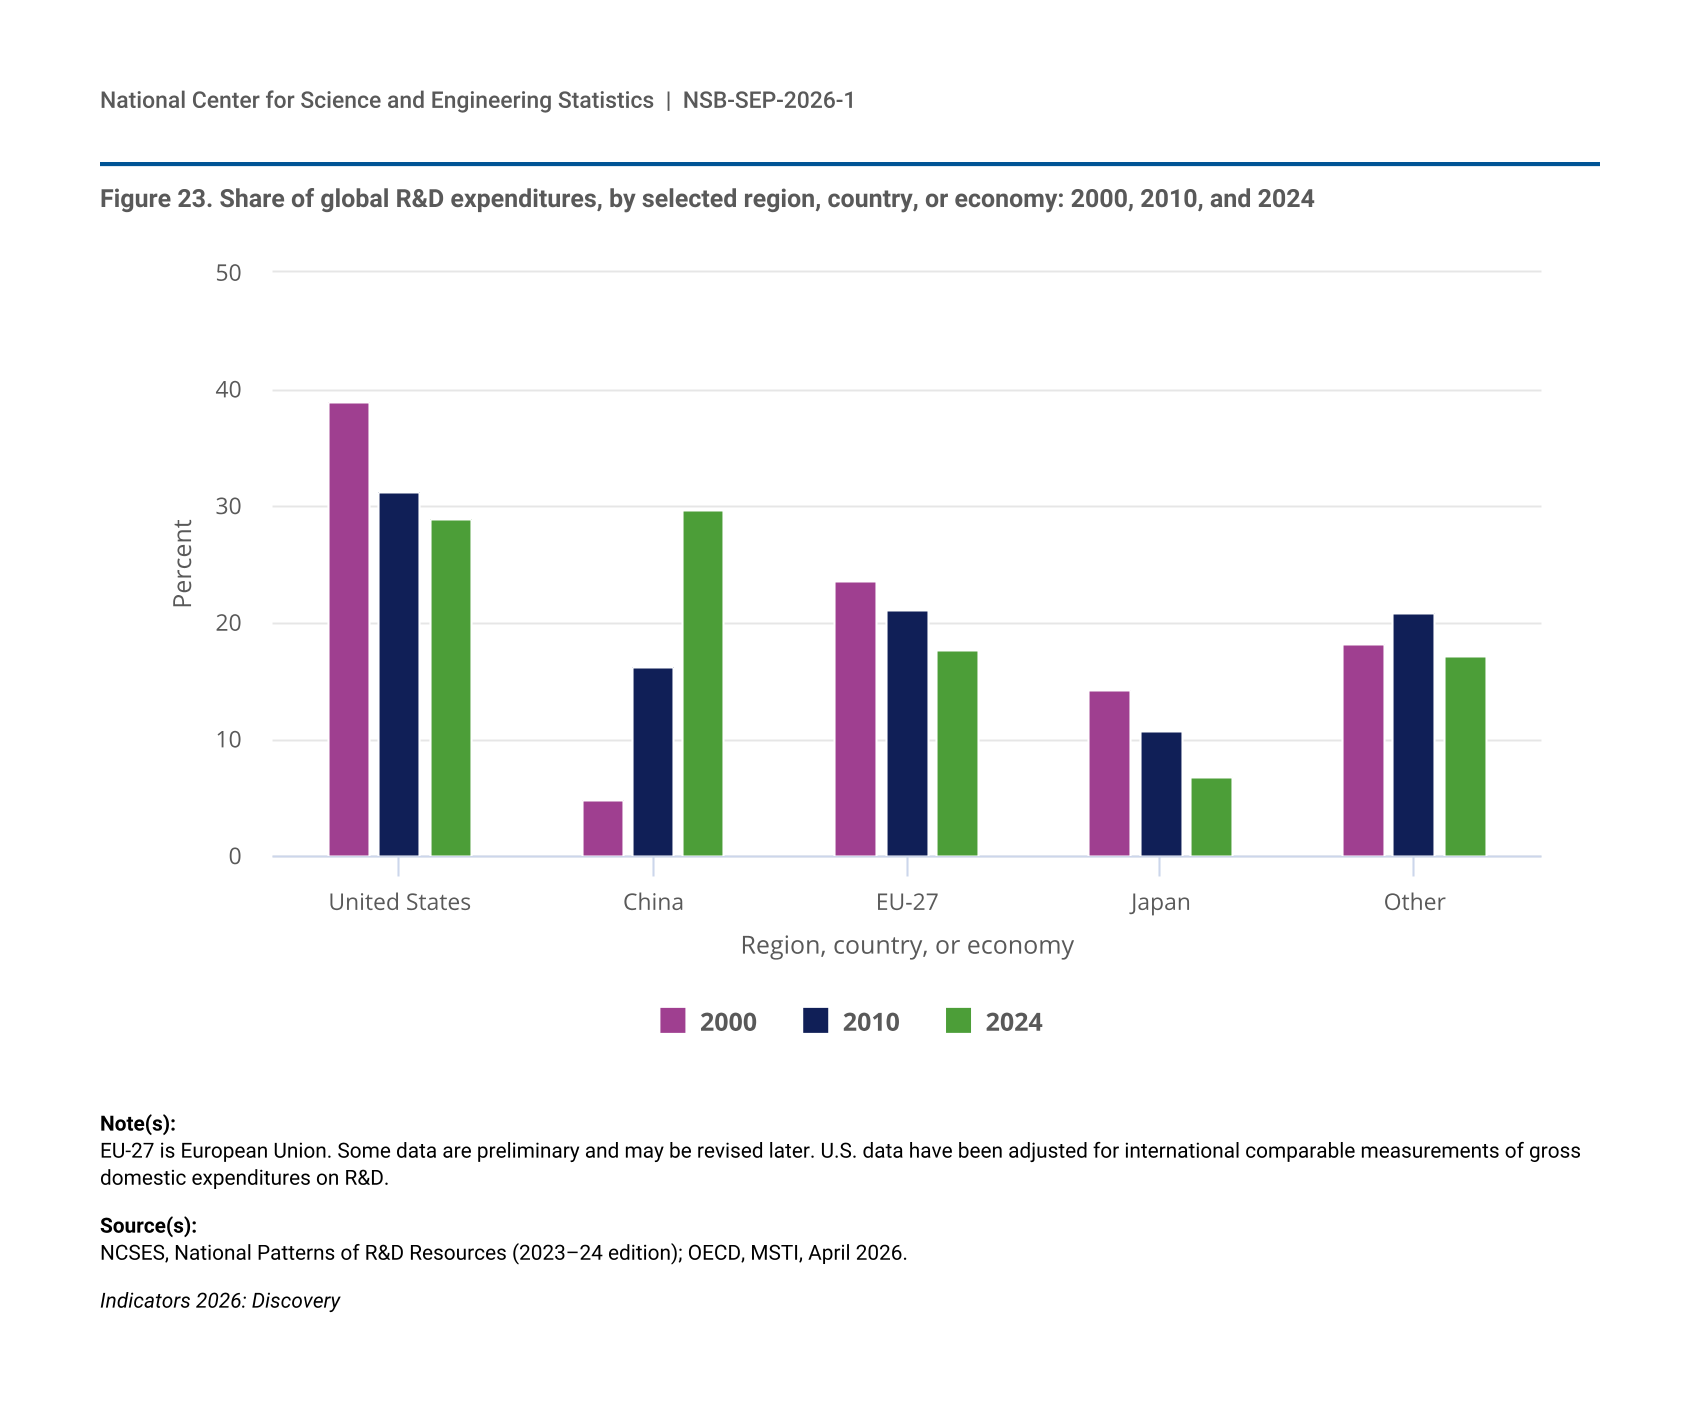
The United States has long been a leading performer of R&D, but its share of global R&D expenditures has declined over the last two decades (Figure 23). The U.S. share of global R&D decreased from 39% in 2000 to 31% in 2010, with little change to 29% in 2024. China’s share of global R&D has increased significantly as global R&D shares of the EU-27 and Japan have correspondingly decreased. China accounted for 5% of global R&D in 2000, rising to 30% by 2024, surpassing the R&D shares of the EU-27 (18%) and Japan (7%).
| Region, country, or economy | 2000 | 2010 | 2024 |
|---|---|---|---|
| United States | 38.9 | 31.2 | 29.0 |
| China | 4.8 | 16.2 | 29.6 |
| EU-27 | 23.6 | 21.0 | 17.6 |
| Japan | 14.3 | 10.7 | 6.7 |
| Other | 18.3 | 20.9 | 17.1 |
EU-27 is European Union. Some data are preliminary and may be revised later. U.S. data have been adjusted for international comparable measurements of gross domestic expenditures on R&D.
NCSES, National Patterns of R&D Resources (2023–24 edition); OECD, MSTI, April 2026.
R&D Intensity
The major R&D-performing economies vary in their R&D-to-GDP ratios, known as R&D intensities (see the “Glossary” section for definition). The United States had an R&D intensity of 3.4% in 2024 (Figure 22). China’s R&D intensity (2.7%) is higher than the average across the EU-27 (2.1%) but lower than the R&D intensities of other individual major R&D performers such as Japan (3.6%) and Germany (3.1%). Several smaller economies with lower total R&D expenditures had higher R&D intensities, most notably South Korea (5.1%) and Taiwan (4.1%).
International Business R&D
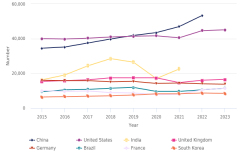
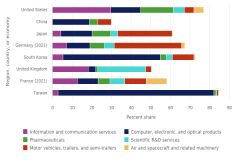
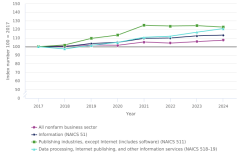
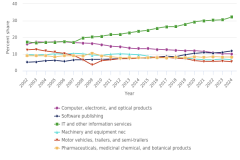
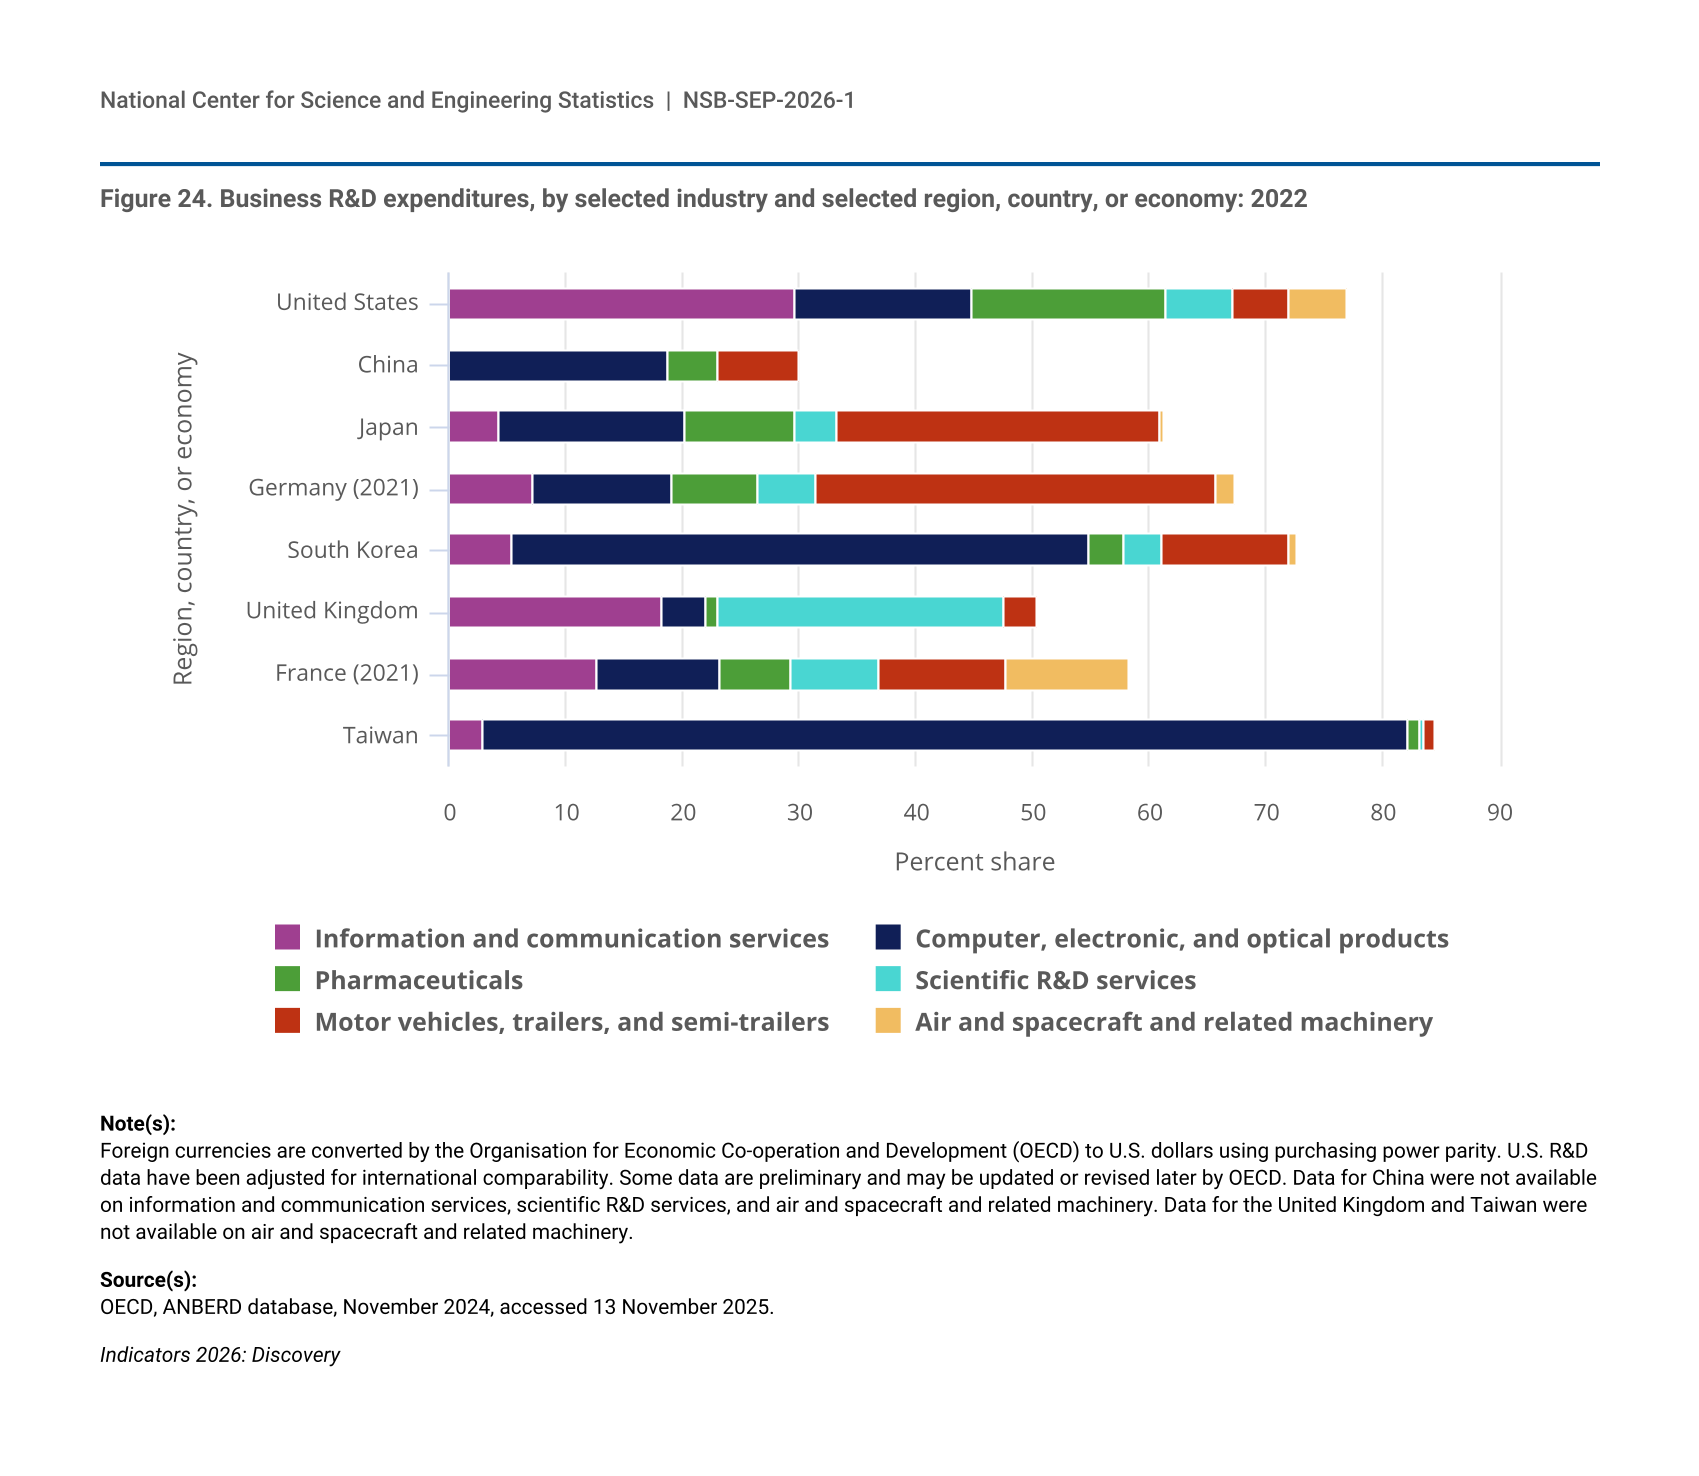
R&D performance and funding is distributed among the business, government, higher education, and private nonprofit sectors (see the “Glossary” section for definitions). The business sector is the largest performer and funder of R&D across many of the largest R&D-performing economies, but business R&D patterns vary considerably by industry. IT-related industries—information and communication services as well as computer, electronic, and optical products manufacturing—combined accounted for large shares of business R&D expenditures in several advanced economies in 2022 (82% in Taiwan, 55% in South Korea, and 45% in the United States) (Figure 24). In 2022, information and communication services had the largest share of business R&D expenditures in the United States (30%) and France (13%, as of 2021) and had the second-largest share in the United Kingdom (18%). Computer, electronic, and optical products manufacturing (including semiconductors) accounted for the largest share of business R&D expenditures in Taiwan (79%) and South Korea (49%). However, in absolute terms, China had the highest level of business R&D expenditures in this industry ($117 billion). The United States had a greater share of its business R&D in pharmaceuticals (17%) than other top R&D performers. Business R&D was much more concentrated in the motor vehicle industry in Germany (34% in 2021) and Japan (28% in 2022) than in other advanced economies.
| Region, country, or economy | Information and communication services | Computer, electronic, and optical products | Pharmaceuticals | Scientific R&D services | Motor vehicles, trailers, and semi-trailers | Air and spacecraft and related machinery |
|---|---|---|---|---|---|---|
| United States | 29.6 | 15.2 | 16.7 | 5.6 | 4.8 | 5.1 |
| China | NA | 18.7 | 4.4 | NA | 6.9 | NA |
| Japan | 4.3 | 15.9 | 9.5 | 3.6 | 27.6 | 0.3 |
| Germany (2021) | 7.2 | 11.9 | 7.3 | 5.0 | 34.3 | 1.7 |
| South Korea | 5.4 | 49.5 | 2.9 | 3.3 | 10.8 | 0.7 |
| United Kingdom | 18.3 | 3.6 | 1.1 | 24.5 | 2.8 | NA |
| France (2021) | 12.6 | 10.7 | 6.0 | 7.5 | 10.8 | 10.7 |
| Taiwan | 2.8 | 79.3 | 1.1 | 0.3 | 1.0 | NA |
Foreign currencies are converted by the Organisation for Economic Co-operation and Development (OECD) to U.S. dollars using purchasing power parity. U.S. R&D data have been adjusted for international comparability. Some data are preliminary and may be updated or revised later by OECD. Data for China were not available on information and communication services, scientific R&D services, and air and spacecraft and related machinery. Data for the United Kingdom and Taiwan were not available on air and spacecraft and related machinery.
OECD, ANBERD database, November 2024, accessed 13 November 2025.
U.S. R&D Performance and Funding
Performers and Funders of R&D
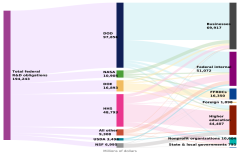
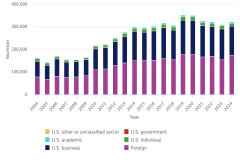
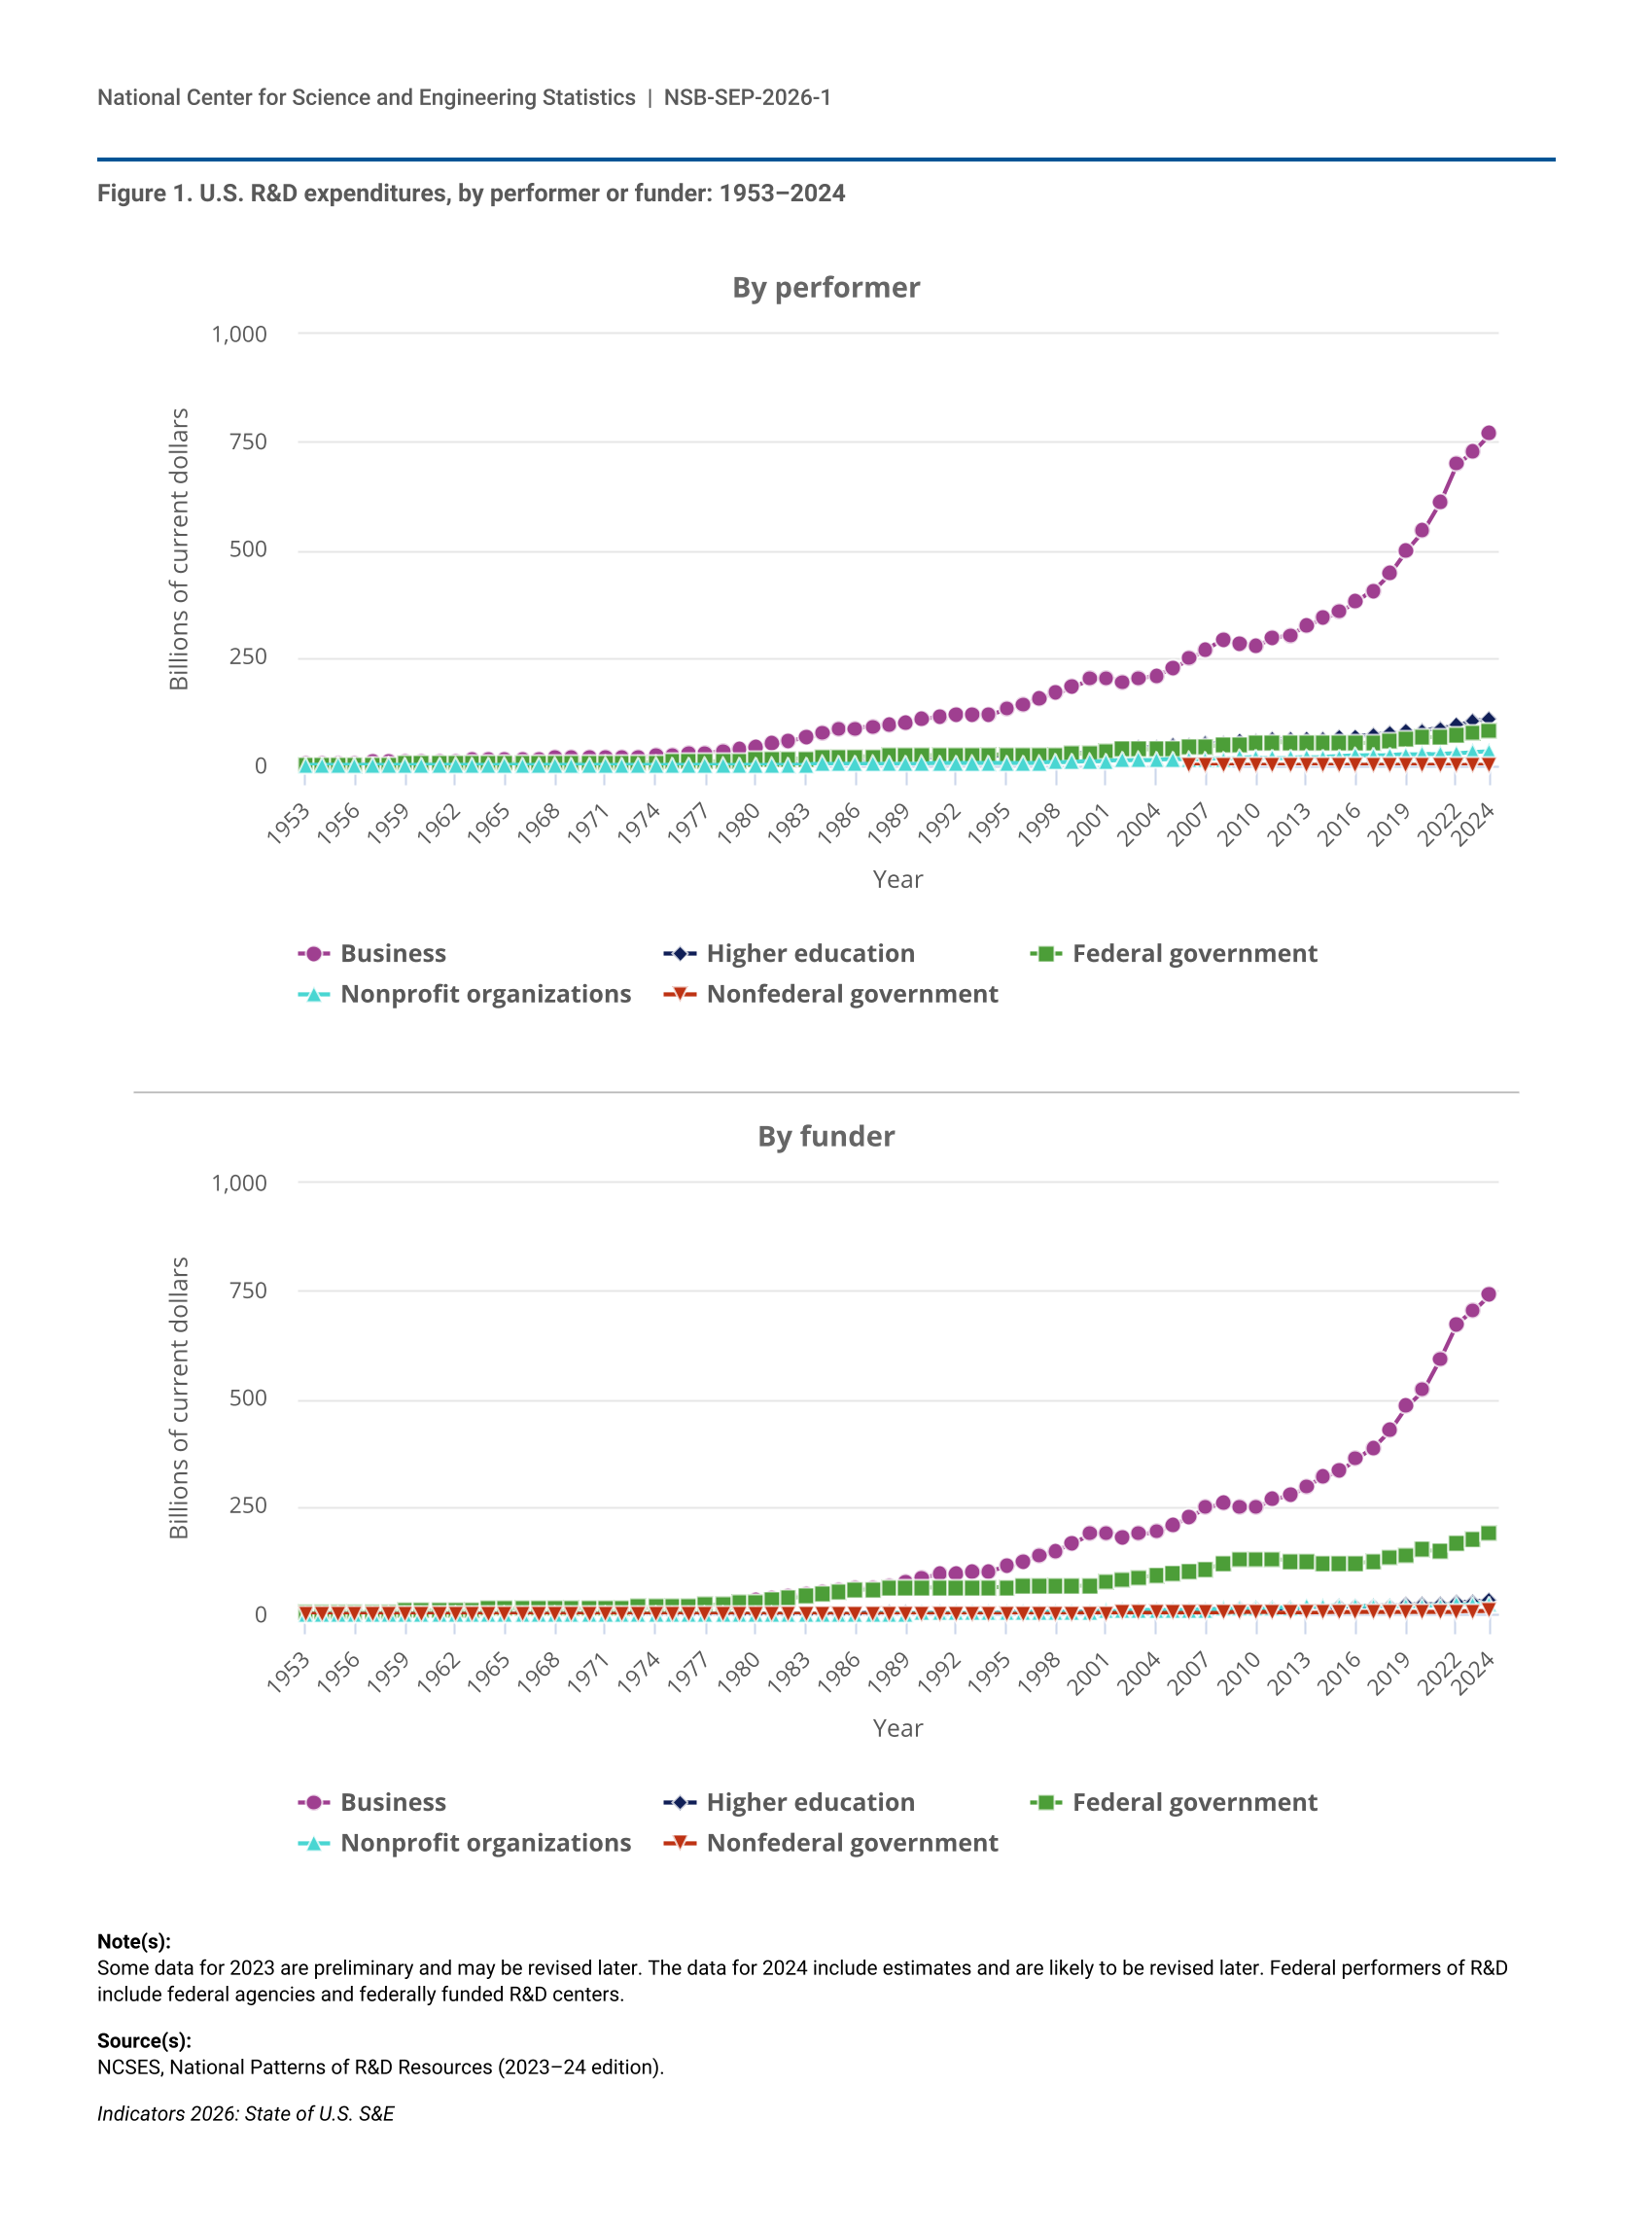
The U.S. R&D system consists of the activities of a diverse group of R&D performers and R&D funders, including the federal government, state and local governments, higher education institutions, businesses, and private nonprofit organizations. The United States performed $937 billion of R&D in 2023 and an estimated $993 billion in 2024 (NCSES 2026b). National Patterns of R&D Resources 2024 data for the United States are estimates and are likely to be revised. The business sector is by far the largest performer and funder of R&D, performing 77% ($769 billion) and funding 75% ($743 billion) of the nation’s total R&D in 2024. Higher education institutions performed 11% of U.S. total R&D, followed by the federal government (8%), nonprofit organizations (3%), and nonfederal governments (less than 1%).
The composition of R&D funding in the United States differs from that of R&D performance. Virtually all (99%) of the business sector’s R&D funding supported R&D performance within the business sector in 2024. In contrast, the federal government supported R&D performed across the U.S. R&D system, leading the federal government to account for a higher share of R&D funding (19%) than R&D performance (8%) in 2024. In addition to supporting intramural research at federal laboratories, the federal government funded 52% of R&D performed by higher education institutions, 42% by nonfederal governments, 40% by nonprofit organizations, and 5% by businesses. The higher education sector self-funds a portion (28%) of its own R&D performance, but its reliance on external sources of funding, particularly the federal government, means that it funds a substantially lower portion of U.S. total R&D (3%) than it performs (11%).
Type of R&D
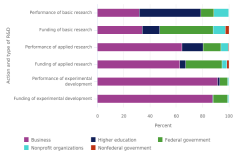
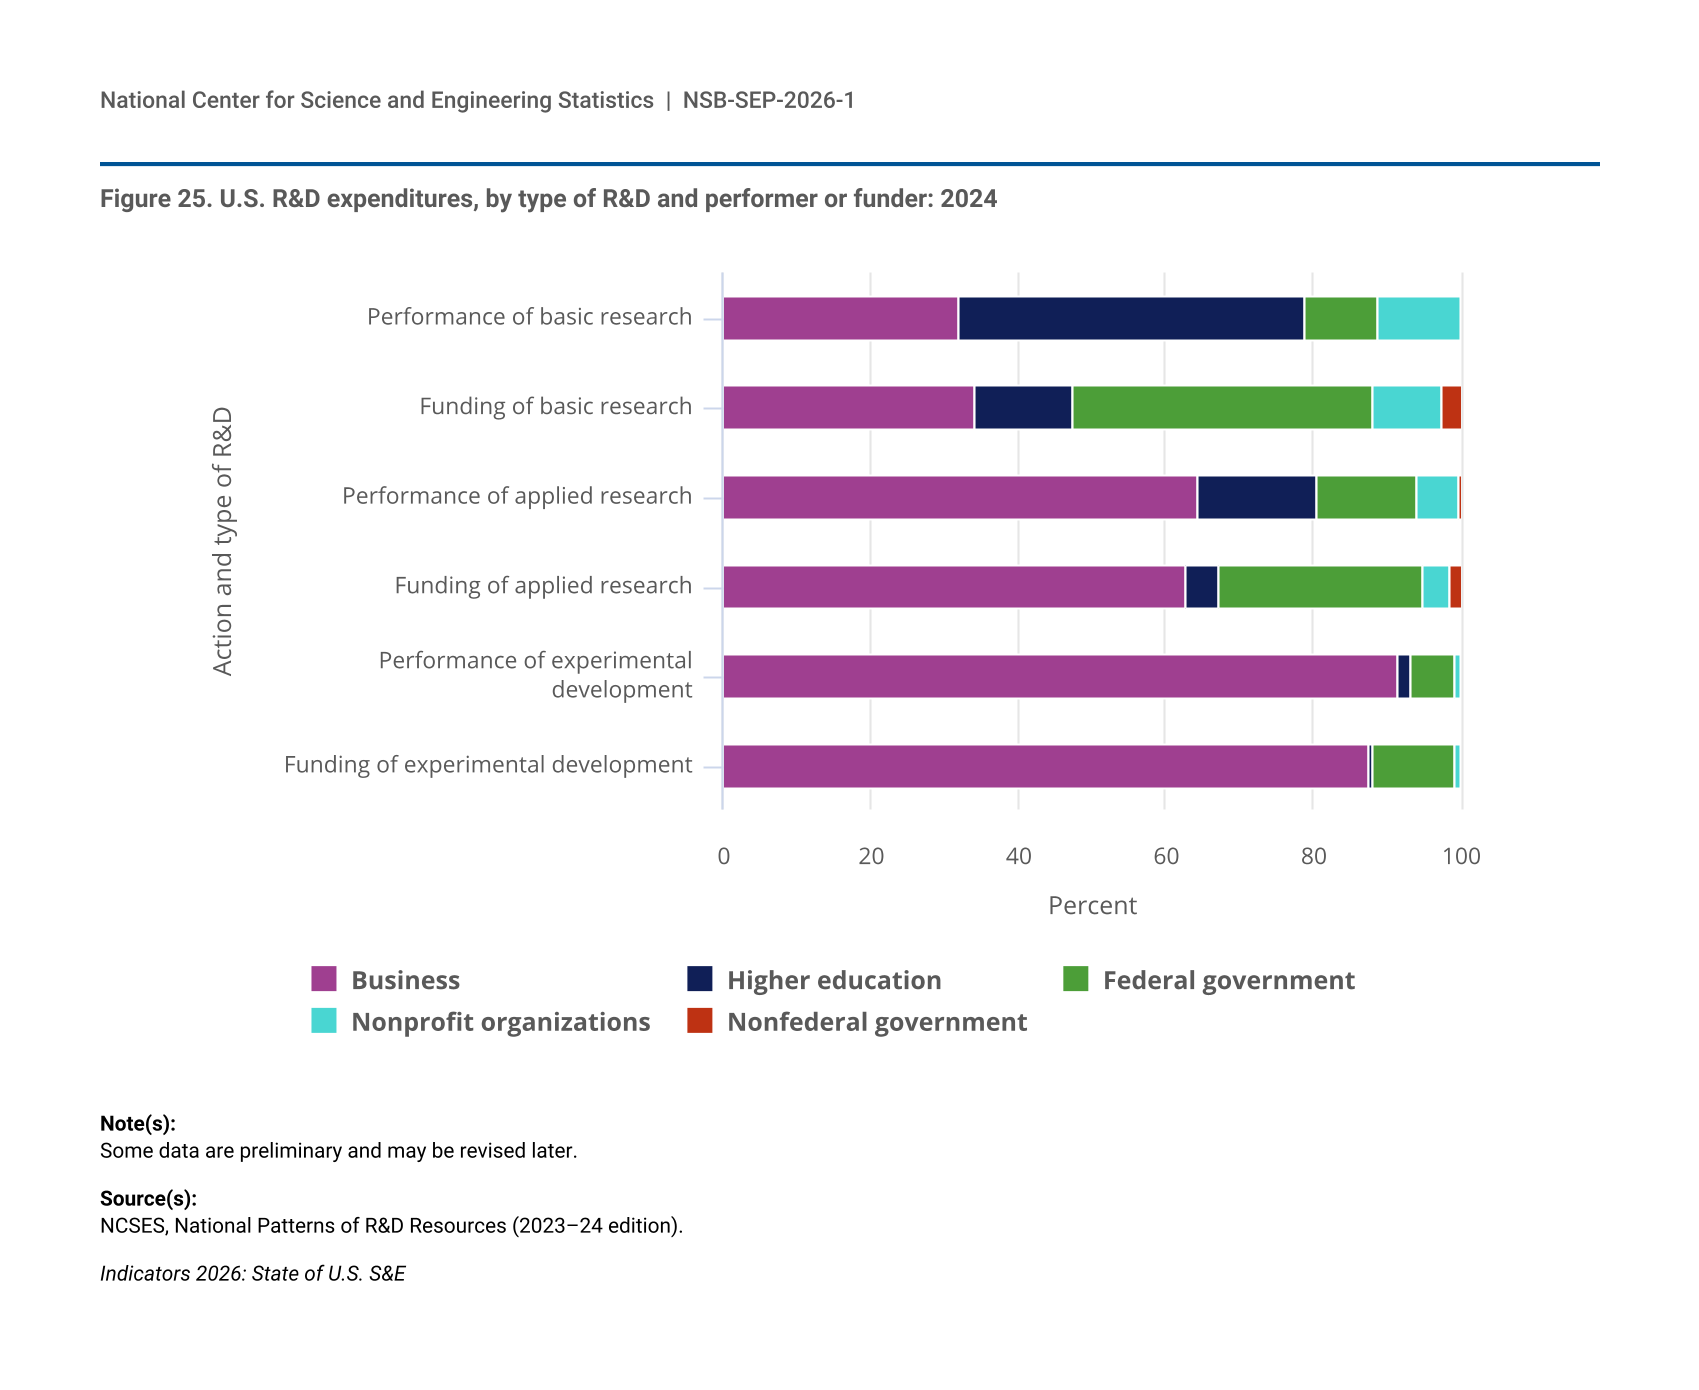
Components of the nation’s R&D system fulfill different roles in the performance and funding of basic research, applied research, and experimental development (Figure 25). Higher education institutions perform the greatest share (48%) of basic research, much of which is federally funded. The federal government performs comparatively low shares of all types of R&D but is the largest funder of basic research (40%) and the second-largest funder of applied research (26%). The business sector’s share of basic research funding has expanded over time, reaching 34% by 2024 (NCSES National Patterns 2023–24: Table 7). Businesses account for an increasing share of U.S. R&D performance as the R&D process moves closer to market application: in 2024, business performed 32% of basic research, 65% of applied research, and 91% of experimental development. In contrast, nonprofit organizations concentrate on the performance and funding of basic research.
| Action and type of R&D | Business | Higher education | Federal government | Nonprofit organizations | Nonfederal government |
|---|---|---|---|---|---|
| Performance of basic research | 32.0 | 47.9 | 8.7 | 11.4 | 0.1 |
| Funding of basic research | 34.3 | 13.8 | 39.9 | 9.4 | 2.7 |
| Performance of applied research | 65.4 | 16.6 | 12.0 | 5.7 | 0.3 |
| Funding of applied research | 63.6 | 4.6 | 26.5 | 4.0 | 1.3 |
| Performance of experimental development | 90.5 | 1.7 | 7.0 | 0.8 | 0.0 |
| Funding of experimental development | 86.6 | 0.5 | 12.0 | 0.7 | 0.1 |
The data for 2024 include estimates and are likely to be revised later.
NCSES, National Patterns of R&D Resources (2023–24 edition).
Indicators 2026: State of U.S. S&E
Business R&D
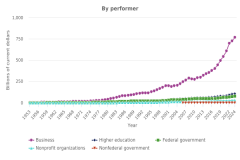
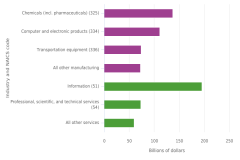
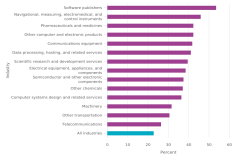
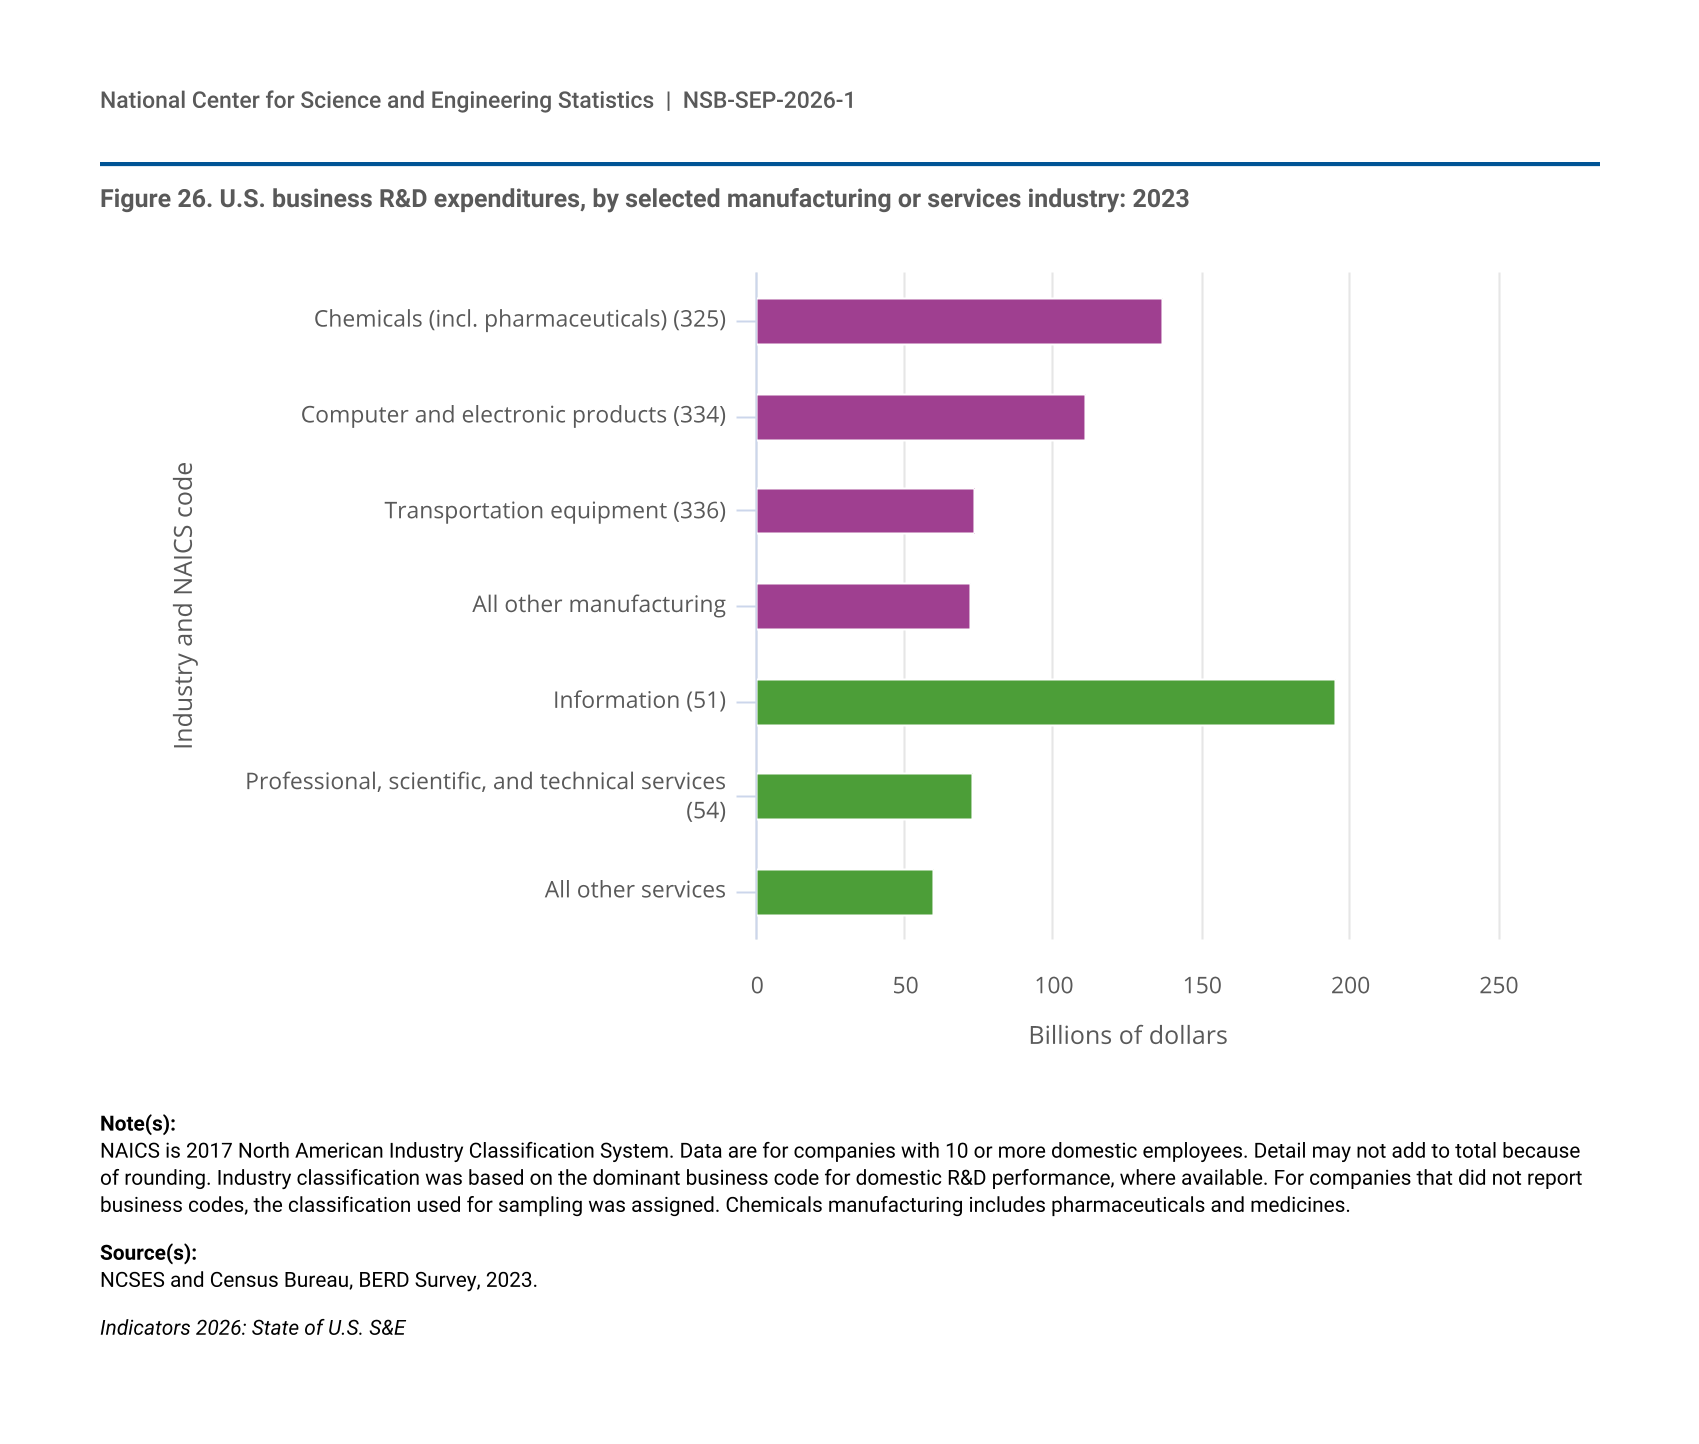
A large portion of U.S. business R&D performance, which totaled $722 billion in 2023, is concentrated in several manufacturing and services industries (Figure 26). Although the manufacturing sector overall was responsible for a greater share of business R&D (55%) than was services industries, the information industry in particular had more R&D expenditures ($195 billion) than any other industry. Around four-fifths of all business R&D was performed by five industries in 2023: information (including software publishing) accounted for 27% of the total, followed by chemicals manufacturing (primarily pharmaceuticals and medicines) at 19%, computer and electronic products manufacturing (including semiconductors) at 15%, transportation equipment manufacturing at 10%, and professional, scientific, and technical services (including R&D services) at 10%. Business R&D in the United States is also highly geographically concentrated, with about half of R&D performance occurring in three states in 2023: California, Washington, and Massachusetts (NCSES BERD 2023: Table 13).
| Industry and NAICS code | R&D expenditures |
|---|---|
| Chemicals (incl. pharmaceuticals) (325) | 136.9 |
| Computer and electronic products (334) | 110.7 |
| Transportation equipment (336) | 73.9 |
| All other manufacturing | 72.2 |
| Information (51) | 195.4 |
| Professional, scientific, and technical services (54) | 73.3 |
| All other services | 59.4 |
NAICS is 2017 North American Industry Classification System. Data are for companies with 10 or more domestic employees. Detail may not add to total because of rounding. Industry classification was based on the dominant business code for domestic R&D performance, where available. For companies that did not report business codes, the classification used for sampling was assigned. Chemicals manufacturing includes pharmaceuticals and medicines.
NCSES and Census Bureau, BERD Survey, 2023.
Indicators 2026: State of U.S. S&E
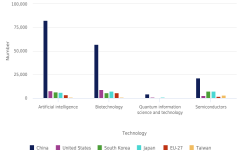
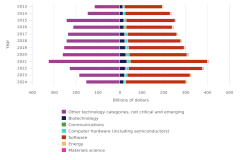
R&D in CETs and in advanced manufacturing processes contributes to economic competitiveness and national security. In 2023, U.S. businesses across all industries invested heavily in R&D in select technology focus areas—software products and embedded software ($302 billion), biotechnology ($136 billion), artificial intelligence ($65 billion), and nanotechnology ($39 billion) (NCSES BERD 2023: Table 18 through Table 21). The information industry accounted for large shares of software (56%) and AI (60%) R&D; however, industries in the manufacturing sector collectively performed significant shares of total U.S. R&D in these areas (19% of software R&D and 26% of AI R&D). Biotechnology R&D was heavily concentrated in the pharmaceuticals and medicines industry (78% of the total) as well as in firms from the professional, scientific, and technical services industry (13%). Consistent with the role of nanotechnology tools and materials for performance of computer chips, the semiconductor manufacturing industry performed 70% of total nanotechnology R&D. Although nanotechnology R&D accounted for only 5% of all U.S. business R&D performed in 2023, it accounted for 54% of R&D performed in the semiconductor industry.
Academic R&D
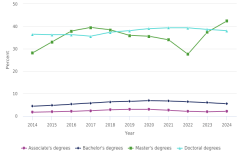
U.S. academic institutions had $118 billion of R&D expenditures in FY 2024. The federal government was the largest funder of total academic R&D, accounting for 55% of academic R&D expenditures, followed by academic institutions’ own funding (26%), nonprofit organizations (6%), businesses (5%), and state and local governments (5%) (NCSES HERD 2024: Table 1). In contrast to the business sector, academic institutions focus heavily on basic research, which made up 63% of academic R&D expenditures in FY 2024. Applied research (27%) and experimental development (10%) accounted for smaller shares of academic R&D. Although the federal government is the largest funder of basic research and applied research at higher education institutions, nonfederal sources collectively accounted for slightly more funding of academic experimental development ($6.2 billion) than the federal government ($5.6 billion) in FY 2024. The majority of academic R&D was in life sciences (57%), with little change in this share over the last decade. The predominance of life sciences in academic R&D aligns with the role of HHS as the largest federal funder of academic R&D—$35.5 billion in FY 2024—and is consistent with the high share of U.S. publications output in health sciences (see the “Research Publications” section).
Federal Support for U.S. R&D and Graduate Students
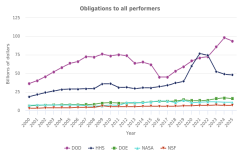
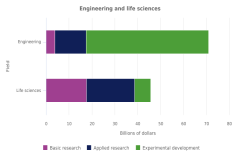
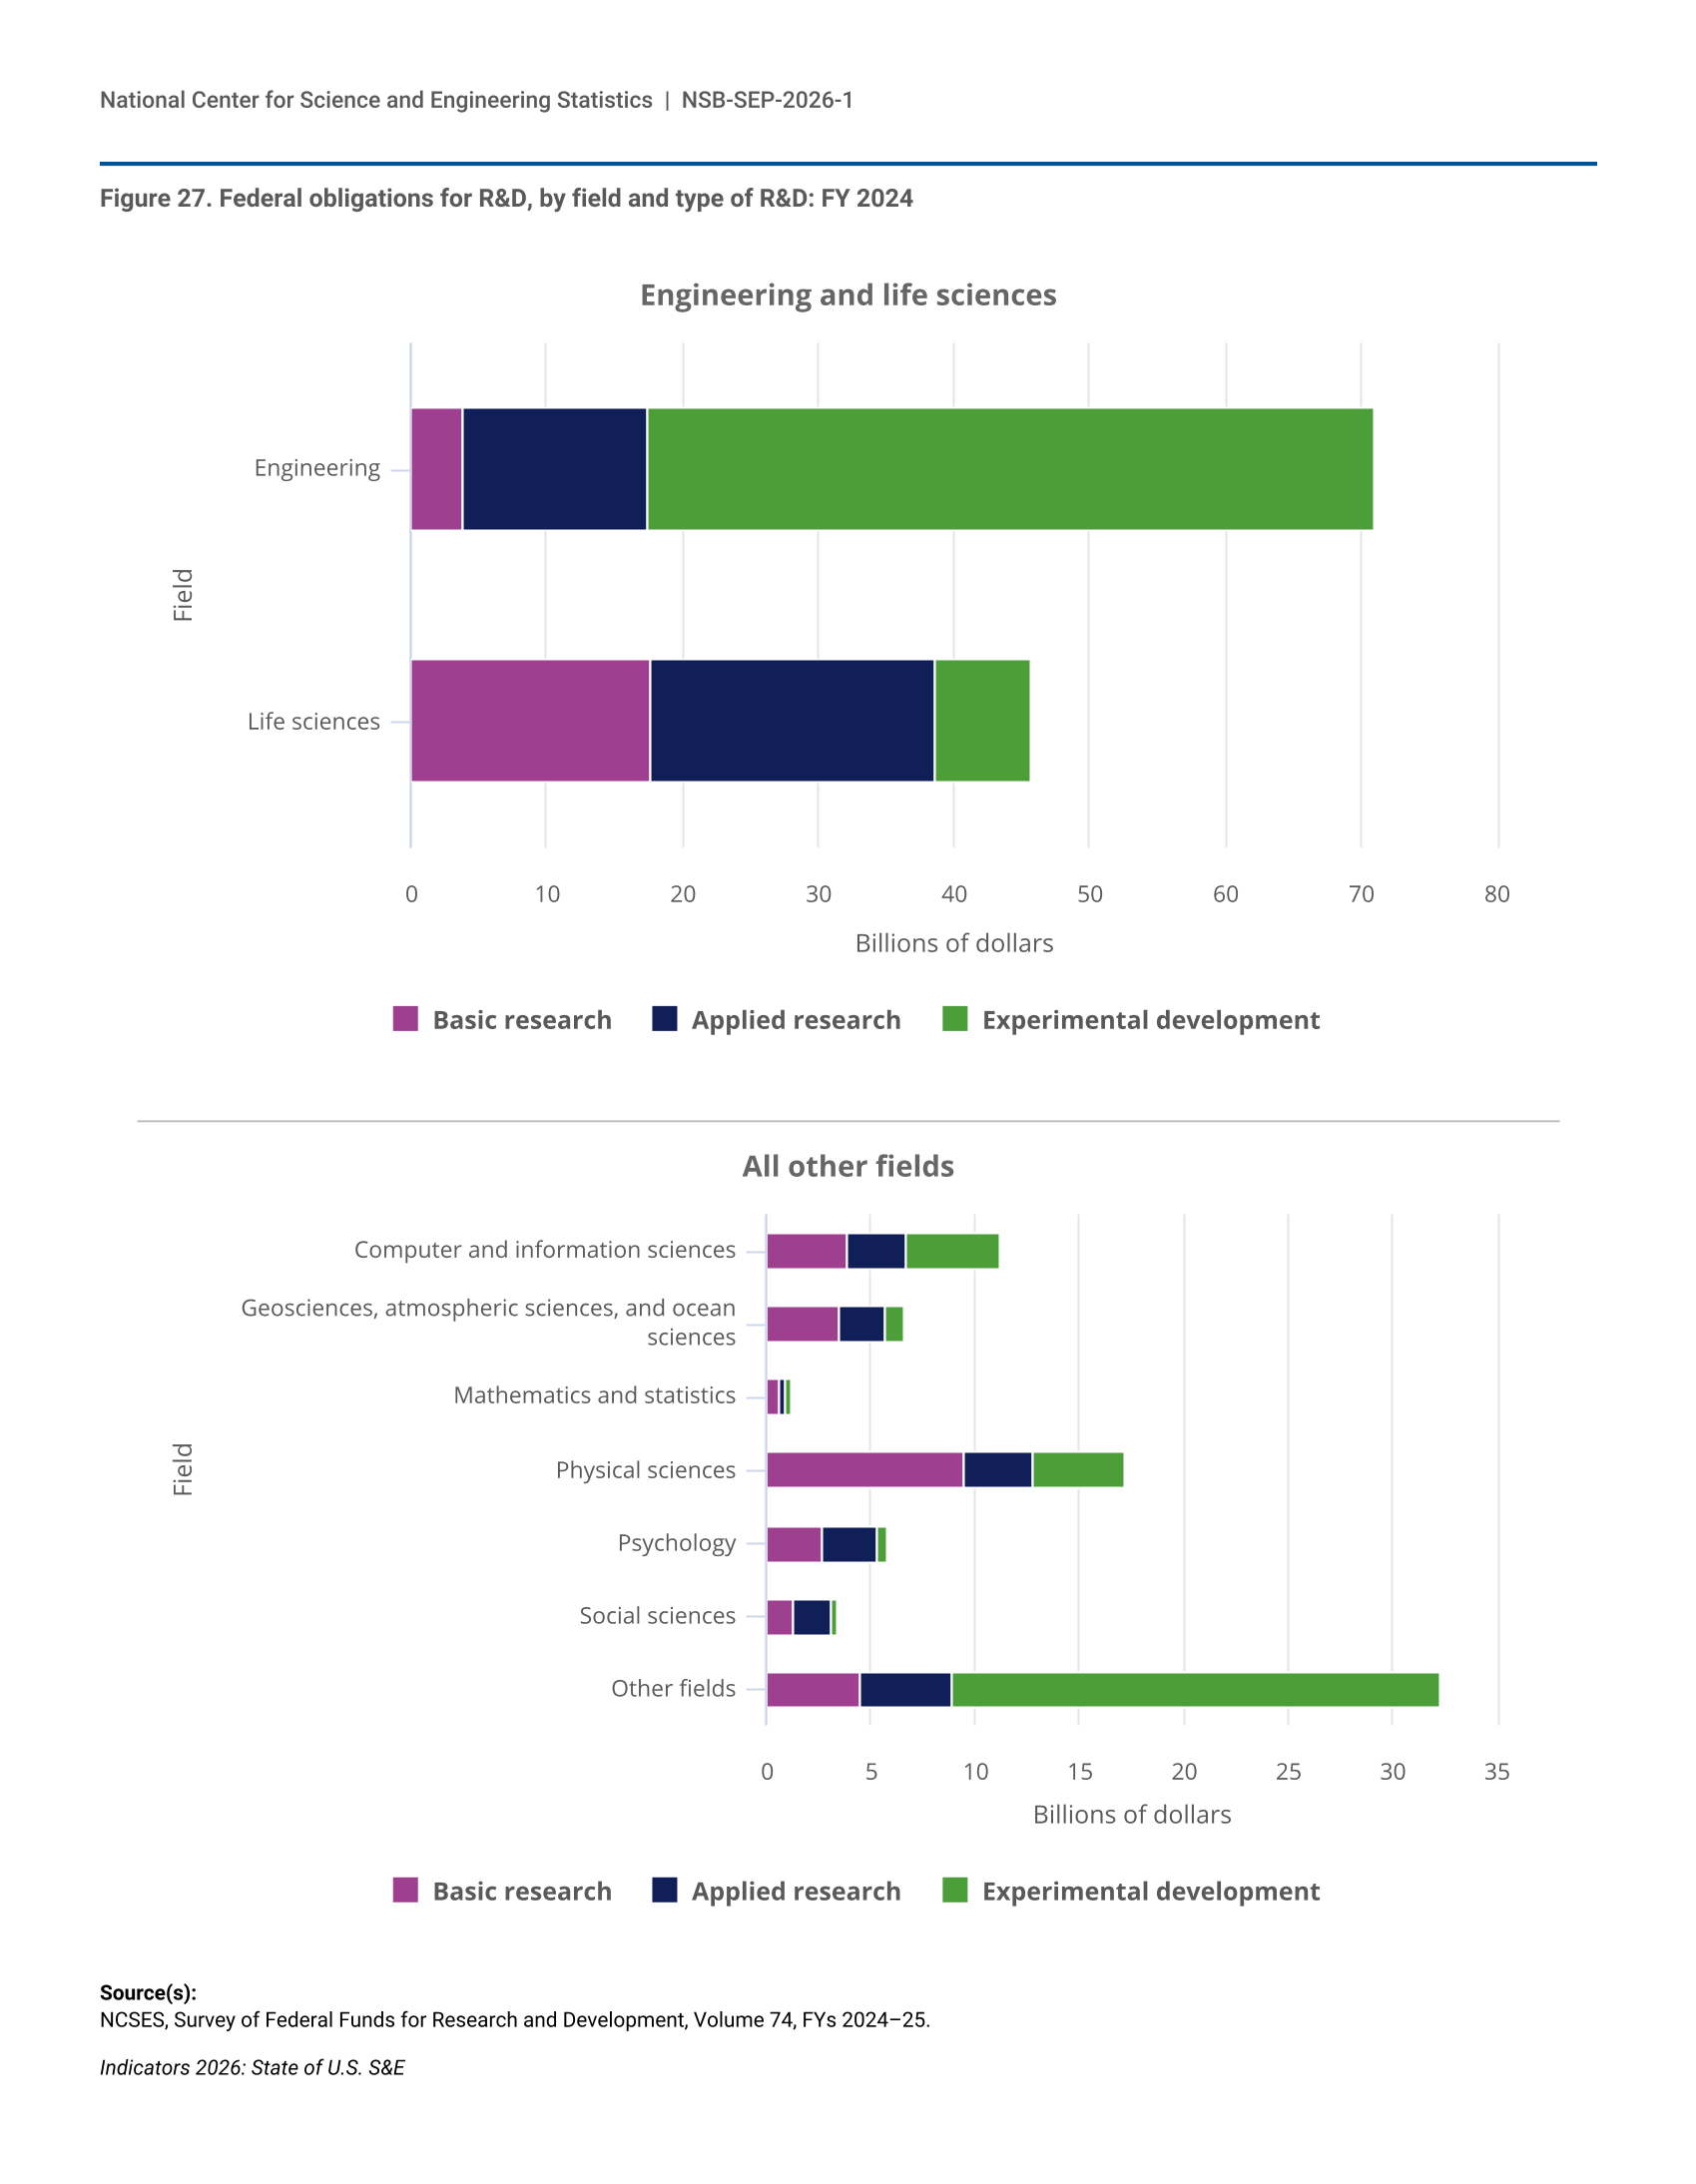
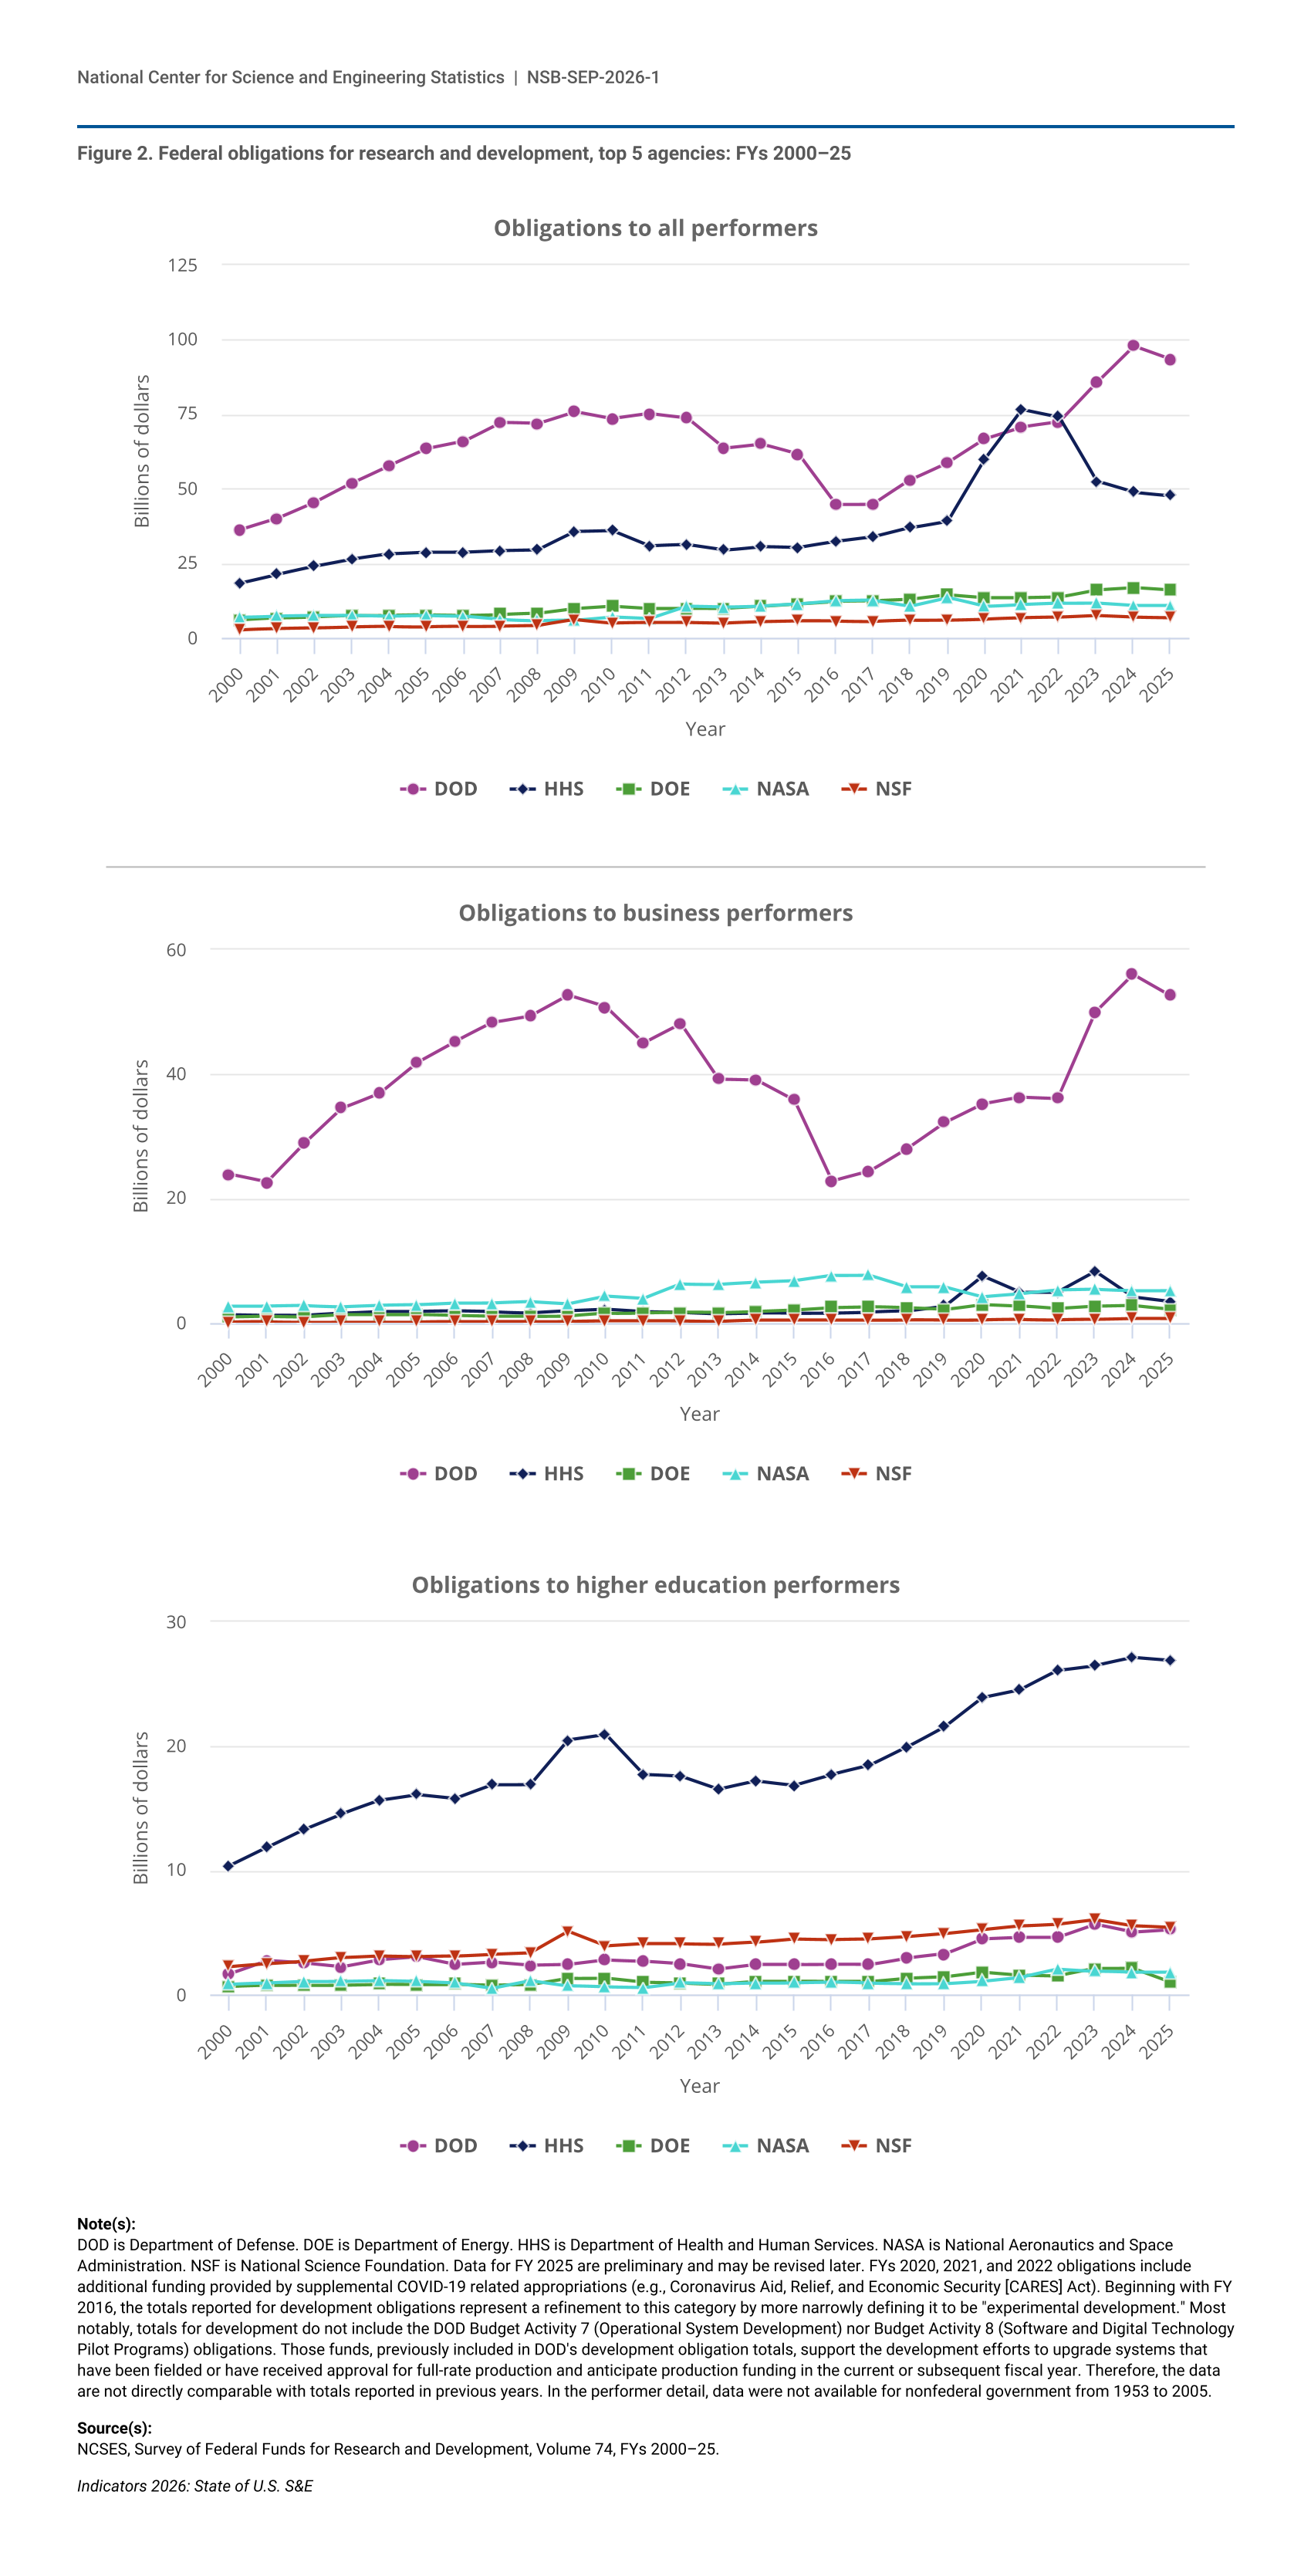
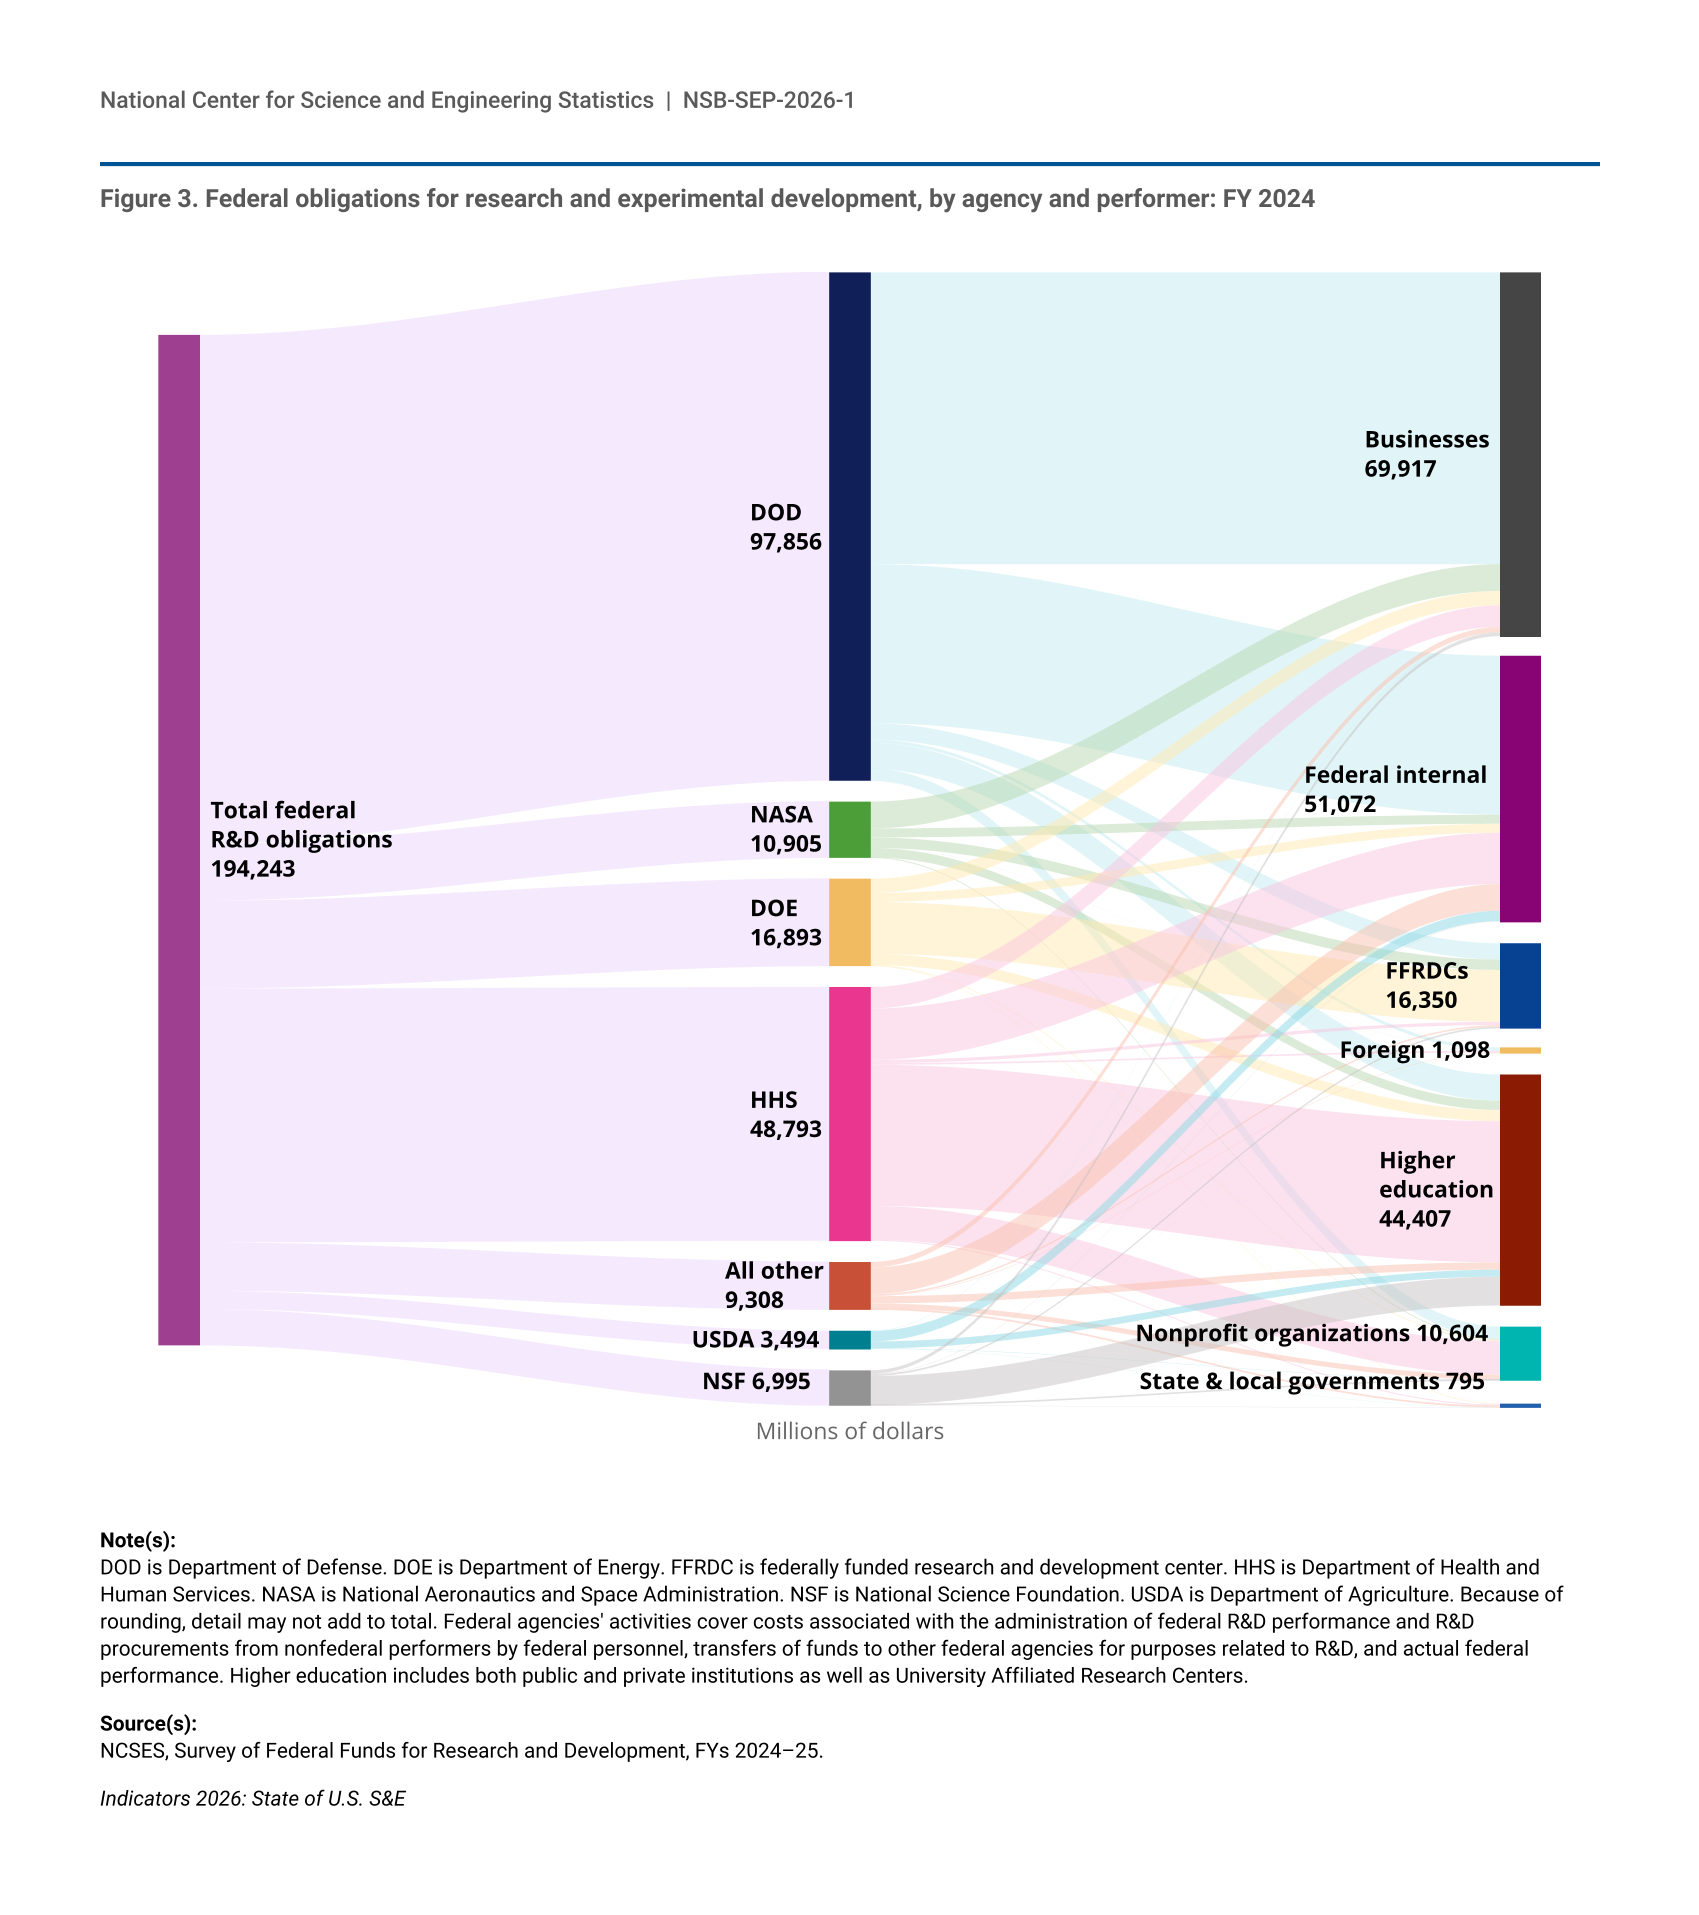
The federal government obligated $194 billion for R&D in FY 2024. DOD accounted for half (50%) of federal R&D obligations; other substantial agency funders of R&D included HHS (25%), DOE (9%), NASA (6%), and NSF (4%) (NCSES Federal Funds 2024–25: Table 5). The two largest fields of federally funded R&D were engineering ($71 billion) and life sciences ($46 billion) (Figure 27).
| Field | Basic research | Applied research | Experimental development |
|---|---|---|---|
| Engineering | 3.9 | 13.6 | 53.5 |
| Life sciences | 17.6 | 21.0 | 7.0 |
| Field | Basic research | Applied research | Experimental development |
|---|---|---|---|
| Computer and information sciences | 3.9 | 2.8 | 4.5 |
| Geosciences, atmospheric sciences, and ocean sciences | 3.5 | 2.2 | 0.9 |
| Mathematics and statistics | 0.6 | 0.3 | 0.3 |
| Physical sciences | 9.5 | 3.3 | 4.4 |
| Psychology | 2.7 | 2.6 | 0.5 |
| Social sciences | 1.3 | 1.8 | 0.3 |
| Other fields | 4.5 | 4.4 | 23.4 |
NCSES, Survey of Federal Funds for Research and Development, Volume 74, FYs 2024–25.
Indicators 2026: State of U.S. S&E
Across all fields of R&D, 24% of federal obligations were dedicated to basic research, 27% to applied research, and 49% to experimental development in FY 2024. Federal R&D obligations in engineering were heavily focused on experimental development (75%), whereas life sciences obligations were more focused on basic research (39%) and applied research (46%), as were federal obligations in most other fields. The federal government’s relative emphasis on research over experimental development, and the distribution of that R&D across fields, distinguish its role in R&D funding from that of the business sector in the nation’s R&D system. Basic research accounted for 6% of all U.S. business R&D in 2023, compared with 24% of federal R&D obligations in FY 2024 (NCSES BERD 2023: Table 12). More than half of federal R&D obligations in three fields were classified as basic research: mathematics and statistics (51%); geosciences, atmospheric sciences, and ocean sciences (53%); and physical sciences (55%) (Figure 27).
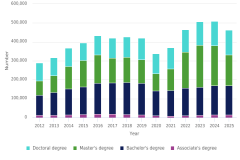
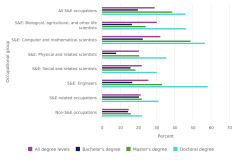
The federal government supported 14% of the nation’s nearly 600,000 full-time graduate students in science, engineering, and health (SEH) fields in 2024 (NCSES GSS 2024: Table 3-1). The federal government supports a higher proportion of doctoral students (25%) than master’s students (5%). This pattern is consistent across all broad SEH fields aside from social sciences, where a marginally higher share of master’s (6%) than doctoral students (5%) received their primary financial support from the federal government in 2024.
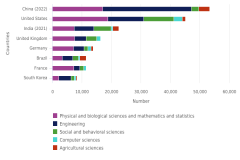
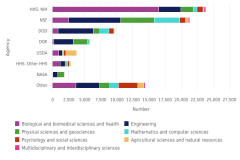
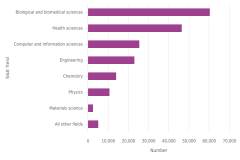
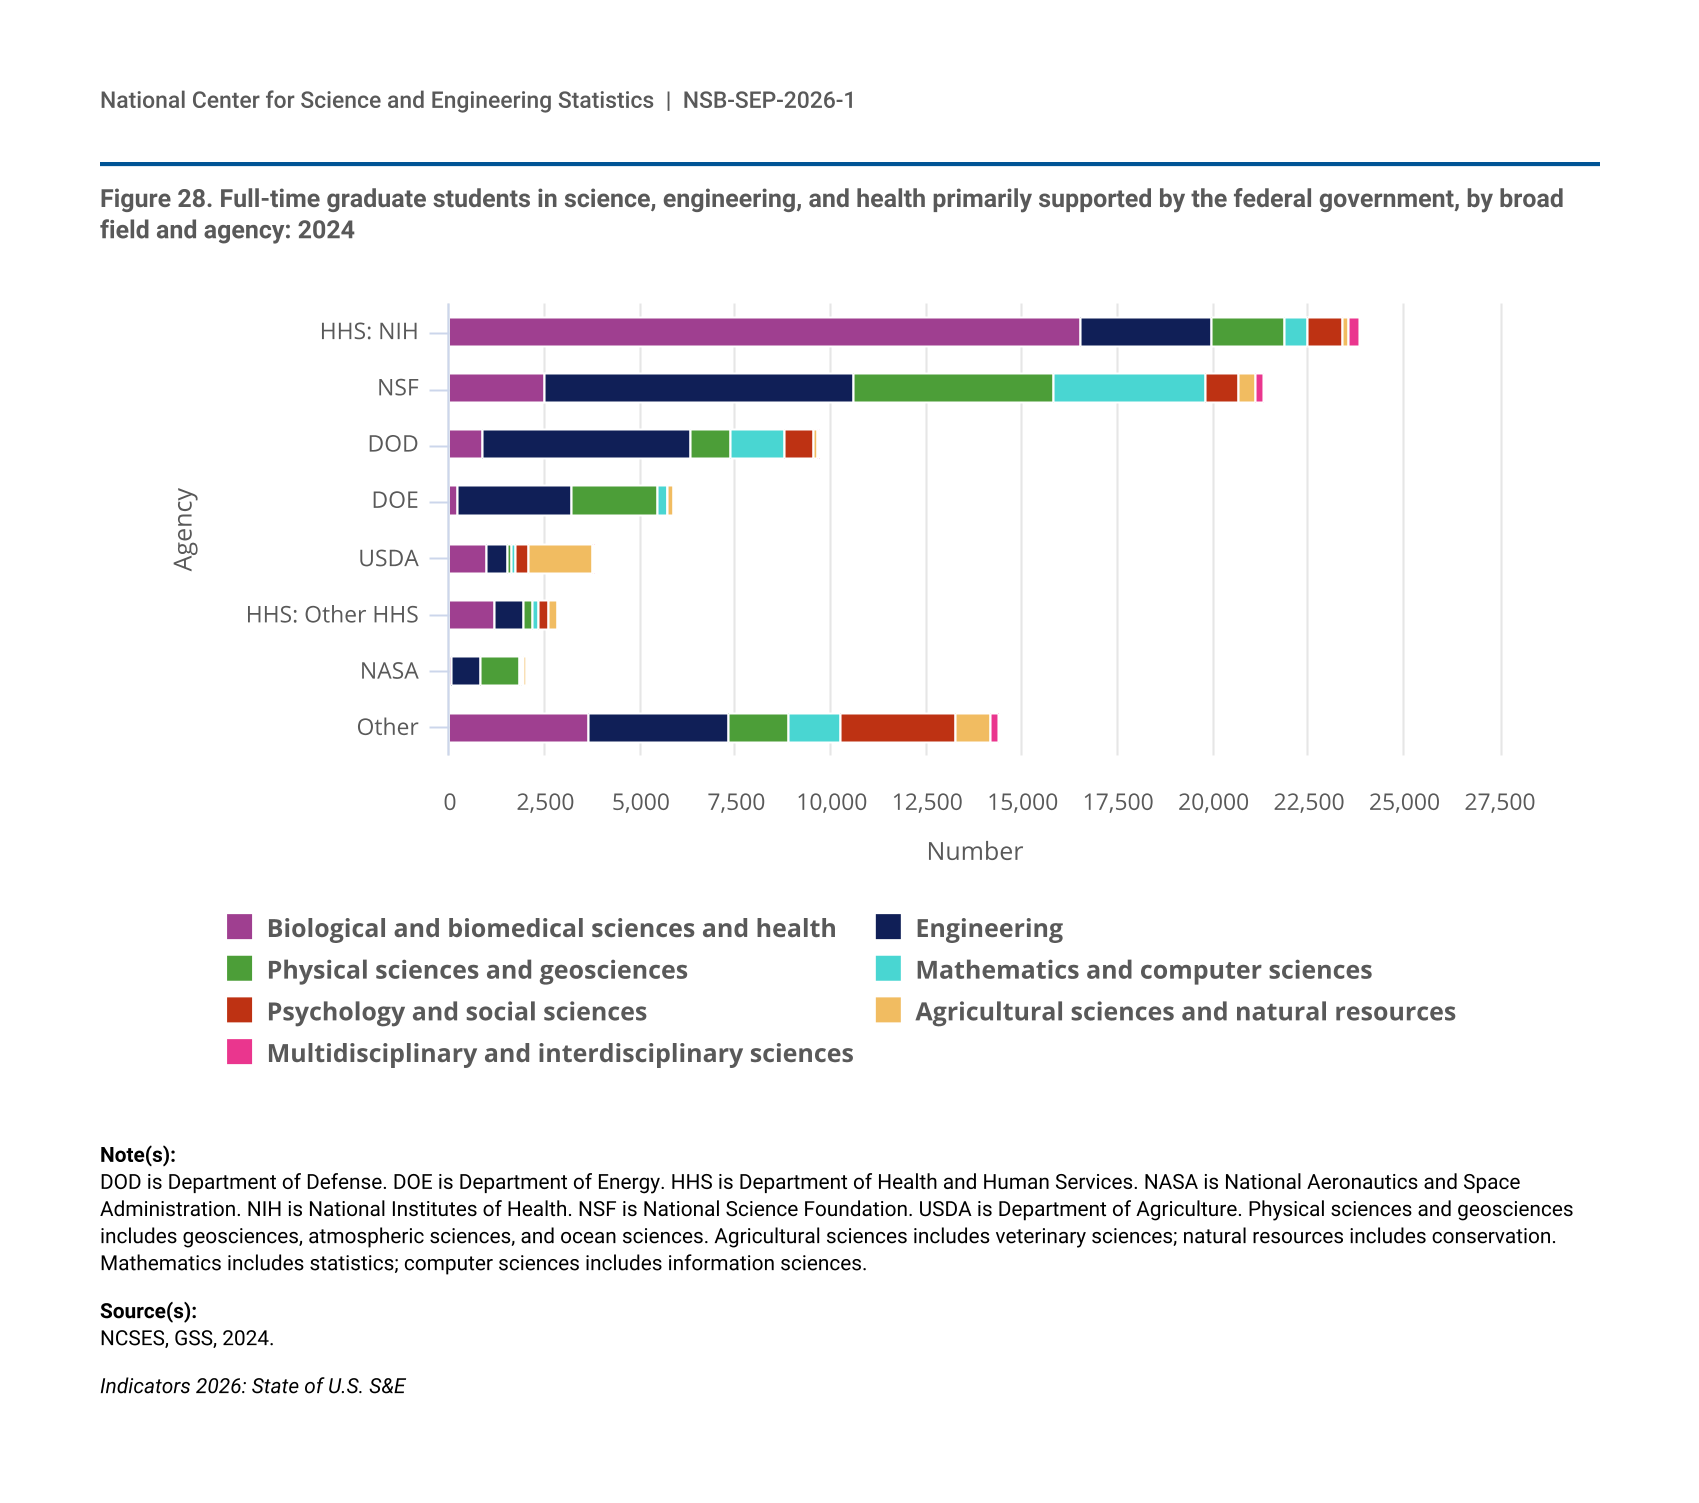
Among federal agencies, the National Institutes of Health (NIH) and NSF supported the greatest number of SEH graduate students, followed by DOD, DOE, and USDA (Figure 28). In 2024, NIH supported nearly 24,000 SEH graduate students, and NSF supported over 21,000, together accounting for 54% of federally supported graduate students. The vast majority of graduate students supported by NIH study biological and biomedical sciences and health. In comparison to other agencies, NSF supports substantial numbers of students across a wider range of fields. In 2024, among graduate students primarily supported by the federal government, NSF funded 50% of students in mathematics and computer sciences, 39% in physical sciences and geosciences, and 31% in engineering.
| Agency | Biological and biomedical sciences and health | Engineering | Physical sciences and geosciences | Mathematics and computer sciences | Psychology and social sciences | Agricultural sciences and natural resources | Multidisciplinary and interdisciplinary sciences |
|---|---|---|---|---|---|---|---|
| HHS: NIH | 16,522 | 3,449 | 1,883 | 625 | 912 | 207 | 238 |
| NSF | 2,517 | 8,049 | 5,243 | 3,976 | 915 | 442 | 213 |
| DOD | 857 | 5,482 | 1,045 | 1,381 | 798 | 88 | 88 |
| DOE | 203 | 3,000 | 2,252 | 272 | 28 | 112 | 49 |
| USDA | 1,009 | 527 | 90 | 144 | 290 | 1,716 | 20 |
| HHS: Other HHS | 1,182 | 771 | 225 | 184 | 264 | 203 | 22 |
| NASA | 54 | 782 | 1,021 | 80 | 31 | 54 | 16 |
| Other | 3,632 | 3,702 | 1,559 | 1,368 | 2,998 | 927 | 245 |
DOD is Department of Defense. DOE is Department of Energy. HHS is Department of Health and Human Services. NASA is National Aeronautics and Space Administration. NIH is National Institutes of Health. NSF is National Science Foundation. USDA is Department of Agriculture. Physical sciences and geosciences includes geosciences, atmospheric sciences, and ocean sciences. Agricultural sciences includes veterinary sciences; natural resources includes conservation. Mathematics includes statistics; computer sciences includes information sciences.
NCSES, GSS, 2024.
Indicators 2026: State of U.S. S&E
Research Publications
Global Output of Research Publications
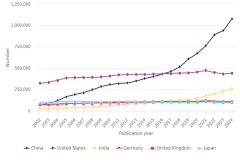
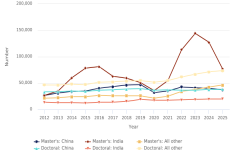
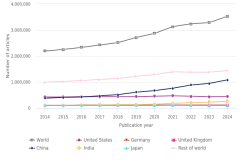
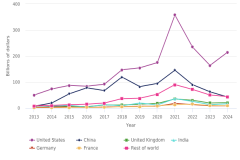
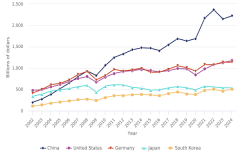
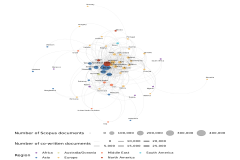
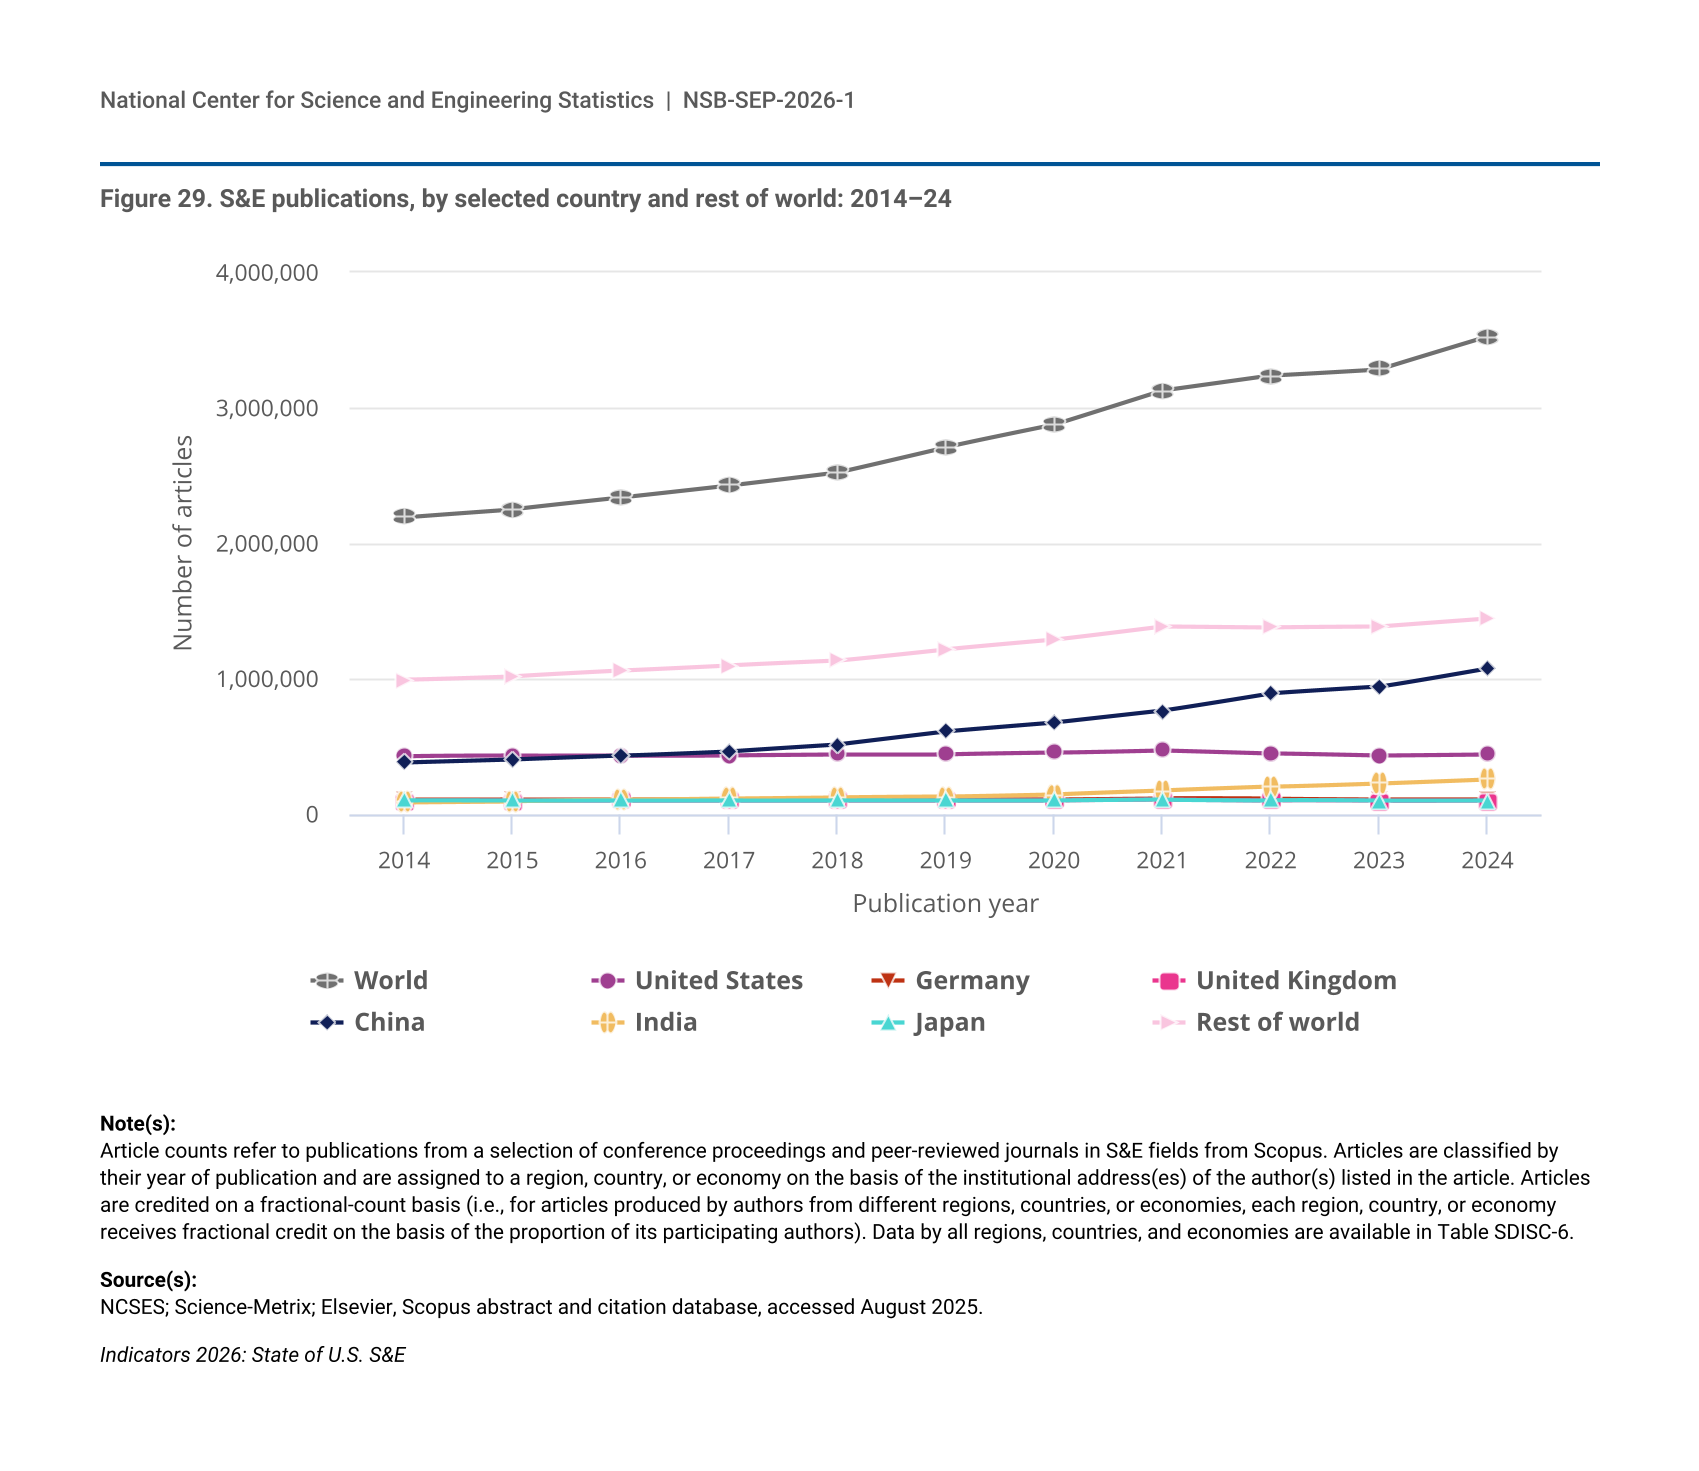
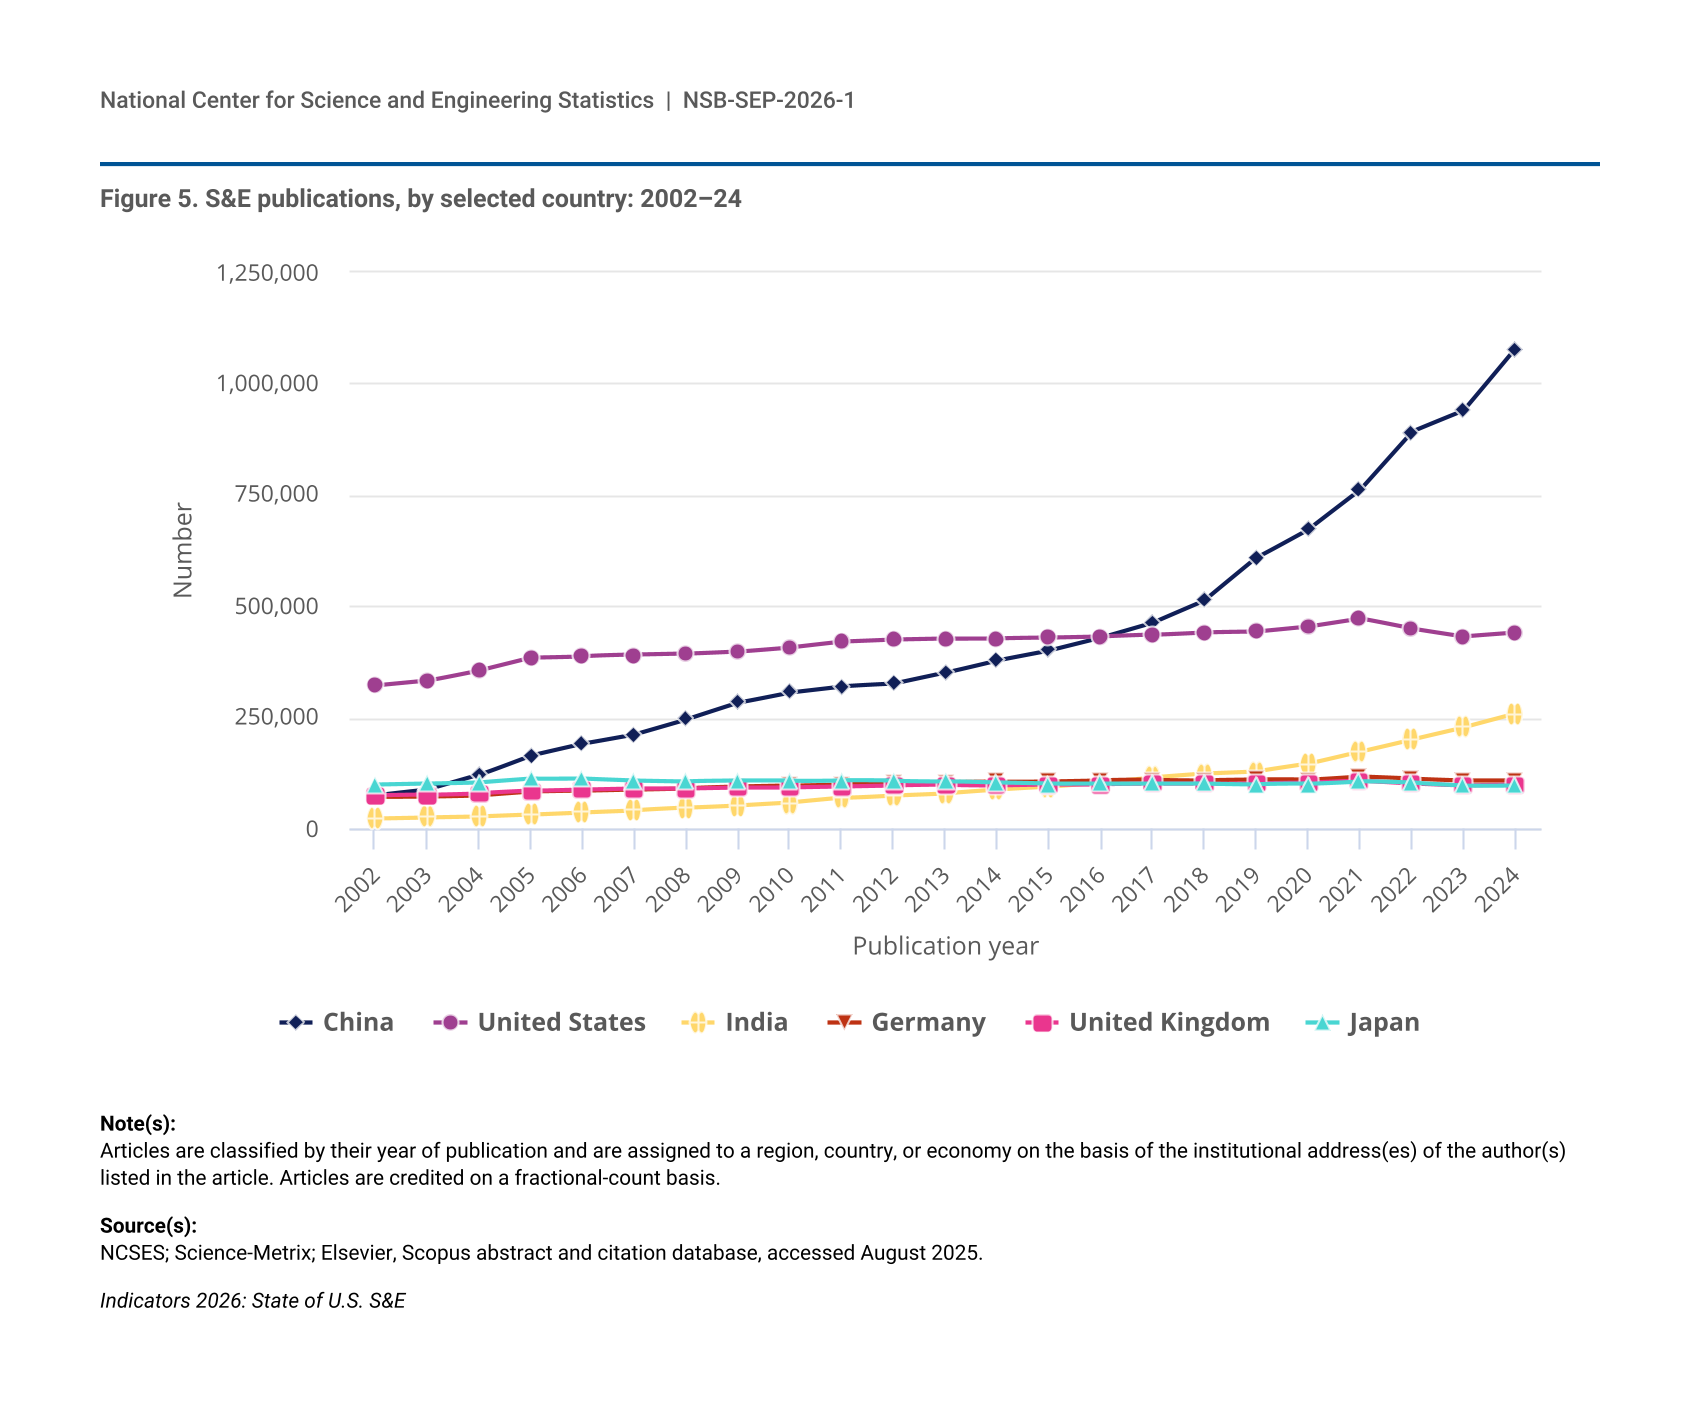
Worldwide S&E publication output totaled 3.5 million articles in 2024, with three countries together accounting for half of the global total: China (31%), the United States (12%), and India (7%). China was the second-largest producer of S&E publications in 2014 behind the United States, then expanded rapidly to become the largest producer, with over 1 million articles in 2024 (Figure 29). Authors from two countries, China and India, were responsible for most of the growth in annual publications since 2014. In contrast, publication output in many advanced economies since 2014 either increased by a small amount, as it did in Germany and United Kingdom, or decreased, as it did in Japan. Articles published by authors in the United States have grown modestly since 2014 but decreased from their peak in 2021.
| Publication year | World | United States | Germany | United Kingdom | China | India | Japan | Rest of world |
|---|---|---|---|---|---|---|---|---|
| 2014 | 2,193,498 | 428,049 | 105,528 | 97,901 | 378,661 | 88,227 | 103,336 | 991,795 |
| 2015 | 2,250,669 | 429,340 | 106,804 | 99,616 | 400,690 | 94,731 | 100,582 | 1,018,906 |
| 2016 | 2,335,510 | 431,848 | 108,978 | 100,133 | 429,614 | 104,549 | 101,145 | 1,059,243 |
| 2017 | 2,425,123 | 435,539 | 109,828 | 100,980 | 463,411 | 115,542 | 101,829 | 1,097,995 |
| 2018 | 2,522,582 | 441,299 | 109,200 | 101,193 | 513,153 | 123,760 | 102,066 | 1,131,912 |
| 2019 | 2,710,512 | 442,821 | 110,442 | 102,112 | 608,541 | 128,410 | 100,232 | 1,217,954 |
| 2020 | 2,873,342 | 454,221 | 109,515 | 103,482 | 672,772 | 145,534 | 100,519 | 1,287,298 |
| 2021 | 3,126,671 | 472,375 | 117,492 | 108,325 | 761,535 | 173,204 | 106,627 | 1,387,112 |
| 2022 | 3,238,106 | 448,935 | 112,822 | 102,064 | 891,697 | 200,839 | 102,670 | 1,379,079 |
| 2023 | 3,285,108 | 431,338 | 109,086 | 97,459 | 938,945 | 227,796 | 96,872 | 1,383,613 |
| 2024 | 3,525,866 | 439,892 | 109,102 | 99,582 | 1,078,580 | 258,469 | 97,974 | 1,442,266 |
Article counts refer to publications from a selection of conference proceedings and peer-reviewed journals in S&E fields from Scopus. Articles are classified by their year of publication and are assigned to a region, country, or economy on the basis of the institutional address(es) of the author(s) listed in the article. Articles are credited on a fractional-count basis (i.e., for articles produced by authors from different regions, countries, or economies, each region, country, or economy receives fractional credit on the basis of the proportion of its participating authors). Data by all regions, countries, and economies are available in Table SDISC-6.
NCSES; Science-Metrix; Elsevier, Scopus abstract and citation database, accessed August 2025.
Indicators 2026: State of U.S. S&E
The distribution of publications by field of science may indicate national and regional research priorities and capabilities. Globally, health sciences represented 22% of all publications in 2024, the highest output of any field. Other fields with large numbers of publications included engineering (18%), computer and information sciences (14%), and biological and biomedical sciences (12%). Among the top producers, authors in the United States (36%), Japan (32%), and the EU-27 (26%) had their highest share of publications in health sciences in 2024. Meanwhile, authors from China had the greatest share of their publications in engineering (27%), and authors from India had their greatest share in computer and information sciences (30%).
Impact of Published Research
Gross counts of scientific publications by nation are one indicator of scientific productivity. However, taken alone they may be easy to misinterpret due to international differences in the allocation of R&D funding and performance across business, government, and academic sectors; toward research in specific S&E areas; and incentive structures for researchers to publish. Additionally, the reported proliferation of articles generated by paper mills—organizations that produce fraudulent publications and sell authorship to customers—and AI generated results may complicate the use gross counts alone (Liverpool 2023; Van Noorden 2023). Published articles produced by paper mills are reported to be doubling every 1.5 years with signs of an “industrial scale of production” (Richardson et al. 2025). To address these challenges, Indicators also provides measures of HCAs, those in the top 1% of cited articles within a field, in addition to gross publication counts (NSB 2023; NSB 2025).
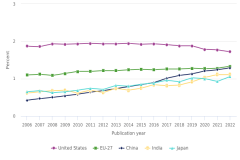
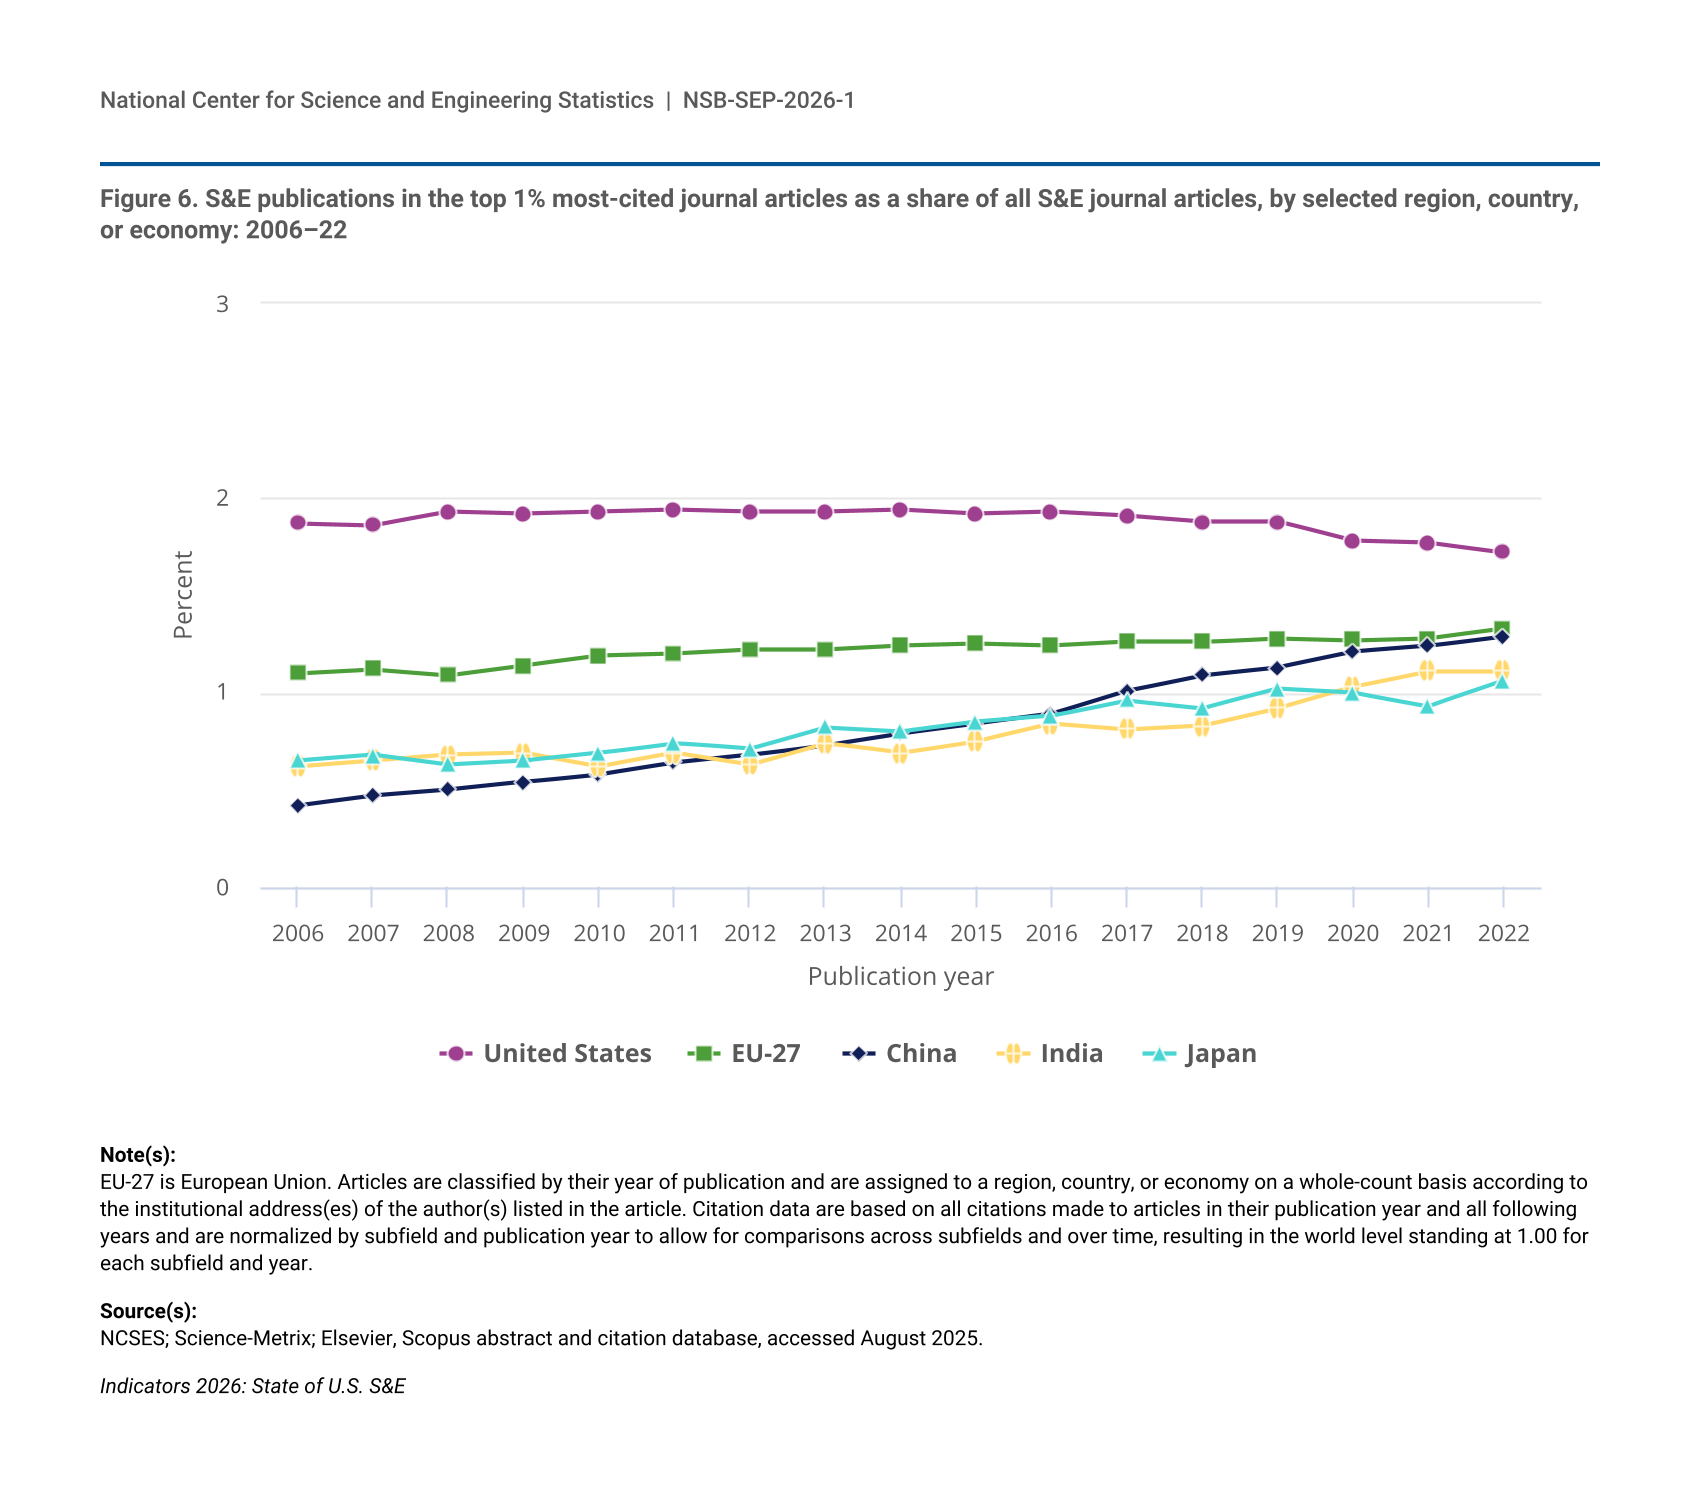
The level of citations received by scholarly articles is a method of gauging their scientific impact. Articles in the top 1% of all published articles by citations in a given year and field are designated as HCAs. In 2022, 1.7% of peer-reviewed publications with U.S. authors were HCAs, showing that authors from the United States generate a disproportionate share of influential articles. China’s HCA share, which has increased each year since 2006, reached 1.3% in 2022. The collective HCA share for the EU-27 was 1.3%, and India’s and Japan’s shares were each 1.1% (NSB 2025: Figure DISC-26).
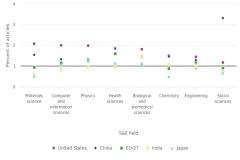
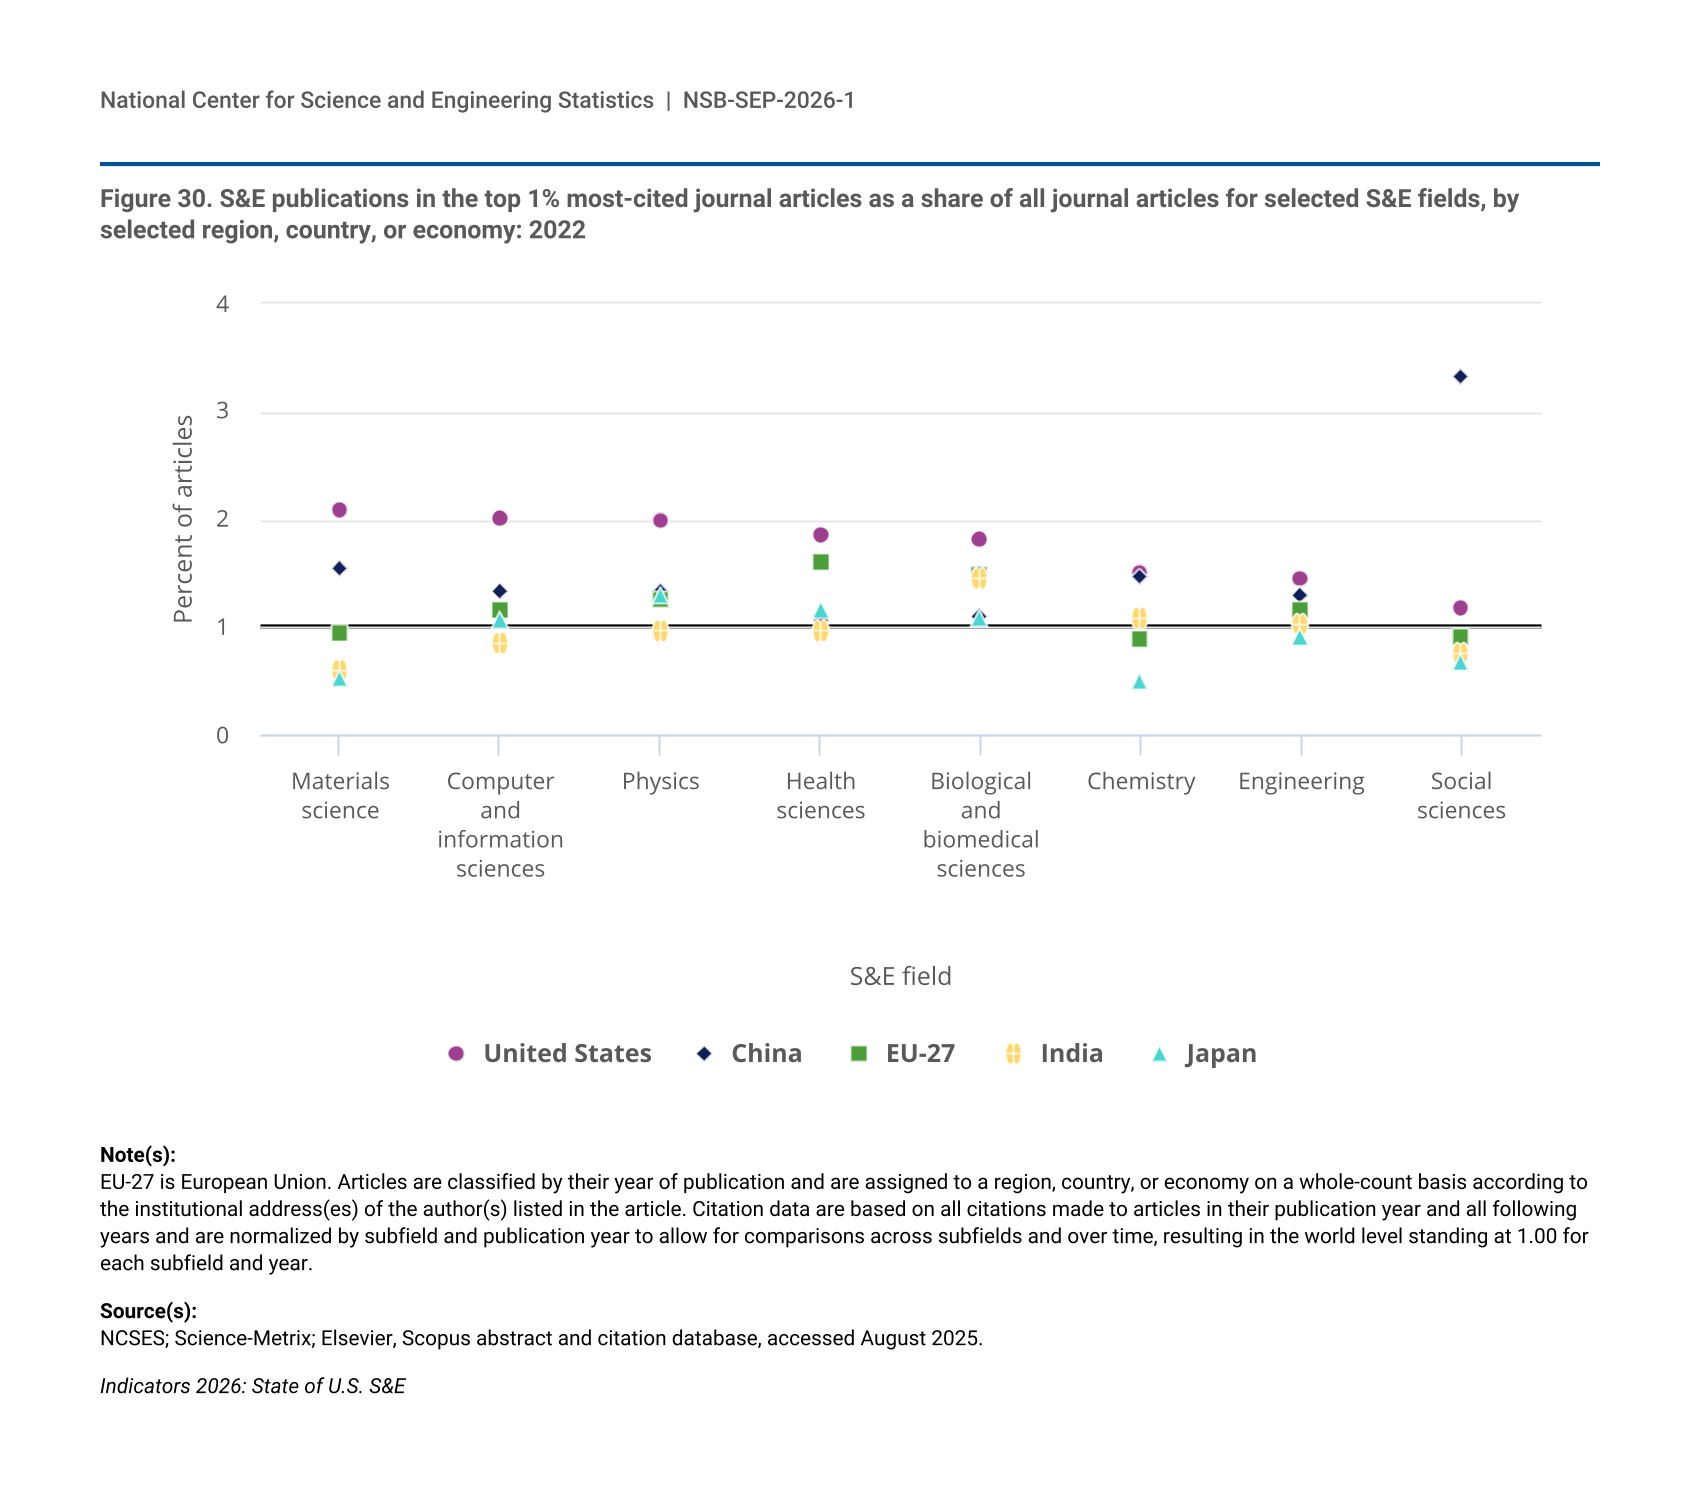
For S&E articles published in 2022, the HCA share of each country also varied between fields, reflecting research specializations or differences in the country’s prominence in particular research fields or topics. In several fields—materials science (2.1%), computer and information sciences (2.0%), physics (2.0%), health sciences (1.9%), and biological and biomedical sciences (1.8%)—the U.S. HCA share was higher than its overall share. In addition, the U.S. HCA share in each of those fields was higher than those of China, the EU-27, Japan, and India (Figure 30). China and the United States had similar HCA shares in engineering and in chemistry. Within social sciences, China had an HCA share of 3.3%, far higher than the HCA shares of other top producers of publications.
| S&E field | United States | China | EU-27 | India | Japan |
|---|---|---|---|---|---|
| Materials science | 2.09 | 1.55 | 0.94 | 0.60 | 0.53 |
| Computer and information sciences | 2.01 | 1.33 | 1.16 | 0.85 | 1.07 |
| Physics | 1.99 | 1.33 | 1.25 | 0.96 | 1.30 |
| Health sciences | 1.86 | 1.06 | 1.61 | 0.96 | 1.16 |
| Biological and biomedical sciences | 1.82 | 1.11 | 1.48 | 1.45 | 1.09 |
| Chemistry | 1.50 | 1.47 | 0.88 | 1.09 | 0.51 |
| Engineering | 1.45 | 1.29 | 1.15 | 1.02 | 0.91 |
| Social sciences | 1.17 | 3.32 | 0.91 | 0.76 | 0.67 |
EU-27 is European Union. Articles are classified by their year of publication and are assigned to a region, country, or economy on a whole-count basis according to the institutional address(es) of the author(s) listed in the article. Citation data are based on all citations made to articles in their publication year and all following years and are normalized by subfield and publication year to allow for comparisons across subfields and over time, resulting in the world level standing at 1.00 for each subfield and year.
NCSES; Science-Metrix; Elsevier, Scopus abstract and citation database, accessed August 2025.
Indicators 2026: State of U.S. S&E
International Collaboration in Published Research
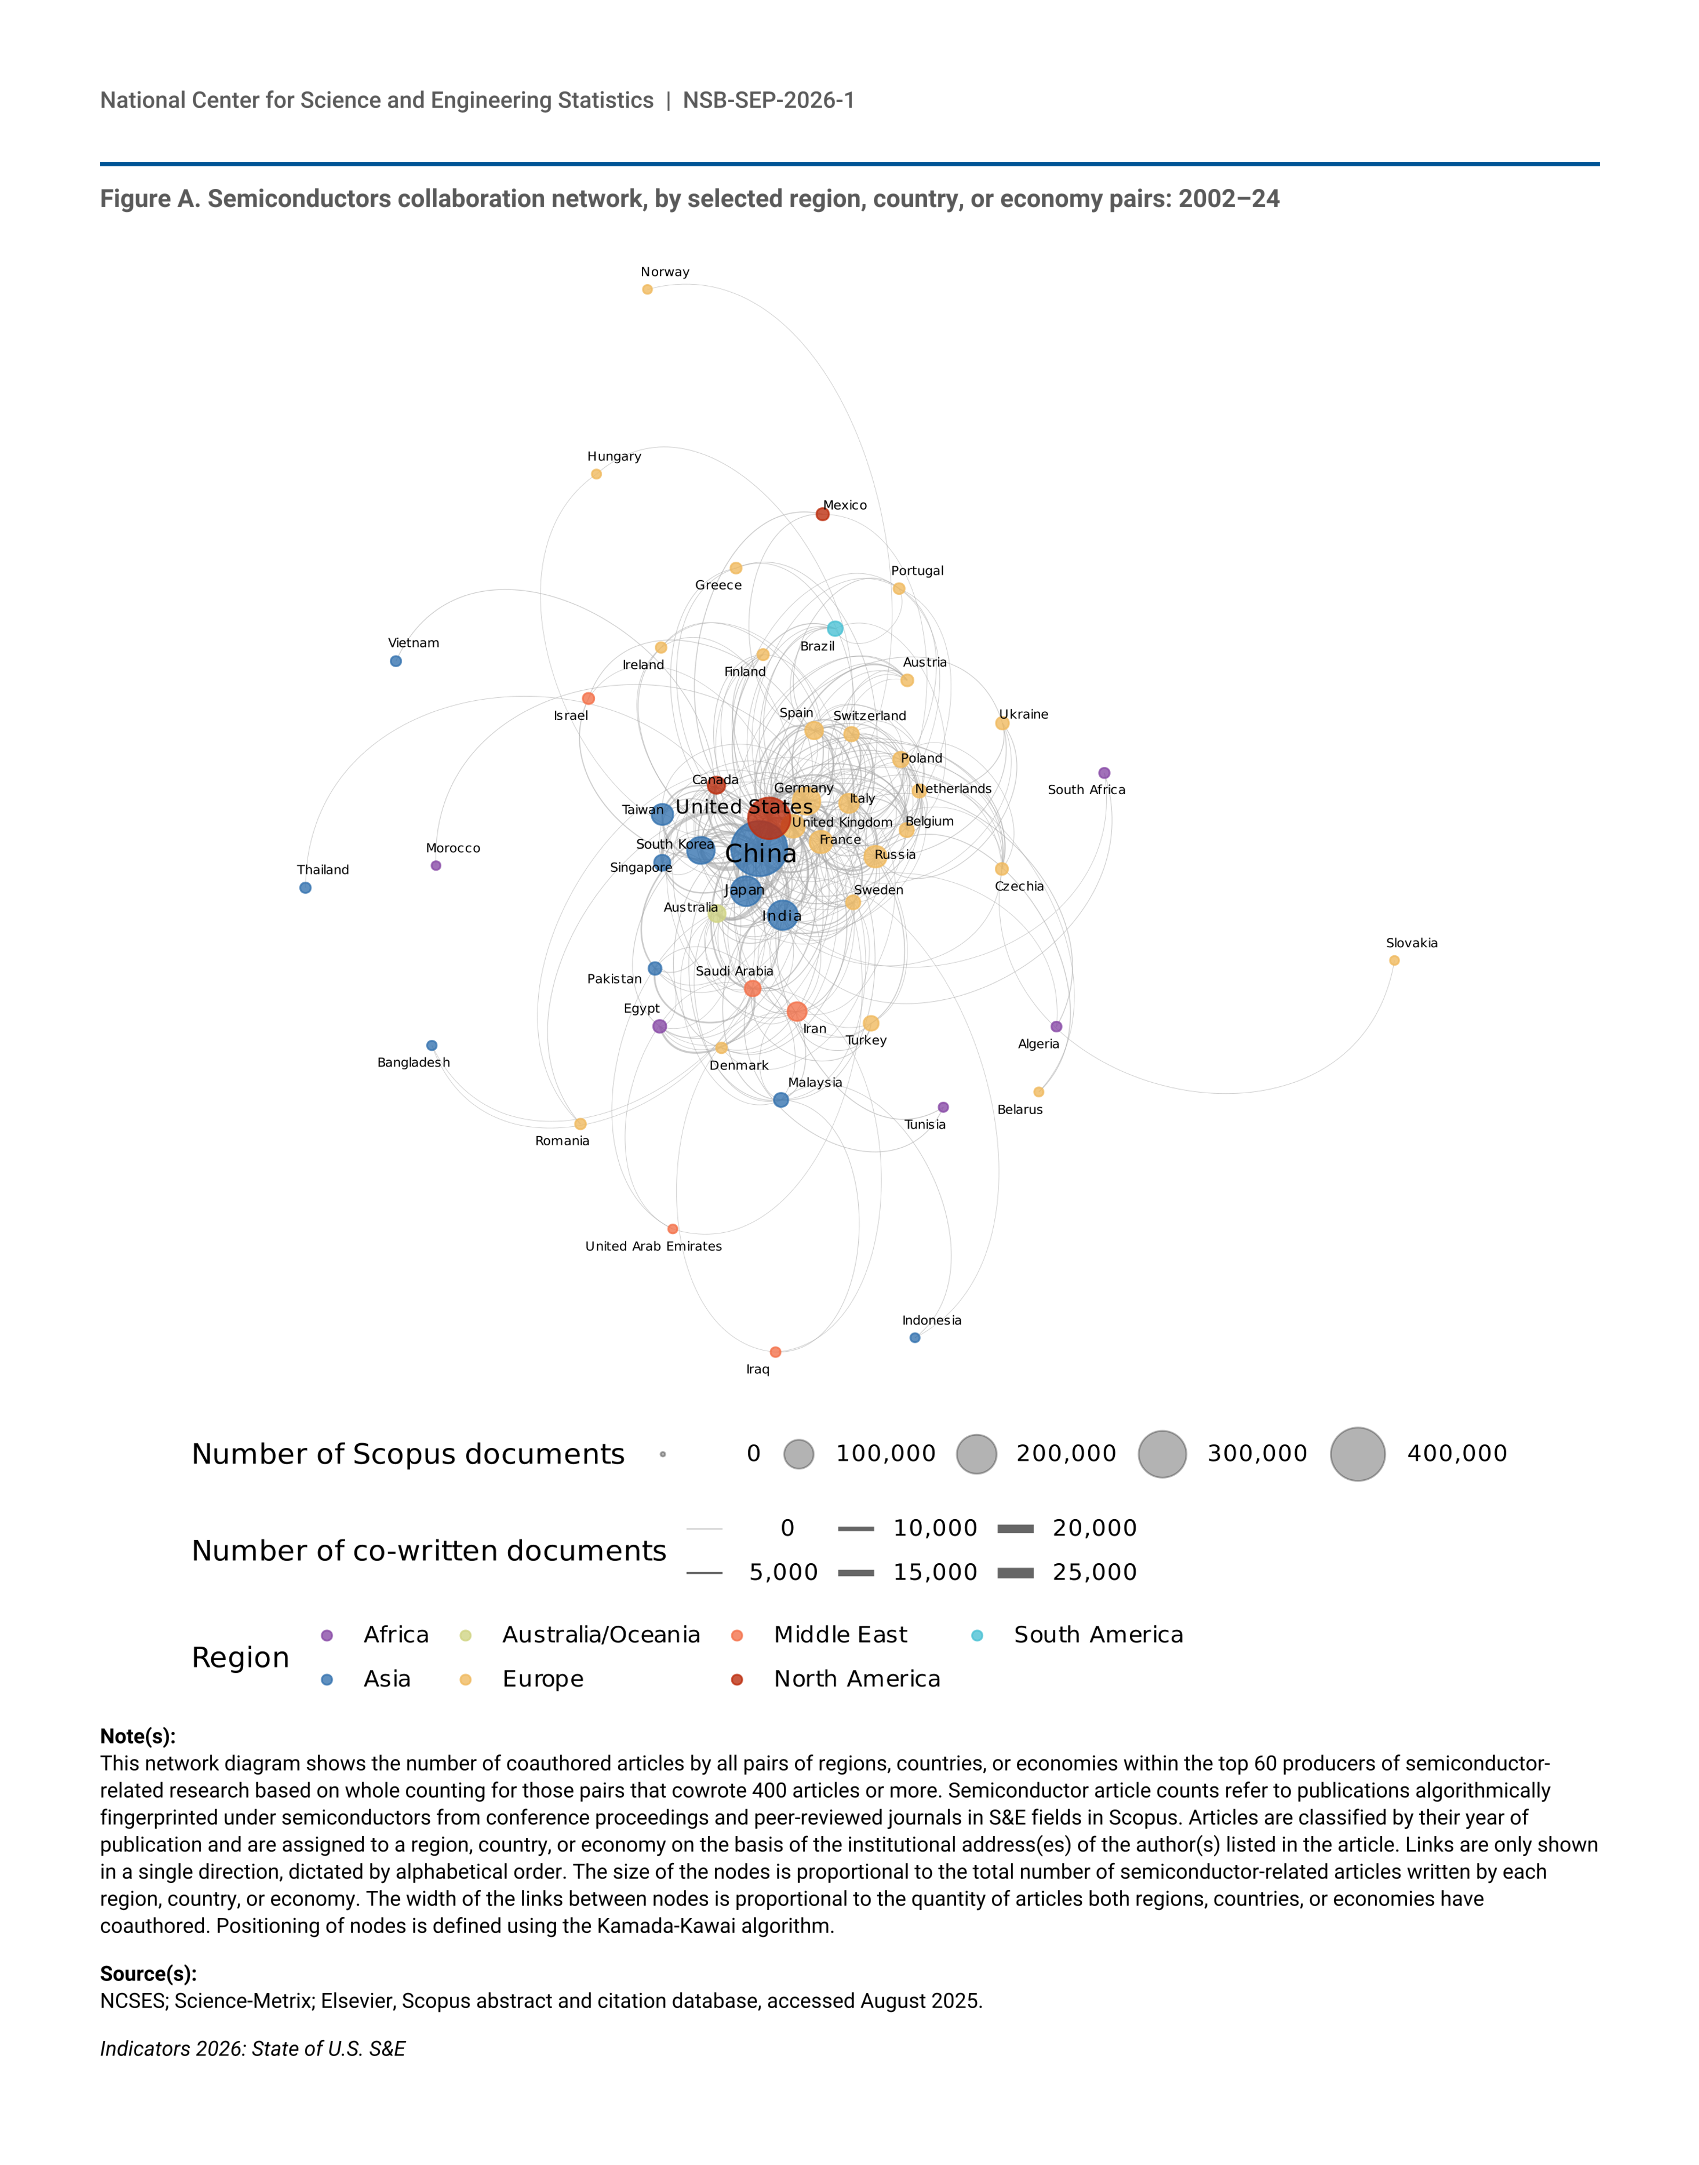
The share of global S&E articles produced with international collaboration has grown over time, increasing from 19% of all articles in 2012 to 22% in 2024 (Table S17). In that year, researchers in the United States contributed to nearly 240,000 articles involving international coauthorship, representing 31% of all internationally coauthored articles, more than any other country (for the U.S. role in semiconductor research collaboration, see sidebar International Collaboration in Semiconductor Research). Although the United States had the highest number of internationally coauthored articles in 2024, its share of published articles with international coauthors (41%) is lower than the shares for the United Kingdom (69%) and Germany (57%) (Table S17). China is the most frequent source for international collaboration with U.S. authors on S&E publications. In 2024, 23% of internationally coauthored U.S. articles had a Chinese coauthor, followed by coauthorship with the United Kingdom (15%), which had been the most common international collaborator with U.S. authors prior to 2010 (Table S18). However, compared with other top producers of published research, China has a low share of articles (16% in 2024) with international collaborators, and it is the only top producer that has decreased its international collaboration rate since its peak in 2018 (22%).
