 An official website of the United States government
 Data
Tables
Select "VIEW" to see the table. PDF and Excel are available for download.
Figures
Data Sources
DOWNLOAD DATA SOURCES| Item | Title | Provider | Product |
|---|---|---|---|
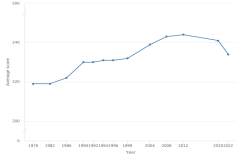
| Figure K12-1 | Average scores of 9-year-old students on the NAEP long-term trend mathematics assessment: 1978–2022 | National Center for Education Statistics | National Assessment of Educational Progress |
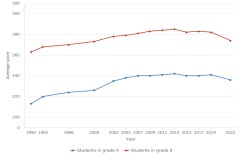
| Figure K12-2 | Average scores of students in grades 4 and 8 on the main NAEP mathematics assessment: 1990–2022 | National Center for Education Statistics | National Assessment of Educational Progress |
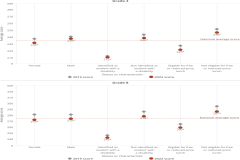
| Figure K12-3 | Average scores of students in grades 4 and 8 on the main NAEP mathematics assessment, by sex, disability status, and socioeconomic status: 2019 and 2022 | National Center for Education Statistics | National Assessment of Educational Progress |
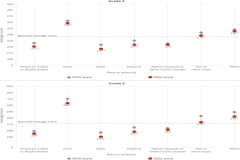
| Figure K12-4 | Average scores of students in grades 4 and 8 on the main NAEP mathematics assessment, by race or ethnicity: 2019 and 2022 | National Center for Education Statistics | National Assessment of Educational Progress |
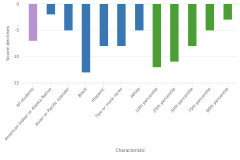
| Figure K12-5 | Score declines for 9-year-old students on the NAEP long-term trend mathematics assessment, by race or ethnicity and percentile: 2020 and 2022 | National Center for Education Statistics | National Assessment of Educational Progress |
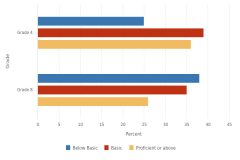
| Figure K12-6 | Students in grades 4 and 8 scoring at each NAEP achievement level in mathematics, by grade: 2022 | National Center for Education Statistics | National Assessment of Educational Progress |
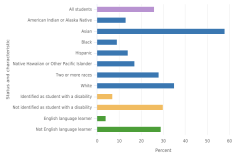
| Figure K12-7 | Students in grade 8 scoring NAEP Proficient or above in mathematics, by race or ethnicity, student disability status, and English language learner status: 2022 | National Center for Education Statistics | National Assessment of Educational Progress |
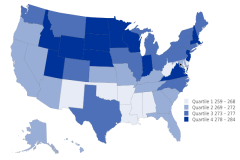
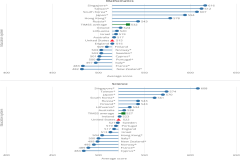
| Figure K12-8 | Average scores of students in grade 8 on the main NAEP mathematics assessment, by state: 2022 | National Center for Education Statistics | National Assessment of Educational Progress |
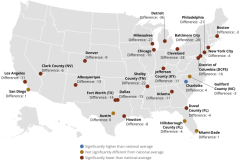
| Figure K12-9 | Comparison of average scores of students in grade 8 in urban school districts with national public average score on the main NAEP mathematics assessment: 2022 | National Center for Education Statistics | National Assessment of Educational Progress |
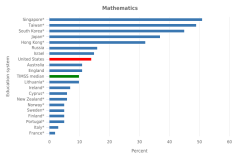
| Figure K12-10 | Average scores of students in grade 8 on the TIMSS mathematics and science scales among participating advanced economies, by education system: 2019 | International Association for the Evaluation of Educational Achievement | Trends in International Mathematics and Science Study |
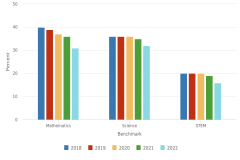
| Figure K12-11 | Students in grade 8 reaching the TIMSS Advanced International Benchmark in mathematics and science among participating advanced economies, by education system: 2019 | International Association for the Evaluation of Educational Achievement | Trends in International Mathematics and Science Study |
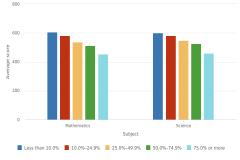
| Figure K12-12 | Average scores of U.S. students in grade 8 on the TIMSS mathematics and science scales, by school percentage of students eligible for free or reduced-price lunch: 2019 | International Association for the Evaluation of Educational Achievement | Trends in International Mathematics and Science Study |
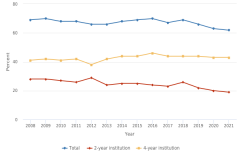
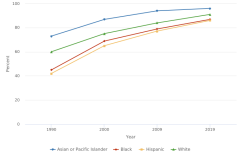
| Figure K12-14 | Immediate college enrollment rates among high school completers, by institution type: 2008–21 | National Center for Education Statistics | Digest of Education Statistics |
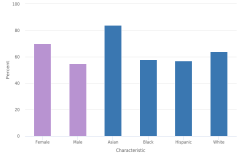
| Figure K12-15 | Immediate college enrollment rates among high school completers, by sex and race or ethnicity: 2021 | National Center for Education Statistics | Digest of Education Statistics |
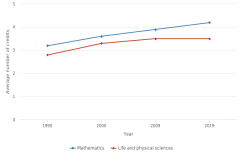
| Figure K12-16 | Average number of Carnegie credits earned by high school graduates, by academic course subject: 1990–2019 | National Center for Education Statistics | National Assessment of Educational Progress |
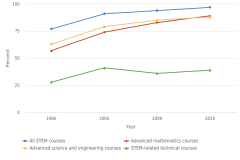
| Figure K12-17 | High school graduates who earned Carnegie credits in STEM courses, total and by STEM course type: 1990–2019 | National Center for Education Statistics | National Assessment of Educational Progress |
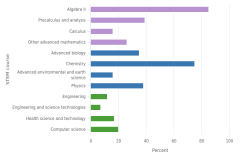
| Figure K12-18 | High school graduates who earned Carnegie credits in STEM advanced mathematics courses, advanced science and engineering courses, and STEM-related technical courses, by STEM course: 2019 | National Center for Education Statistics | National Assessment of Educational Progress |
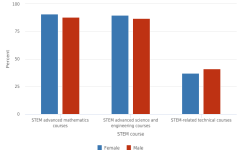
| Figure K12-19 | High school graduates who earned Carnegie credits in STEM advanced mathematics courses, STEM advanced science and engineering courses, and STEM-related technical courses, by student sex: 2019 | National Center for Education Statistics | National Assessment of Educational Progress |
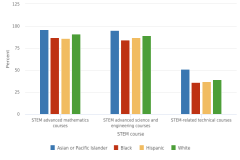
| Figure K12-20 | High school graduates who earned Carnegie credits in STEM advanced mathematics courses, STEM advanced science and engineering courses, and STEM-related technical courses, by student race or ethnicity: 2019 | National Center for Education Statistics | National Assessment of Educational Progress |
| Figure K12-21 | High school graduates who earned Carnegie credits in STEM advanced mathematics courses, by student race or ethnicity: 1990–2019 | National Center for Education Statistics | National Assessment of Educational Progress |
| Table K12-1 | Average scores of students in grades 4 and 8 on the main NAEP mathematics assessment, by race or ethnicity and socioeconomic status: 2022 | National Center for Education Statistics | National Assessment of Educational Progress |
| Table K12-2 | Average TIMSS mathematics and science scores of students in grades 4 and 8: 1995–2019 | International Association for the Evaluation of Educational Achievement | Trends in International Mathematics and Science Study |