 An official website of the United States government
 Data
Tables
Select "VIEW" to see the table. PDF and Excel are available for download.
Figures
Data Sources
DOWNLOAD DATA SOURCES| Item | Title | Provider | Product |
|---|---|---|---|
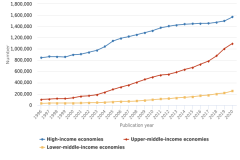
| Figure PBS-1 | S&E articles, by income group: 1996–2020 | Elsevier | Scopus |
| Figure PBS-1 | S&E articles, by income group: 1996–2020 | World Bank | World Bank Country and Lending Groups |
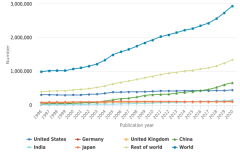
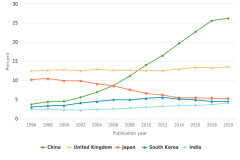
| Figure PBS-2 | S&E articles, by selected region, country, or economy and rest of world: 1996–2020 | Elsevier | Scopus |
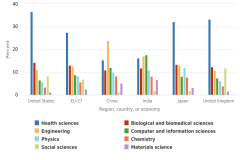
| Figure PBS-3 | S&E research portfolios, by eight largest fields of science and by selected region, country, or economy: 2020 | Elsevier | Scopus |
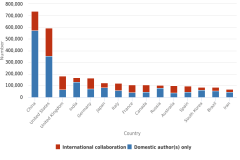
| Figure PBS-4 | International coauthorship of S&E articles for the 15 largest producing countries of S&E articles, by country: 2020 | Elsevier | Scopus |
| Figure PBS-5 | U.S. international articles with coauthor(s) from the United Kingdom and Asian countries: Selected years, 1996–2020 | Elsevier | Scopus |
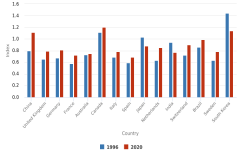
| Figure PBS-6 | Relative international collaboration specialization of select large producing countries with the United States: 1996 and 2020 | Elsevier | Scopus |
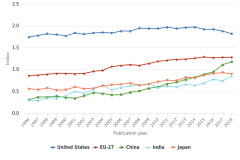
| Figure PBS-7 | Share of S&E articles in the top 1% most-cited journal articles, by selected region, country, or economy: 1996–2018 | Elsevier | Scopus |
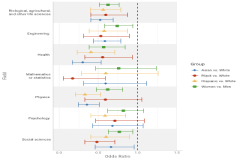
| Figure PBS-A | S&E pre-doctorate publishing odds ratio, by sex and selected race or ethnicity: 1995–2006 | Clarivate | Web of Science |
| Figure PBS-A | S&E pre-doctorate publishing odds ratio, by sex and selected race or ethnicity: 1995–2006 | National Center for Science and Engineering Statistics | Survey of Doctorate Recipients |
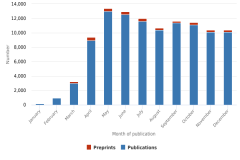
| Figure PBS-B | S&E articles on coronavirus in CORD-19: 2020 | Allen Institute for AI | CORD-19 Open Research Dataset |
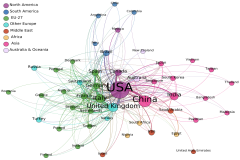
| Figure PBS-C | Coronavirus collaboration network, by country: 2020 | Elsevier | Scopus |
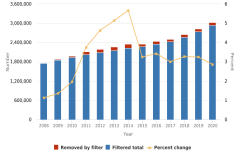
| Figure SAPBS-1 | Filtered and unfiltered publications in Scopus, by year: 2008–20 | Elsevier | Scopus |
| Figure SAPBS-2 | Impact of removing low-quality publications from Scopus, by selected region, country, or economy: 2008–20 | Elsevier | Scopus |
| Figure SAPBS-3 | Impact of removing low-quality publications from Scopus, by field of science: 2008–20 | Elsevier | Scopus |
| Table PBS-1 | S&E articles in all fields for 15 largest producing regions, countries, or economies: 2010 and 2020 | Elsevier | Scopus |
| Table PBS-2 | Relative citation index for 15 largest producing regions, countries, or economies: 2018 | Elsevier | Scopus |
| Table PBS-A | Coronavirus articles for 15 largest coronavirus article producing regions, countries, or economies: 2020 | Elsevier | Scopus |
| Table SPBS-1 | Regions, countries, or economies in S&E publications data | Elsevier | Scopus |
| Table SPBS-2 | S&E articles in all S&E fields, fractional count, by region, country, or economy: 1996–2020 | Elsevier | Scopus |
| Table SPBS-2 | S&E articles in all S&E fields, fractional count, by region, country, or economy: 1996–2020 | World Bank | World Bank Country and Lending Groups |
| Table SPBS-3 | S&E articles in agricultural sciences, fractional count, by region, country, or economy: 1996–2020 | Elsevier | Scopus |
| Table SPBS-4 | S&E articles in astronomy and astrophysics, fractional count, by region, country, or economy: 1996–2020 | Elsevier | Scopus |
| Table SPBS-5 | S&E articles in biological and biomedical sciences, fractional count, by region, country, or economy: 1996–2020 | Elsevier | Scopus |
| Table SPBS-6 | S&E articles in chemistry, fractional count, by region, country, or economy: 1996–2020 | Elsevier | Scopus |
| Table SPBS-7 | S&E articles in computer and information sciences, fractional count, by region, country, or economy: 1996–2020 | Elsevier | Scopus |
| Table SPBS-8 | S&E articles in engineering, fractional count, by region, country, or economy: 1996–2020 | Elsevier | Scopus |
| Table SPBS-9 | S&E articles in geosciences, atmospheric sciences, and ocean sciences, fractional count, by region, country, or economy: 1996–2020 | Elsevier | Scopus |
| Table SPBS-10 | S&E articles in health sciences, fractional count, by region, country, or economy: 1996–2020 | Elsevier | Scopus |
| Table SPBS-11 | S&E articles in materials science, fractional count, by region, country, or economy: 1996–2020 | Elsevier | Scopus |
| Table SPBS-12 | S&E articles in mathematics and statistics, fractional count, by region, country, or economy: 1996–2020 | Elsevier | Scopus |
| Table SPBS-13 | S&E articles in natural resources and conservation, fractional count, by region, country, or economy: 1996–2020 | Elsevier | Scopus |
| Table SPBS-14 | S&E articles in physics, fractional count, by region, country, or economy: 1996–2020 | Elsevier | Scopus |
| Table SPBS-15 | S&E articles in psychology, fractional count, by region, country, or economy: 1996–2020 | Elsevier | Scopus |
| Table SPBS-16 | S&E articles in social sciences, fractional count, by region, country, or economy: 1996–2020 | Elsevier | Scopus |
| Table SPBS-17 | S&E articles in all S&E fields, whole count, by region, country, or economy: 1996–2020 | Elsevier | Scopus |
| Table SPBS-18 | S&E articles in agricultural sciences, whole count, by region, country, or economy: 1996–2020 | Elsevier | Scopus |
| Table SPBS-19 | S&E articles in astronomy and astrophysics, whole count, by region, country, or economy: 1996–2020 | Elsevier | Scopus |
| Table SPBS-20 | S&E articles in biological and biomedical sciences, whole count, by region, country, or economy: 1996–2020 | Elsevier | Scopus |
| Table SPBS-21 | S&E articles in chemistry, whole count, by region, country, or economy: 1996–2020 | Elsevier | Scopus |
| Table SPBS-22 | S&E articles in computer and information sciences, whole count, by region, country, or economy: 1996–2020 | Elsevier | Scopus |
| Table SPBS-23 | S&E articles in engineering, whole count, by region, country, or economy: 1996–2020 | Elsevier | Scopus |
| Table SPBS-24 | S&E articles in geosciences, atmospheric sciences, and ocean sciences, whole count, by region, country, or economy: 1996–2020 | Elsevier | Scopus |
| Table SPBS-25 | S&E articles in health sciences, whole count, by region, country, or economy: 1996–2020 | Elsevier | Scopus |
| Table SPBS-26 | S&E articles in materials science, whole count, by region, country, or economy: 1996–2020 | Elsevier | Scopus |
| Table SPBS-27 | S&E articles in mathematics and statistics, whole count, by region, country, or economy: 1996–2020 | Elsevier | Scopus |
| Table SPBS-28 | S&E articles in natural resources and conservation, whole count, by region, country, or economy: 1996–2020 | Elsevier | Scopus |
| Table SPBS-29 | S&E articles in physics, whole count, by region, country, or economy: 1996–2020 | Elsevier | Scopus |
| Table SPBS-30 | S&E articles in psychology, whole count, by region, country, or economy: 1996–2020 | Elsevier | Scopus |
| Table SPBS-31 | S&E articles in social sciences, whole count, by region, country, or economy: 1996–2020 | Elsevier | Scopus |
| Table SPBS-32 | Survey of Doctorate Recipients and Web of Science matched data, by field of science and sex: Selected years, 1995–2006 | Clarivate | Web of Science |
| Table SPBS-32 | Survey of Doctorate Recipients and Web of Science matched data, by field of science and sex: Selected years, 1995–2006 | National Center for Science and Engineering Statistics | Survey of Doctorate Recipients |
| Table SPBS-33 | Survey of Doctorate Recipients and Web of Science matched data, by field of science and selected race or ethnicity: 1995–2006 | Clarivate | Web of Science |
| Table SPBS-33 | Survey of Doctorate Recipients and Web of Science matched data, by field of science and selected race or ethnicity: 1995–2006 | National Center for Science and Engineering Statistics | Survey of Doctorate Recipients |
| Table SPBS-34 | S&E research portfolios of selected region, country, or economy, by field: 2020 | Elsevier | Scopus |
| Table SPBS-35 | S&E articles in all fields combined, by coauthorship attribute and selected region, country, or economy: 1996–2020 | Elsevier | Scopus |
| Table SPBS-36 | Internationally coauthored S&E publications, by selected region, country, or economy pairs: 1996 and 2020 | Elsevier | Scopus |
| Table SPBS-37 | U.S. international articles with coauthor from selected countries: Selected years, 1996–2020 | Elsevier | Scopus |
| Table SPBS-38 | International articles from 15 largest producing countries with U.S. coauthor: Selected years, 1996–2020 | Elsevier | Scopus |
| Table SPBS-39 | Indexes of internationally coauthored S&E publications, by selected region, country, or economy pairs: 1996 and 2020 | Elsevier | Scopus |
| Table SPBS-40 | Relative citation index, by selected country or economy pair: 2018 | Elsevier | Scopus |
| Table SPBS-41 | Relative citation index in agricultural sciences, by selected country or economy pair: 2018 | Elsevier | Scopus |
| Table SPBS-42 | Relative citation index in astronomy and astrophysics, by selected country or economy pair: 2018 | Elsevier | Scopus |
| Table SPBS-43 | Relative citation index in biological and biomedical sciences, by selected country or economy pair: 2018 | Elsevier | Scopus |
| Table SPBS-44 | Relative citation index in chemistry, by selected country or economy pair: 2018 | Elsevier | Scopus |
| Table SPBS-45 | Relative citation index in computer and information sciences, by selected country or economy pair: 2018 | Elsevier | Scopus |
| Table SPBS-46 | Relative citation index in engineering, by selected country or economy pair: 2018 | Elsevier | Scopus |
| Table SPBS-47 | Relative citation index in geosciences, atmospheric sciences, and ocean sciences, by selected country or economy pair: 2018 | Elsevier | Scopus |
| Table SPBS-48 | Relative citation index in health sciences, by selected country or economy pair: 2018 | Elsevier | Scopus |
| Table SPBS-49 | Relative citation index in materials science, by selected country or economy pair: 2018 | Elsevier | Scopus |
| Table SPBS-50 | Relative citation index in mathematics and statistics, by selected country or economy pair: 2018 | Elsevier | Scopus |
| Table SPBS-51 | Relative citation index in natural resources and conservation, by selected country or economy pair: 2018 | Elsevier | Scopus |
| Table SPBS-52 | Relative citation index in physics, by selected country or economy pair: 2018 | Elsevier | Scopus |
| Table SPBS-53 | Relative citation index in psychology, by selected country or economy pair: 2018 | Elsevier | Scopus |
| Table SPBS-54 | Relative citation index in social sciences, by selected country or economy pair: 2018 | Elsevier | Scopus |
| Table SPBS-55 | Coronavirus-related S&E articles by coauthorship attribute, whole and fractional counting, by region, country, or economy: 2020 | Elsevier | Scopus |
| Table SPBS-56 | Internationally coauthored coronavirus articles, by selected region, country, or economy: 2020 | Elsevier | Scopus |
| Table SPBS-57 | Coronavirus research papers international collaboration network analysis: 2020 | Elsevier | Scopus |
| Table SPBS-58 | Share of S&E publications in the top 1% most-cited journal articles in the Scopus database, fractional count, by region, country, or economy: 1996–2018 | Elsevier | Scopus |
| Table SPBS-59 | Share of S&E publications in the top 1% most-cited journal articles in agricultural sciences, fractional count, by region, country, or economy: 1996–2018 | Elsevier | Scopus |
| Table SPBS-60 | Share of S&E publications in the top 1% most-cited journal articles in astronomy and astrophysics, fractional count, by region, country, or economy: 1996–2018 | Elsevier | Scopus |
| Table SPBS-61 | Share of S&E publications in the top 1% most-cited journal articles in biological and biomedical sciences, fractional count, by region, country, or economy: 1996–2018 | Elsevier | Scopus |
| Table SPBS-62 | Share of S&E publications in the top 1% most-cited journal articles in chemistry, fractional count, by region, country, or economy: 1996–2018 | Elsevier | Scopus |
| Table SPBS-63 | Share of S&E publications in the top 1% most-cited journal articles in computer and information sciences, fractional count, by region, country, or economy: 1996–2018 | Elsevier | Scopus |
| Table SPBS-64 | Share of S&E publications in the top 1% most-cited journal articles in engineering, fractional count, by region, country, or economy: 1996–2018 | Elsevier | Scopus |
| Table SPBS-65 | Share of S&E publications in the top 1% most-cited journal articles in geosciences, atmospheric sciences, and ocean sciences, fractional count, by region, country, or economy: 1996–2018 | Elsevier | Scopus |
| Table SPBS-66 | Share of S&E publications in the top 1% most-cited journal articles in health sciences, fractional count, by region, country, or economy: 1996–2018 | Elsevier | Scopus |
| Table SPBS-67 | Share of S&E publications in the top 1% most-cited journal articles in materials science, fractional count, by region, country, or economy: 1996–2018 | Elsevier | Scopus |
| Table SPBS-68 | Share of S&E publications in the top 1% most-cited journal articles in mathematics and statistics, fractional count, by region, country, or economy: 1996–2018 | Elsevier | Scopus |
| Table SPBS-69 | Share of S&E publications in the top 1% most-cited journal articles in natural resources and conservation, fractional count, by region, country, or economy: 1996–2018 | Elsevier | Scopus |
| Table SPBS-70 | Share of S&E publications in the top 1% most-cited journal articles in physics, fractional count, by region, country, or economy: 1996–2018 | Elsevier | Scopus |
| Table SPBS-71 | Share of S&E publications in the top 1% most-cited journal articles in psychology, fractional count, by region, country, or economy: 1996–2018 | Elsevier | Scopus |
| Table SPBS-72 | Share of S&E publications in the top 1% most-cited journal articles in social sciences, fractional count, by region, country, or economy: 1996–2018 | Elsevier | Scopus |
| Table SPBS-73 | Share of S&E publications in the top 1% most-cited journal articles and conference proceedings in computer and information sciences, fractional count, by region, country, or economy: 1996–2018 | Elsevier | Scopus |
| Table SPBS-74 | Share of S&E publications in the top 1% most-cited journal articles in the Scopus database, whole count, by region, country, or economy: 1996–2018 | Elsevier | Scopus |
| Table SPBS-75 | Share of S&E publications in the top 1% most-cited journal articles in agricultural sciences, whole count, by region, country, or economy: 1996–2018 | Elsevier | Scopus |
| Table SPBS-76 | Share of S&E publications in the top 1% most-cited journal articles in astronomy and astrophysics, whole count, by region, country, or economy: 1996–2018 | Elsevier | Scopus |
| Table SPBS-77 | Share of S&E publications in the top 1% most-cited journal articles in biological and biomedical sciences, whole count, by region, country, or economy: 1996–2018 | Elsevier | Scopus |
| Table SPBS-78 | Share of S&E publications in the top 1% most-cited journal articles in chemistry, whole count, by region, country, or economy: 1996–2018 | Elsevier | Scopus |
| Table SPBS-79 | Share of S&E publications in the top 1% most-cited journal articles in computer and information sciences, whole count, by region, country, or economy: 1996–2018 | Elsevier | Scopus |
| Table SPBS-80 | Share of S&E publications in the top 1% most-cited journal articles in engineering, whole count, by region, country, or economy: 1996–2018 | Elsevier | Scopus |
| Table SPBS-81 | Share of S&E publications in the top 1% most-cited journal articles in geosciences, atmospheric sciences, and ocean sciences, whole count, by region, country, or economy: 1996–2018 | Elsevier | Scopus |
| Table SPBS-82 | Share of S&E publications in the top 1% most-cited journal articles in health sciences, whole count, by region, country, or economy: 1996–2018 | Elsevier | Scopus |
| Table SPBS-83 | Share of S&E publications in the top 1% most-cited journal articles in materials science, whole count, by region, country, or economy: 1996–2018 | Elsevier | Scopus |
| Table SPBS-84 | Share of S&E publications in the top 1% most-cited journal articles in mathematics and statistics, whole count, by region, country, or economy: 1996–2018 | Elsevier | Scopus |
| Table SPBS-85 | Share of S&E publications in the top 1% most-cited journal articles in natural resources and conservation, whole count, by region, country, or economy: 1996–2018 | Elsevier | Scopus |
| Table SPBS-86 | Share of S&E publications in the top 1% most-cited journal articles in physics, whole count, by region, country, or economy: 1996–2018 | Elsevier | Scopus |
| Table SPBS-87 | Share of S&E publications in the top 1% most-cited journal articles in psychology, whole count, by region, country, or economy: 1996–2018 | Elsevier | Scopus |
| Table SPBS-88 | Share of S&E publications in the top 1% most-cited journal articles in social sciences, whole count, by region, country, or economy: 1996–2018 | Elsevier | Scopus |
| Table SPBS-89 | Share of S&E publications in the top 1% most-cited journal articles and conference proceedings in computer and information sciences, whole count, by region, country, or economy: 1996–2018 | Elsevier | Scopus |