 An official website of the United States government
 Publication Output by Country, Region, or Economy and Scientific Field
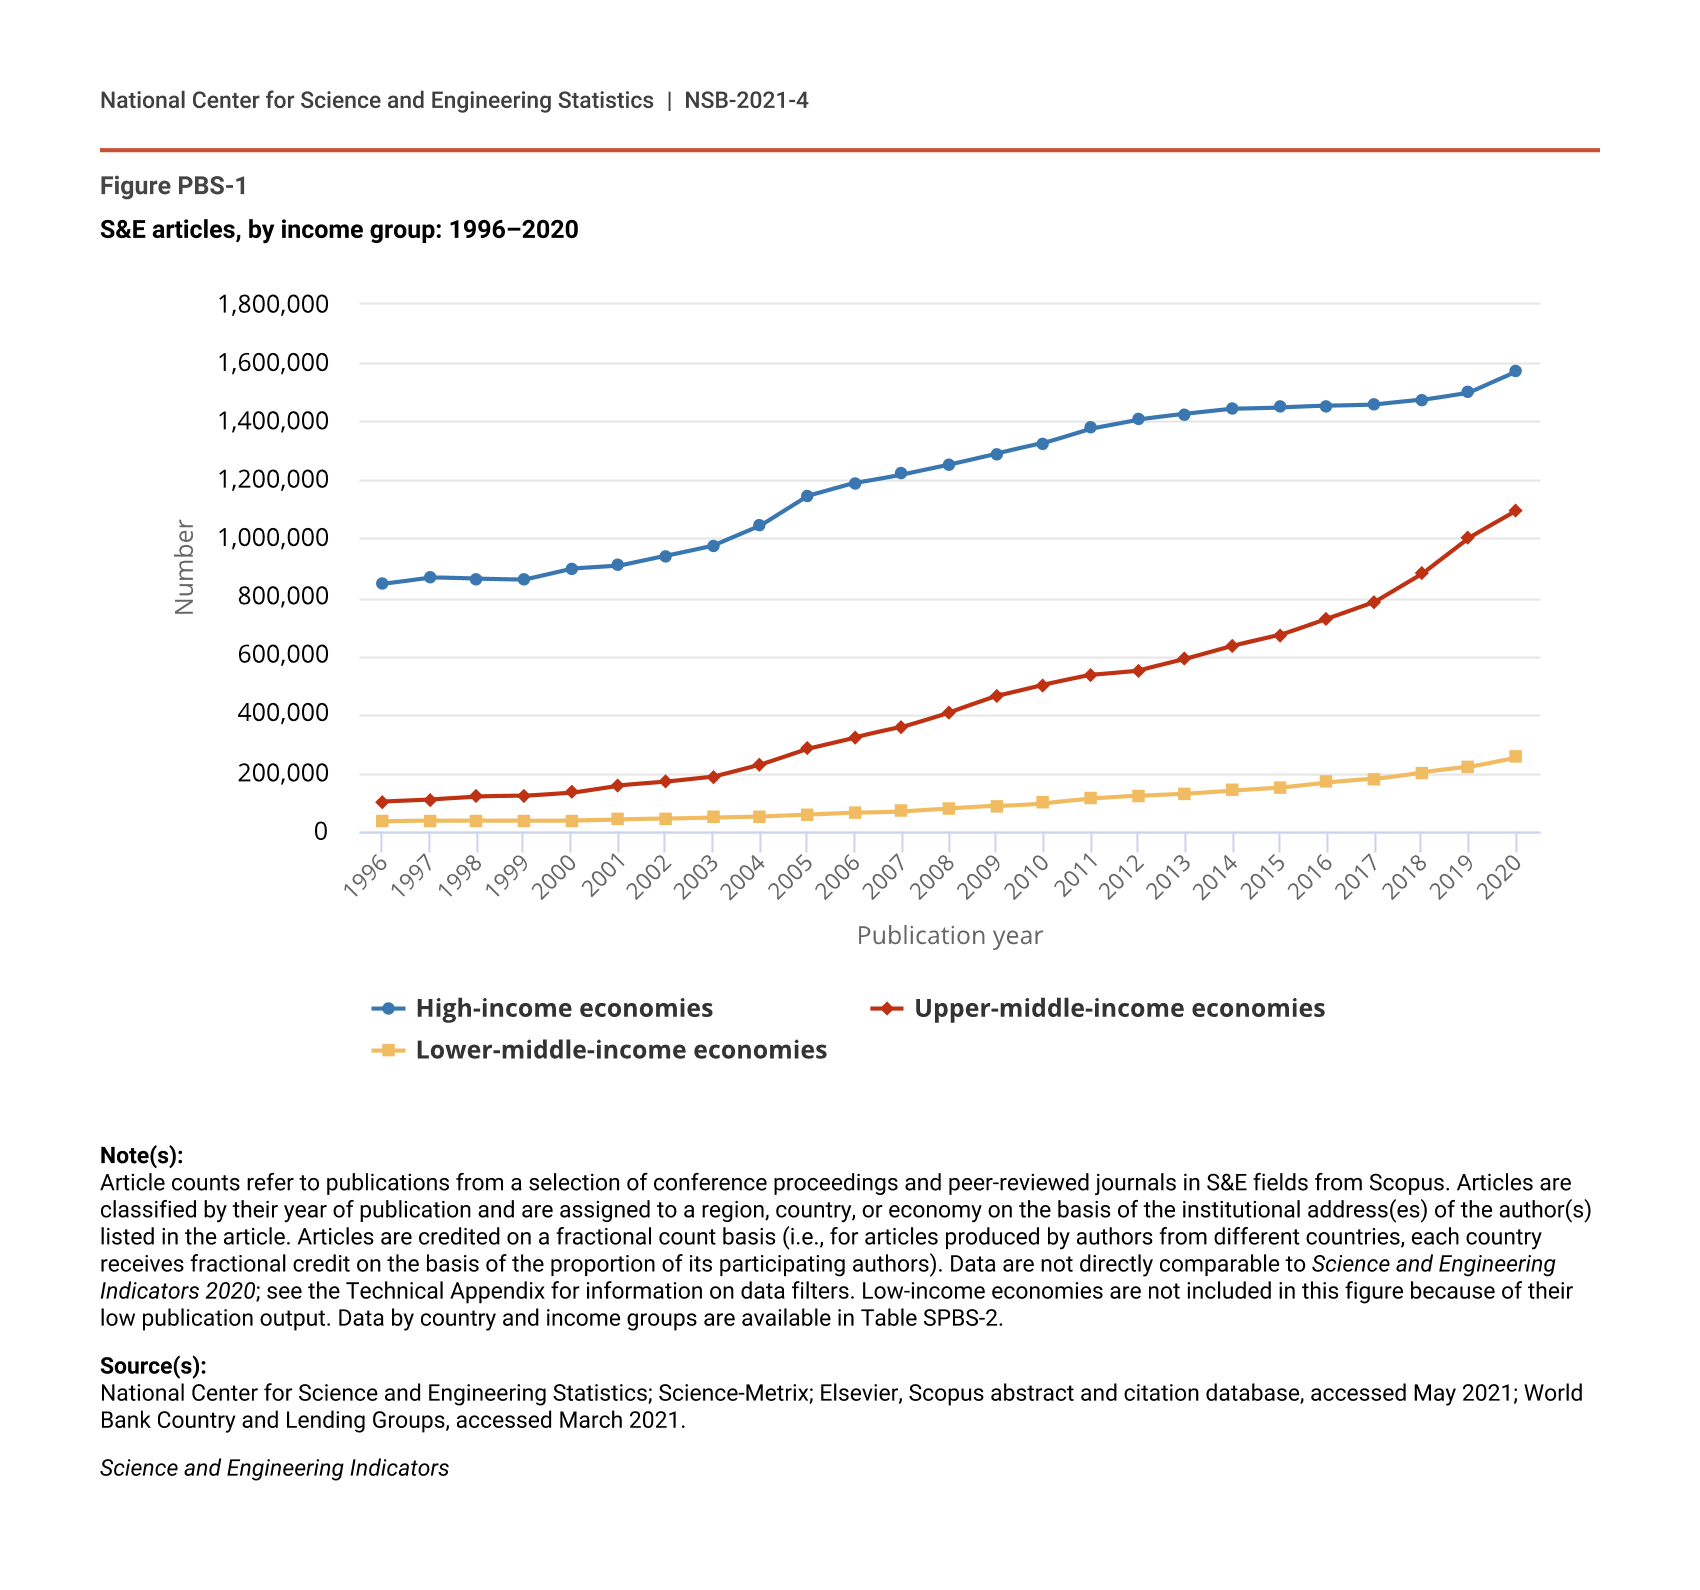
Publication output reached 2.9 million articles in 2020 with over 90% of the total from countries with high-income and upper middle-income economies (Figure PBS-1). Since 1996, output has consistently grown for countries with high-income economies, such as the United States, Germany, and the United Kingdom (UK), expanding from a large base number of publications (Table SPBS-2). Countries with upper-middle-income economies, such as China, Iran, Russia, and Brazil, have had a more rapid pace of growth since 1996, expanding from a relatively smaller base number of publications. Overall, the publication compound annual growth rates of countries with upper middle-income and high-income economies have been 10% and 3%, respectively, for the 25-year period covering 1996–2020 (Figure PBS-1).
S&E articles, by income group: 1996–2020
| Publication year | High-income economies | Upper-middle-income economies | Lower-middle-income economies |
|---|---|---|---|
| 1996 | 845,675.3 | 102,277.5 | 34,391.5 |
| 1997 | 867,695.4 | 108,744.2 | 36,137.7 |
| 1998 | 862,772.5 | 118,347.1 | 36,835.2 |
| 1999 | 860,011.6 | 120,653.4 | 37,469.9 |
| 2000 | 897,345.6 | 132,228.0 | 38,636.9 |
| 2001 | 907,133.7 | 157,592.0 | 41,802.7 |
| 2002 | 941,680.8 | 169,561.6 | 43,733.9 |
| 2003 | 977,106.2 | 186,880.2 | 47,225.1 |
| 2004 | 1,044,786.6 | 228,902.2 | 50,679.0 |
| 2005 | 1,145,434.4 | 283,305.8 | 57,405.3 |
| 2006 | 1,190,600.4 | 321,729.2 | 64,158.4 |
| 2007 | 1,220,325.9 | 356,265.5 | 68,500.9 |
| 2008 | 1,254,150.1 | 407,067.3 | 77,534.9 |
| 2009 | 1,291,178.4 | 462,325.1 | 86,688.4 |
| 2010 | 1,326,711.2 | 501,514.8 | 96,710.2 |
| 2011 | 1,376,712.4 | 534,783.5 | 111,400.8 |
| 2012 | 1,407,224.3 | 550,145.8 | 120,705.2 |
| 2013 | 1,425,985.5 | 588,944.8 | 129,013.3 |
| 2014 | 1,443,354.7 | 633,466.1 | 140,190.1 |
| 2015 | 1,447,826.1 | 671,162.7 | 150,155.3 |
| 2016 | 1,453,391.3 | 728,210.2 | 167,870.3 |
| 2017 | 1,457,581.5 | 785,702.3 | 179,449.4 |
| 2018 | 1,473,174.7 | 881,412.0 | 202,535.1 |
| 2019 | 1,499,425.2 | 1,005,200.1 | 220,445.5 |
| 2020 | 1,570,265.1 | 1,096,808.5 | 253,720.0 |
Note(s):
Article counts refer to publications from a selection of conference proceedings and peer-reviewed journals in S&E fields from Scopus. Articles are classified by their year of publication and are assigned to a region, country, or economy on the basis of the institutional address(es) of the author(s) listed in the article. Articles are credited on a fractional count basis (i.e., for articles produced by authors from different countries, each country receives fractional credit on the basis of the proportion of its participating authors). Data are not directly comparable to Science and Engineering Indicators 2020; see the Technical Appendix for information on data filters. Low-income economies are not included in this figure because of their low publication output. Data by country and income groups are available in Table SPBS-2.
Source(s):
National Center for Science and Engineering Statistics; Science-Metrix; Elsevier, Scopus abstract and citation database, accessed May 2021; World Bank Country and Lending Groups, accessed March 2021.
Science and Engineering Indicators
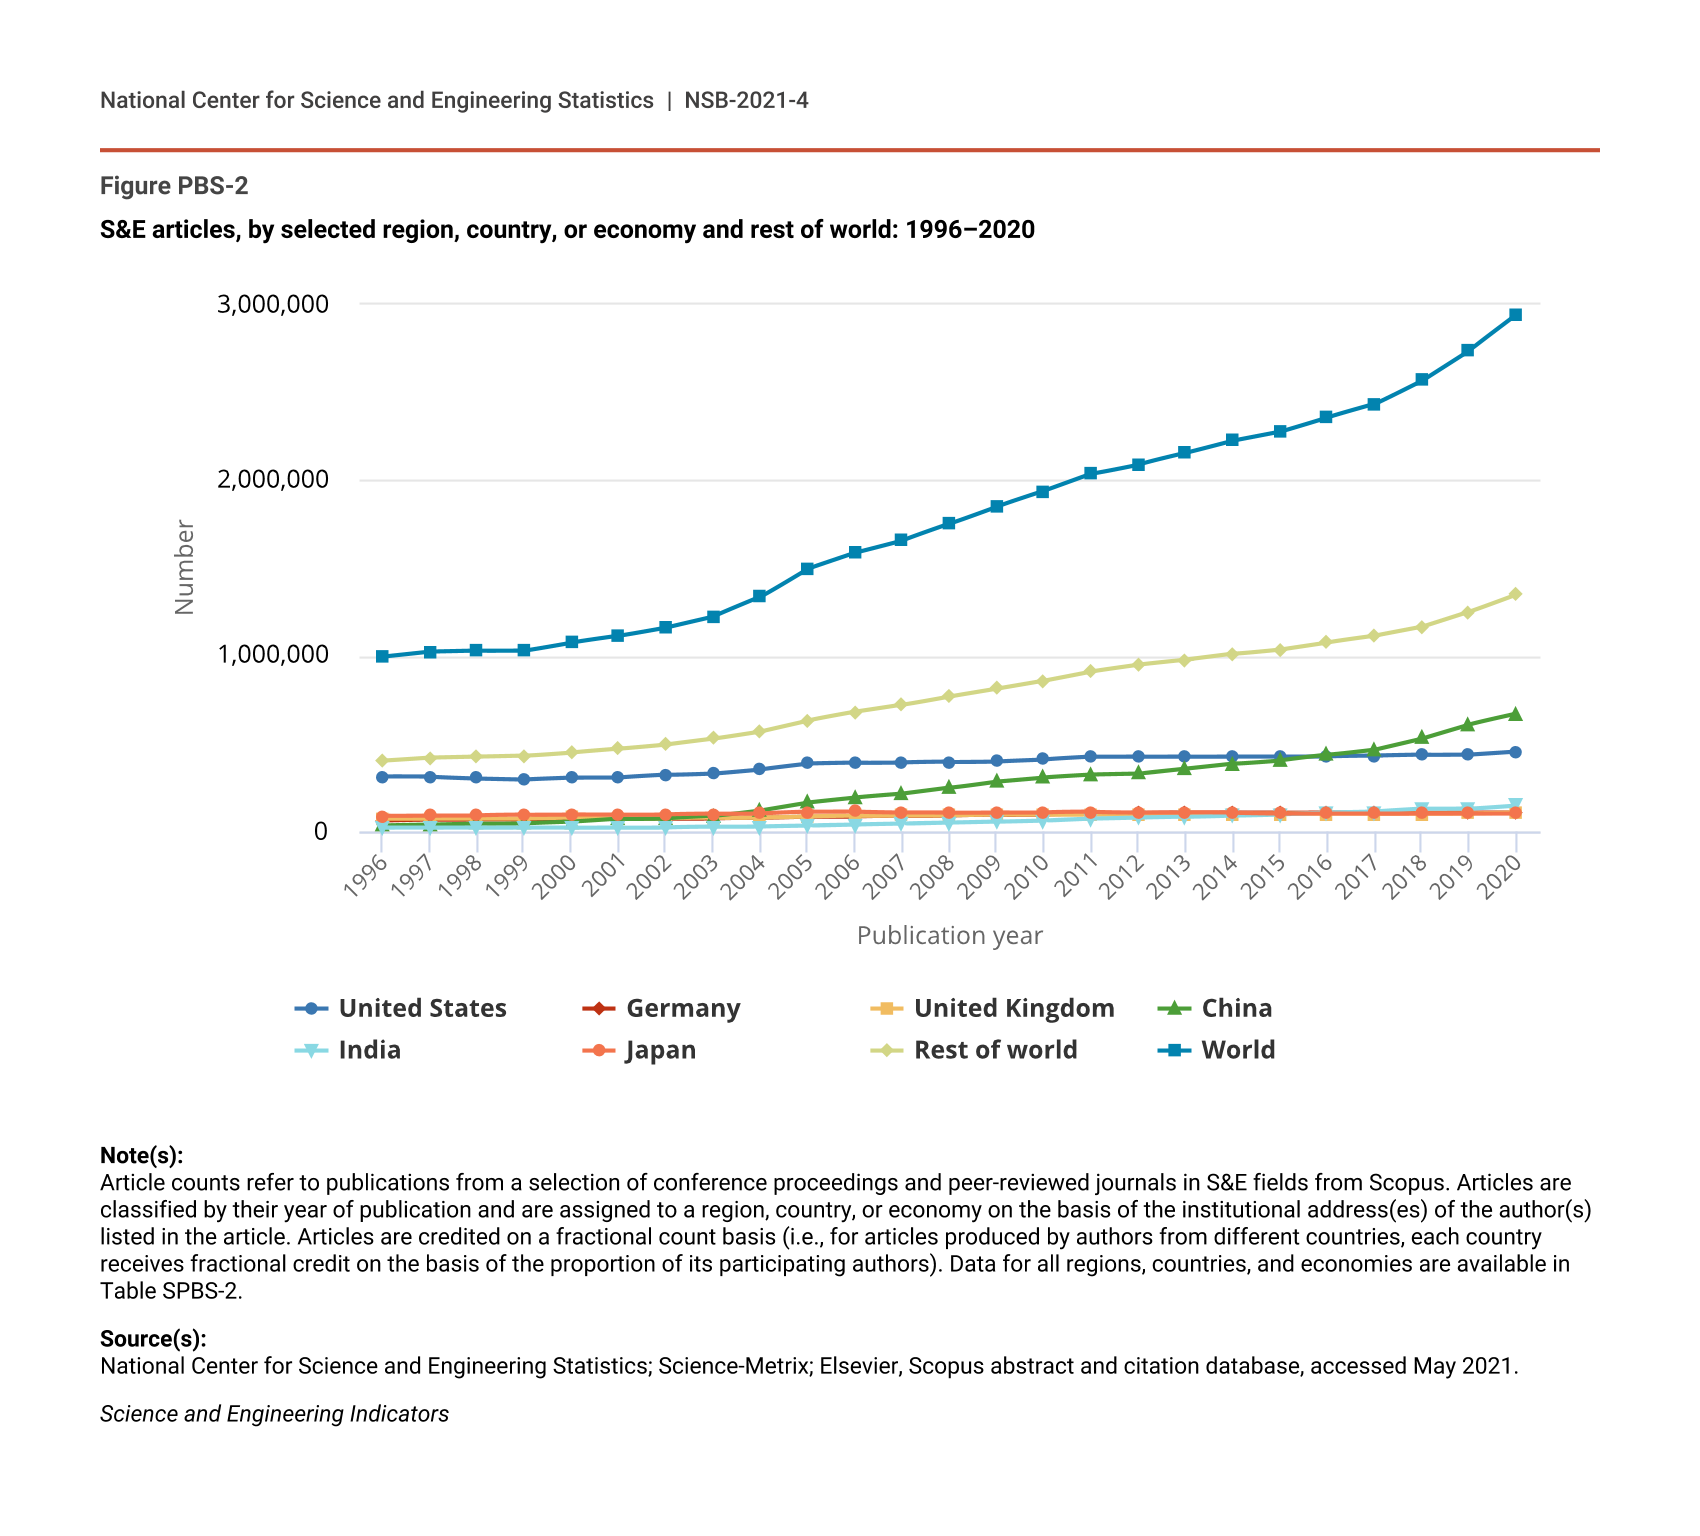
More recently, the compound annual growth in publication output for the world was 4% from 2010 to 2020 (Table PBS-1). Country-specific growth rates vary widely by country. Among the 15 largest publication producers, countries with compound annual growth rates above the world average were Russia (10%), Iran (9%), India (9%), China (8%), and Brazil (5%); those with the lower growth rates were Japan (-1%), France (-0.3%), the United States (1%), the UK (1%), and Germany (1%). The countries with low growth rates are those that built their scientific capacity decades ago and continue to maintain their scientific research. The worldwide growth of publication output, from 1.9 million in 2010 to 2.9 million in 2020, was led by four geographically large countries. China (36%), India (9%), Russia (6%), and the United States (5%) together accounted for about half the increase in publications over this time period.
S&E articles in all fields for 15 largest producing regions, countries, or economies: 2010 and 2020
na = not applicable.
Note(s):
The countries or economies are ranked based on the 2020 total. Article counts refer to publications from conference proceedings and peer-reviewed journal articles in S&E and indexed in Scopus (see Technical Appendix for more details). Articles are classified by their year of publication and are assigned to a region, country, or economy on the basis of the institutional address(es) of the author(s) listed in the article. Articles are credited on a fractional count basis (i.e., for articles from multiple countries or economies, each country or economy receives fractional credit on the basis of the proportion of its participating authors). Detail may not add to total because of countries or economies that are not shown. Proportions are based on the world total excluding unclassified addresses (data not presented). Details and other countries are available in Table SPBS-2.
Source(s):
National Center for Science and Engineering Statistics; Science-Metrix; Elsevier, Scopus abstract and citation database, accessed May 2021.
Science and Engineering Indicators
Collectively, the top 15 countries produced 76% of the world’s publication output of 2.9 million articles in 2020 (Table PBS-1). The two countries producing the most S&E publications in 2020 were China (669,744, or 23%) and the United States (455,856, or 16%) (Figure PBS-2). With the exception of Iran replacing Taiwan beginning in 2014, the top 15 producers of S&E articles have been the same over the last 10 years (NSB 2016).
S&E articles, by selected region, country, or economy and rest of world: 1996–2020
| Publication year | United States | Germany | United Kingdom | China | India | Japan | Rest of world | World |
|---|---|---|---|---|---|---|---|---|
| 1996 | 313,392 | 64,230 | 72,332 | 33,621 | 18,905 | 88,807 | 401,251 | 992,538 |
| 1997 | 311,117 | 68,275 | 74,151 | 37,425 | 19,349 | 91,890 | 419,112 | 1,021,319 |
| 1998 | 302,600 | 69,448 | 74,208 | 43,775 | 19,718 | 92,246 | 424,970 | 1,026,965 |
| 1999 | 296,941 | 67,534 | 73,334 | 45,192 | 20,838 | 94,195 | 431,245 | 1,029,278 |
| 2000 | 306,472 | 69,739 | 77,969 | 53,285 | 21,409 | 96,607 | 451,154 | 1,076,635 |
| 2001 | 306,734 | 71,531 | 74,398 | 70,676 | 22,533 | 96,103 | 471,487 | 1,113,462 |
| 2002 | 320,945 | 71,994 | 75,376 | 75,171 | 24,313 | 98,145 | 495,781 | 1,161,725 |
| 2003 | 330,543 | 73,156 | 76,341 | 87,850 | 26,820 | 100,495 | 528,659 | 1,223,864 |
| 2004 | 354,737 | 76,138 | 80,185 | 120,947 | 28,780 | 103,154 | 570,548 | 1,334,488 |
| 2005 | 385,577 | 84,244 | 85,439 | 165,404 | 32,885 | 111,836 | 631,941 | 1,497,326 |
| 2006 | 389,728 | 85,981 | 89,062 | 192,393 | 38,131 | 113,061 | 679,522 | 1,587,879 |
| 2007 | 392,349 | 88,888 | 91,538 | 213,168 | 42,576 | 108,877 | 720,506 | 1,657,902 |
| 2008 | 395,158 | 92,026 | 91,581 | 247,545 | 48,135 | 107,264 | 769,684 | 1,751,394 |
| 2009 | 399,757 | 95,033 | 94,039 | 285,496 | 53,557 | 108,811 | 813,796 | 1,850,488 |
| 2010 | 409,512 | 97,255 | 94,081 | 308,769 | 60,555 | 108,534 | 859,415 | 1,938,121 |
| 2011 | 423,222 | 99,987 | 95,498 | 323,136 | 71,809 | 110,349 | 912,088 | 2,036,090 |
| 2012 | 425,131 | 104,122 | 97,564 | 328,127 | 77,746 | 108,729 | 949,130 | 2,090,551 |
| 2013 | 426,597 | 104,648 | 98,590 | 356,356 | 82,779 | 107,889 | 976,674 | 2,153,533 |
| 2014 | 428,141 | 106,366 | 98,439 | 385,178 | 91,337 | 104,434 | 1,010,088 | 2,223,983 |
| 2015 | 428,204 | 106,344 | 99,435 | 405,812 | 97,788 | 101,065 | 1,036,919 | 2,275,565 |
| 2016 | 428,476 | 107,804 | 99,717 | 436,079 | 107,193 | 101,386 | 1,077,008 | 2,357,663 |
| 2017 | 430,198 | 107,880 | 99,991 | 468,045 | 112,505 | 100,971 | 1,112,795 | 2,432,385 |
| 2018 | 435,034 | 107,581 | 100,601 | 531,110 | 127,527 | 101,934 | 1,163,682 | 2,567,468 |
| 2019 | 438,020 | 108,725 | 101,343 | 610,459 | 129,550 | 101,040 | 1,250,135 | 2,739,272 |
| 2020 | 455,856 | 109,379 | 105,564 | 669,744 | 149,213 | 101,014 | 1,350,037 | 2,940,807 |
Note(s):
Article counts refer to publications from a selection of conference proceedings and peer-reviewed journals in S&E fields from Scopus. Articles are classified by their year of publication and are assigned to a region, country, or economy on the basis of the institutional address(es) of the author(s) listed in the article. Articles are credited on a fractional count basis (i.e., for articles produced by authors from different countries, each country receives fractional credit on the basis of the proportion of its participating authors). Data for all regions, countries, and economies are available in Table SPBS-2.
Source(s):
National Center for Science and Engineering Statistics; Science-Metrix; Elsevier, Scopus abstract and citation database, accessed May 2021.
Science and Engineering Indicators
The U.S. trend of moderate but increasing publication output varies by state. The National Science Board’s (NSB’s) State Indicators data tool provides state-level data based on each state’s doctorate population and R&D funding, including academic S&E article output per 1,000 science, engineering, and health doctorate holders in academia (NSB 2021a) and academic S&E article output per $1 million of academic S&E R&D (NSB 2021b).
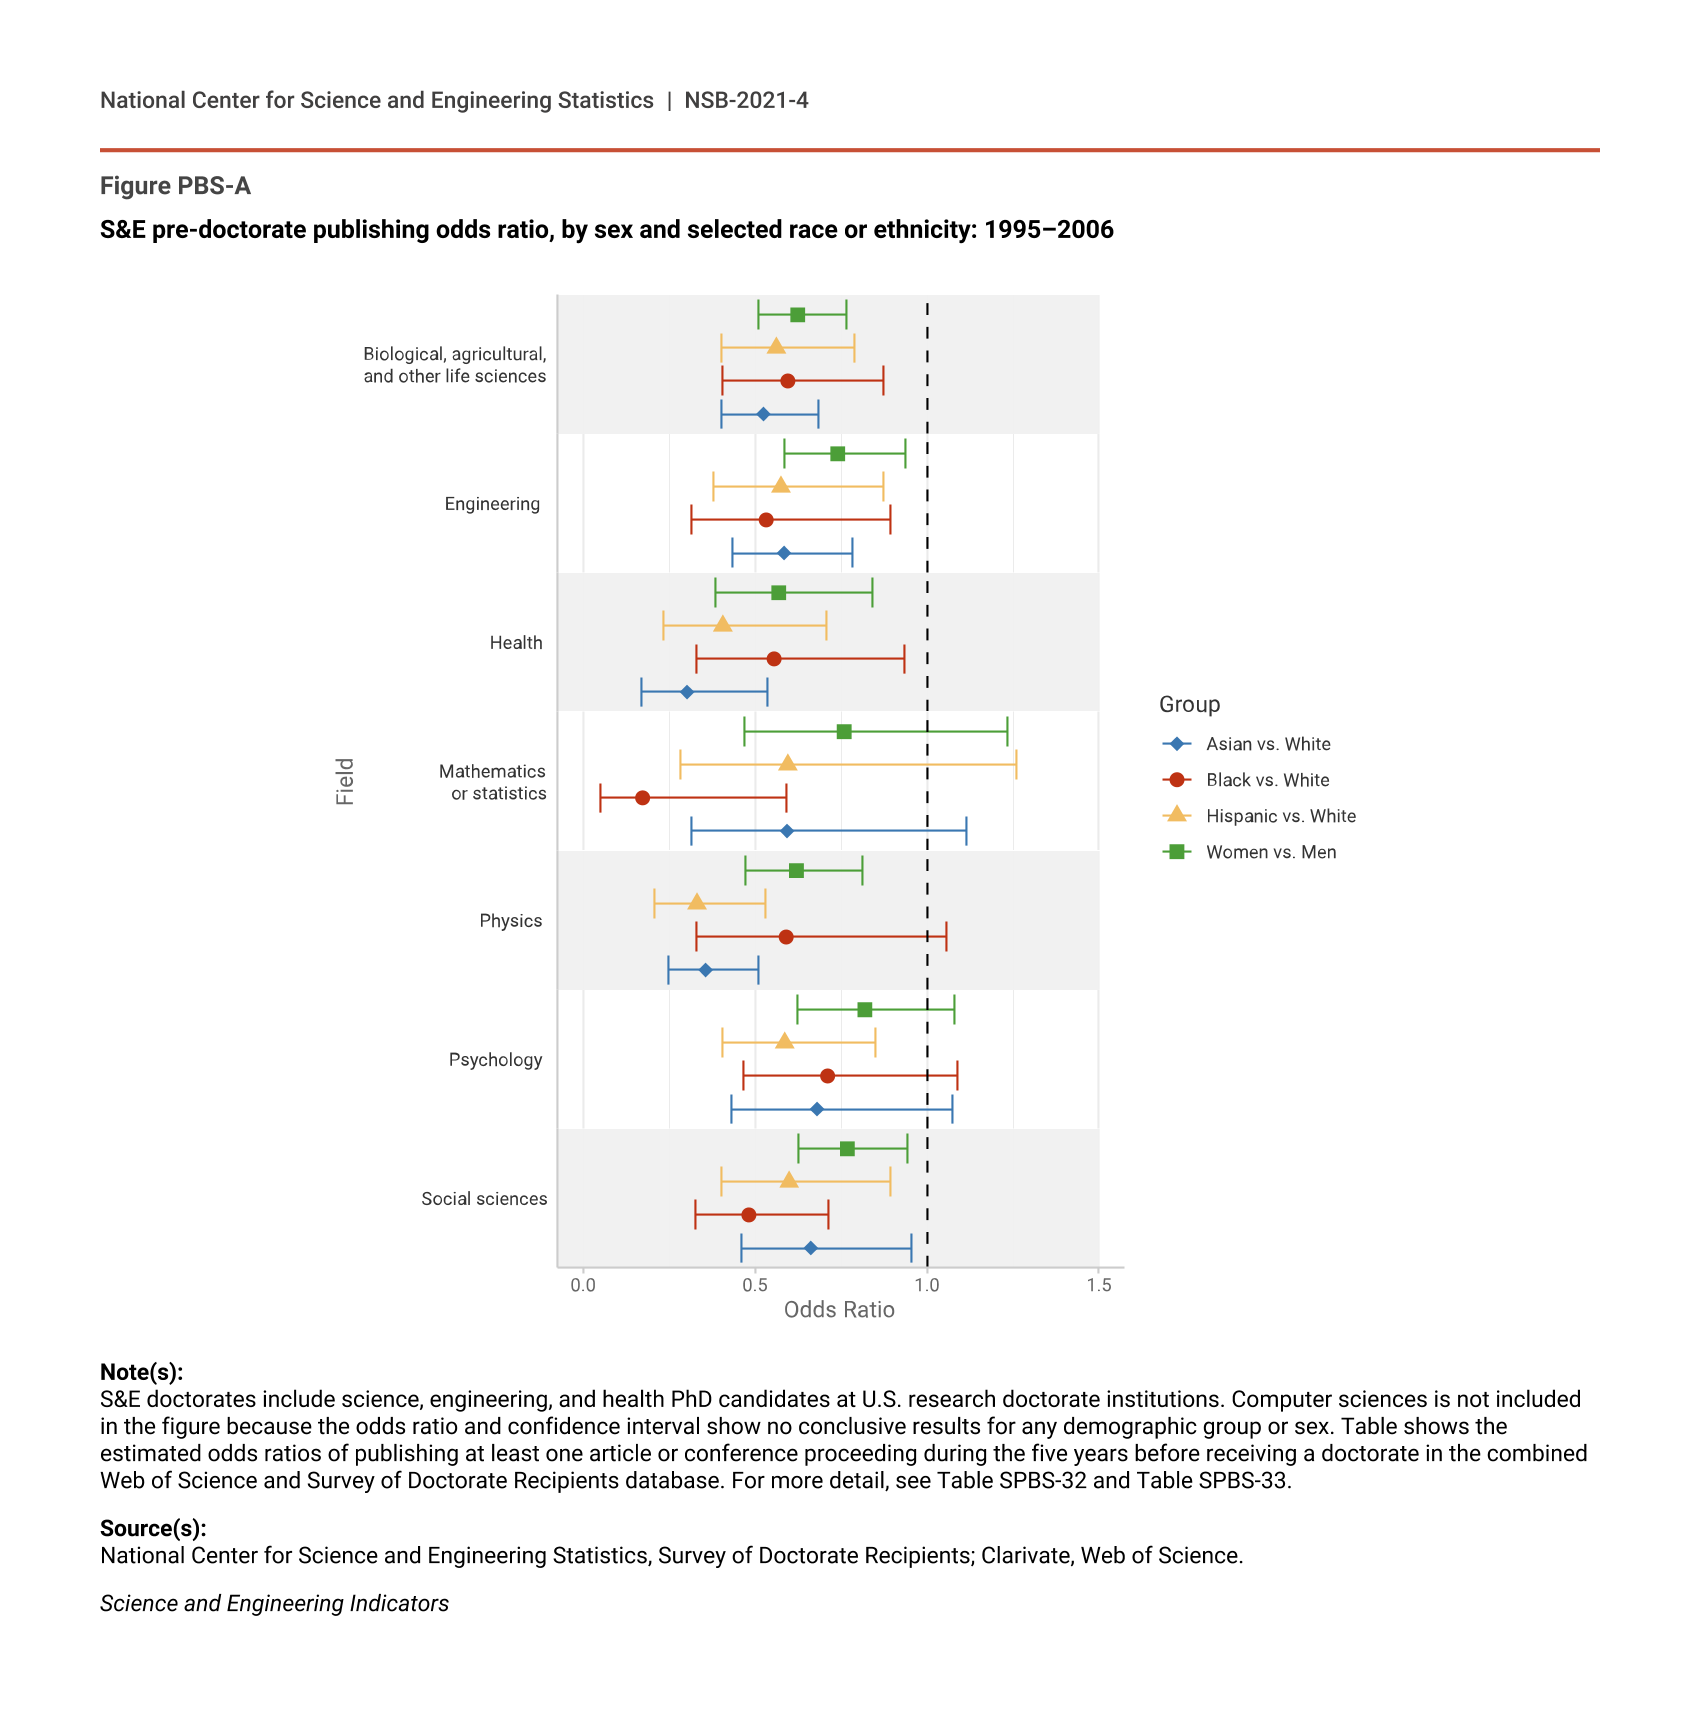
The U.S. trend of publication output varies across race or ethnicity and sex, which impacts R&D careers (see sidebar Publication Output by Underrepresented Groups and Impact on R&D Careers and Indicators 2022 report “The STEM Labor Force of Today: Scientists, Engineers, and Skilled Technical Workers”).
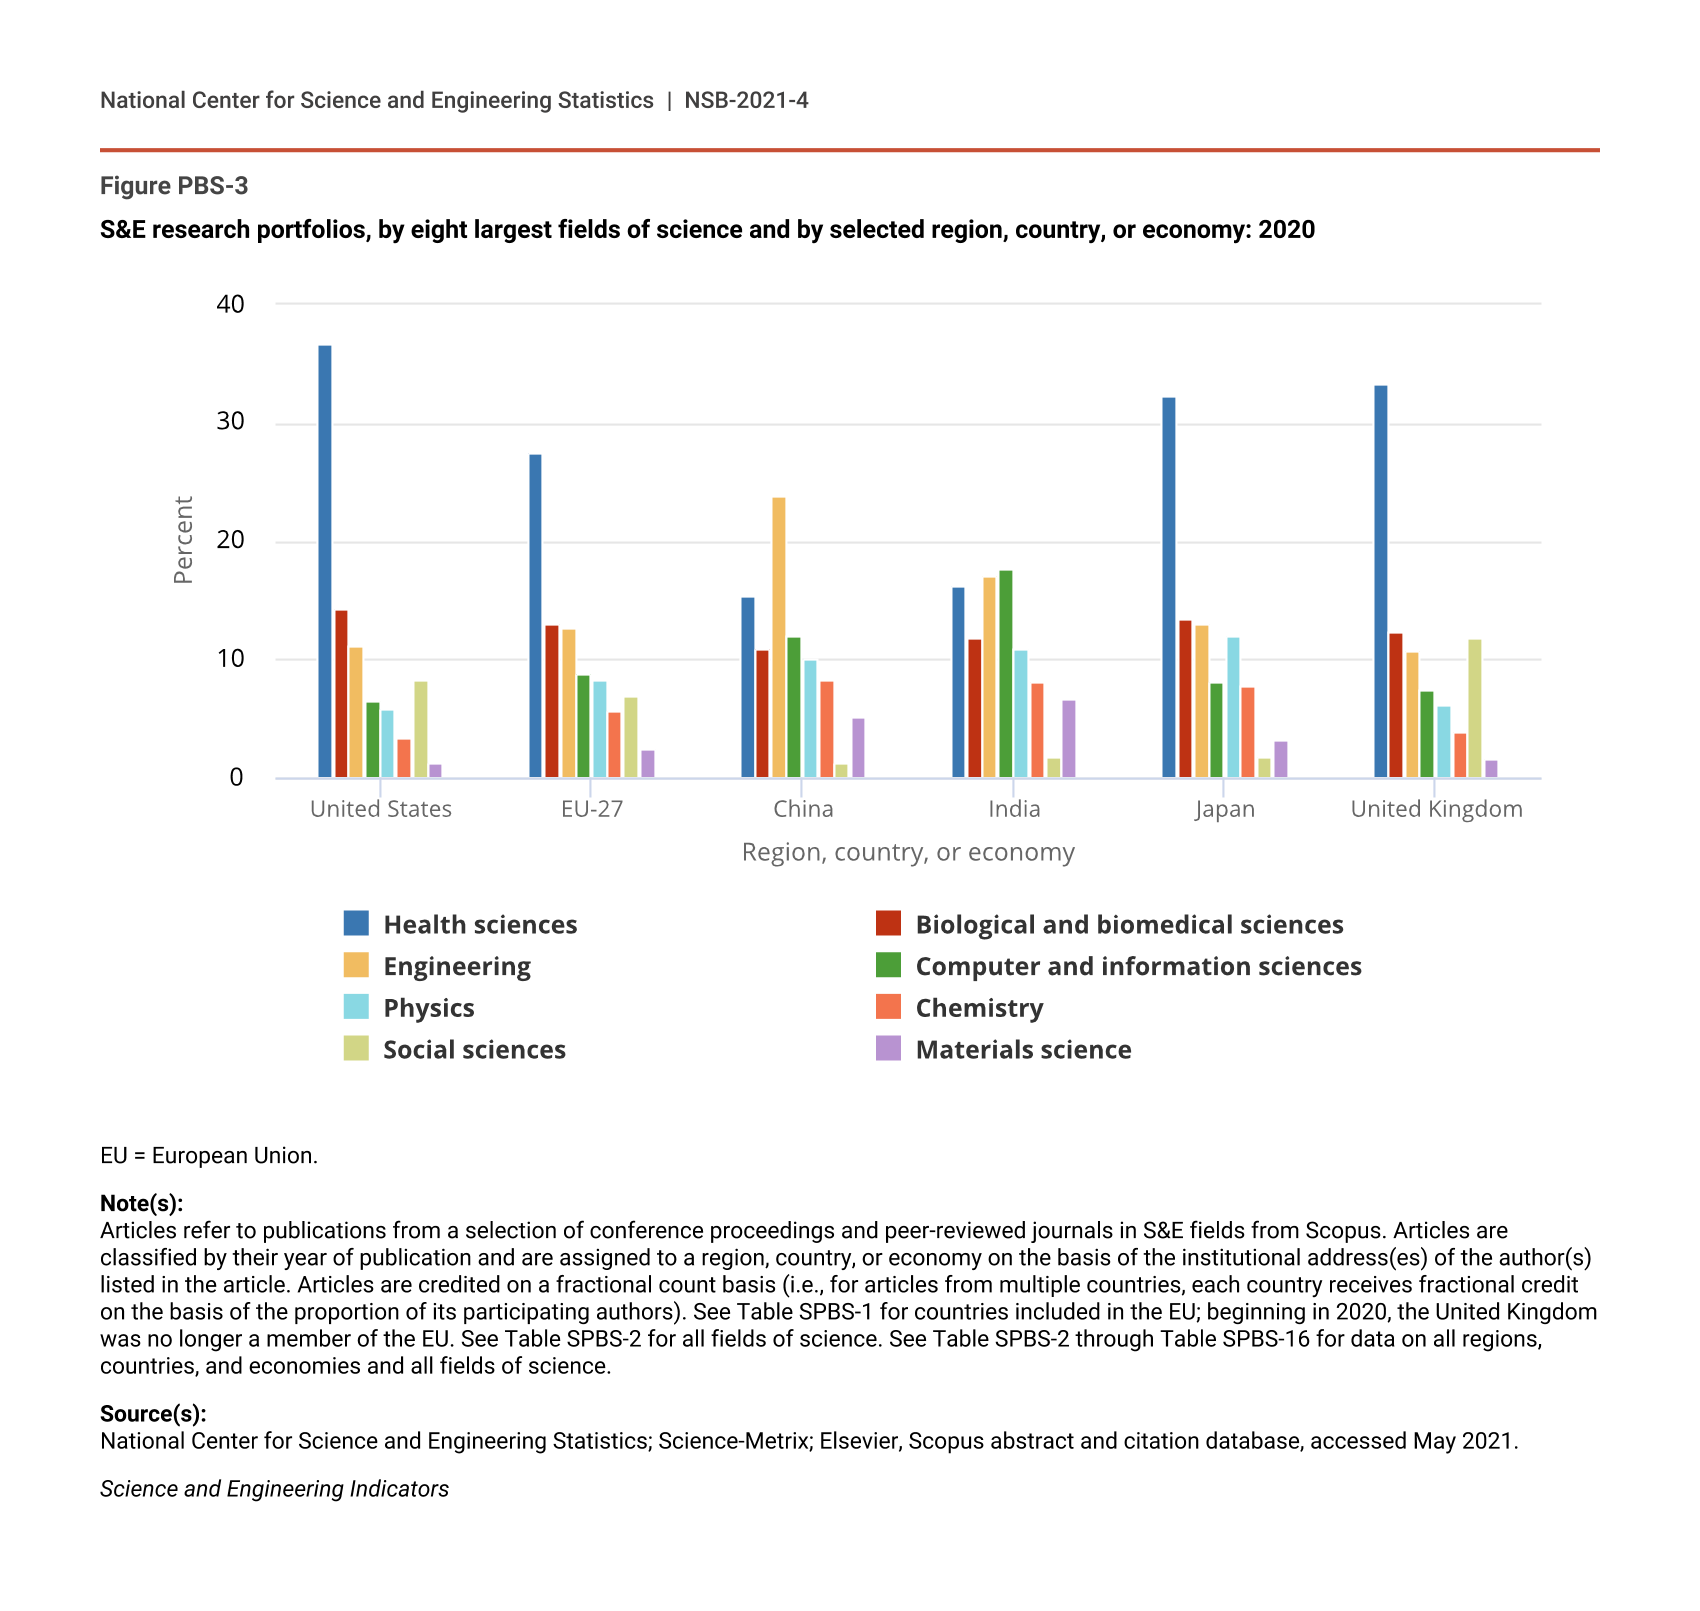
Distribution of publications by field of science and region, country, or economy can indicate research priorities and capabilities. Health sciences is the largest field of science globally (25% of publications in 2020) (Table SPBS-2 and Table SPBS-10). Likely due to COVID-19, health sciences publications grew 16%, and biological and biomedical sciences publications grew 15% from 2019 to 2020, far surpassing their previous 2009–19 compound annual growth rates of 3% for each (Table SPBS-5 and Table SPBS-10). In the United States, the European Union (EU-27), the UK, and Japan, health sciences publication output far exceeds that of any other field (Figure PBS-3). The United States, the UK, and the EU-27 have the highest proportions of articles in the social sciences of the six countries and regions shown. In China, the largest research area is engineering (24%), followed by health sciences (15%) and computer and information sciences (12%). The largest scientific field for publication output in India is computer sciences (18%). Japan has a portfolio with health sciences (32%) at the top, followed by biological and biomedical sciences (13%) and engineering (13%).
S&E research portfolios, by eight largest fields of science and by selected region, country, or economy: 2020
| Region, country, or economy | Health sciences | Biological and biomedical sciences | Engineering | Computer and information sciences | Physics | Chemistry | Social sciences | Materials science |
|---|---|---|---|---|---|---|---|---|
| United States | 36.62 | 14.28 | 11.12 | 6.49 | 5.90 | 3.43 | 8.23 | 1.30 |
| EU-27 | 27.52 | 13.09 | 12.63 | 8.81 | 8.22 | 5.71 | 6.96 | 2.43 |
| China | 15.41 | 10.97 | 23.79 | 11.98 | 10.09 | 8.30 | 1.28 | 5.19 |
| India | 16.15 | 11.74 | 17.02 | 17.56 | 10.88 | 8.19 | 1.71 | 6.67 |
| Japan | 32.30 | 13.39 | 13.00 | 8.11 | 11.90 | 7.80 | 1.85 | 3.23 |
| United Kingdom | 33.32 | 12.36 | 10.68 | 7.34 | 6.17 | 3.80 | 11.75 | 1.58 |
EU = European Union.
Note(s):
Articles refer to publications from a selection of conference proceedings and peer-reviewed journals in S&E fields from Scopus. Articles are classified by their year of publication and are assigned to a region, country, or economy on the basis of the institutional address(es) of the author(s) listed in the article. Articles are credited on a fractional count basis (i.e., for articles from multiple countries, each country receives fractional credit on the basis of the proportion of its participating authors). See Table SPBS-1 for countries included in the EU; beginning in 2020, the United Kingdom was no longer a member of the EU. See Table SPBS-2 for all fields of science. See Table SPBS-2 through Table SPBS-16 for data on all regions, countries, and economies and all fields of science.
Source(s):
National Center for Science and Engineering Statistics; Science-Metrix; Elsevier, Scopus abstract and citation database, accessed May 2021.
Science and Engineering Indicators
There is increasing interest in measuring publication output that crosses or combines the standard scientific fields for solving boundary-defying issues, such as climate change or poverty reduction (NRC 2014, NASEM 2021). While publication output provides a potential avenue for measuring cross-disciplinary research output, there are challenges for national-level measures. (See sidebar Measuring Cross-Disciplinarity Using Publication Output.)