 An official website of the United States government
 Technical Appendix
Technical Appendix: Publications Output Data and Methodology
The Science and Engineering Indicators 2022 report “Publications Output: U.S. Trends and International Comparisons” (PBS) uses a large database of publication records as a source of bibliometric data. Bibliometric data include each article’s title; author(s); authors’ institution(s); references; journal title; unique article-identifying information (journal volume, issue, and page numbers or digital object identifier); and year or date of publication. The PBS report uses Scopus, a bibliometric database of scientific literature with English titles and abstracts from Elsevier, to examine national and global scientific publication–related activity. This appendix discusses the Scopus data and data limitations as well as the coronavirus data used in the sidebar “Coronavirus Publication Output and International Collaboration.” More detailed documentation of the Scopus data and computation of bibliometric indicators is available in the report Bibliometric Indicators for the Science and Engineering Indicators 2022. Technical Documentation (Science-Metrix 2021).
Data
The counts, coauthorships, and citations presented in the publication output report are derived from information about research articles and conference papers (hereafter referred to collectively as articles) published in conference proceedings and peer-reviewed scientific and technical journals. The articles exclude editorials, commentaries, errata, letters, and other material that do not present new scientific data, theories, methods, apparatuses, or experiments. The articles also exclude working papers, which are not generally peer reviewed. The bibliometric data undergo review and processing to create the data presented in the PBS report (Science-Metrix 2021).
Beginning in the Indicators 2016 report, the PBS report’s analysis shifted from using Web of Science by Clarivate (previously Thompson-Reuters) to the Scopus database by Elsevier. In 2016, an examination of the two databases found expanded data coverage in Scopus of internationally recognized peer-reviewed scientific journals (NSB Indicators 2016: New Data Source for Indicators Expands Global Coverage). Since 2016, both databases have continued to expand coverage. A recent study comparing the databases found 27 million documents in Scopus and 23 million in Web of Science, with an overlap of 18 million (Visser, van Eck, and Waltman 2020). The Indicators 2022 PBS report uses the Scopus database to ensure the broadest coverage of a curated database.
This section of the appendix continues with a brief overview of the database composition, followed by an explanation of potential biases in the data, such as exclusion of non-peer-reviewed articles, English-language bias, and the reasoning behind removing conference papers from the highly cited articles (HCA) index.
Database Composition
Journal selection. Elsevier selects journals for the Scopus database based on evaluation by an international group of subject-matter experts who examine a candidate journal’s editorial policy, content quality, peer-review policies, peer-review process and capacity, citations by other publications, editor standing, regularity of publication, and content availability.
Conference selection. Elsevier selects conference materials for the Scopus database by subject field based on quality and relevancy, including the reputations of the sponsoring organization and the publisher of the proceedings.
Database Filtering
The National Center for Science and Engineering Statistics (NCSES) undertakes additional filtering of the Scopus data to ensure that the statistics presented in Indicators measure original and high-quality research publications (Science-Metrix 2021). Around 2011, librarians and bibliometric experts began to note an increase in articles in the database from electronic journals and conference proceedings lacking substantive peer review.
To exclude these publications from the bibliometric data used in this report, NCSES removed two sets of data from the Scopus database:
- Journals and conference papers flagged by the Directory of Open Access Journals (DOAJ) for failing to adhere to its list of best practices or being suspected of editorial misconduct.
- Titles removed by Elsevier from the Scopus database beginning in 2014 were removed retroactively from the Indicators database for all publication years (Science-Metrix 2019).
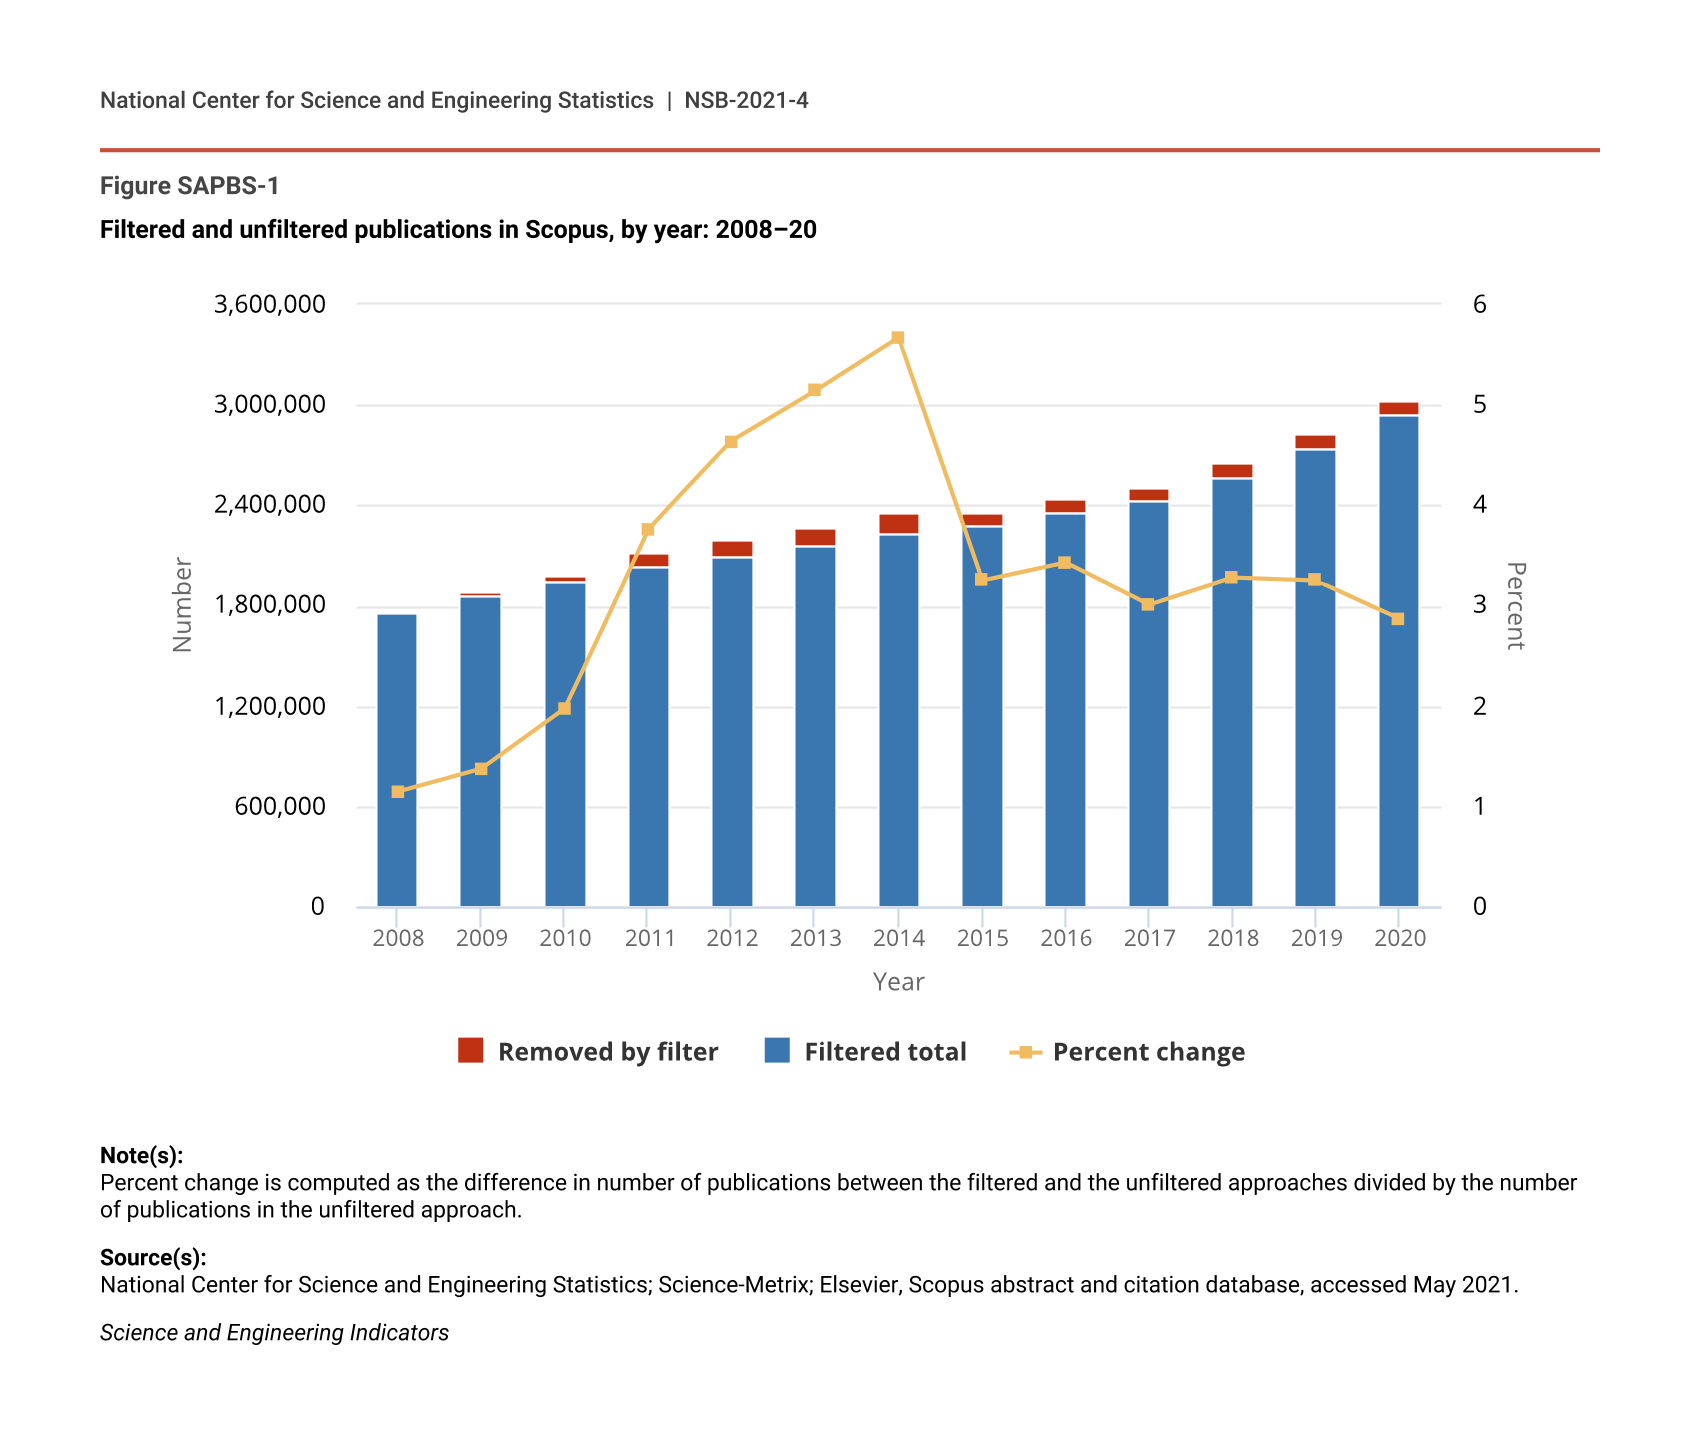
As a result, NCSES removed 2% or fewer articles from the Scopus database prior to 2011, then about 4% (more than 79,000 articles) in 2011, and then peaked with 5%–6% (102,0000–134,000 articles) each year from 2012 to 2014 (Figure SAPBS-1). The removal rate then declined and has held steady from 2015 to 2020, averaging about 3% per year as Elsevier began instituting filters on the Scopus database.
Filtered and unfiltered publications in Scopus, by year: 2008–20
| Year | Percent change | Filtered total | Removed by filter |
|---|---|---|---|
| 2008 | 1.14 | 1,751,394 | 20,278 |
| 2009 | 1.37 | 1,850,488 | 25,782 |
| 2010 | 1.97 | 1,938,121 | 39,048 |
| 2011 | 3.76 | 2,036,090 | 79,524 |
| 2012 | 4.64 | 2,090,551 | 101,714 |
| 2013 | 5.14 | 2,153,533 | 116,667 |
| 2014 | 5.67 | 2,223,983 | 133,678 |
| 2015 | 3.25 | 2,275,565 | 76,363 |
| 2016 | 3.43 | 2,357,663 | 83,784 |
| 2017 | 3.01 | 2,432,385 | 75,517 |
| 2018 | 3.28 | 2,567,468 | 86,953 |
| 2019 | 3.25 | 2,739,272 | 91,986 |
| 2020 | 2.87 | 2,940,807 | 86,876 |
Note(s):
Percent change is computed as the difference in number of publications between the filtered and the unfiltered approaches divided by the number of publications in the unfiltered approach.
Source(s):
National Center for Science and Engineering Statistics; Science-Metrix; Elsevier, Scopus abstract and citation database, accessed May 2021.
Science and Engineering Indicators
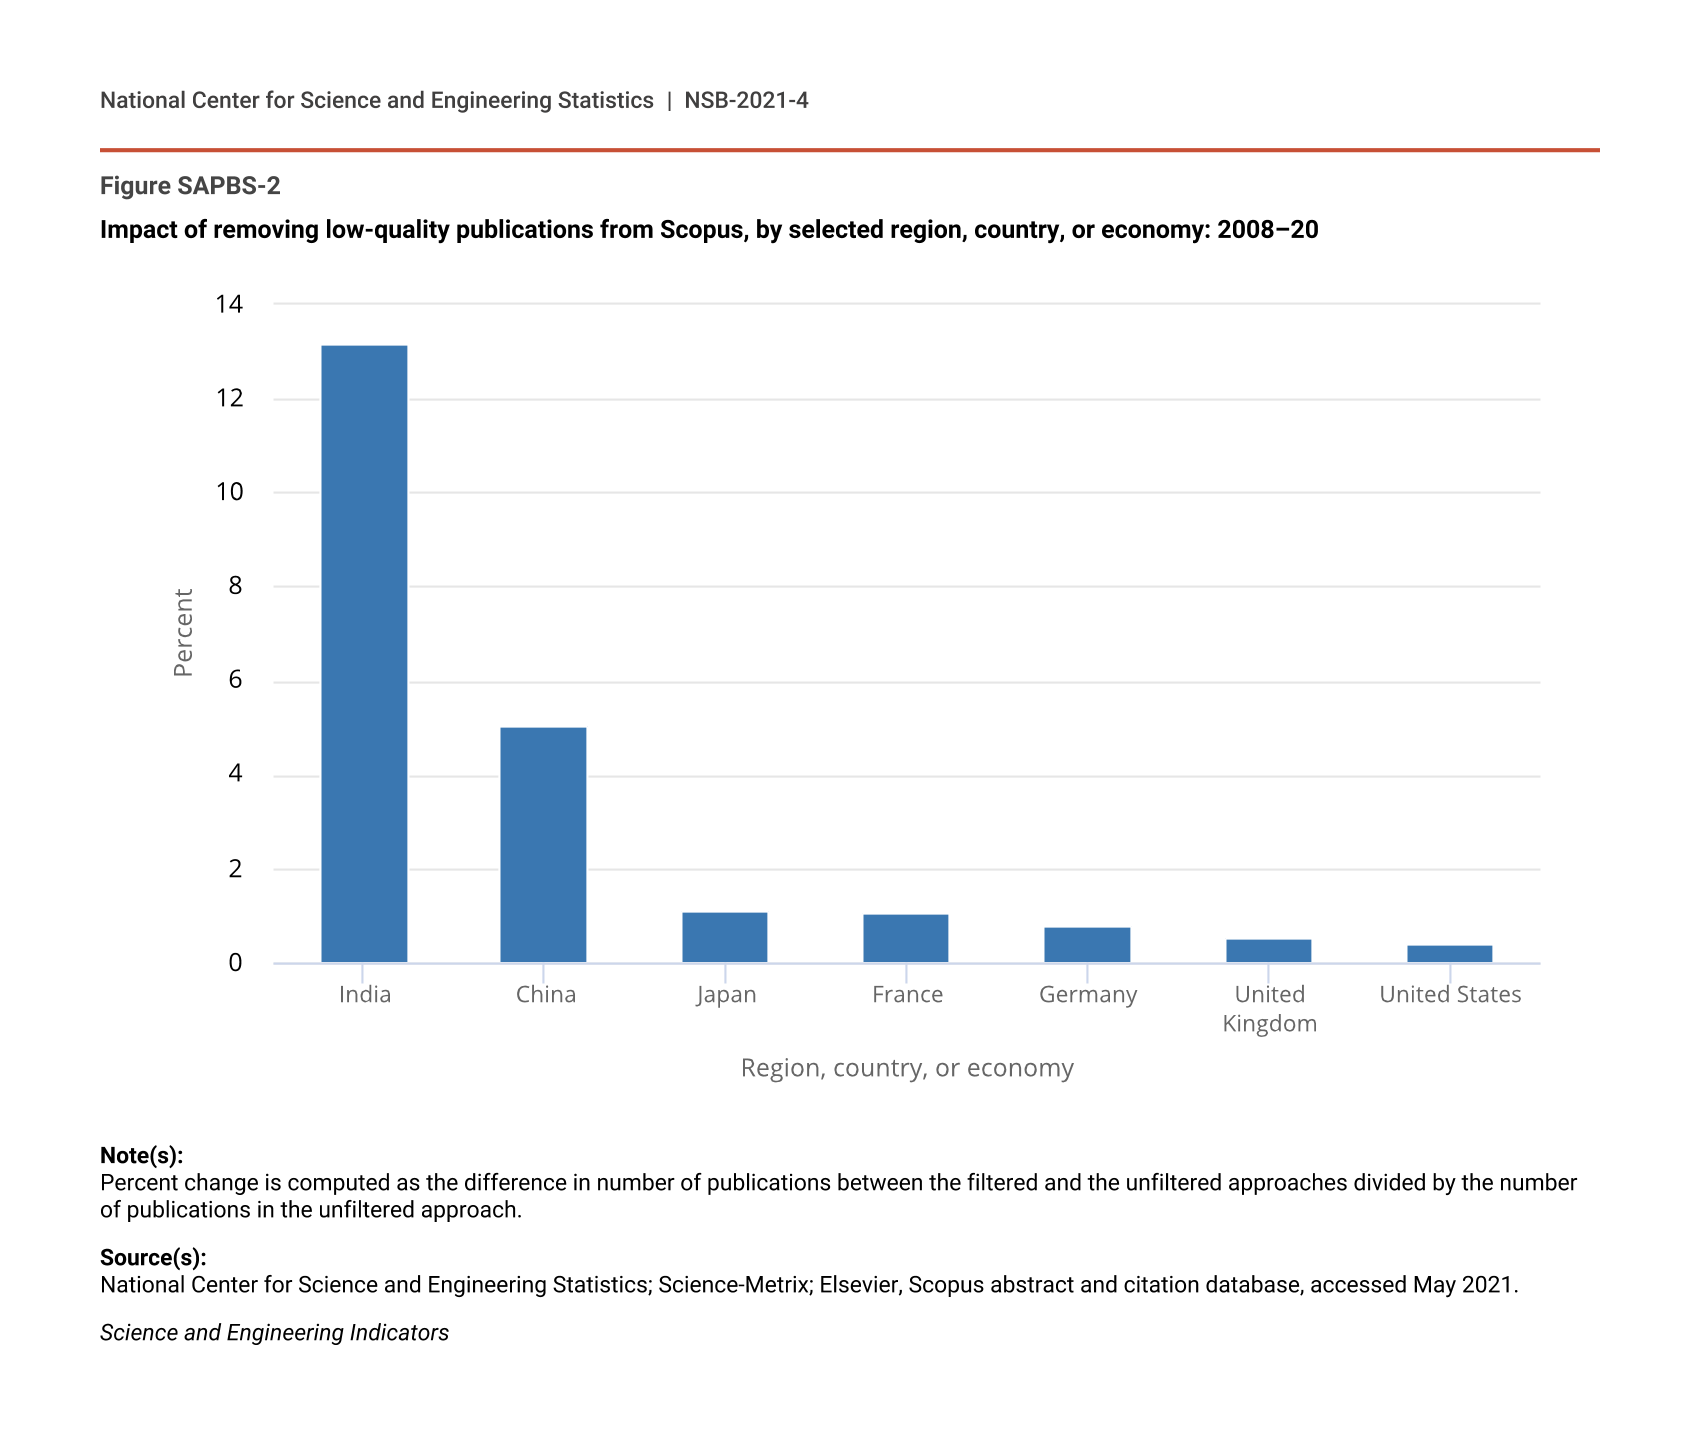
The filtering has different impacts by country and field of science. NCSES has examined the effect of this filtering to better understand any potential bias. Figure SAPBS-2 shows the numerical impact of the filters by country or economy. During 2008–20, India had the largest percentage of articles removed (approximately 13% of India’s total unfiltered article count and 18% of all removed articles), followed by China (5% of China’s total unfiltered article count and 28% of all removed articles). The 2008–20 data represent a change from the previous PBS report cycle (2008–18). During 2008–18, China was the country with the greatest percentage of articles removed (6%) (NSB 2019). The current period, 2008–20, shows China staying relatively unchanged, but there was a large increase in the percentage removed from India (from 8% in 2008–18 data to 13% in the 2008–20 data).
Impact of removing low-quality publications from Scopus, by selected region, country, or economy: 2008–20
| Region, country, or economy | Percent change |
|---|---|
| India | 13.16 |
| China | 5.03 |
| Japan | 1.11 |
| France | 1.05 |
| Germany | 0.80 |
| United Kingdom | 0.52 |
| United States | 0.39 |
Note(s):
Percent change is computed as the difference in number of publications between the filtered and the unfiltered approaches divided by the number of publications in the unfiltered approach.
Source(s):
National Center for Science and Engineering Statistics; Science-Metrix; Elsevier, Scopus abstract and citation database, accessed May 2021.
Science and Engineering Indicators
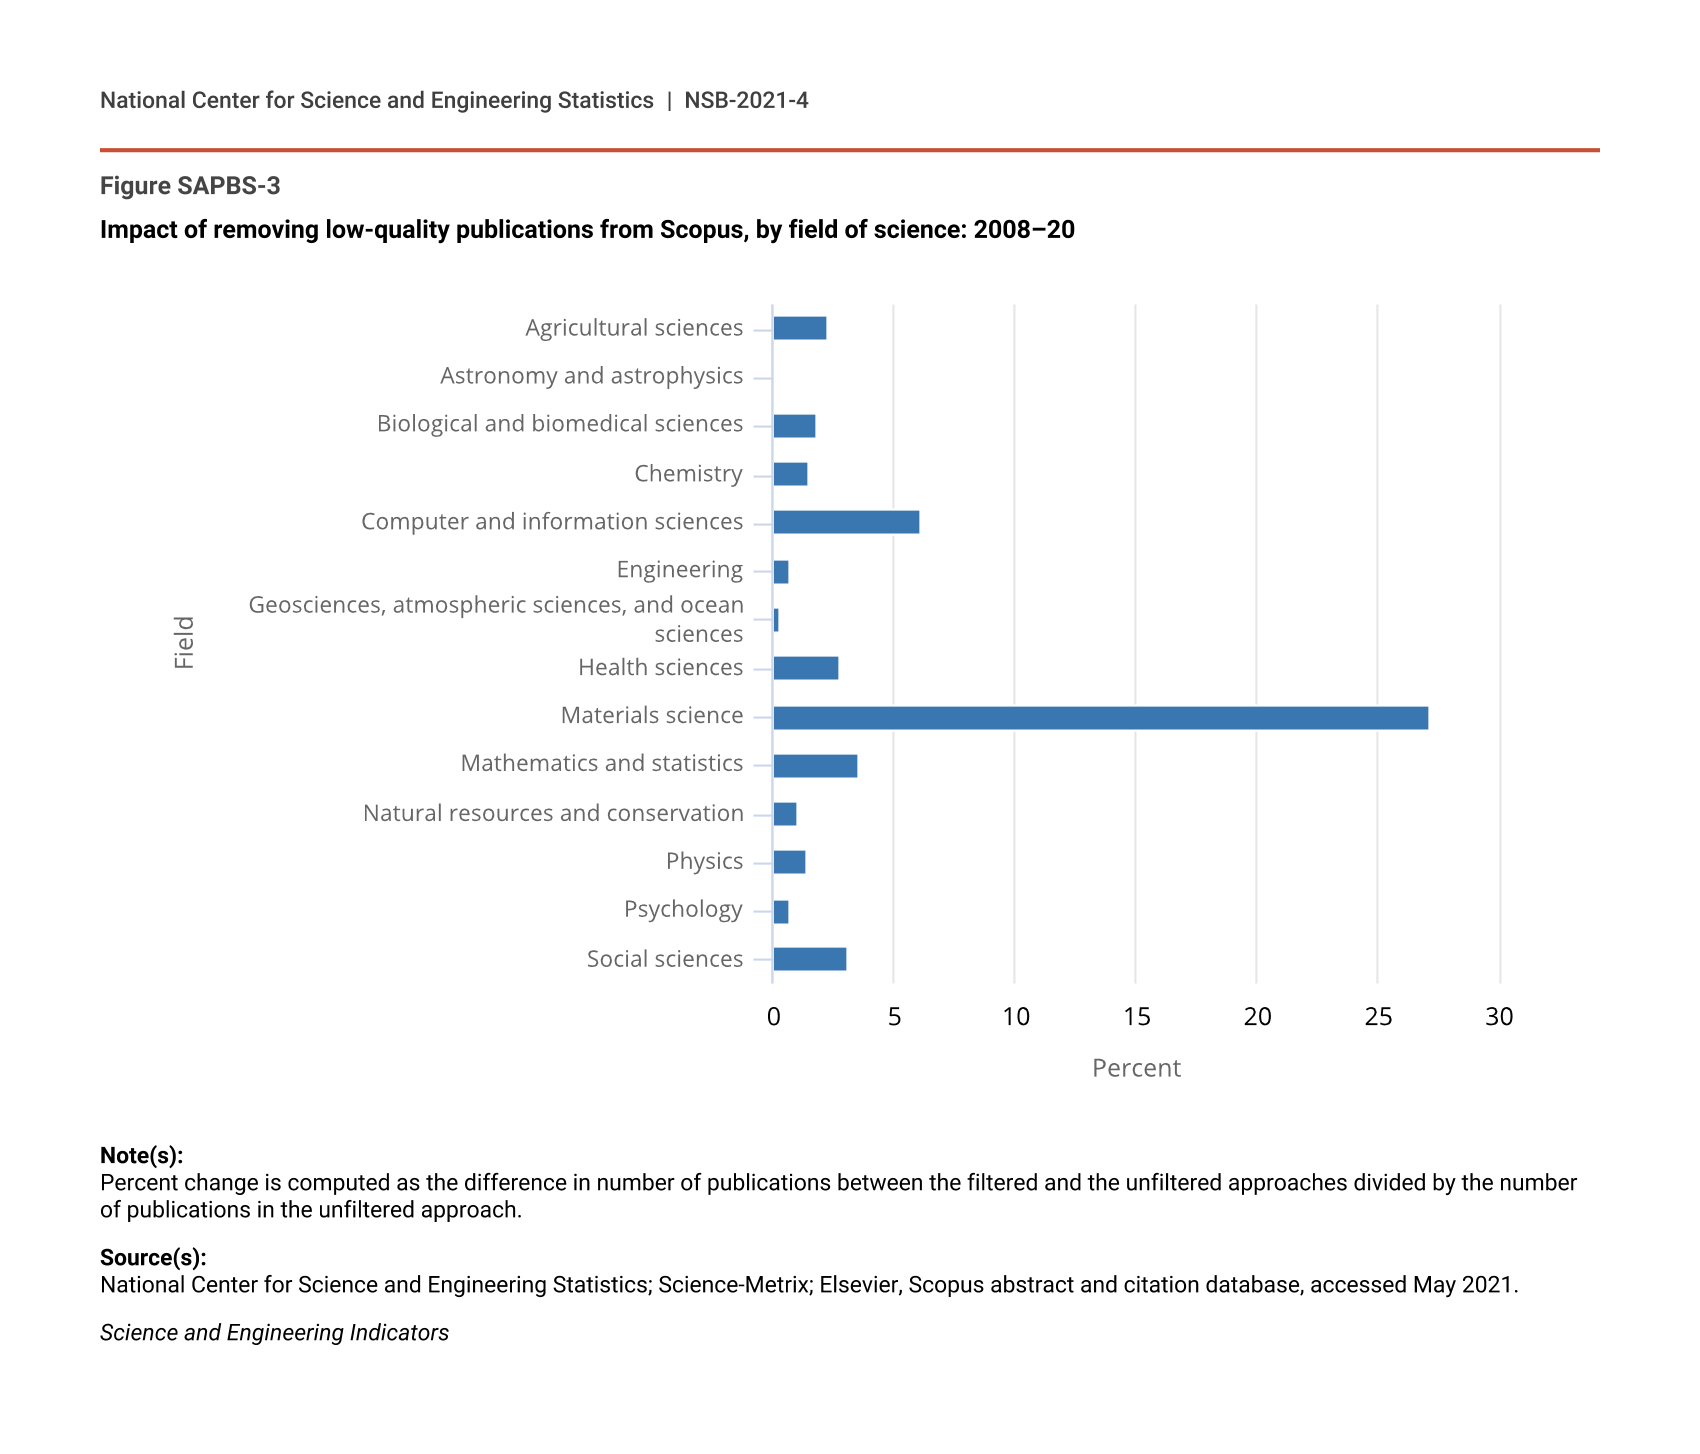
Conference papers accounted for 39% of articles removed by the NCSES filter. For example, conference papers were removed in cases in which publishers posted new conference proceedings every day, with each post containing many papers. This high-frequency publication presented concerns about robustness, originality, and peer review (Van Noorden 2014). Removing low-quality conference proceedings impacts fields of science differently; for example, conference proceedings are a large share of materials science articles (40%). Thus, filtering conference papers had the largest impact on the field of materials science by removing 27% of the unfiltered total articles in this field (Figure SAPBS-3).
Impact of removing low-quality publications from Scopus, by field of science: 2008–20
| Field | Percent change |
|---|---|
| Agricultural sciences | 2.22 |
| Astronomy and astrophysics | 0.00 |
| Biological and biomedical sciences | 1.85 |
| Chemistry | 1.45 |
| Computer and information sciences | 6.09 |
| Engineering | 0.67 |
| Geosciences, atmospheric sciences, and ocean sciences | 0.25 |
| Health sciences | 2.75 |
| Materials science | 27.17 |
| Mathematics and statistics | 3.57 |
| Natural resources and conservation | 1.02 |
| Physics | 1.38 |
| Psychology | 0.70 |
| Social sciences | 3.14 |
Note(s):
Percent change is computed as the difference in number of publications between the filtered and the unfiltered approaches divided by the number of publications in the unfiltered approach.
Source(s):
National Center for Science and Engineering Statistics; Science-Metrix; Elsevier, Scopus abstract and citation database, accessed May 2021.
Science and Engineering Indicators
English-Language Bias
The Scopus database is constructed from articles and conference proceedings with an English-language title and abstract; therefore, the database contains an unmeasurable bias because not all science and engineering (S&E) articles and conference proceedings meet the English language requirement (Elsevier 2020). Scopus uses English because it is the assumed global language of science (Amano, González-Varo, and Sutherland 2016). The bias also undercounts citations associated with non-English publications because the non-English publications are not indexed in the database.
The language of articles is an issue for bibliometric measurement of scientific output. Publication output data for non-English-speaking countries underestimates the S&E research output for China, Japan, and other countries as well (Amano, González-Varo, and Sutherland 2016; Xie and Freeman 2019). Therefore, when comparing English-speaking and non-English-speaking countries (e.g., Figure PBS-7; Table PBS-1), there is a bias such that the non-English-speaking countries will be undercounted in the number of publications and of citations.
The bias varies by scientific field. Bibliometric researchers have found a native-language preference in citations (Liang, Rousseau, and Zhong 2012), and the social sciences exhibit more substantial linguistic bias than physical sciences, engineering, and mathematics (Mongeon and Paul-Hus 2015).
Conference Papers Removed from Highly Cited Articles (HCA) Index
Conference papers are included in the data analyzed in the report for output but not for HCA computation. Conference papers may bias HCA because of uneven inclusion in Scopus and widely different citation patterns compared with journal articles.
Generally, conference papers are cited less frequently than journal articles. Thus, a greater proportion of conference papers in the total article count for a country would tend to reduce impact based on HCA computation. Depending on the normalization approach, the score of countries could be heavily impacted compared with others because conference papers represent a larger proportion of their output. The issue is demonstrated in a simplified two-country example. Both countries publish 1,000 journal articles, but one publishes 10 conference papers, and the other publishes 200 conference papers. Assume that, based on the 1,000 journal articles, both countries have the same impact. If scores are lower for conference papers, adding conference papers into the computation will reduce the combined HCA score of the country with 200 conference papers. Therefore, in this case, two countries with similar impact in research published in journals may present much different impact because of the propensity of one to also send people to conferences.
In other cases, conference papers can increase the HCA for a country. Some fields of science publish and cite conference proceedings at different rates. A field with a low average number of citations for each article can have an increase in HCA by including conference papers, even those with relatively few citations. For example, if the country’s average number of citations is one and a conference paper receives two citations, the normalized impact of the conference paper will be 2.0, which is quite high. Adding these high-impact conference papers could potentially boost the score of a country that specializes in a field with a below-average number of article citations and whose researchers participate in an above-average number of conferences.
The Indicators 2022 PBS report removes conference proceedings from the HCA but keeps conference proceedings in the total output and collaboration analysis because conference proceedings for some fields and countries are an important component of their output. The exception to this rule is for computer and information sciences. The HCA for computer and information sciences for journal articles alone and for journal articles plus conference proceedings shows similar HCA trends for the United States and China (Table SPBS-63 and Table SPBS-73). For both countries, including conference proceedings boosts the HCA from 2014 through 2018. Computer and information sciences was selected for this comparison because conference proceedings are close to 20% of the references in that field (Lisée, Larivière, and Archambault 2008).
Key to Acronyms and Abbreviations
CORD-19: COVID-19 Open Research Dataset
DOAJ: Directory of Open Access Journals
HCA: highly cited articles
NCSES: National Center for Science and Engineering Statistics
PBS: Publication Output: U.S. Trends and International Comparisons
S&E: science and engineering
References
Amano T, González-Varo JP, Sutherland WJ. 2016. Languages Are Still a Major Barrier to Global Science. PLOS Biology 14(12):e2000933. Available at http://journals.plos.org/plosbiology/article?id=10.1371%2Fjournal.pbio.2000933. Accessed 26 January 2021.
Bastian M, Heymann S, Jacomy M. 2009. Gephi: An Open Source Software for Exploring and Manipulating Networks. Proceedings of the Third International ICWSM Conference. Available at https://gephi.org/publications/gephi-bastian-feb09.pdf.
Beall J. 2012. Predatory Publishers Are Corrupting Open Access. Nature 489(179). Available at Predatory publishers are corrupting open access | Nature. Accessed 30 June 2021.
Bohannon J. 2013. Who’s Afraid of Peer Review? Science 342(6154):60–65. Available at Who’s Afraid of Peer Review? | Science (sciencemag.org). Accessed 30 June 2021.
Carey K. 2016. A Peek Inside the Strange World of Fake Academia. New York Times December 29:3. Available at https://www.nytimes.com/2016/12/29/upshot/fake-academe-looking-much-like-the-real-thing.html?_r=0. Accessed 1 July 2021.
Elsevier. 2020. Scopus Content Coverage Guide. Available at https://www.elsevier.com/__data/assets/pdf_file/0007/69451/Scopus_ContentCoverage_Guide_WEB.pdf. Accessed 15 June 2021.
Jacomy M, Venturini T, Heymann S, Bastian M. 2014. ForceAtlas2, a Continuous Graph Layout Algorithm for Handy Network Visualization Designed for the Gephi Software. PLOS ONE 9(6):e98679. Available at https://doi.org/10.1371/journal.pone.0098679. Accessed 14 April 2021.
Kolata G. 2013. Scientific Articles Accepted (Personal Checks, Too). New York Times April 8:1. Available at https://www.nytimes.com/2013/04/08/health/for-scientists-an-exploding-world-of-pseudo-academia.html. Accessed 1 July 2021.
Liang L, Rousseau R, Zhong Z. 2012. Non-English Journals and Papers in Physics: Bias in Citations? Scientometrics 95(1):333–50. Available at https://www.issi-society.org/proceedings/issi_2011/ISSI_2011_Proceedings_Vol1_49.pdf. Accessed 30 June 2021.
Lisée C, Larivière V, Archambault É. 2008. Conference Proceedings as a Source of Scientific Information: A Bibliometric Analysis. Journal of the American Society for Information Science and Technology 59:1776–84. https://doi.org/10.1002/asi.20888
Mongeon P, Paul-Hus A. 2015. The Journal Coverage of Web of Science and Scopus: A Comparative Analysis. Scientometrics 106:213–28. Available at https://doi.org/10.1007/s11192-015-1765-5. Accessed 28 June 2021.
National Science Board (NSB), National Science Foundation. 2016. New Data Source for Indicators Expands Global Coverage. Science and Engineering Indicators 2016. NSB-2016-2. Alexandria, VA. Available at https://www.nsf.gov/statistics/2016/nsb20161/#/sidebar/chapter-5/new-data-source-for-indicators-expands-global-coverage.
National Science Board (NSB), National Science Foundation. 2019. Publications Output: U.S. Trends and International Comparisons: Technical Appendix. Science and Engineering Indicators 2020. NSB-2020-6. Alexandria, VA. Available at https://ncses.nsf.gov/pubs/nsb20206/technical-appendix.
Schneider JW, van Leeuwen T, Visser M, Aagaard K. 2019. Examining National Citation Impact by Comparing Developments in a Fixed and Dynamic Journal Set. Scientometrics 119(2):973–85. Available at https://doi.org/10.1007/s11192-019-03082-3. Accessed 28 June 2021.
Science-Metrix. 2019. Bibliometric and Patent Indicators for the Science and Engineering Indicators 2018. Technical Documentation. Montreal, Canada: Science-Metrix. Available at http://www.science-metrix.com/?q=en/publications/reports#/?q=en/publications/reports/bibliometric-indicators-for-the-sei-2020-technical-documentation.
Science-Metrix. 2021. Bibliometric Indicators for the Science and Engineering Indicators 2022. Technical Documentation. Available at https://science-metrix.com/bibliometrics-indicators-for-the-science-and-engineering-indicators-2022-technical-documentation/. Accessed 1 November 2021.
Van Noorden R. 2014. Publishers Withdraw More than 120 Gibberish Papers. Nature. Available at https://www.nature.com/articles/nature.2014.14763. Accessed 4 June 2021.
Visser M, van Eck NJ, Waltman L. 2020. Large-Scale Comparison of Bibliographic Data Sources: Scopus, Web of Science, Dimensions, Crossref, and Microsoft Academic. Available at https://arxiv.org/abs/2005.10732. Accessed 4 June 2021.
Wang LL, Lo K, Chandrasekhar Y, Reas R, Yang J, Burdick D, Eide D, Funk K, Katsis Y, Kinney R, Li Y, Liu Z, Merrill W, Mooney P, Murdick D, Rishi D, Sheehan J, Shen Z, Stilson B, Wade A, Wang K, Wang NXR, Wilhelm C, Xie B, Raymond D, Weld DS, Etzioni O, Kohlmeier S. 2020. CORD-19: The Covid-19 Open Research Dataset. Available at https://arxiv.org/abs/2004.10706. Accessed 24 May 2021.
World Health Organization (WHO). 2021. Global Research on Coronavirus Disease (COVID-19). Available at https://www.who.int/emergencies/diseases/novel-coronavirus-2019/global-research-on-novel-coronavirus-2019-ncov. Accessed 30 June 2021.
Xie Q, Freeman RB. 2019. Bigger Than You Thought: China’s Contribution to Scientific Publications and Its Impact on the Global Economy. China & World Economy 27:1–27. Available at https://doi.org/10.1111/cwe.12265.