 An official website of the United States government
Report
Notes
1 Data on doctorate recipients for previous years are updated with data received from institutions and respondents after the close of data collection for a given year. Updates and corrections to graduation dates can also change the overall counts for prior years. The published tables reflect these changes and thus may not match previously published data.
2 In 2021, the method for classifying fields of study changed to using the National Center for Education Statistics 2020 revision to the Classification of Instructional Programs (CIP). This SED-CIP method is aligned with the Taxonomy of Disciplines from the National Center for Science and Engineering Statistics (NCSES) to facilitate comparisons with other NCSES surveys as well as with the Integrated Postsecondary Education Data System (IPEDS) Completions survey. A new trend taxonomy was developed to be able to crosswalk and compare data following the 2021 SED-CIP reclassification with data collected prior to 2021. All figures and tables in this publication are based on the trend taxonomy. This leads to slight differences in counts between individual year SED-CIP data from 2021 onward and multiyear data using the trend taxonomy crosswalk. See the “Data source” section for more details.
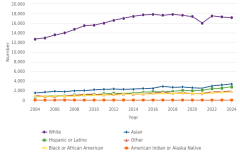
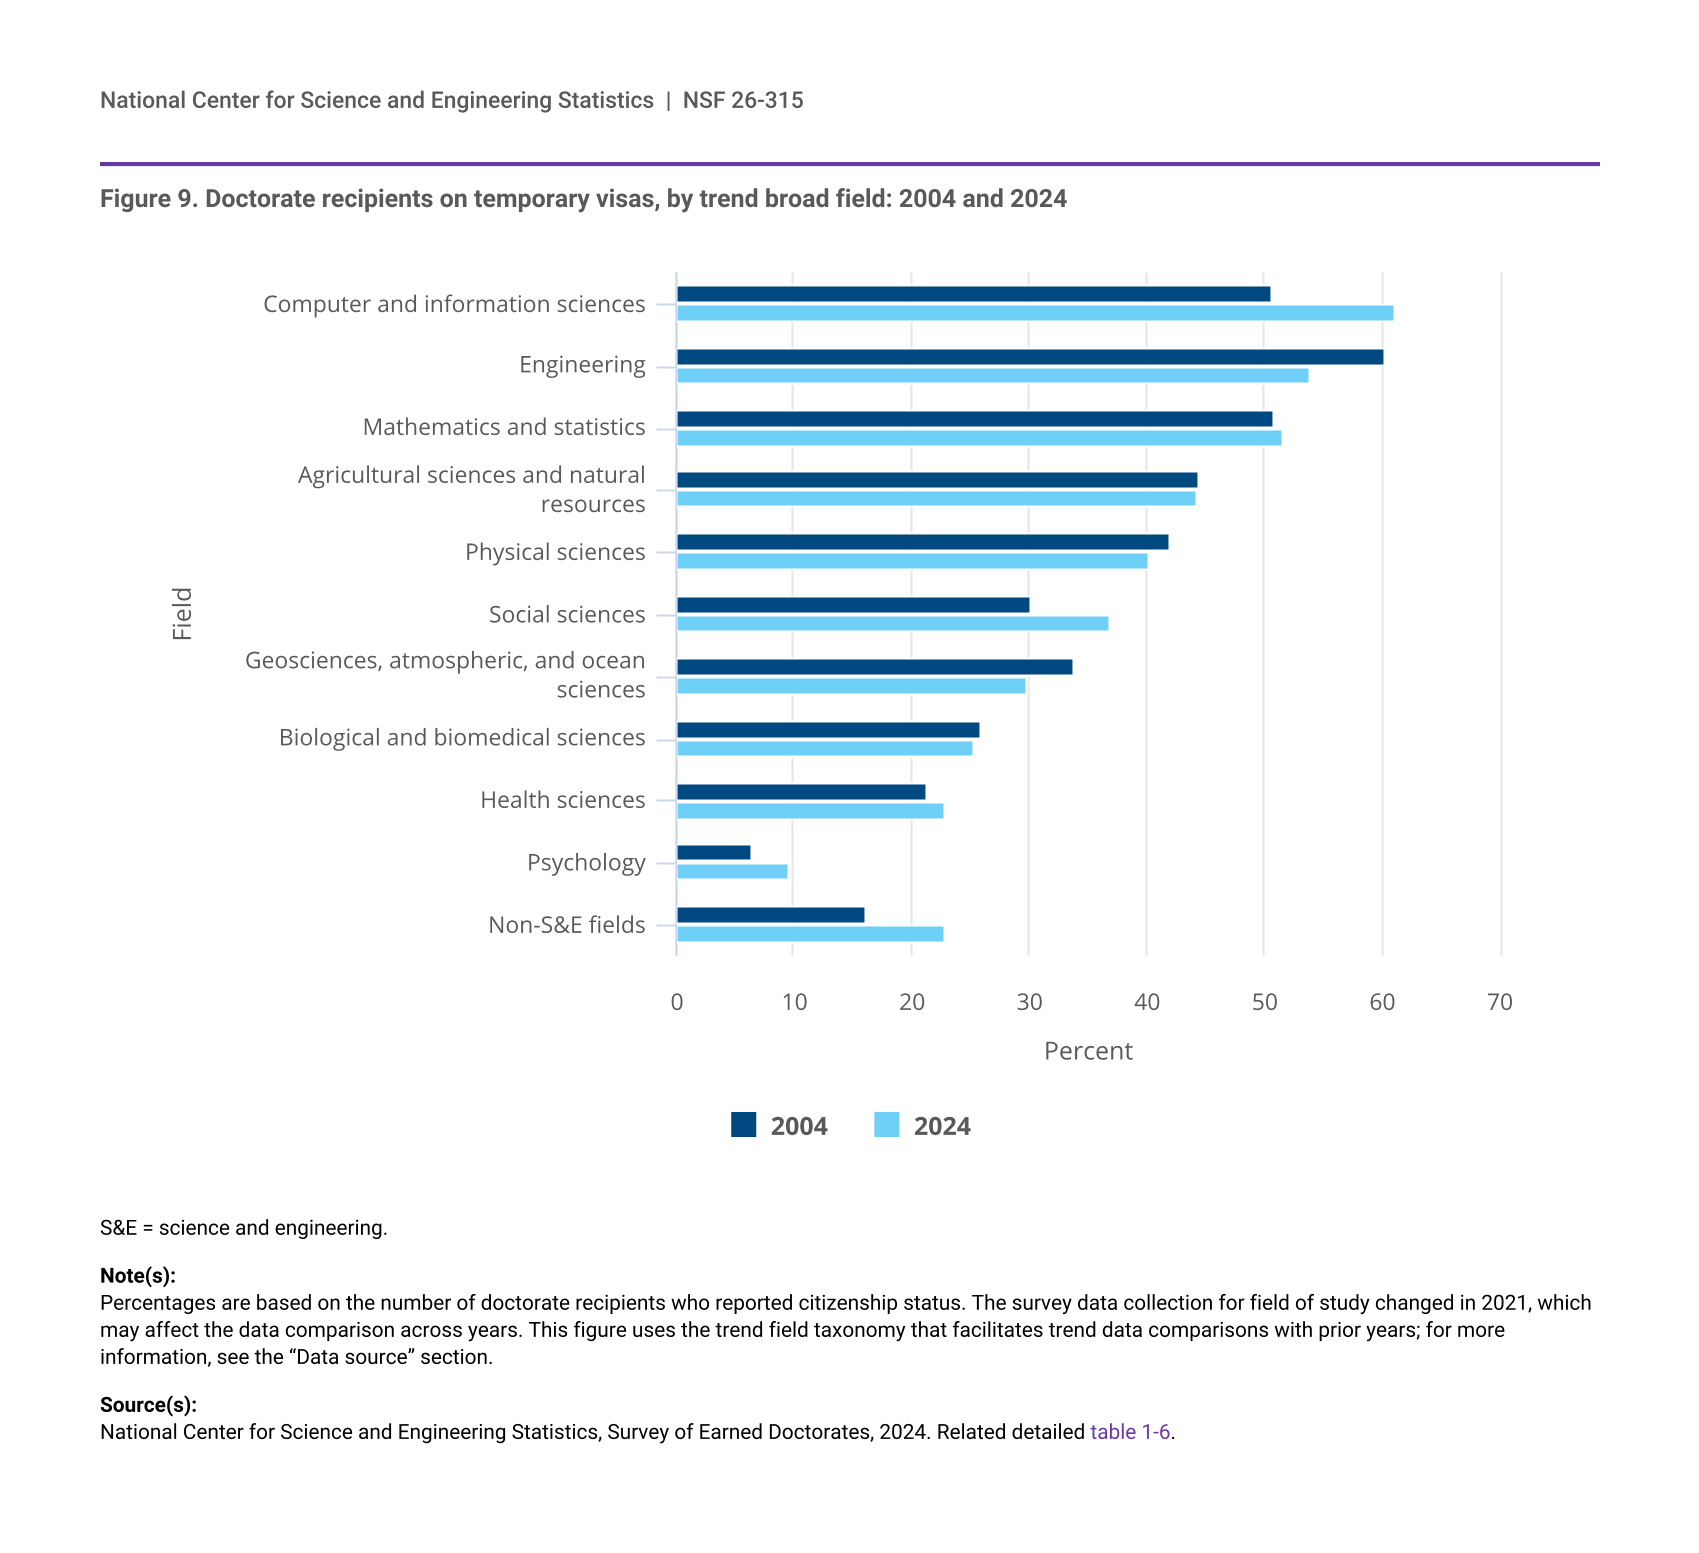
3 The calculation of these proportions excluded doctorate recipients who did not report citizenship.
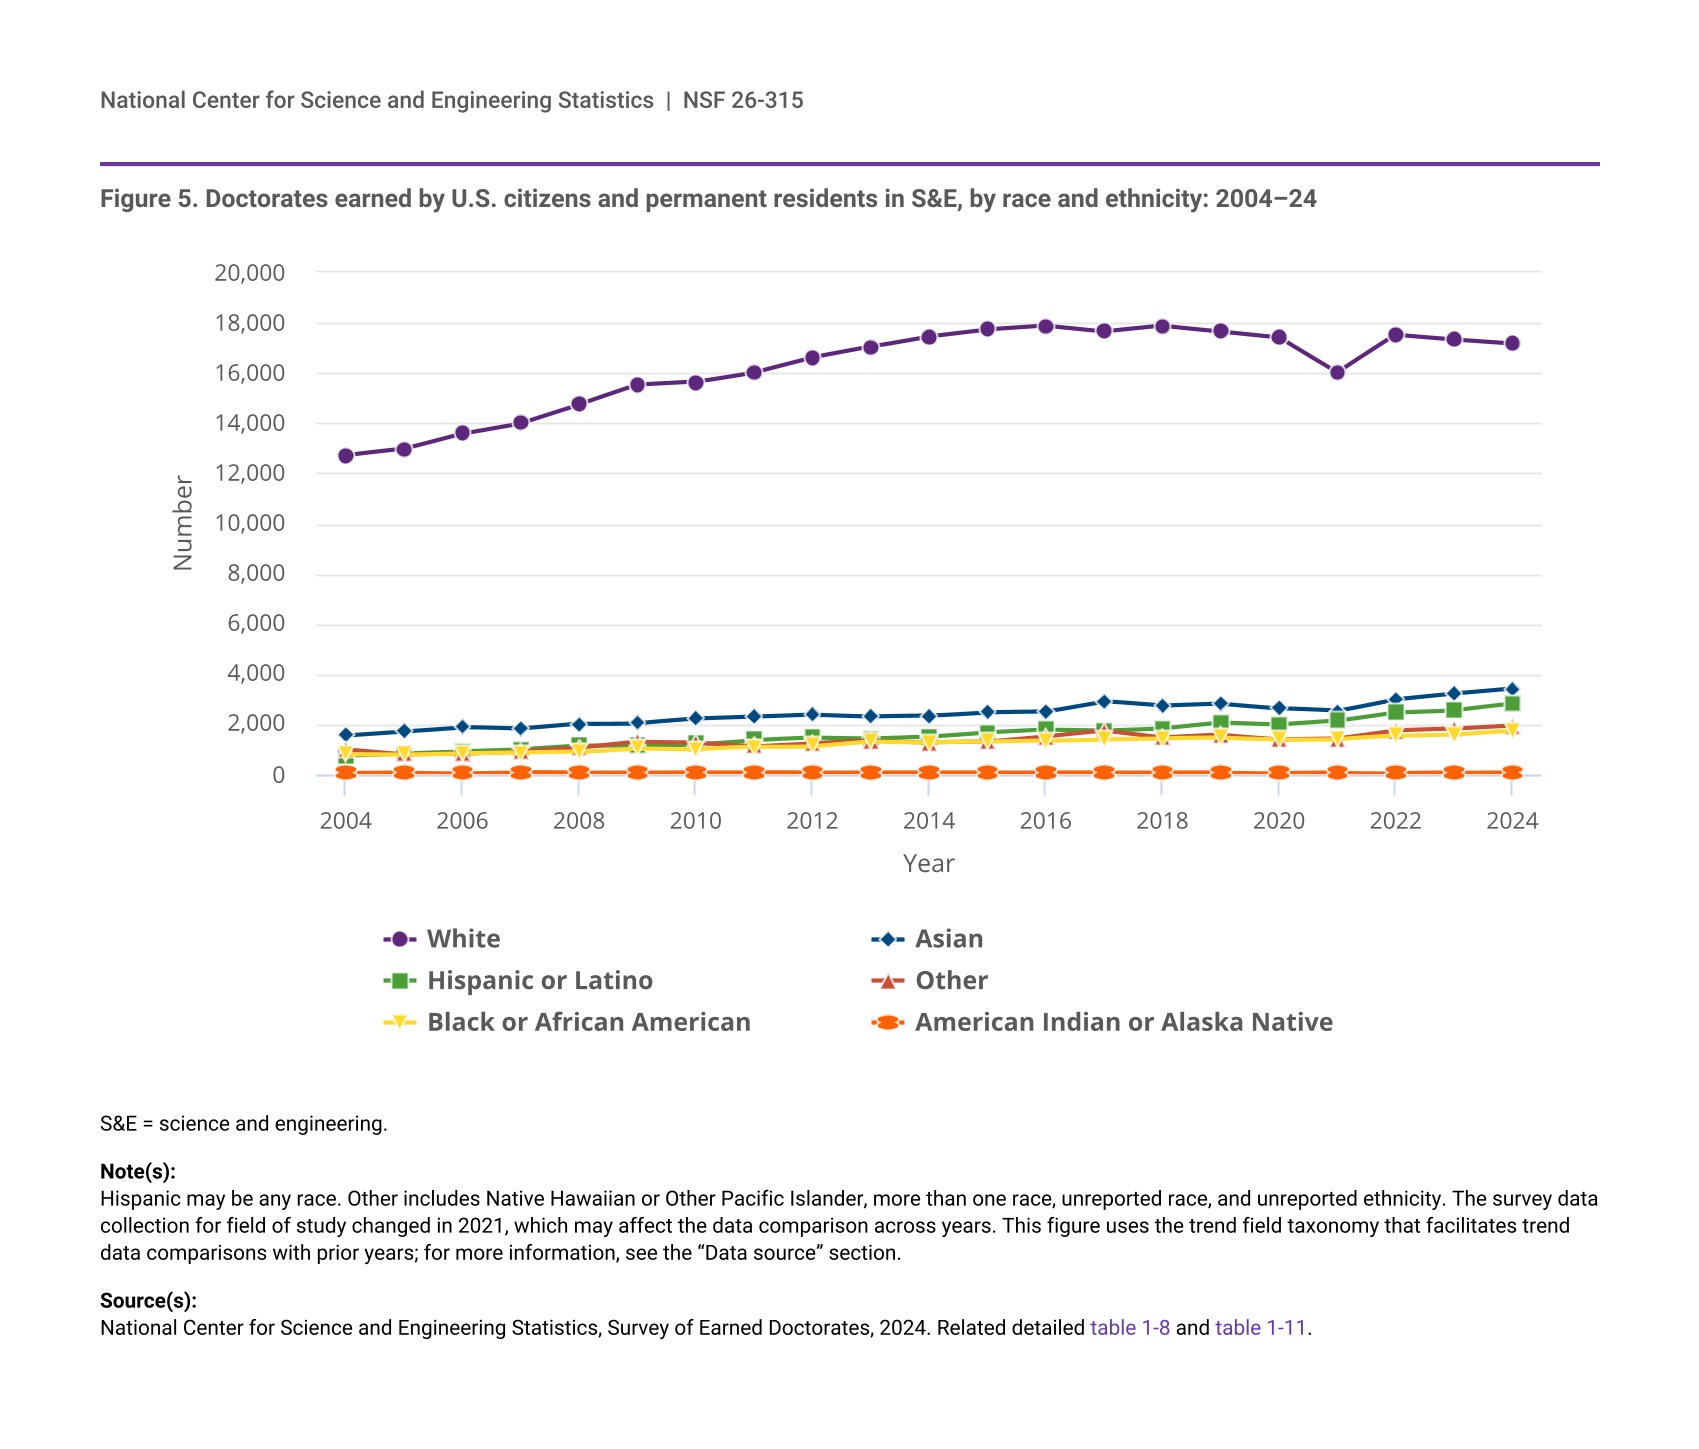
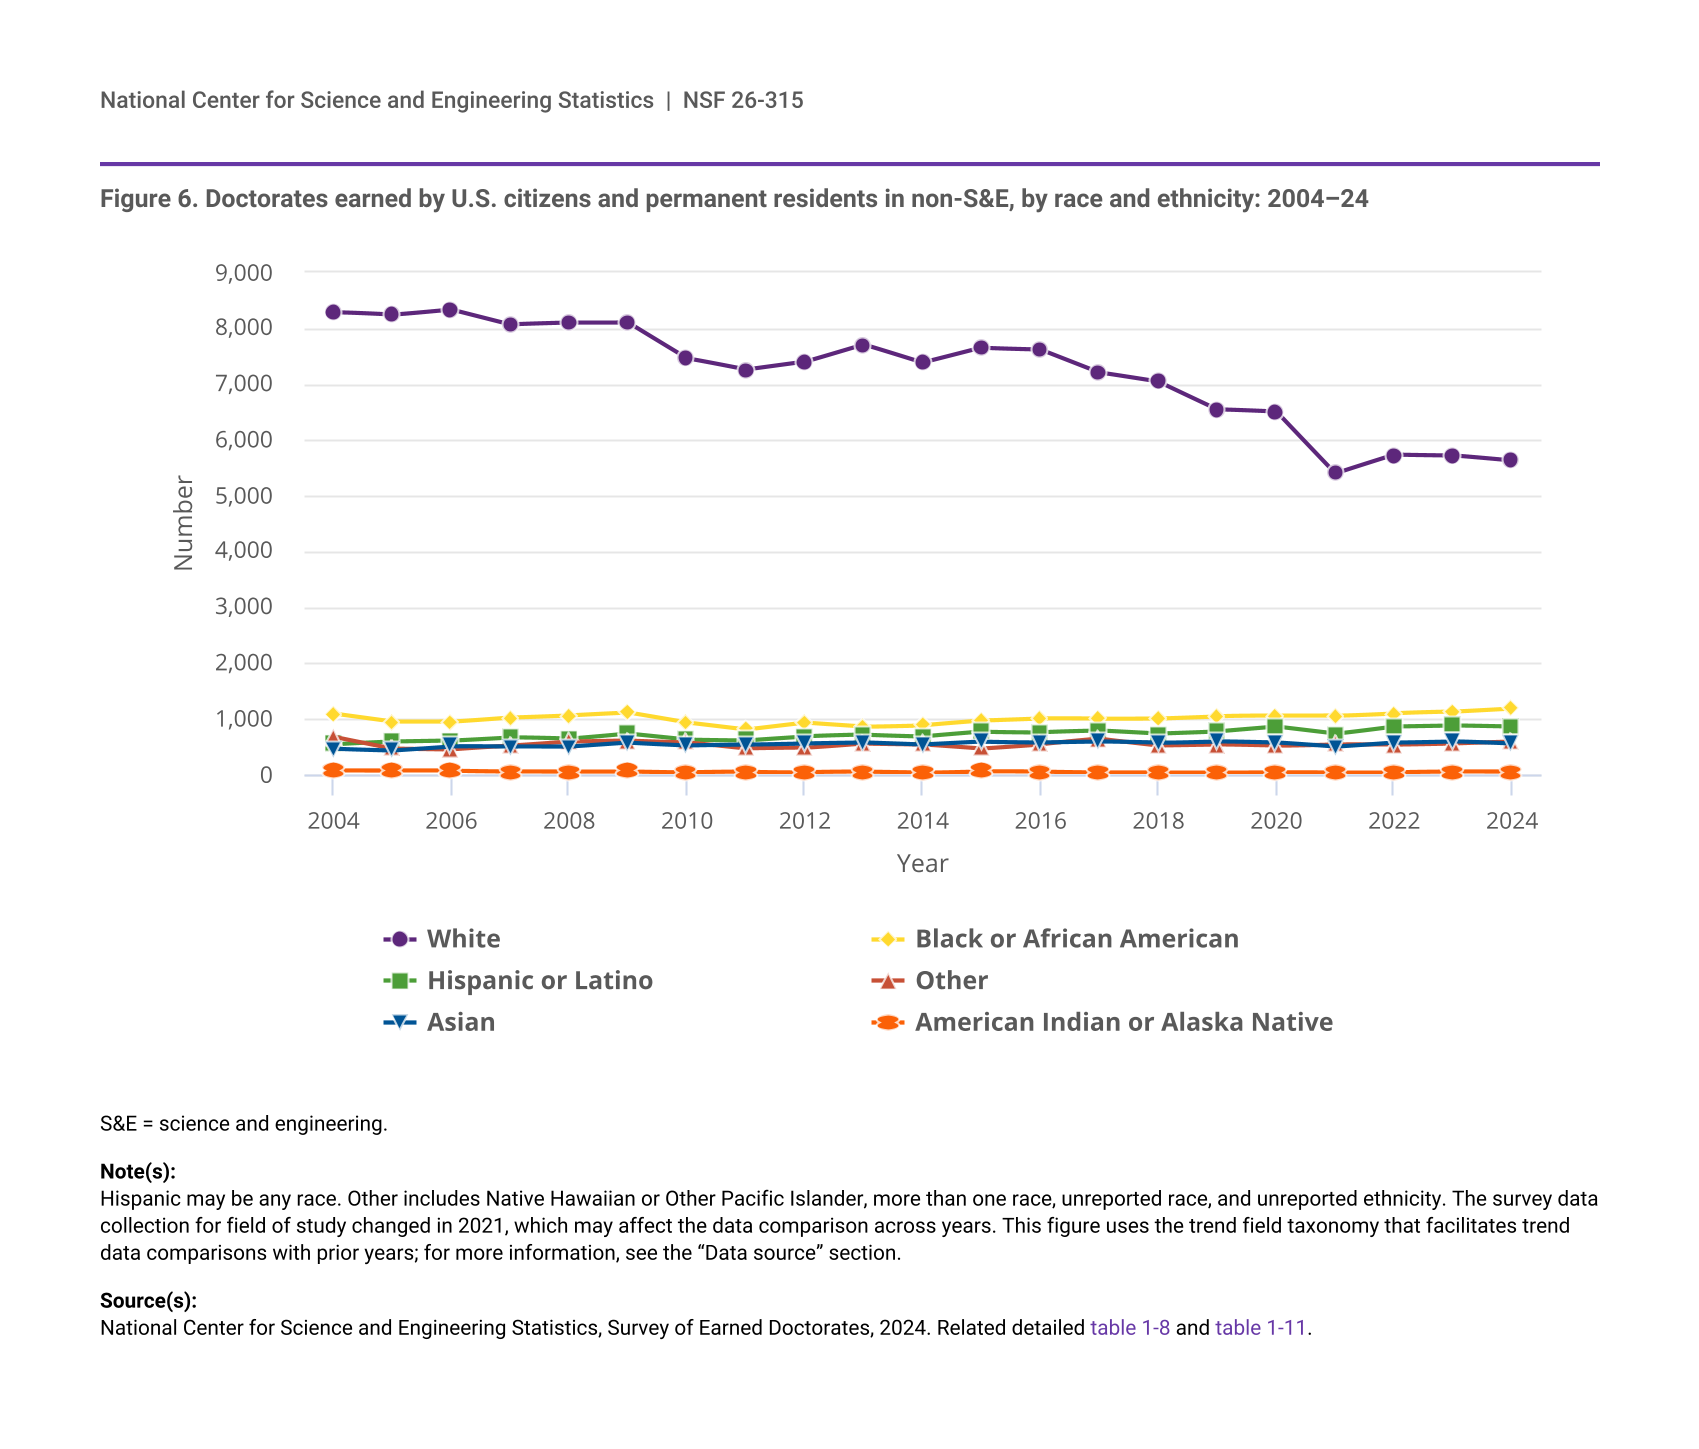
4 For additional data on the race and ethnicity of doctorate recipients, see SED 2024 related detailed table 1-11. Race categories exclude Hispanic origin; Hispanic may be any race.
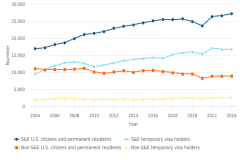
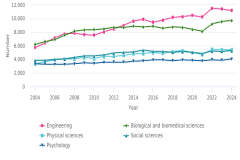
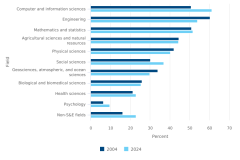
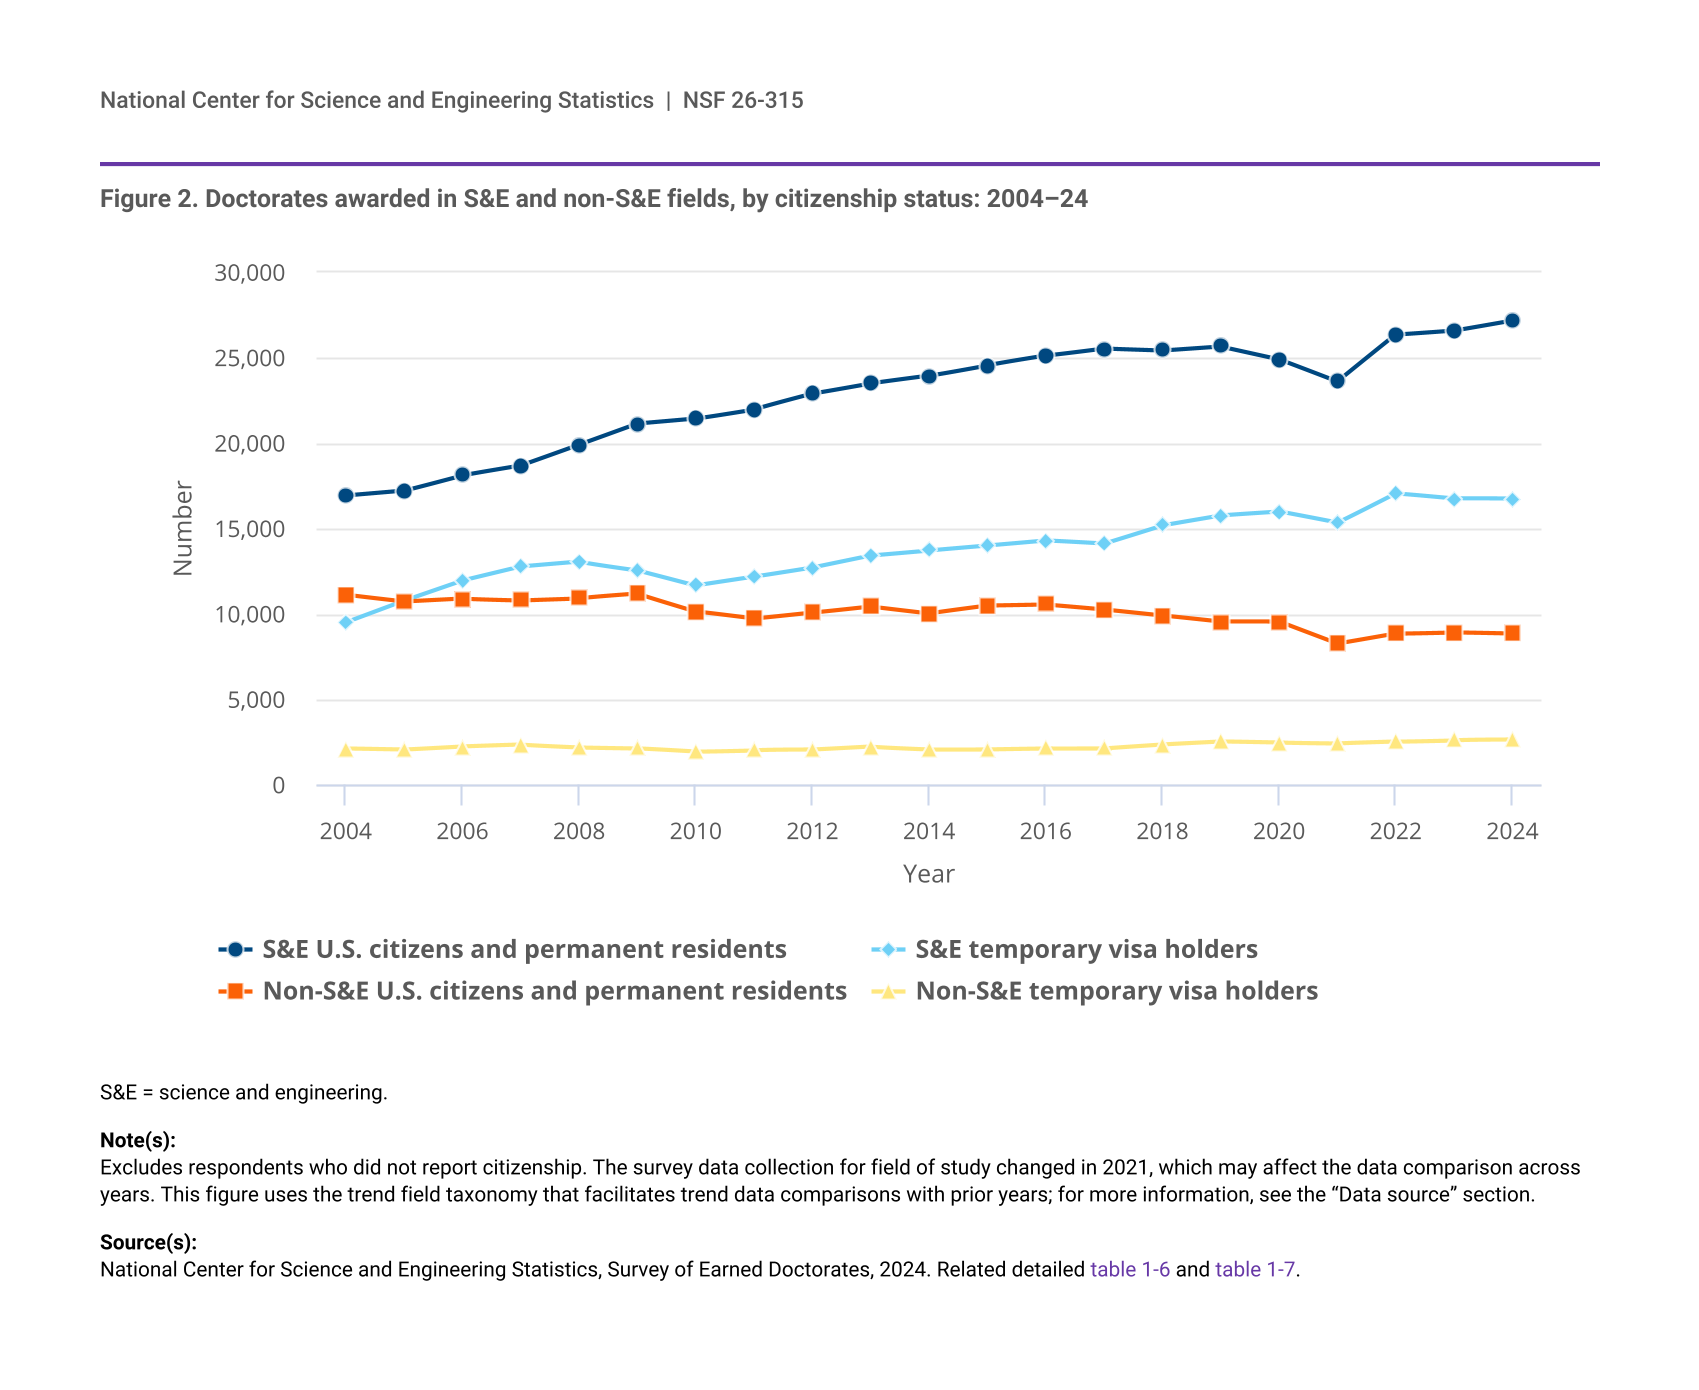
5 In 2004, there were 16,921 S&E U.S. citizen and permanent resident doctorate recipients; in 2024, there were 27,204. (See figure 2.)
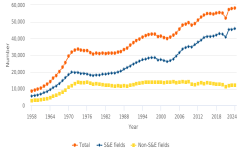
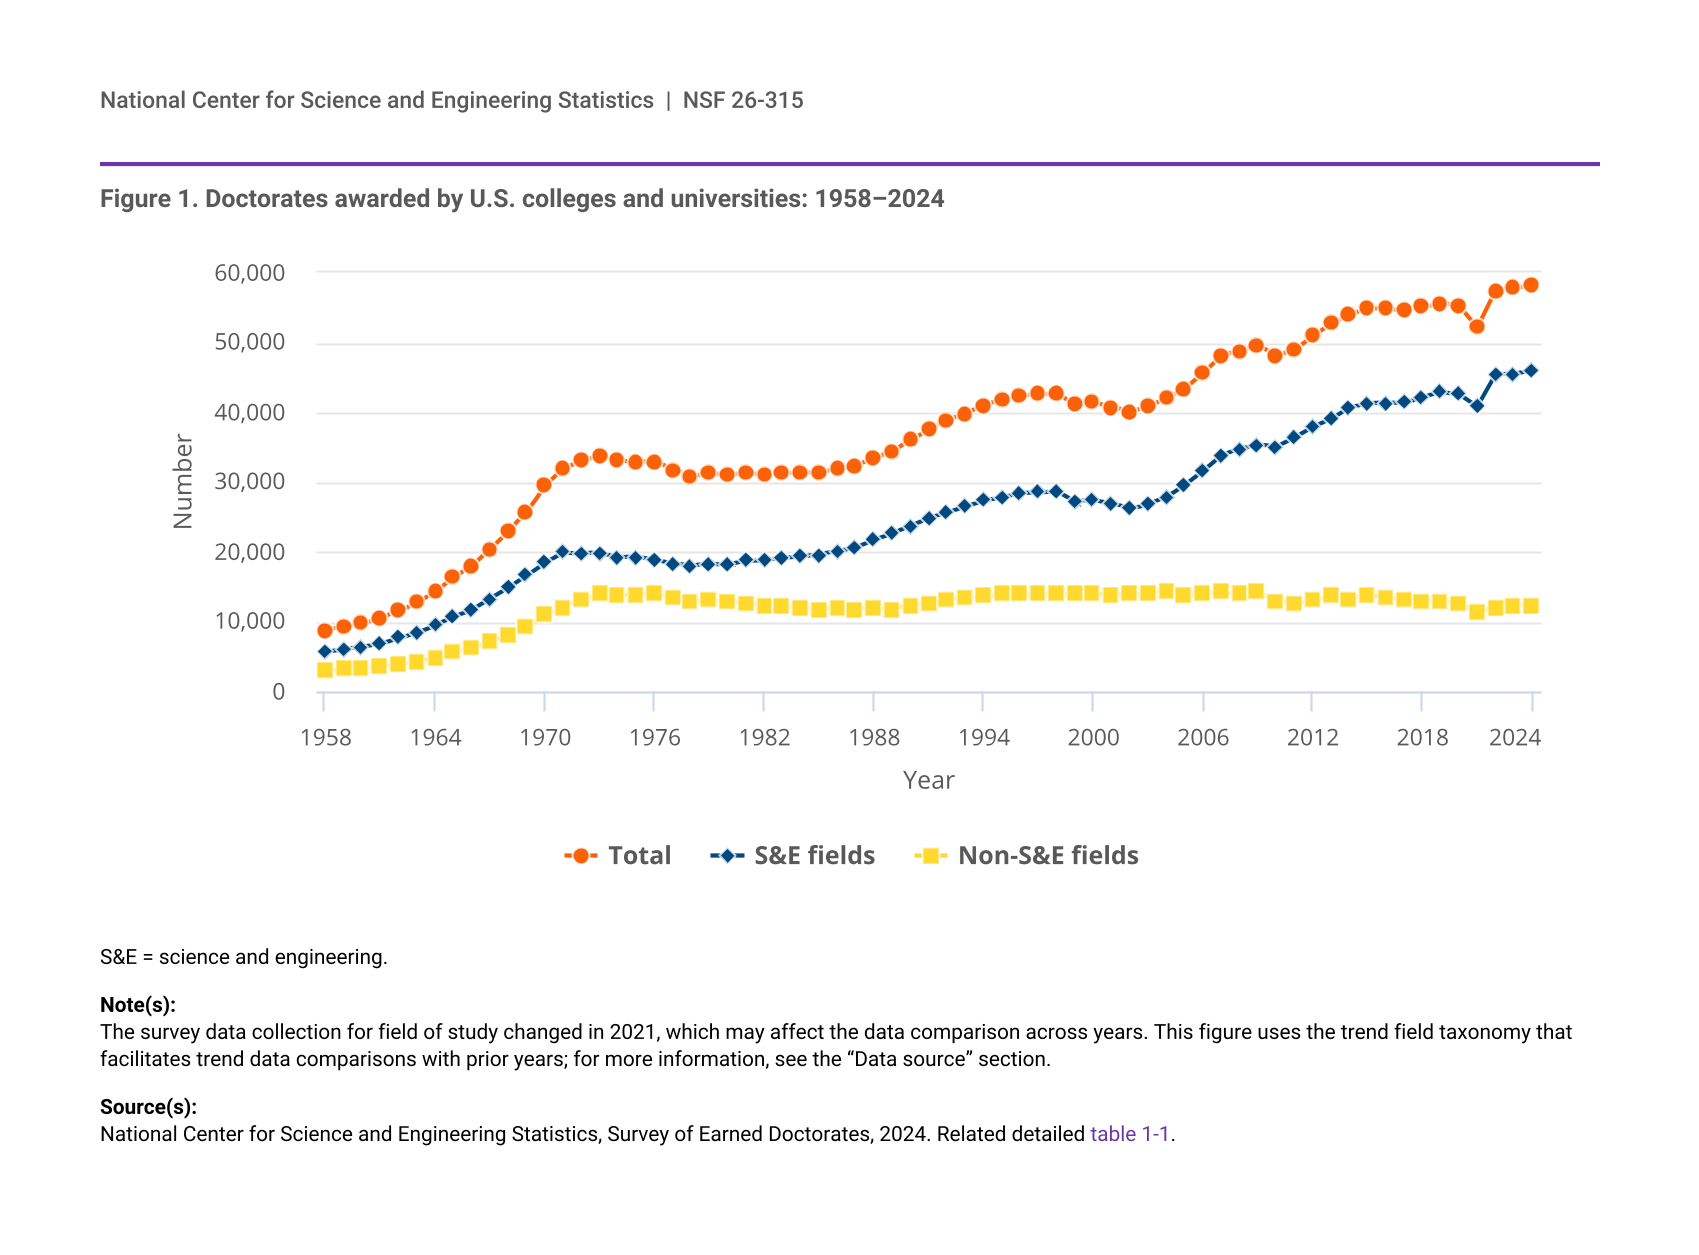
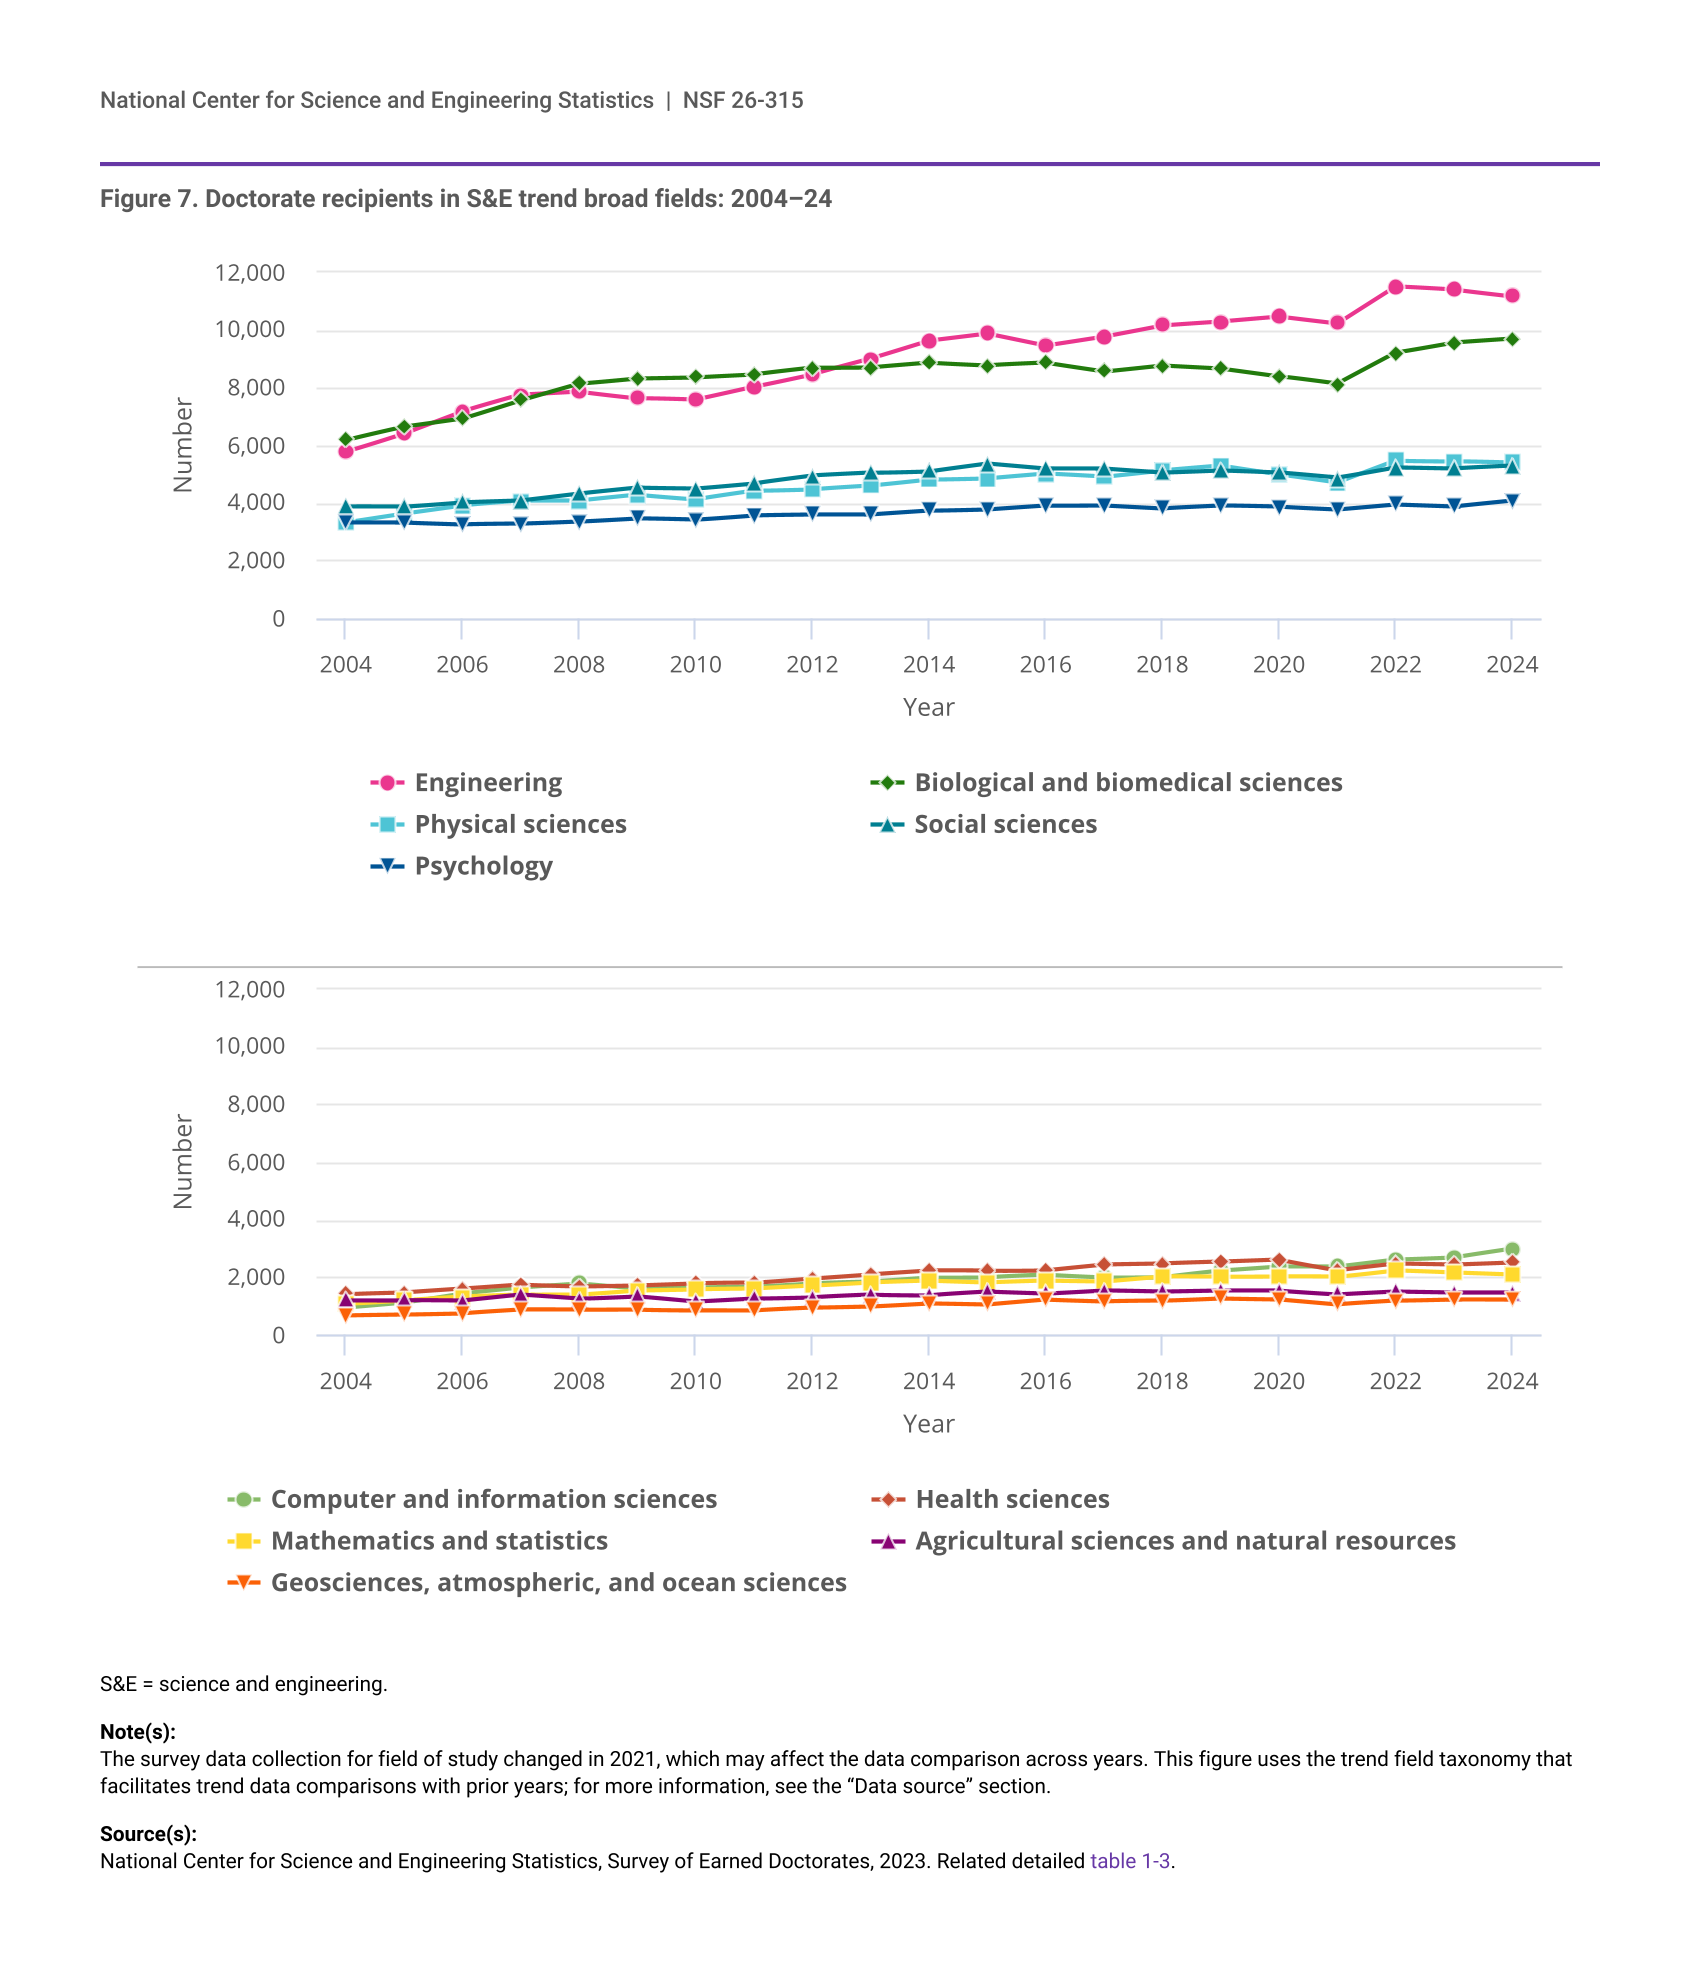
6 The proportion of doctorate recipients by trend broad field out of all doctorate recipients (S&E and non-S&E) can be derived using data from figure 1 for the total number of doctorate recipients and figure 7 and figure 8 for the number of doctorate recipients by field.
7 Beginning in 2021, field of doctorate data are collected using a modified version of the 2020 CIP codes and reported using a new SED-specific taxonomy (table A-4). For more details on data comparability, see the 2024 “Technical Notes” and the SED 2021 Taxonomy Changes Working Paper.
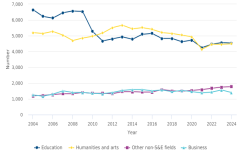
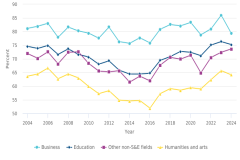
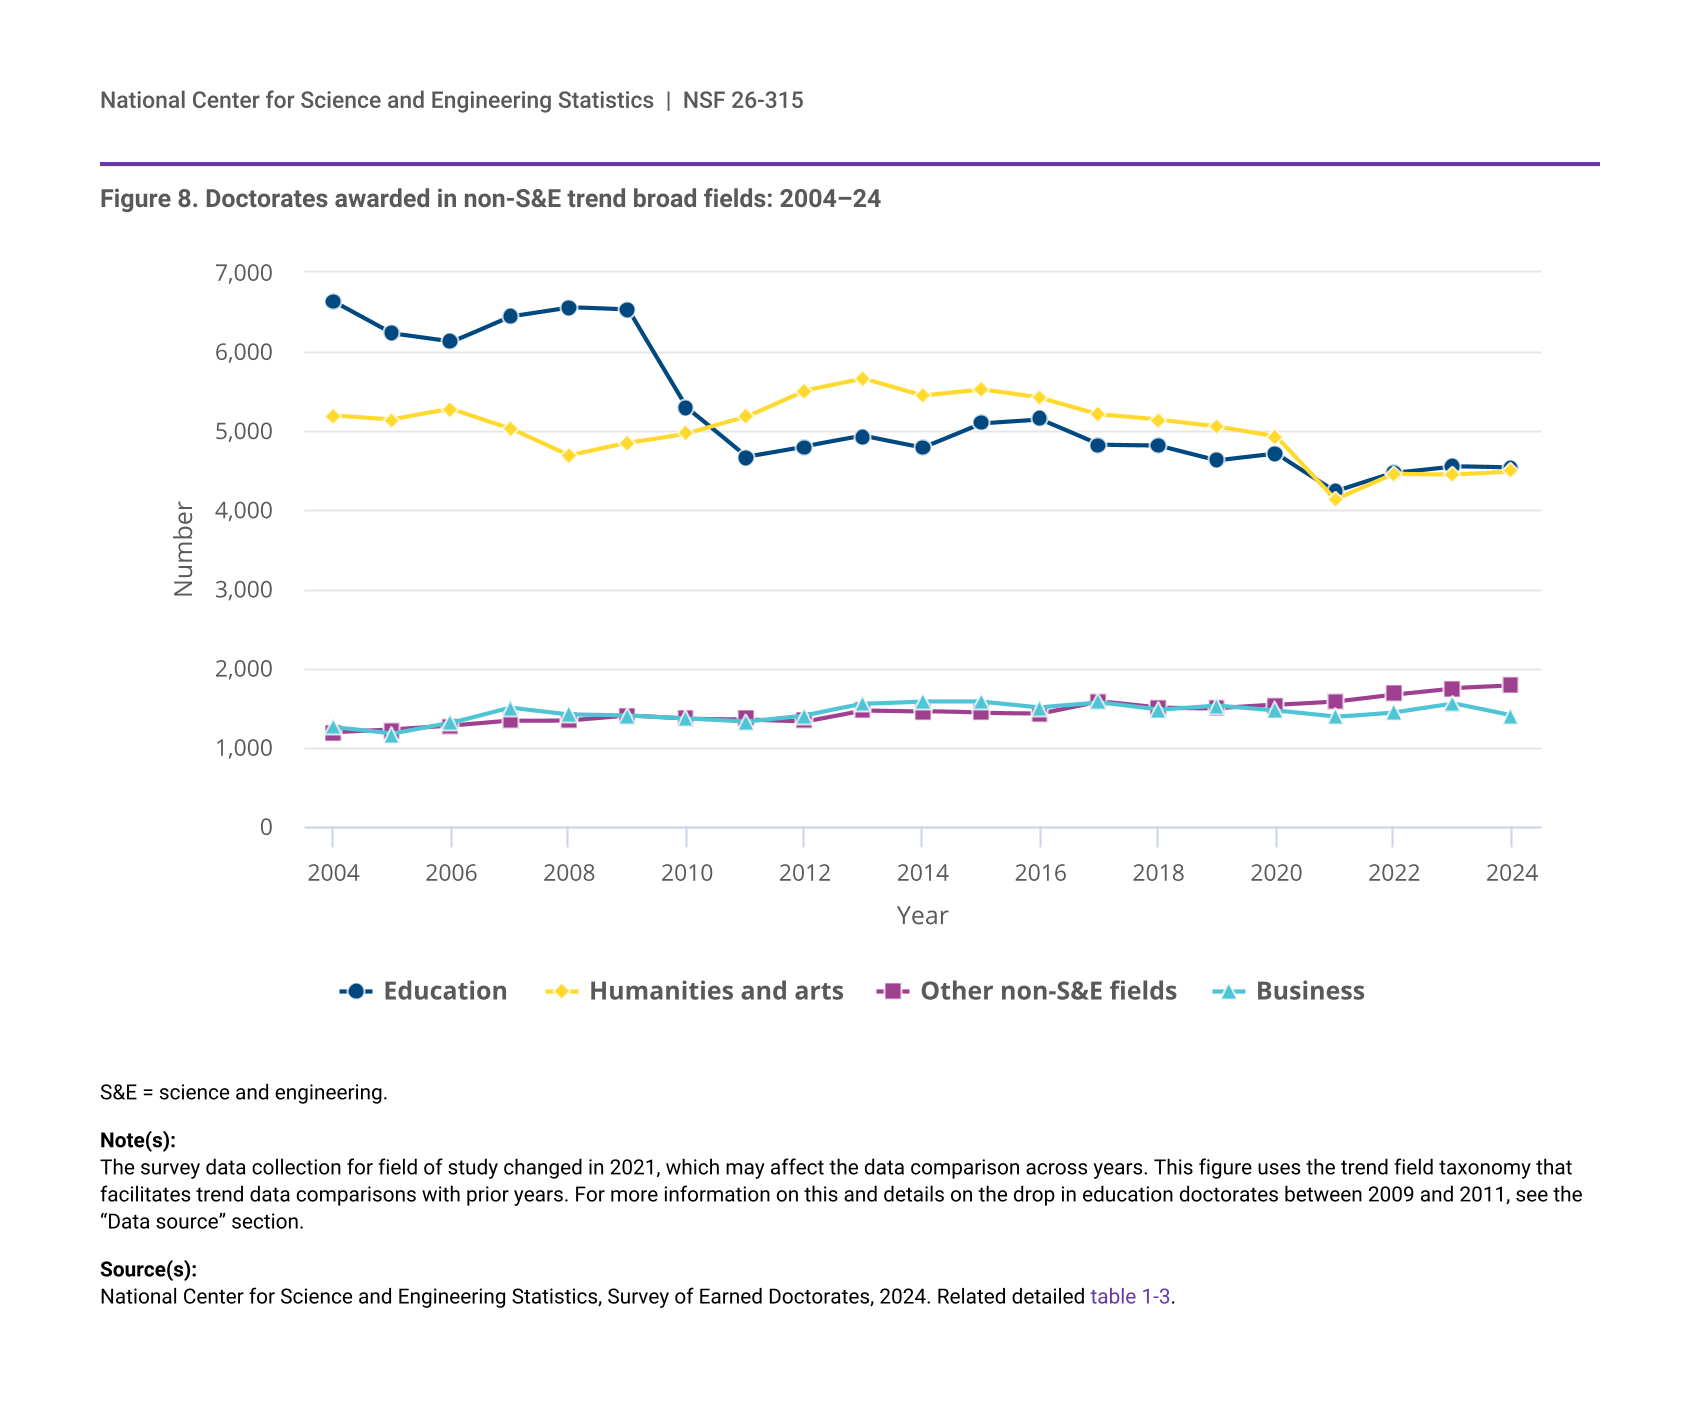
8 Other non-S&E fields include fields such as communications and journalism, public administration and social services, and multidisciplinary/interdisciplinary studies. Some of the overall increase in the other non-S&E fields category after 2021 may be due to the changes in the SED taxonomy in 2021 (see “Data source” section for details).
9 The drop in the number of doctorate recipients in the field of education between 2009 and 2011 is at least partly attributable to the reclassification of Doctor of Education (EdD) programs. For details, see “Time series data changes” in the “Data source” section.
10 The data in this section are based on the trend broad fields, that is, the set of broad fields used for trend data across all years that offer data that are generally comparable across years. However, the increase in the number of doctorate recipients in non-S&E fields between 2021 and 2024 can also be observed when comparing the data on non-S&E fields using the SED-CIP taxonomy implemented since the 2021 SED.
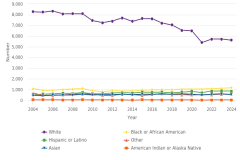
11 For additional data by citizenship status of doctorate recipients, see SED 2024 related detailed table 1-6.
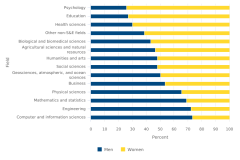
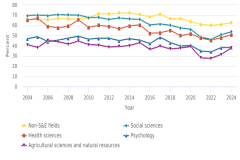
12 In non-S&E fields, the proportion of temporary visa holders increased the most in business, from 42% in 2004 to 50% in 2024. See detailed table 1-6.
13 For additional details by field, see SED 2024 related detailed table 1-11.
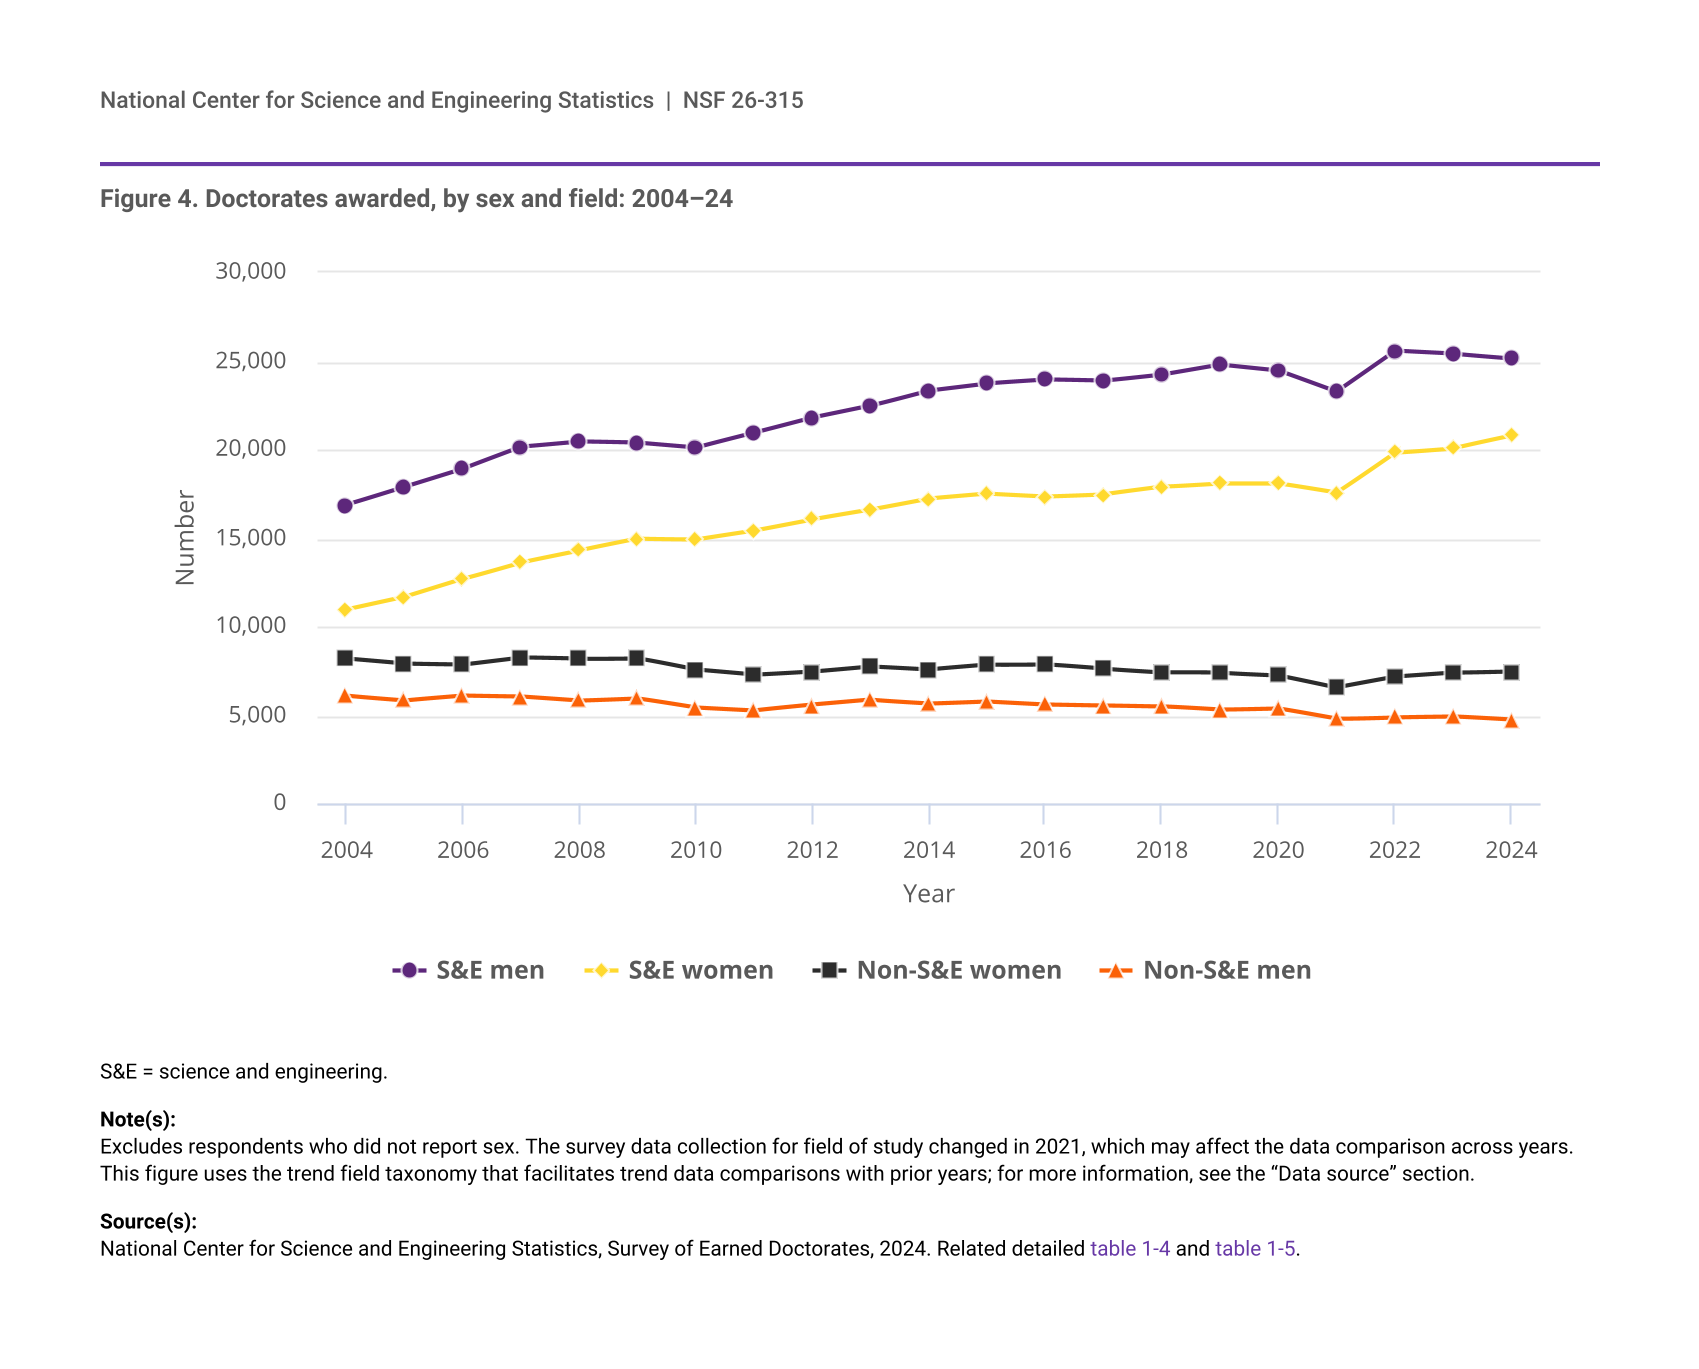
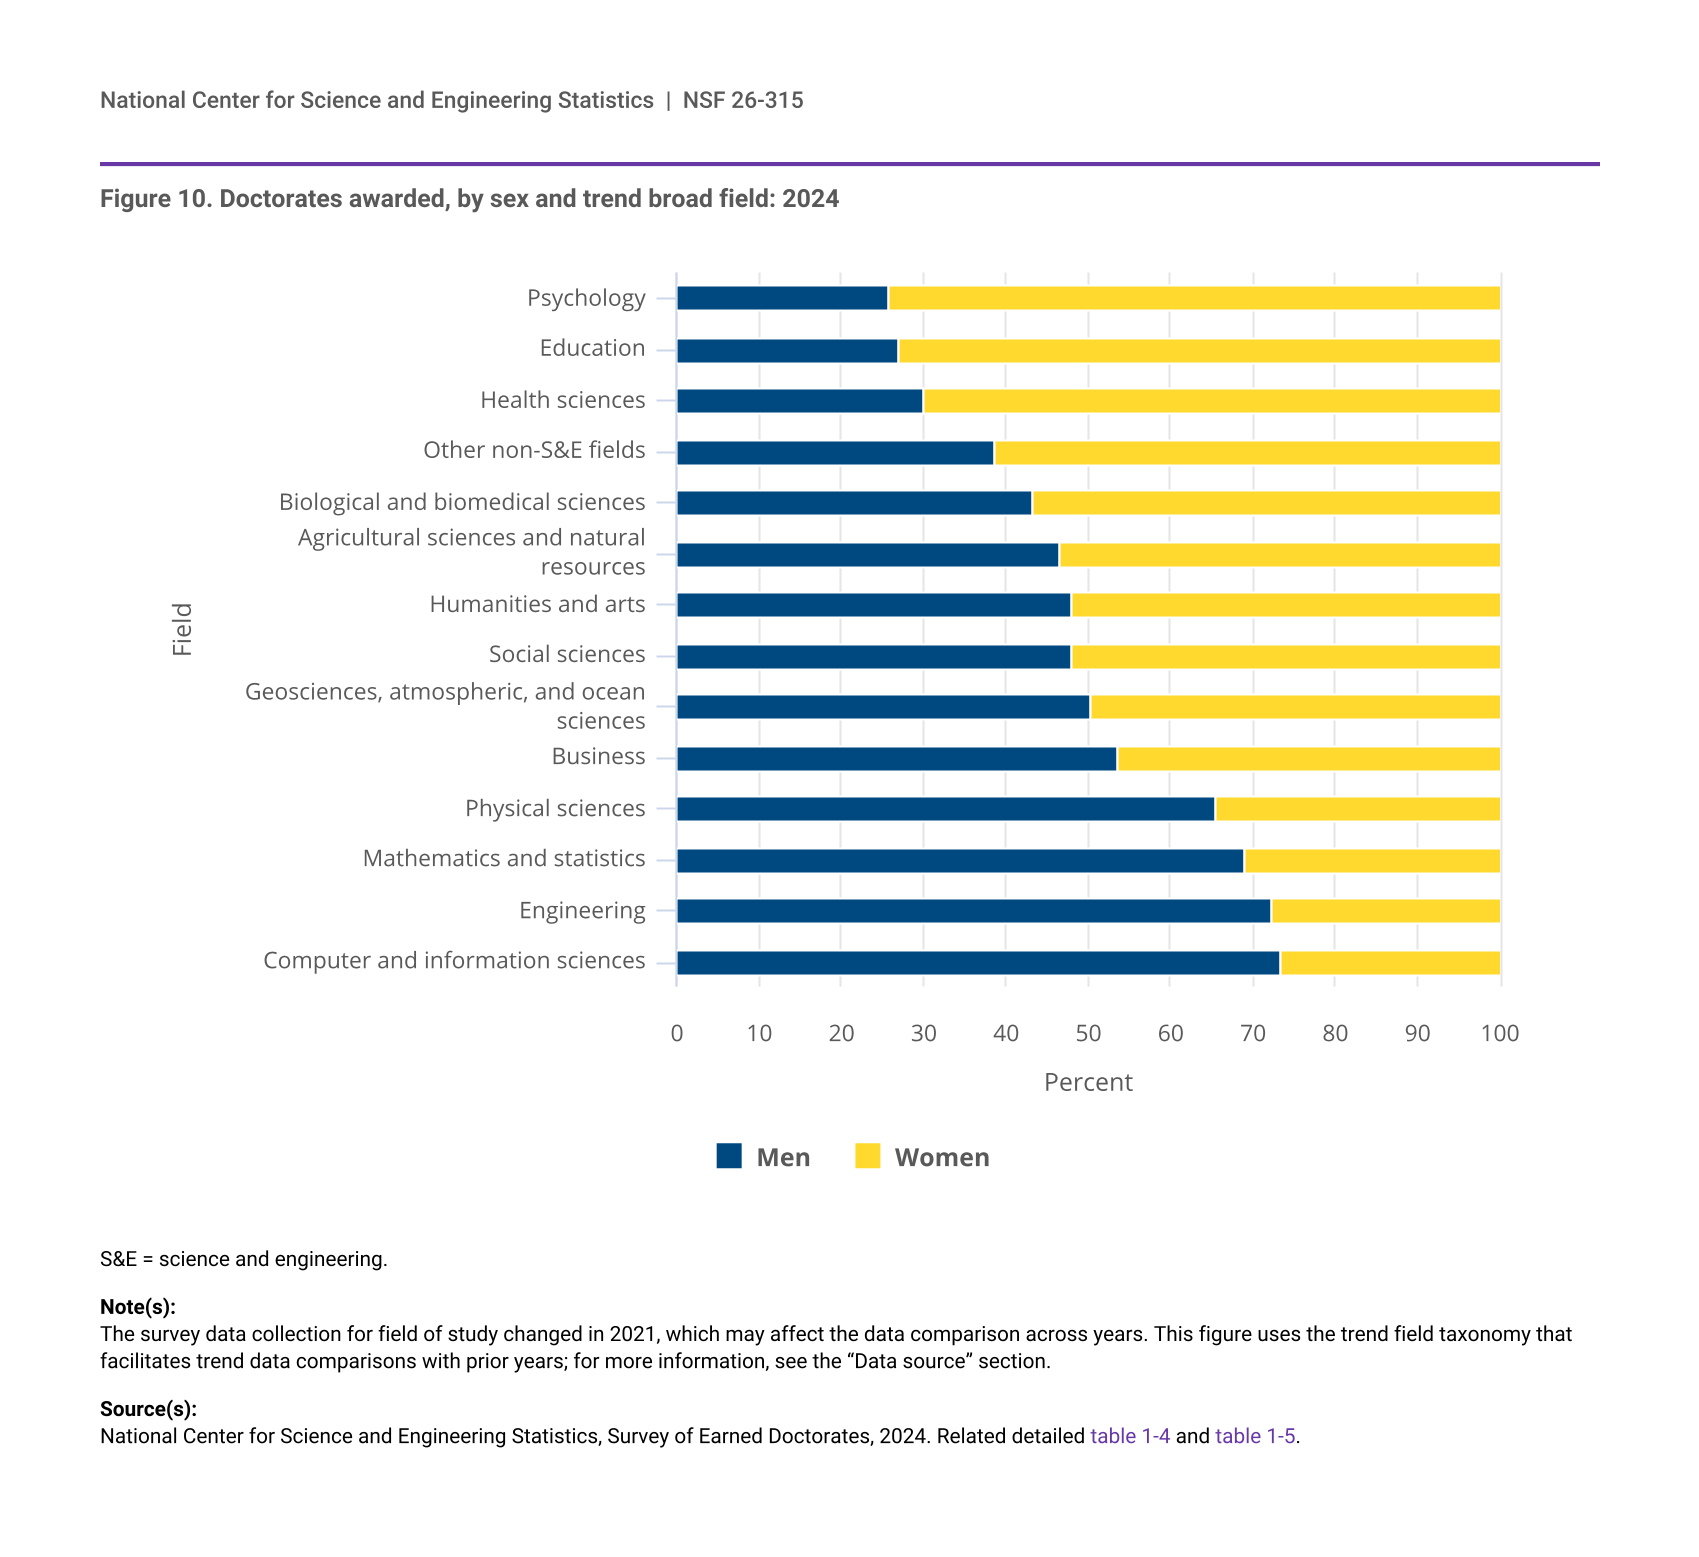
14 For additional data on the fields of education, humanities and arts, and other non-S&E fields, see SED 2024 related detailed table 1-4.
15 For time trend data on the number of doctorate recipients by field and sex, see SED 2024 related detailed table 1-4.
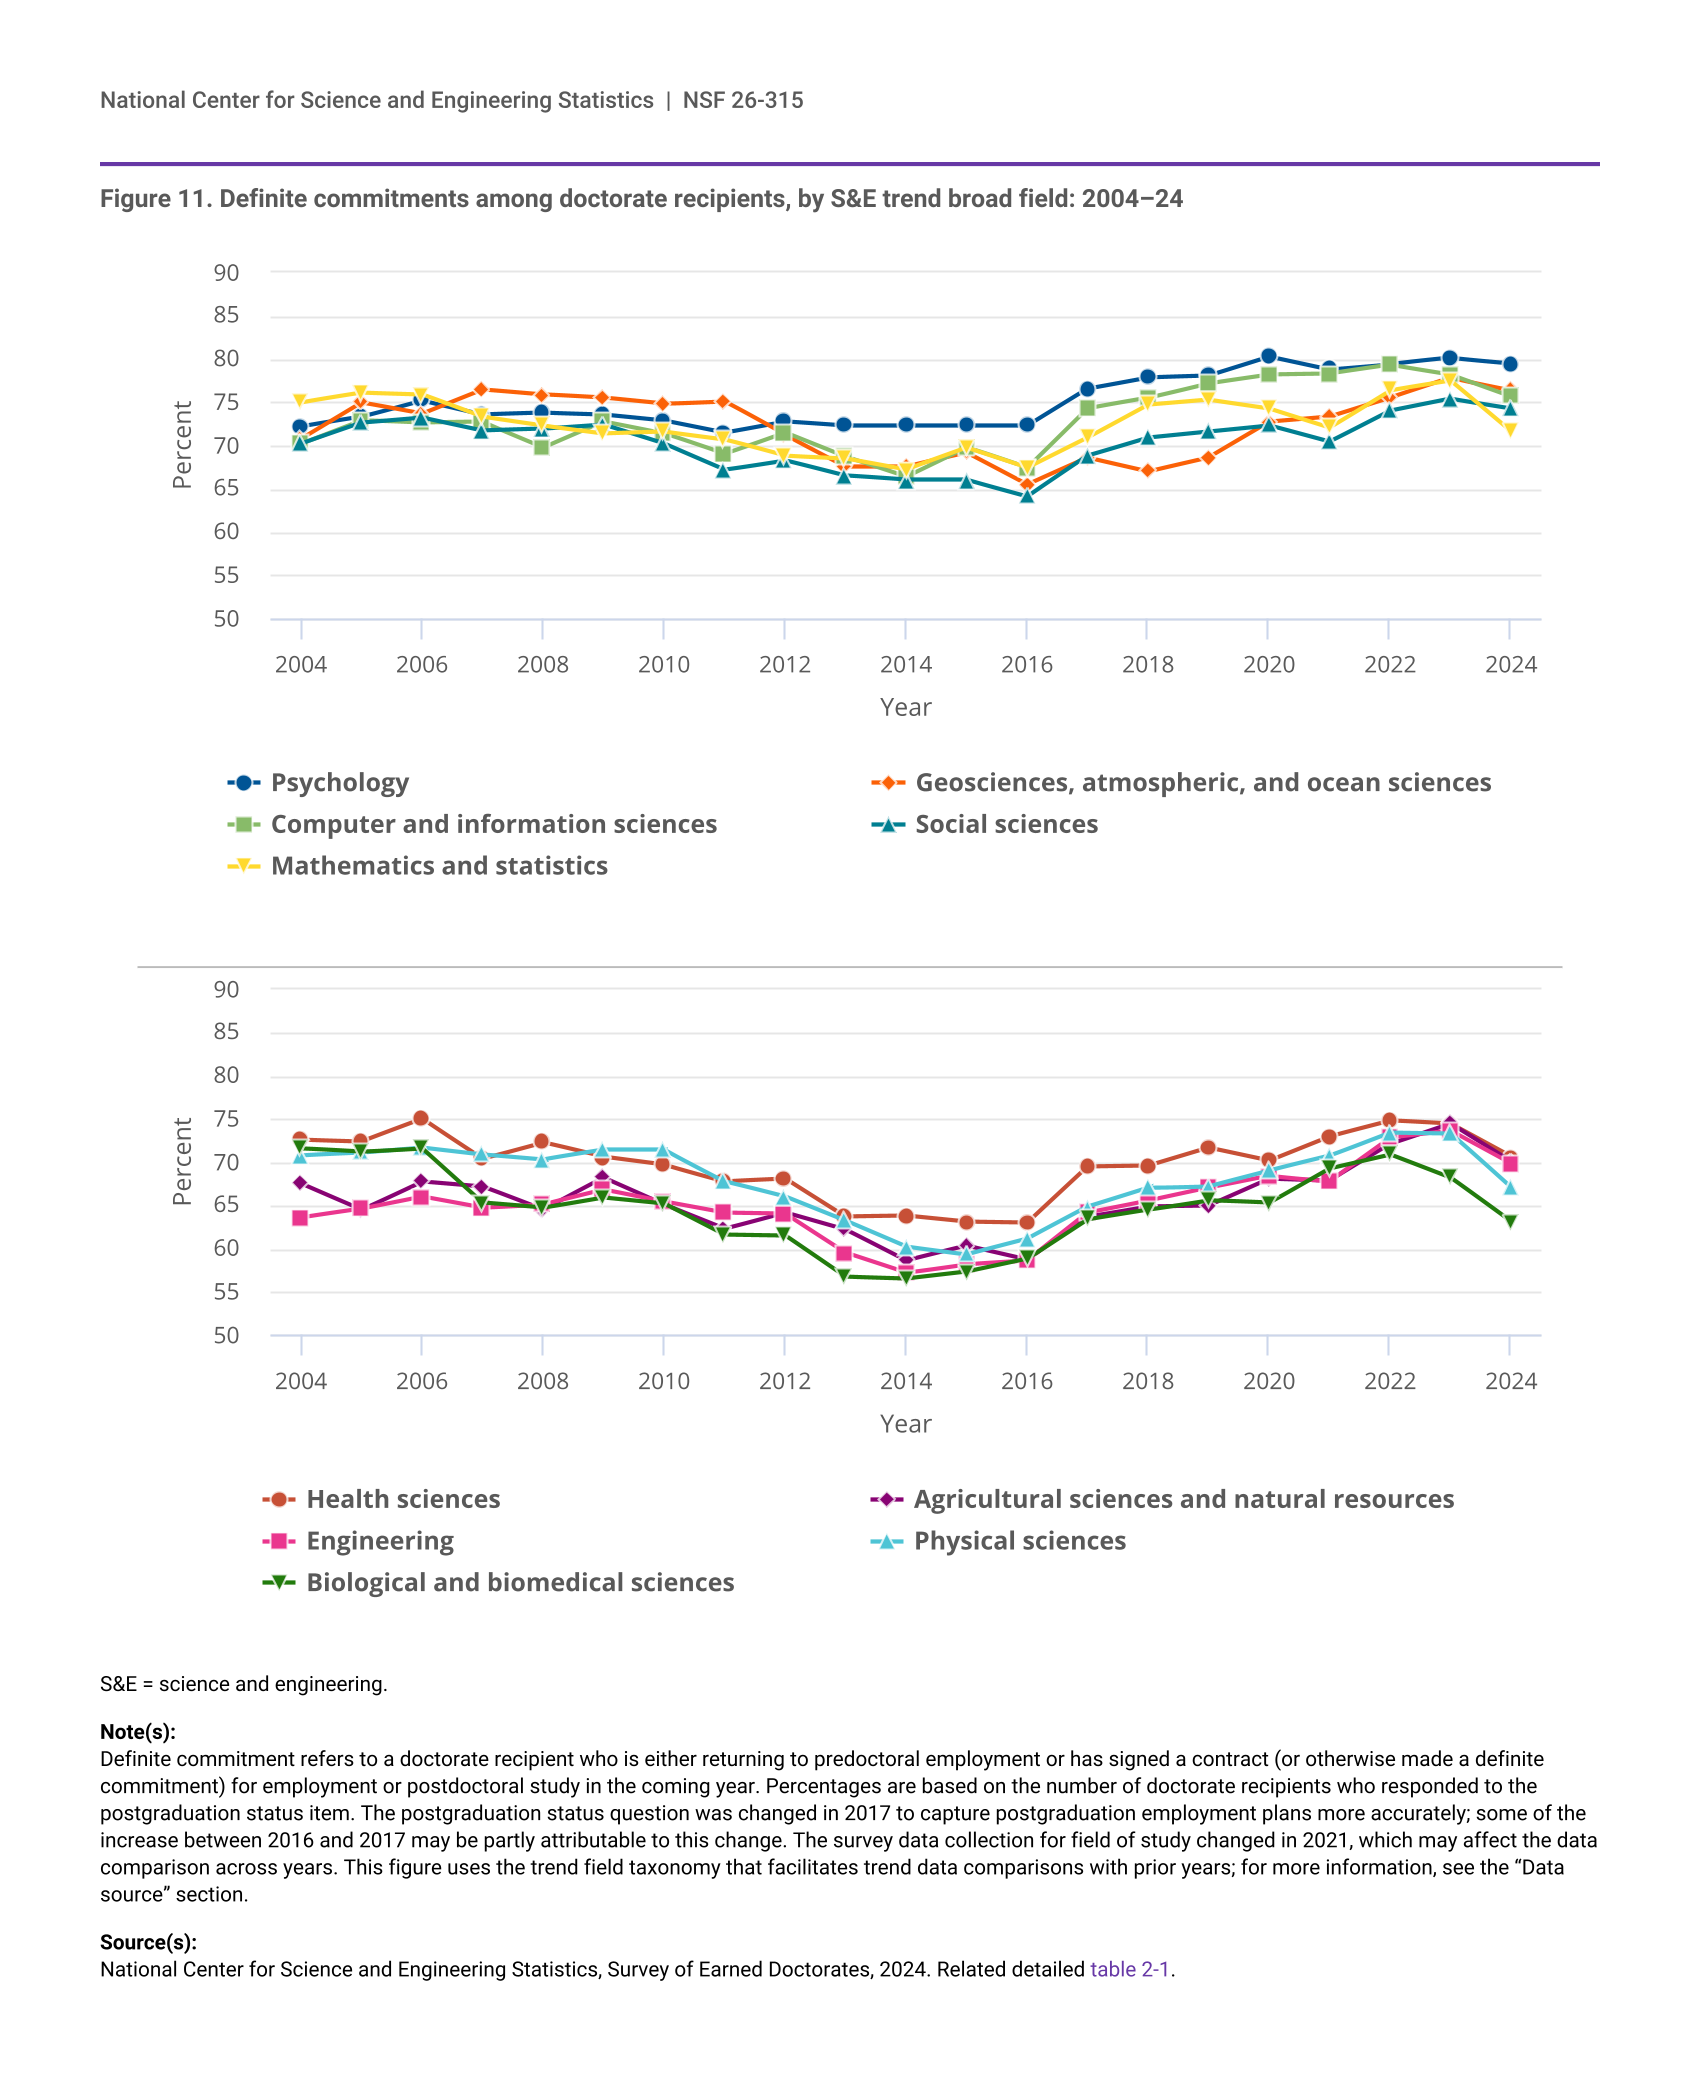
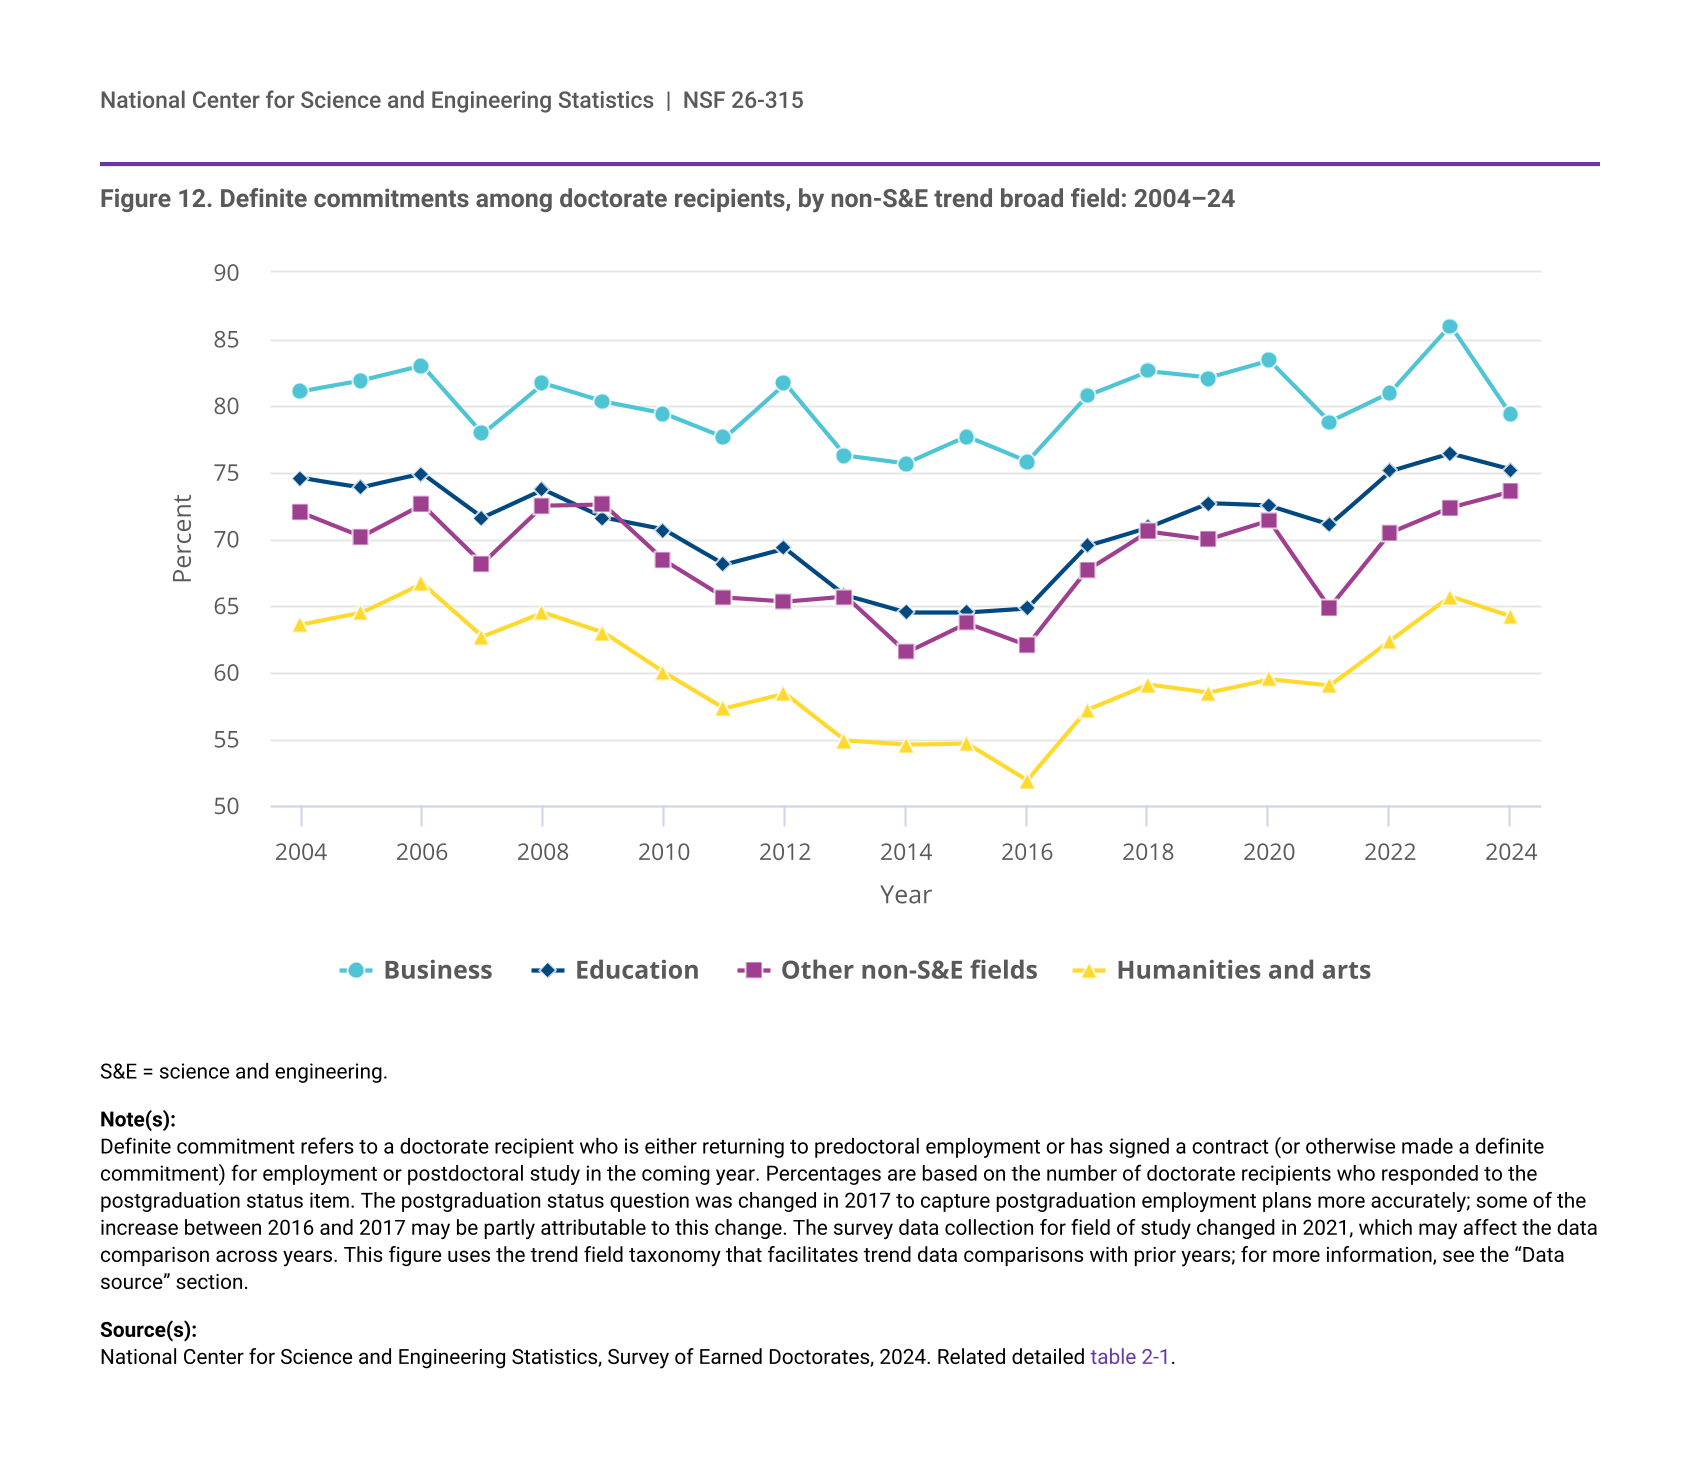
16 For data on doctorate recipients with definite postgraduation commitments for employment or postdoctoral training, see SED 2024 related detailed table 2-1.
17 See SED 2024 related detailed table 2-1.
18 See SED 2024 related detailed table 2-1.
19 Special tabulation from the 2024 Survey of Earned Doctorates. In 2024, 33,765 of the 58,131 doctorate recipients had definite employment or postdoctoral training commitments in the United States; 15,182 of those reporting their postgraduation location as the United States either did not have definite commitments or did not report their status. Of the 33,765 who reported definite employment or postdoctoral training, 20,469 (61%) had definite commitments in employment, and 13,296 (39%) in postdoc positions. See SED 2024 related detailed table 2-6.
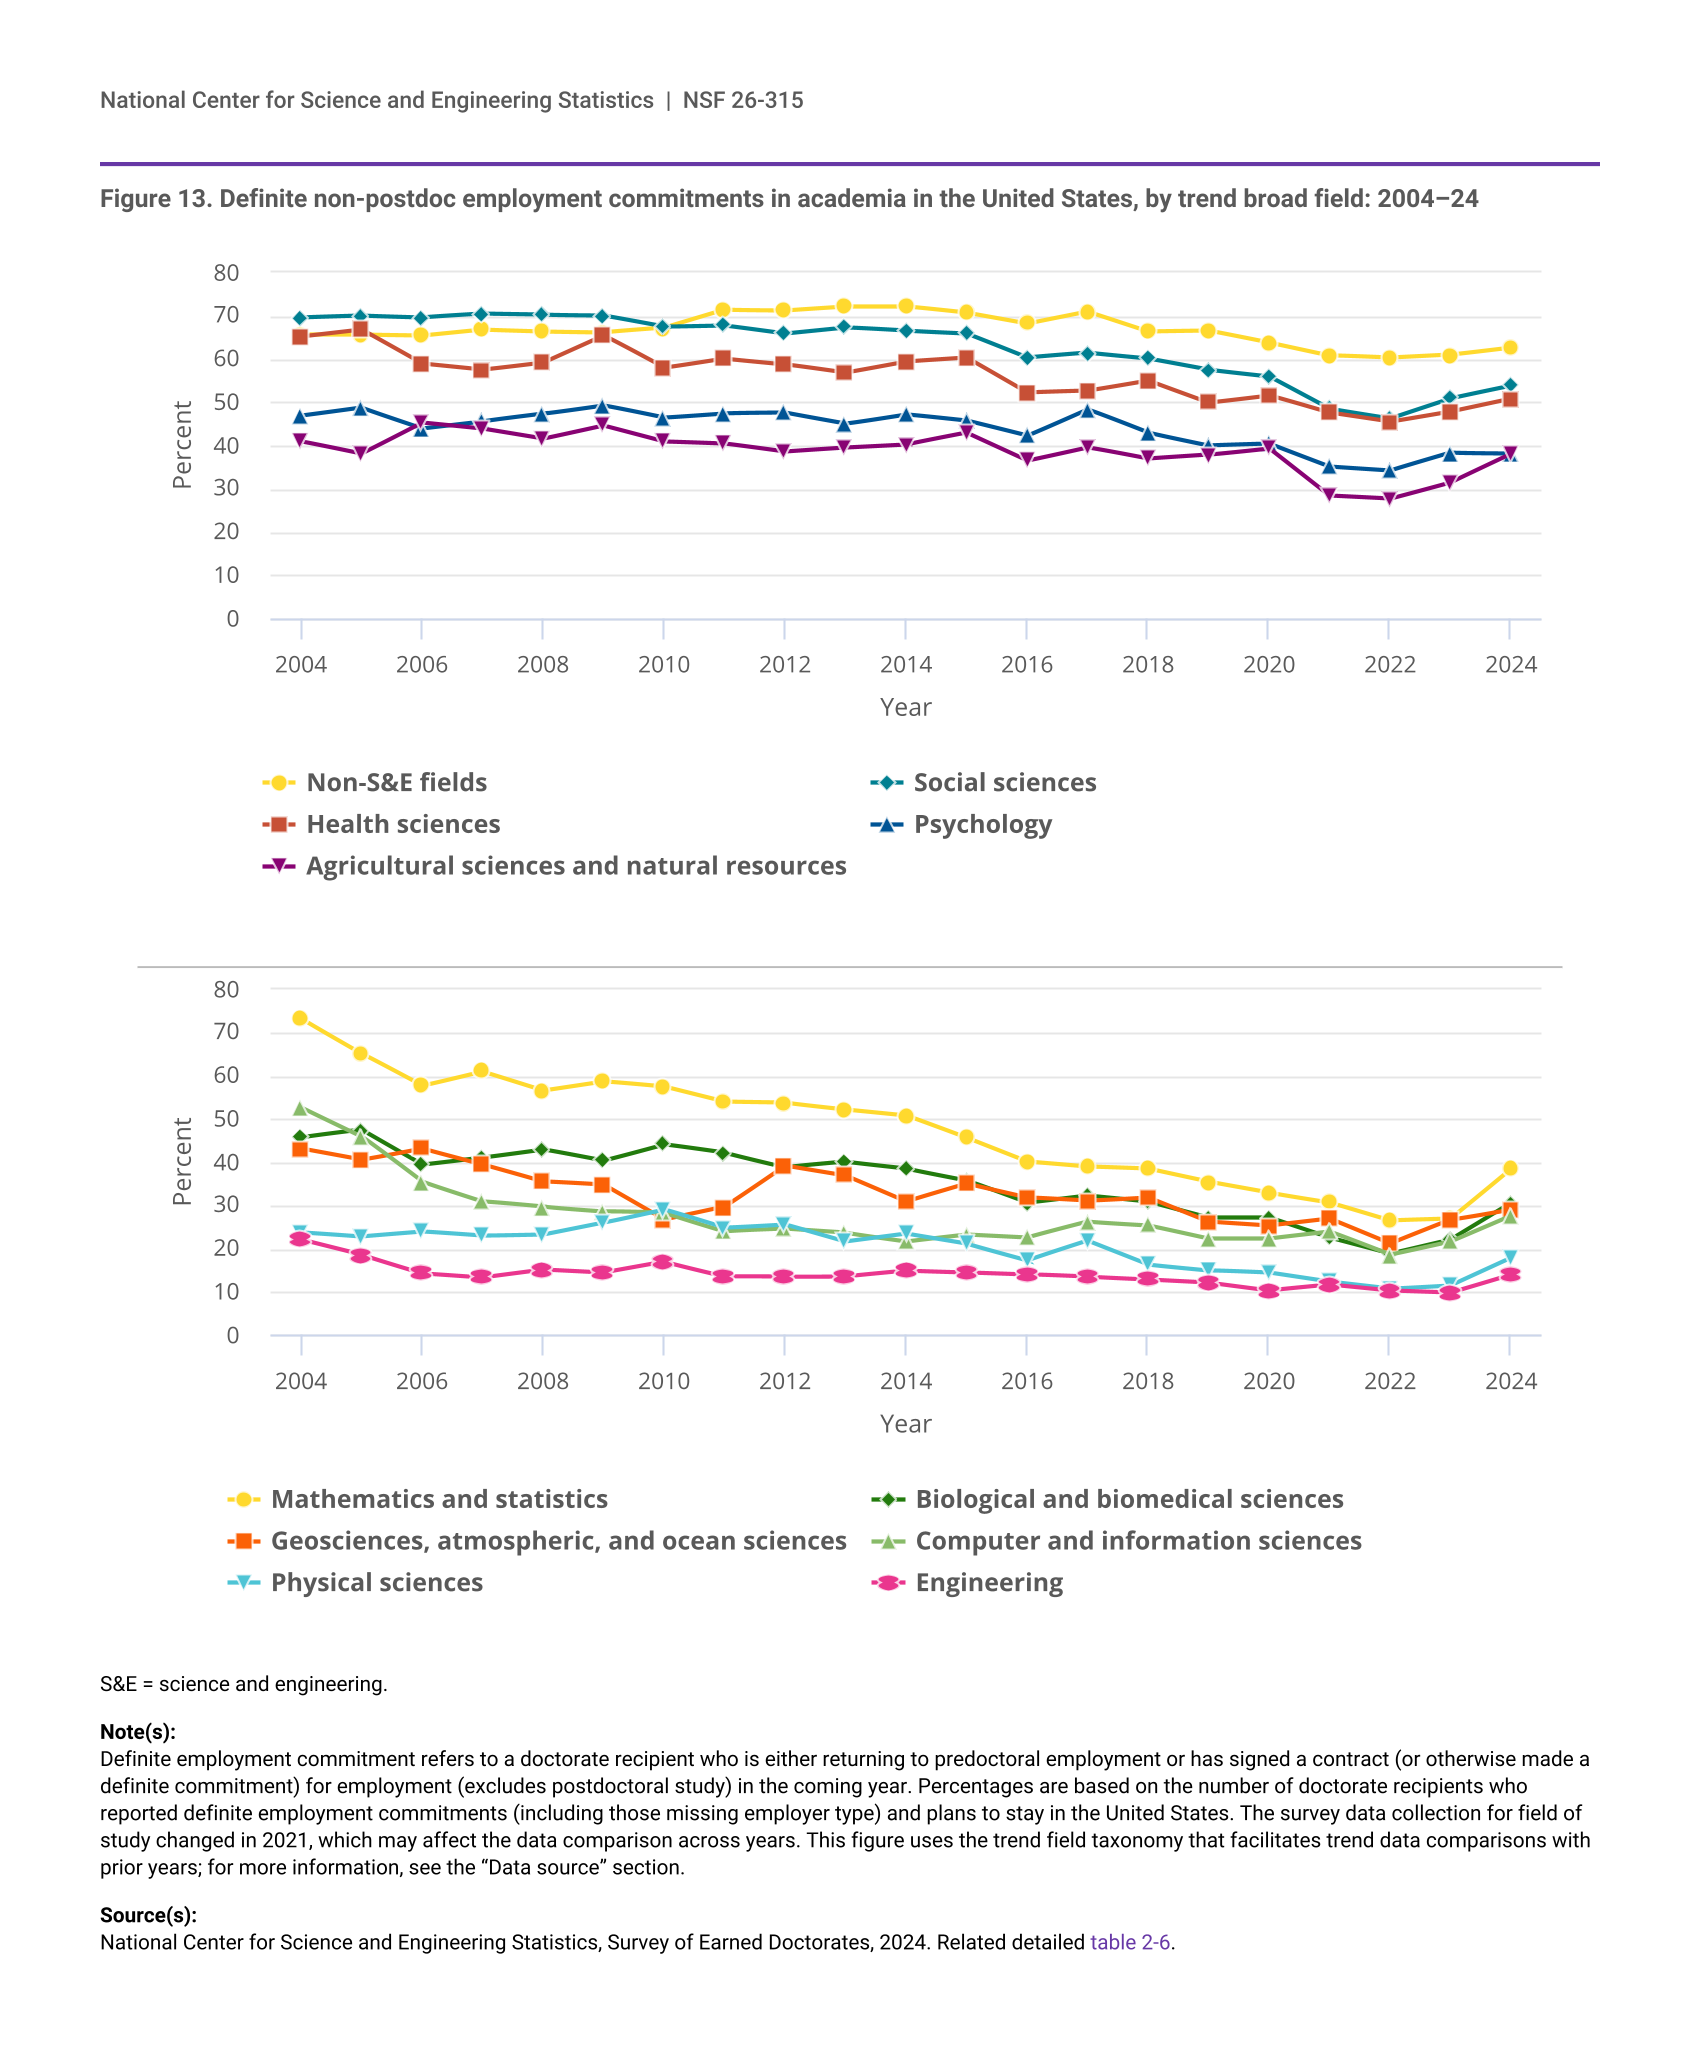
20 For data on doctorate recipients with definite postgraduation employment commitments in academia, see SED 2024 related detailed table 2-6. Academia includes 4-year colleges or universities; medical schools; university-affiliated research institutes; community or 2-year colleges; and foreign educational institutions.
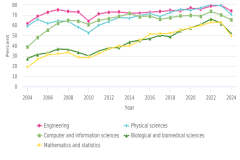
21 In 2004, 256 of 350 doctorate recipients in mathematics and statistics had non-postdoc academic employment commitments, compared to 260 out of 675 doctorate recipients in 2024. In 2004, 206 out of 391 doctorate recipients in computer and information sciences had non-postdoc academic employment commitments, compared to 378 out of 1,372 doctorate recipients in 2024. These counts are the underlying numbers used to calculate the percentages in related detailed table 2-6.
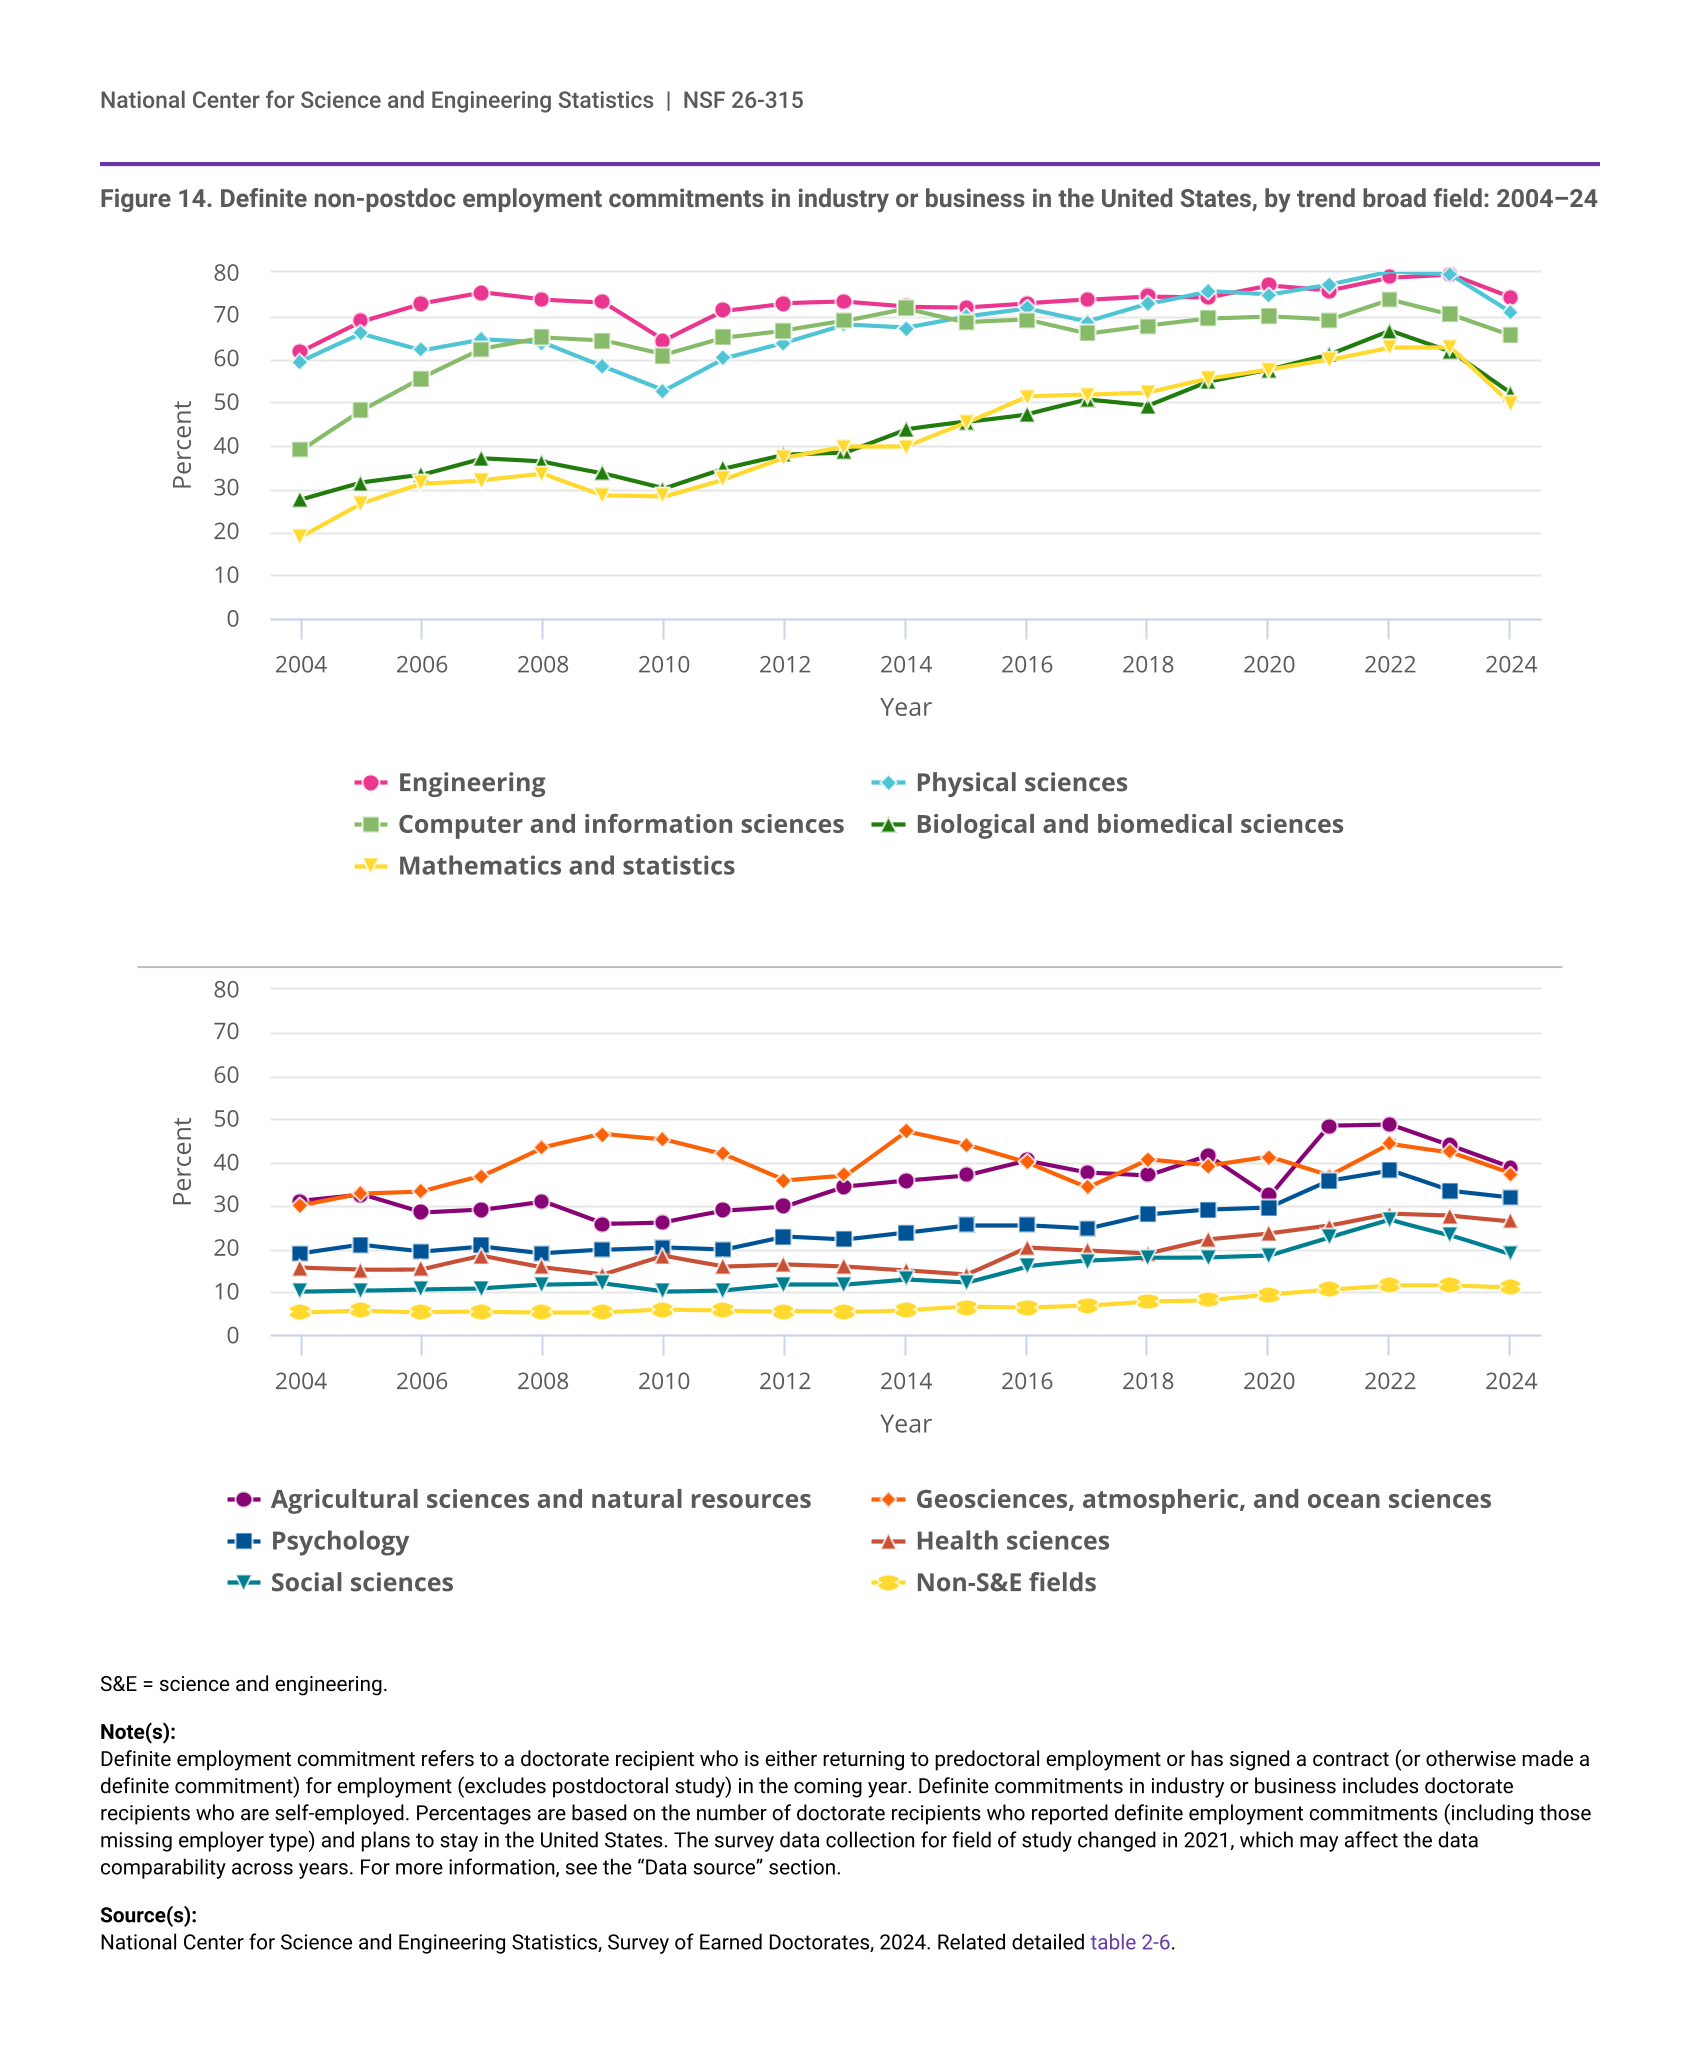
22 For data on doctorate recipients with definite postgraduation employment commitments in industry or business, see related detailed table 2-6.
23 For a discussion on recent trends in employment commitment, see NCSES. 2023. Research Doctorate Conferrals Rebound, Leading to Record Number of U.S. Doctorate Recipients in 2022. NSF 23-353. Alexandria, VA: U.S. National Science Foundation. Available at https://ncses.nsf.gov/pubs/nsf23353.
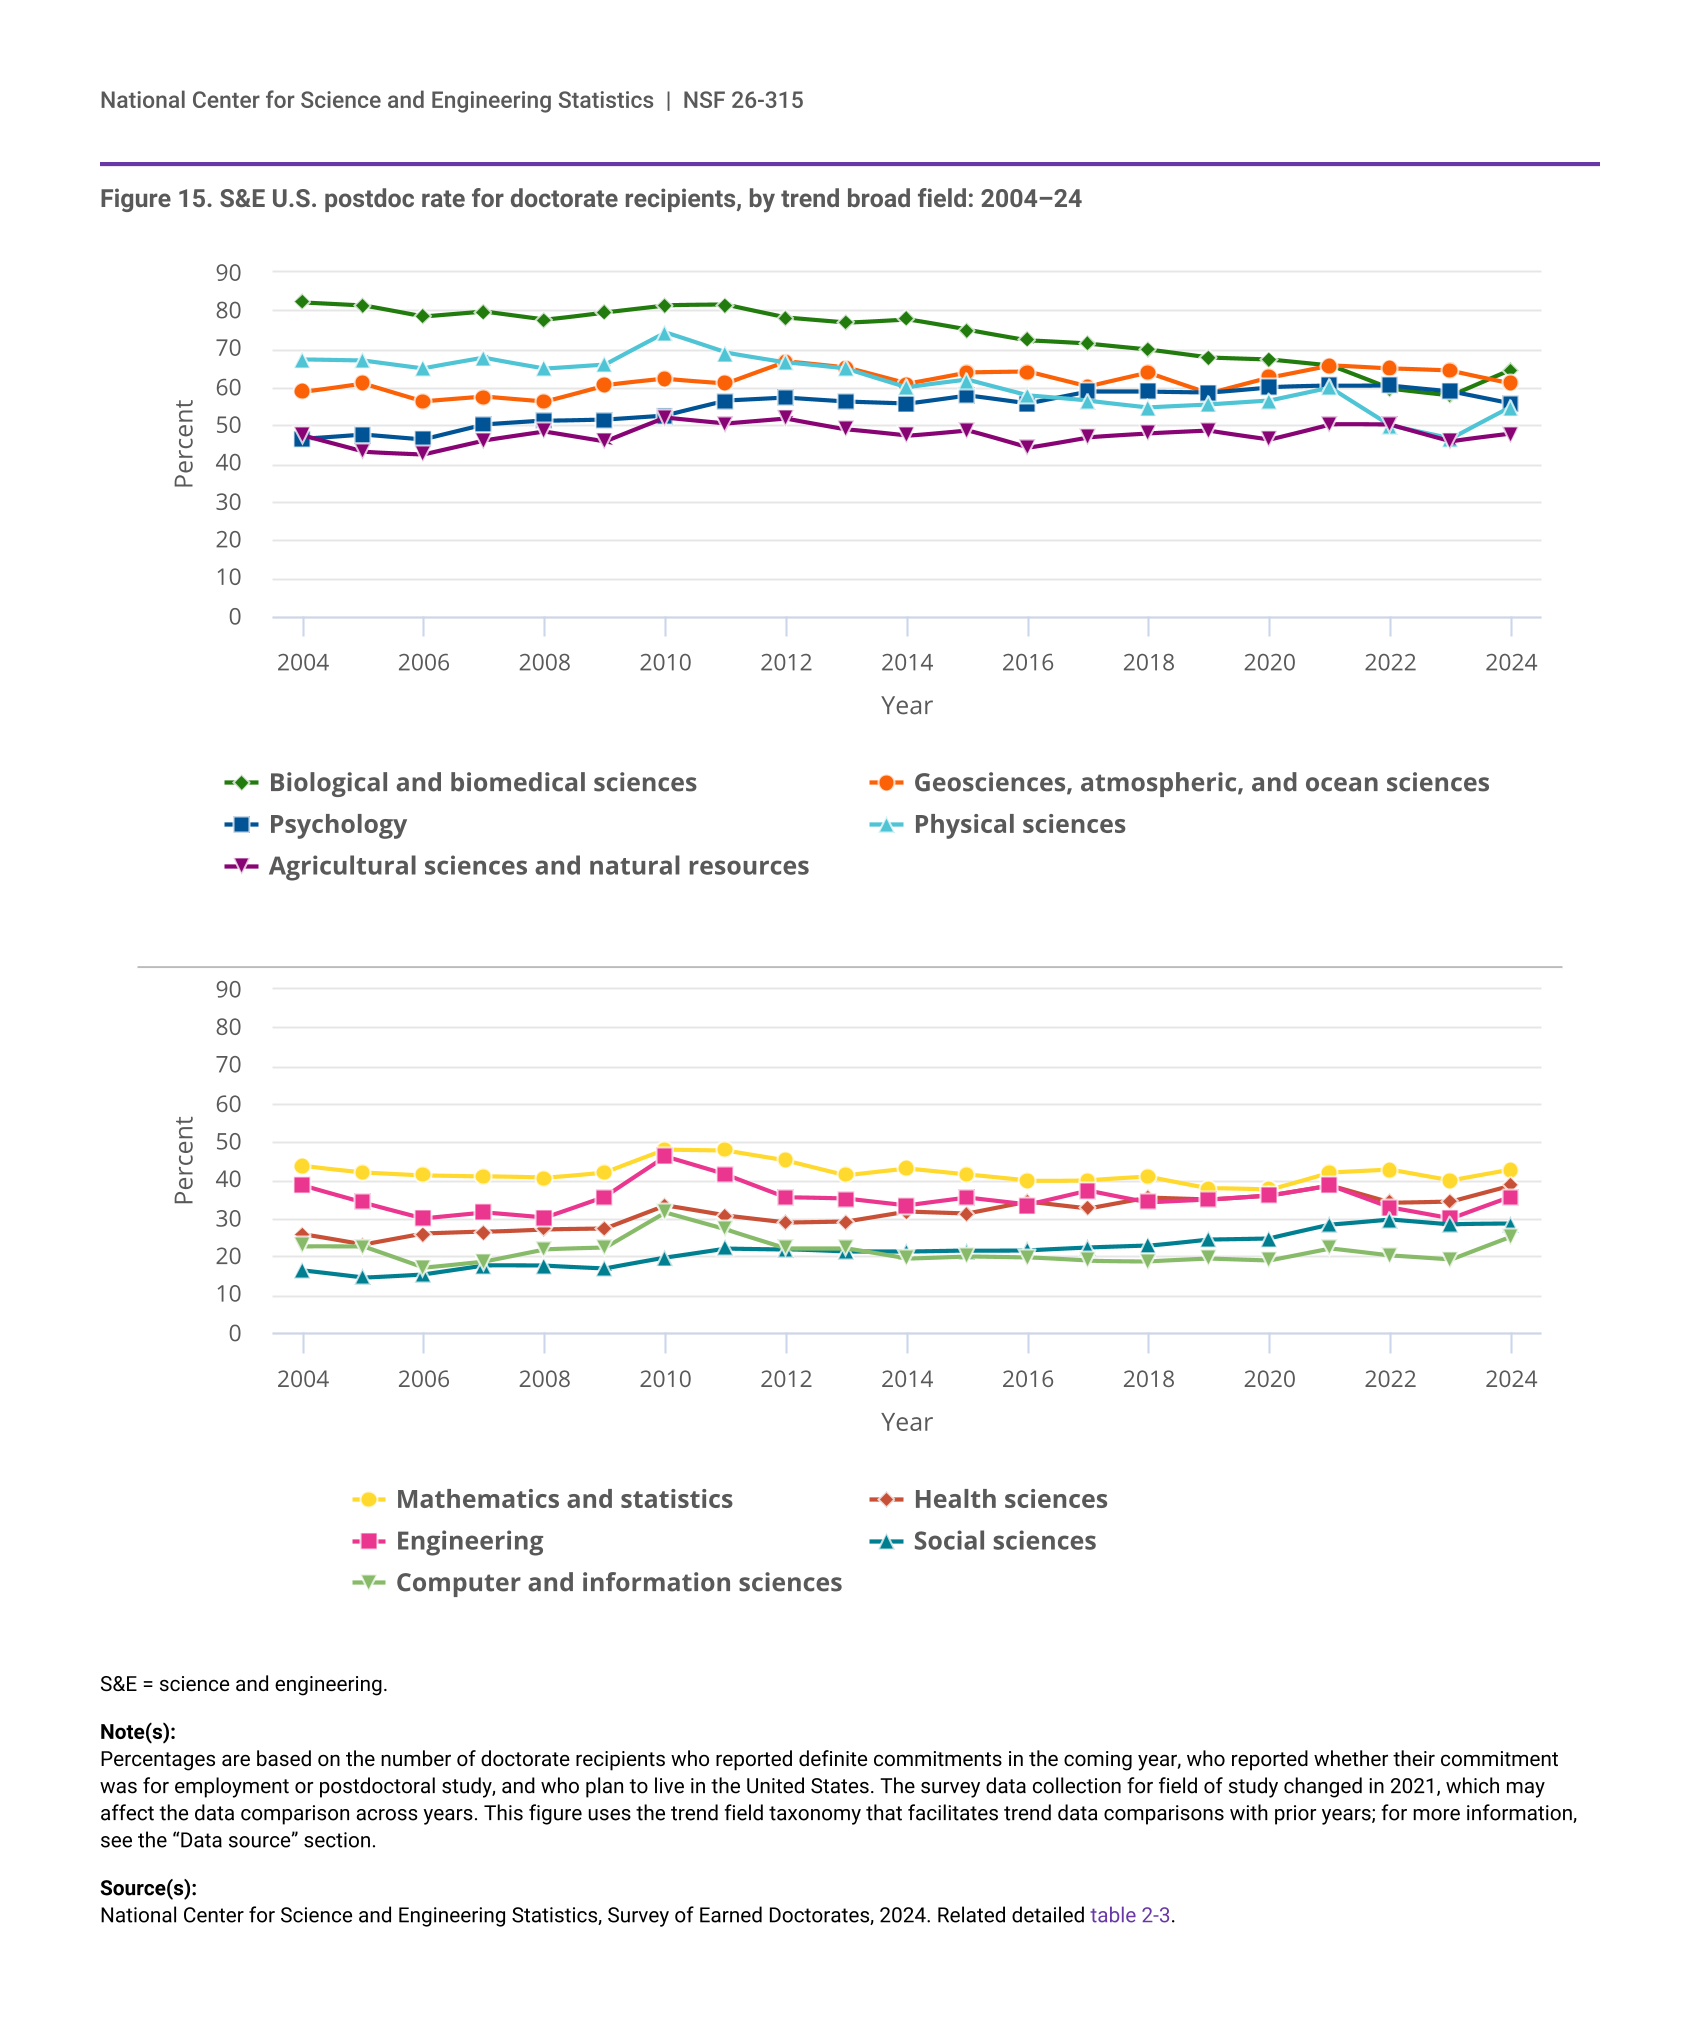
24 Postdoc commitments or postdoc rates are the percentage of doctorate recipients with commitments to postdoc or other training positions in any sector. Employment rates in academia and industry or business are based on the number of doctorate recipients with commitments to non-postdoc employment. As a result, commitments in postdoc, academia, and industry positions do not sum to 100.
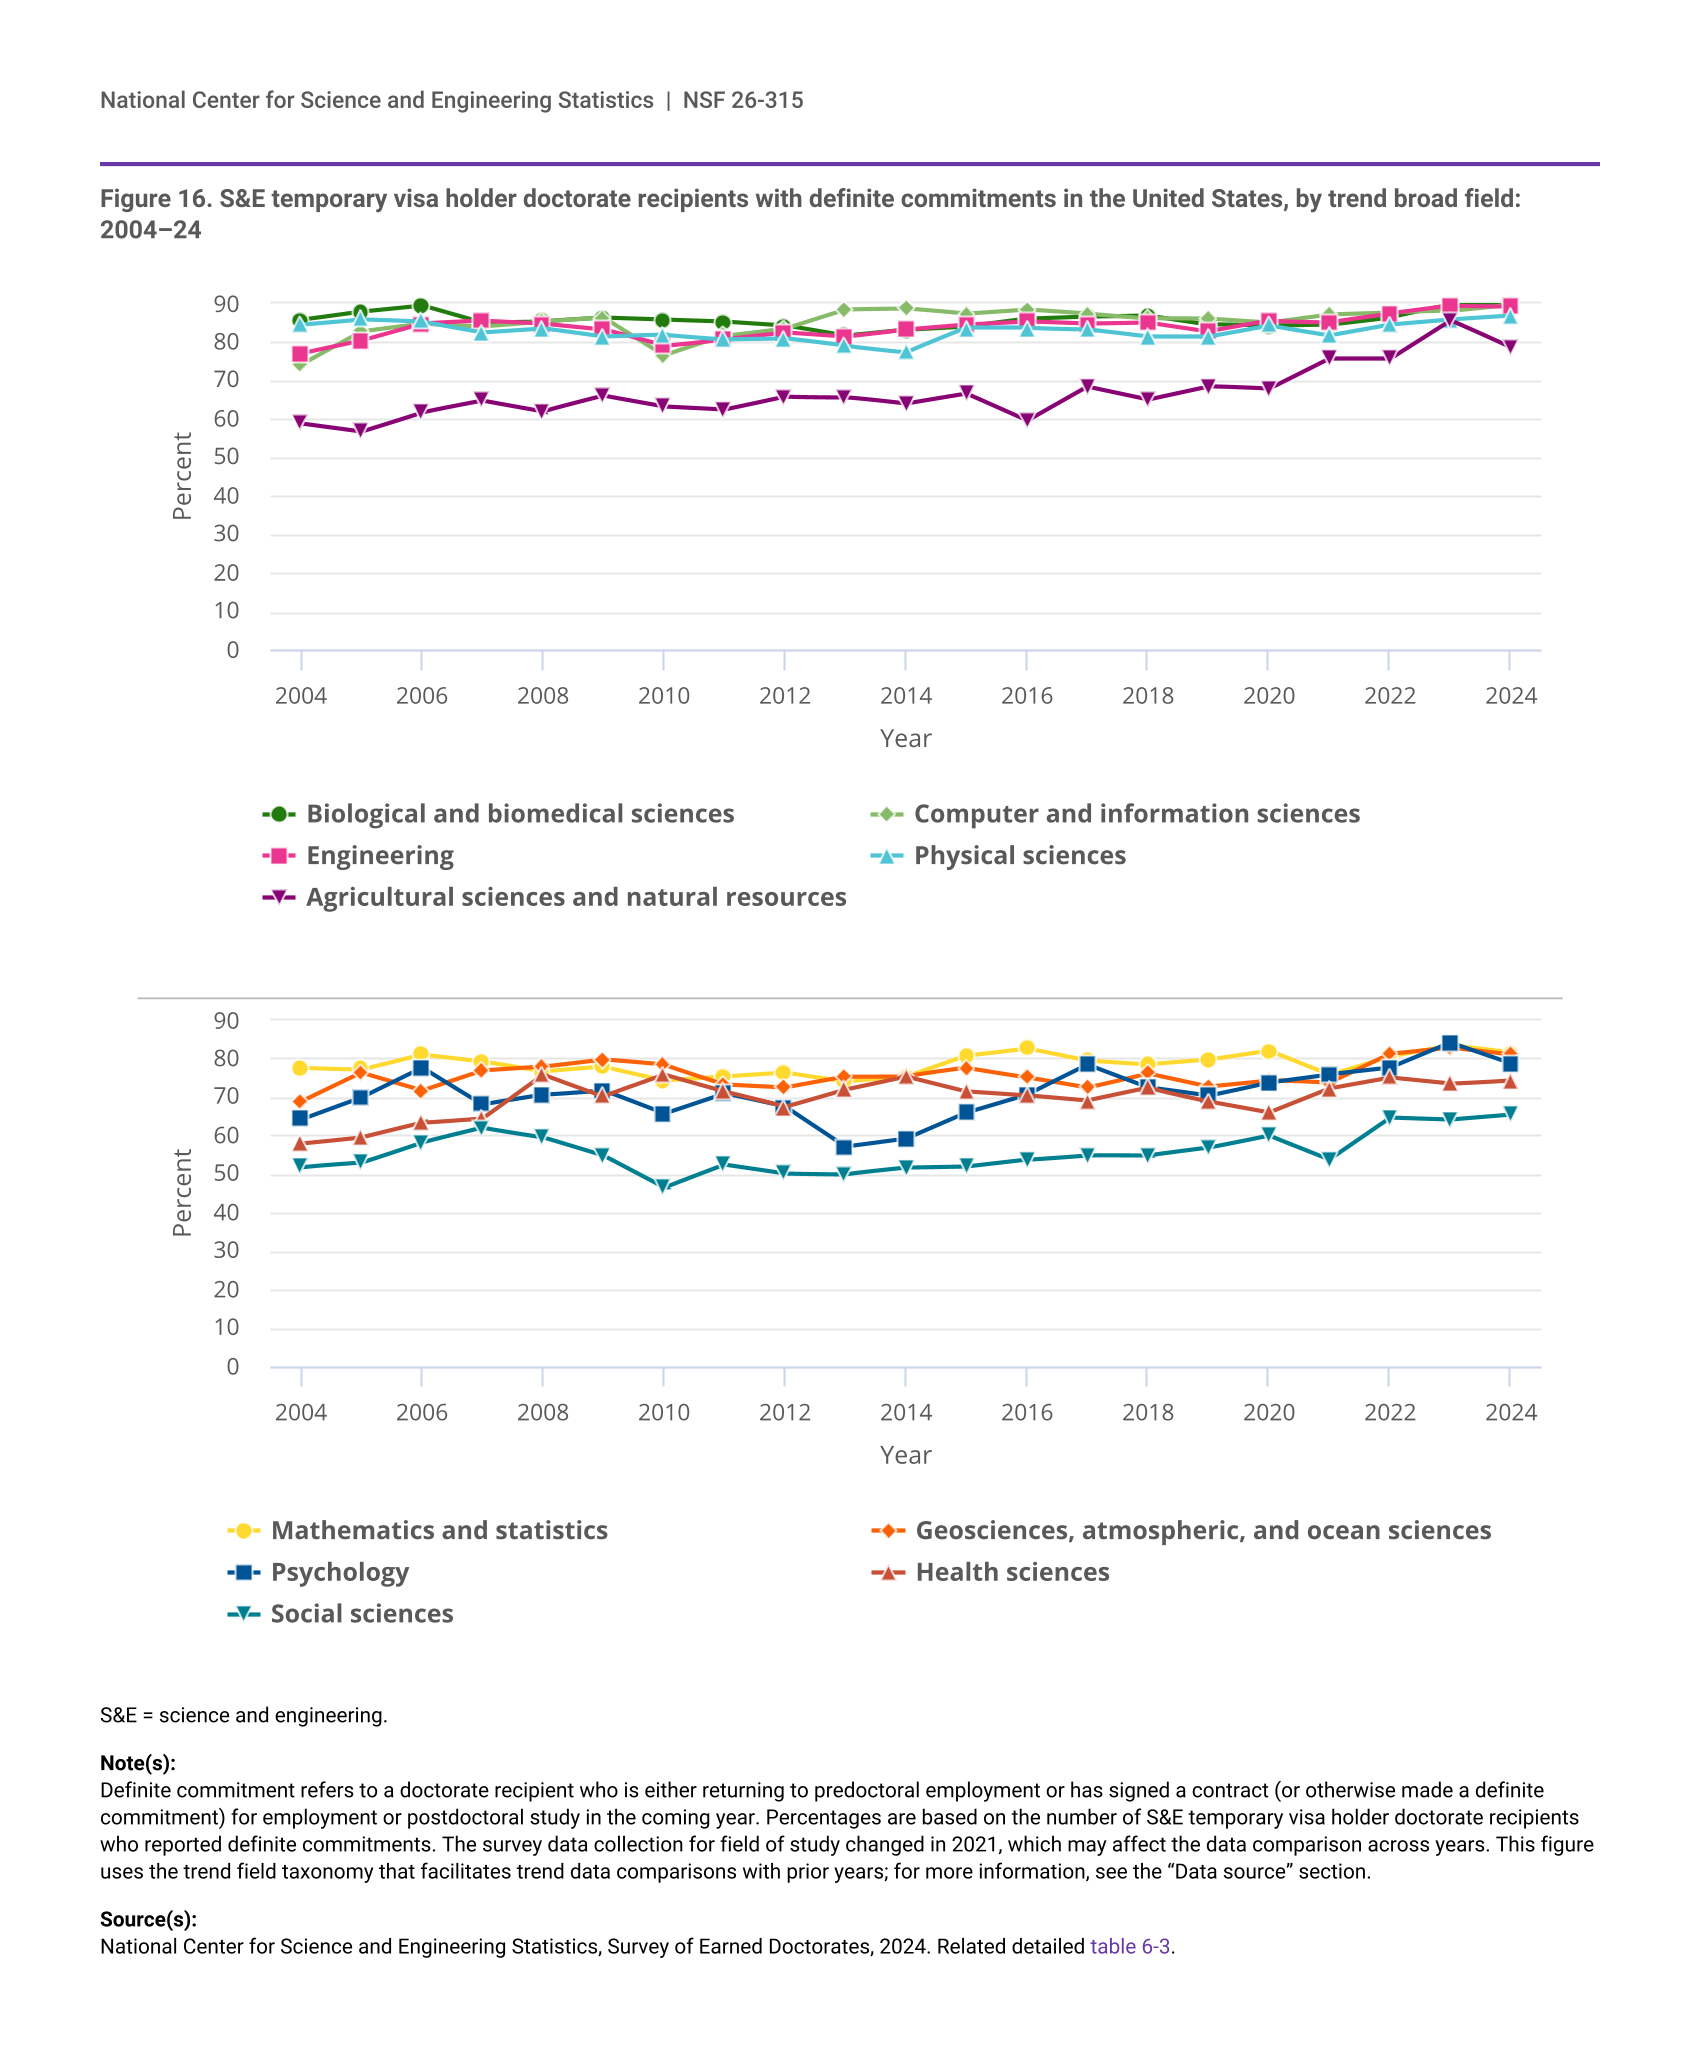
25 Special tabulation from the 2024 SED. In 2004, 4,354 of the 5,840 S&E temporary visa holder doctorate recipients reported that the location of their postdoc or employment position was in the United States. In 2024, 9,681 of the 11,438 S&E doctorate recipients did.