 An official website of the United States government
Report
Field of doctorate
As researchers expand their understanding of the world, new fields of study emerge, and existing fields change. Observing which fields are attracting students can provide early insight into where future research breakthroughs may occur.
Field of doctorate trends
S&E fields
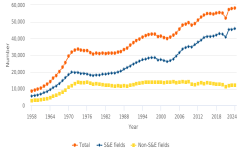
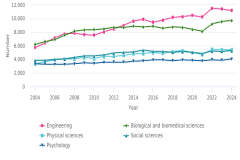
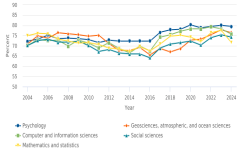
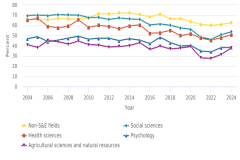
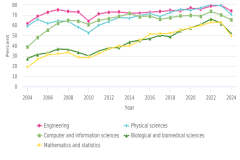
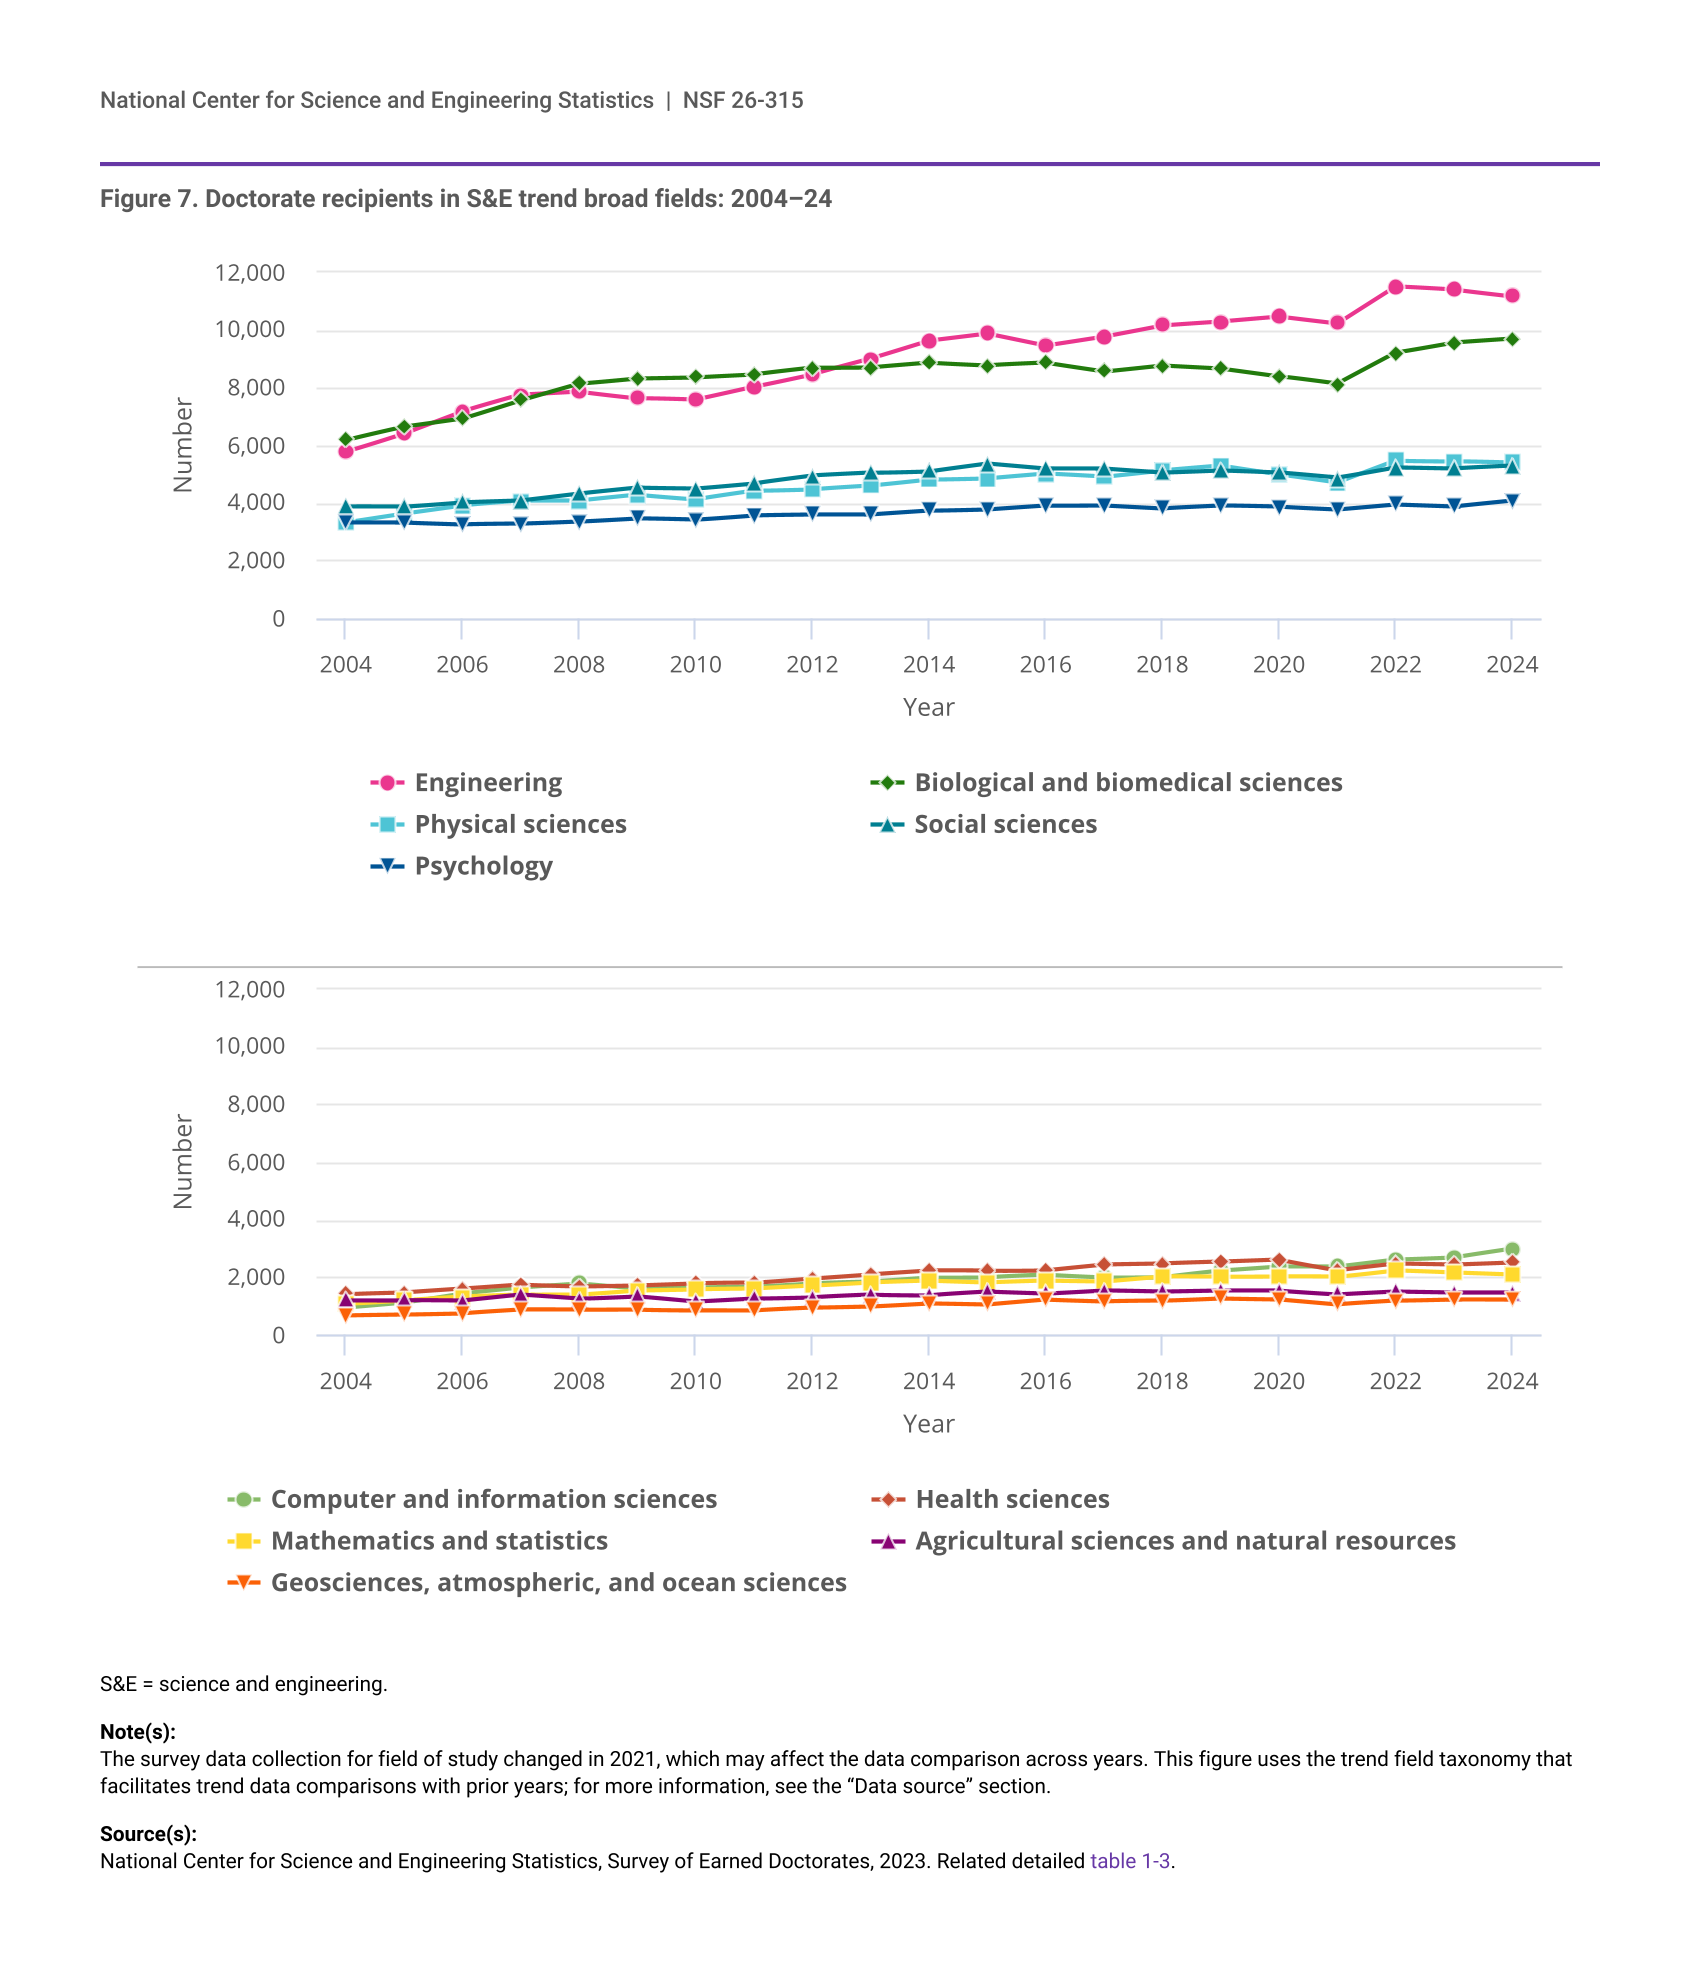
Doctorates in S&E fields are a growing share of all research doctorates awarded. There are 10 trend broad fields (broad field) in S&E (see “Glossary”) and, over the past 20 years, the number of doctorate recipients has increased in each of them (figure 7). However, doctorates in psychology, social sciences, and agricultural sciences and natural resources have declined slightly as a proportion of all (S&E and non-S&E) doctorates, despite increases in the number awarded in each field. Engineering grew the most in terms of its share of all doctorates awarded, from 14% in 2004 to 19% in 2024, followed by computer and information sciences, which grew from 2% of all doctorates in 2004 to 5% in 2024. Between 2023 and 2024, the number of doctorate recipients grew the most in two S&E fields: computer and information sciences (by 296, or 11%) and psychology (by 200, or 5%). The largest declines between 2023 and 2024 were in engineering (by 229, or 2%) and mathematics and statistics (by 72, or 3%).
| Year | Engineering | Biological and biomedical sciences | Physical sciences | Social sciences | Psychology |
|---|---|---|---|---|---|
| 2004 | 5,776 | 6,185 | 3,337 | 3,879 | 3,327 |
| 2005 | 6,426 | 6,638 | 3,645 | 3,870 | 3,322 |
| 2006 | 7,186 | 6,924 | 3,929 | 4,027 | 3,260 |
| 2007 | 7,749 | 7,568 | 4,081 | 4,084 | 3,276 |
| 2008 | 7,863 | 8,145 | 4,081 | 4,326 | 3,357 |
| 2009 | 7,642 | 8,335 | 4,283 | 4,529 | 3,472 |
| 2010 | 7,578 | 8,370 | 4,133 | 4,508 | 3,420 |
| 2011 | 8,032 | 8,466 | 4,419 | 4,691 | 3,576 |
| 2012 | 8,469 | 8,687 | 4,478 | 4,948 | 3,599 |
| 2013 | 9,000 | 8,707 | 4,595 | 5,041 | 3,592 |
| 2014 | 9,626 | 8,868 | 4,812 | 5,102 | 3,724 |
| 2015 | 9,875 | 8,783 | 4,859 | 5,369 | 3,776 |
| 2016 | 9,459 | 8,863 | 5,024 | 5,193 | 3,910 |
| 2017 | 9,774 | 8,567 | 4,913 | 5,188 | 3,925 |
| 2018 | 10,164 | 8,782 | 5,144 | 5,054 | 3,821 |
| 2019 | 10,298 | 8,678 | 5,306 | 5,134 | 3,909 |
| 2020 | 10,468 | 8,403 | 5,000 | 5,060 | 3,865 |
| 2021 | 10,230 | 8,131 | 4,710 | 4,875 | 3,777 |
| 2022 | 11,516 | 9,206 | 5,467 | 5,236 | 3,952 |
| 2023 | 11,398 | 9,566 | 5,456 | 5,196 | 3,883 |
| 2024 | 11,169 | 9,700 | 5,401 | 5,285 | 4,083 |
| Year | Computer and information sciences | Health sciences | Mathematics and statistics | Agricultural sciences and natural resources | Geosciences, atmospheric, and ocean sciences |
|---|---|---|---|---|---|
| 2004 | 948 | 1,419 | 1,076 | 1,209 | 686 |
| 2005 | 1,129 | 1,465 | 1,205 | 1,207 | 714 |
| 2006 | 1,453 | 1,595 | 1,325 | 1,184 | 757 |
| 2007 | 1,654 | 1,742 | 1,388 | 1,392 | 875 |
| 2008 | 1,787 | 1,689 | 1,400 | 1,252 | 865 |
| 2009 | 1,610 | 1,725 | 1,553 | 1,343 | 877 |
| 2010 | 1,633 | 1,792 | 1,590 | 1,157 | 862 |
| 2011 | 1,667 | 1,803 | 1,606 | 1,266 | 852 |
| 2012 | 1,793 | 1,963 | 1,703 | 1,314 | 941 |
| 2013 | 1,843 | 2,109 | 1,817 | 1,391 | 989 |
| 2014 | 1,988 | 2,236 | 1,874 | 1,380 | 1,098 |
| 2015 | 2,003 | 2,220 | 1,815 | 1,490 | 1,057 |
| 2016 | 2,082 | 2,248 | 1,872 | 1,428 | 1,227 |
| 2017 | 1,998 | 2,443 | 1,844 | 1,543 | 1,169 |
| 2018 | 2,000 | 2,473 | 2,022 | 1,499 | 1,185 |
| 2019 | 2,220 | 2,532 | 2,010 | 1,538 | 1,272 |
| 2020 | 2,363 | 2,606 | 2,024 | 1,531 | 1,241 |
| 2021 | 2,360 | 2,249 | 2,010 | 1,412 | 1,064 |
| 2022 | 2,607 | 2,472 | 2,247 | 1,509 | 1,181 |
| 2023 | 2,686 | 2,435 | 2,165 | 1,477 | 1,231 |
| 2024 | 2,982 | 2,509 | 2,093 | 1,478 | 1,229 |
S&E = science and engineering.
The survey data collection for field of study changed in 2021, which may affect the data comparison across years. This figure uses the trend field taxonomy that facilitates trend data comparisons with prior years; for more information, see the “Data source” section.
National Center for Science and Engineering Statistics, Survey of Earned Doctorates, 2023. Related detailed table 1-3.
Non-S&E fields
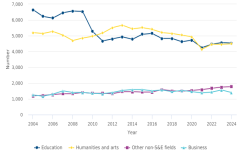
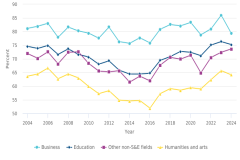
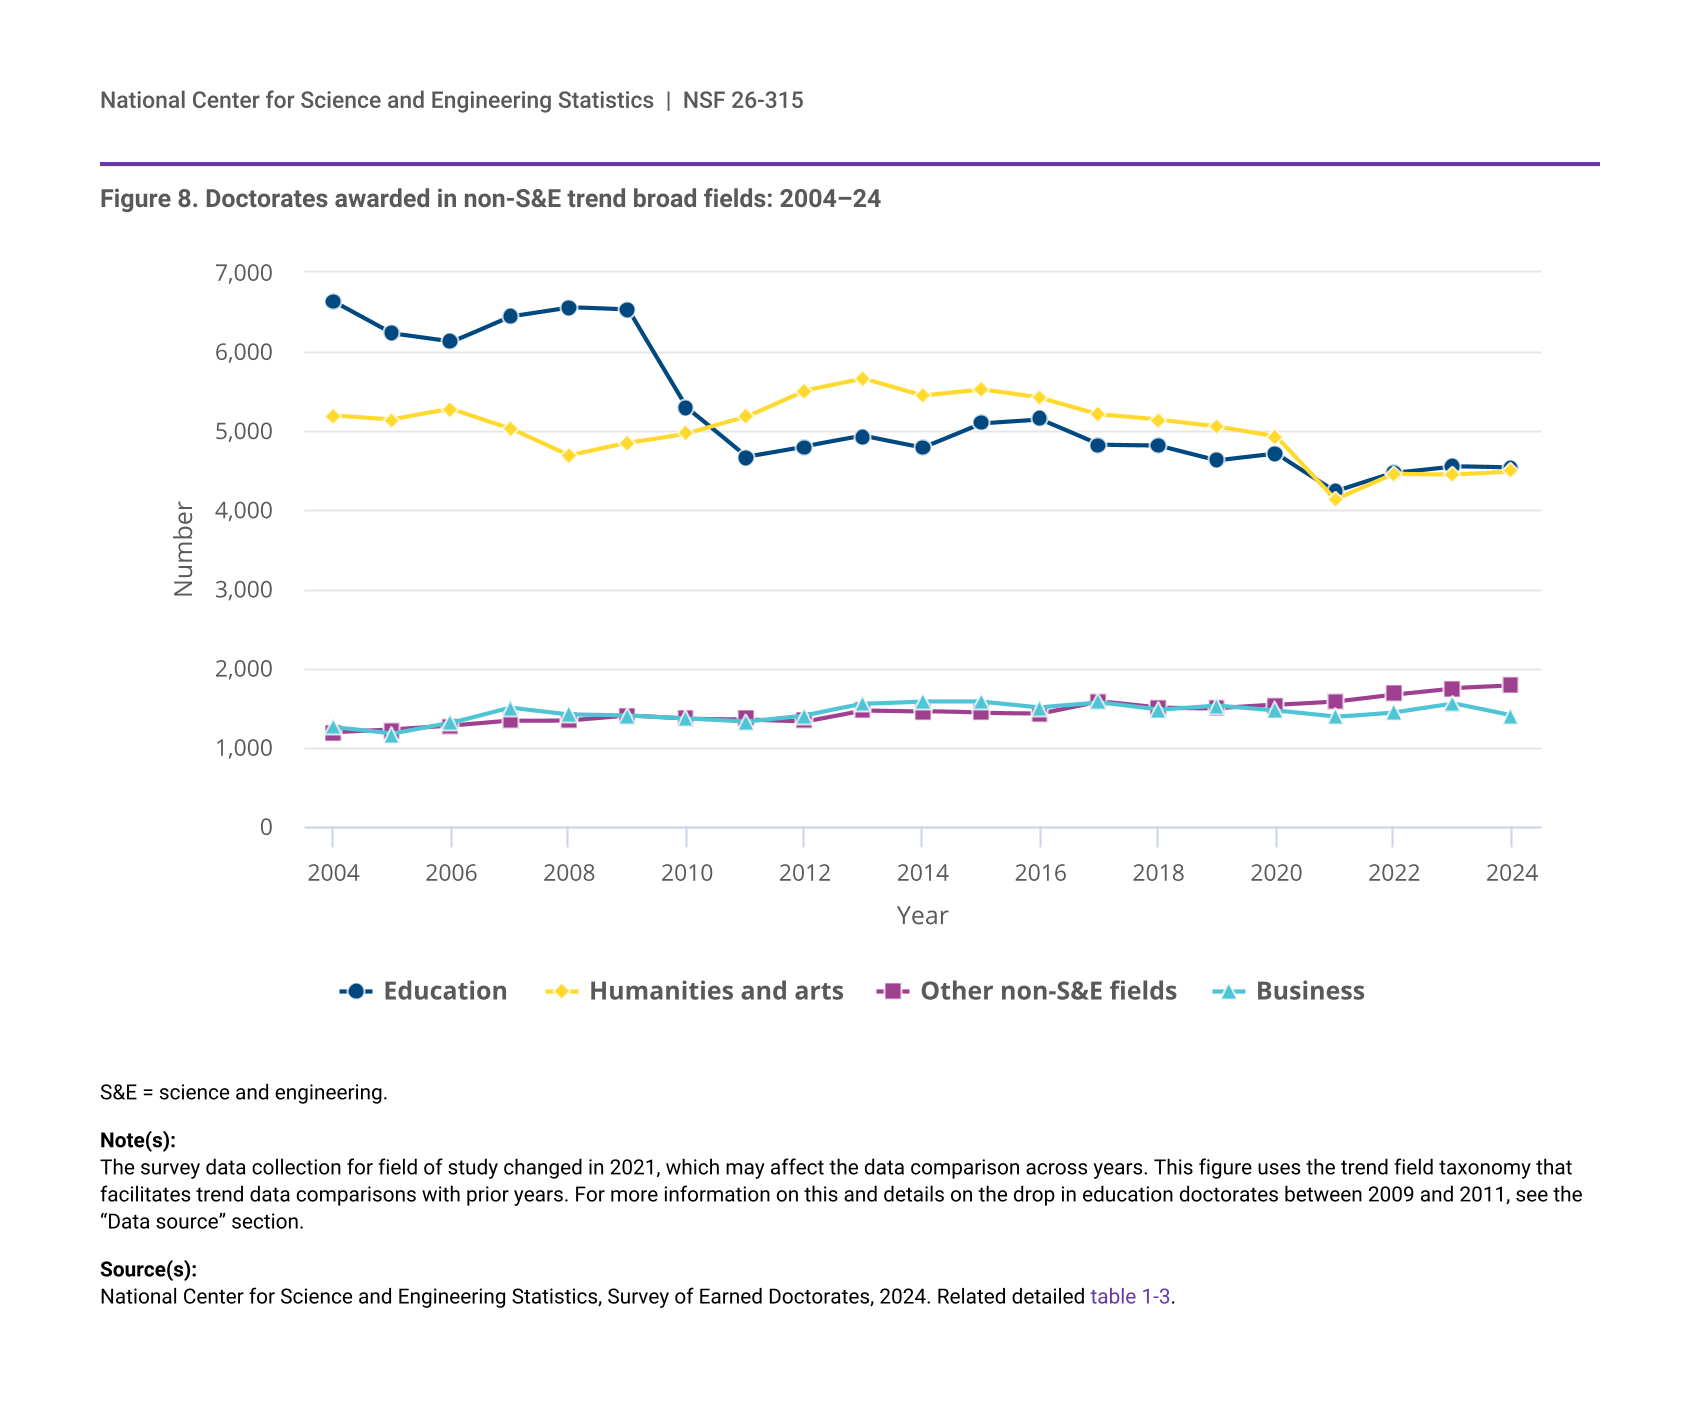
In the past 20 years, the number of research doctorates awarded in humanities and arts declined while the number in other non-S&E fields increased (figure 8). The number of research doctorates in business was higher in 2024 than in 2004, but the number fluctuated between the years. From 2014 to 2024, the number of doctorates awarded in education declined by 255. Between 2023 and 2024, the number of doctorates awarded increased in humanities and arts and in other non-S&E fields (by 39 and 27, respectively) and declined in business (by 157).
| Year | Education | Humanities and arts | Other non-S&E fields | Business |
|---|---|---|---|---|
| 2004 | 6,635 | 5,197 | 1,192 | 1,256 |
| 2005 | 6,227 | 5,144 | 1,222 | 1,171 |
| 2006 | 6,122 | 5,276 | 1,271 | 1,311 |
| 2007 | 6,448 | 5,034 | 1,335 | 1,506 |
| 2008 | 6,561 | 4,688 | 1,341 | 1,421 |
| 2009 | 6,528 | 4,848 | 1,402 | 1,405 |
| 2010 | 5,287 | 4,969 | 1,363 | 1,366 |
| 2011 | 4,670 | 5,178 | 1,356 | 1,327 |
| 2012 | 4,802 | 5,512 | 1,330 | 1,404 |
| 2013 | 4,934 | 5,662 | 1,472 | 1,551 |
| 2014 | 4,789 | 5,446 | 1,459 | 1,584 |
| 2015 | 5,098 | 5,522 | 1,437 | 1,582 |
| 2016 | 5,146 | 5,416 | 1,432 | 1,509 |
| 2017 | 4,825 | 5,209 | 1,586 | 1,566 |
| 2018 | 4,817 | 5,139 | 1,504 | 1,473 |
| 2019 | 4,628 | 5,051 | 1,494 | 1,528 |
| 2020 | 4,712 | 4,924 | 1,537 | 1,466 |
| 2021 | 4,239 | 4,132 | 1,581 | 1,389 |
| 2022 | 4,471 | 4,456 | 1,672 | 1,447 |
| 2023 | 4,554 | 4,452 | 1,750 | 1,557 |
| 2024 | 4,534 | 4,491 | 1,777 | 1,400 |
S&E = science and engineering.
The survey data collection for field of study changed in 2021, which may affect the data comparison across years. This figure uses the trend field taxonomy that facilitates trend data comparisons with prior years. For more information on this and details on the drop in education doctorates between 2009 and 2011, see the “Data source” section.
National Center for Science and Engineering Statistics, Survey of Earned Doctorates, 2024. Related detailed table 1-3.
Citizenship status
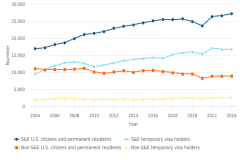
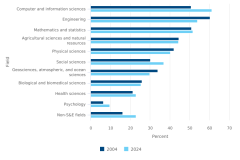
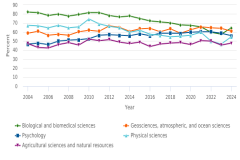
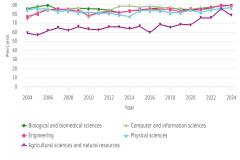
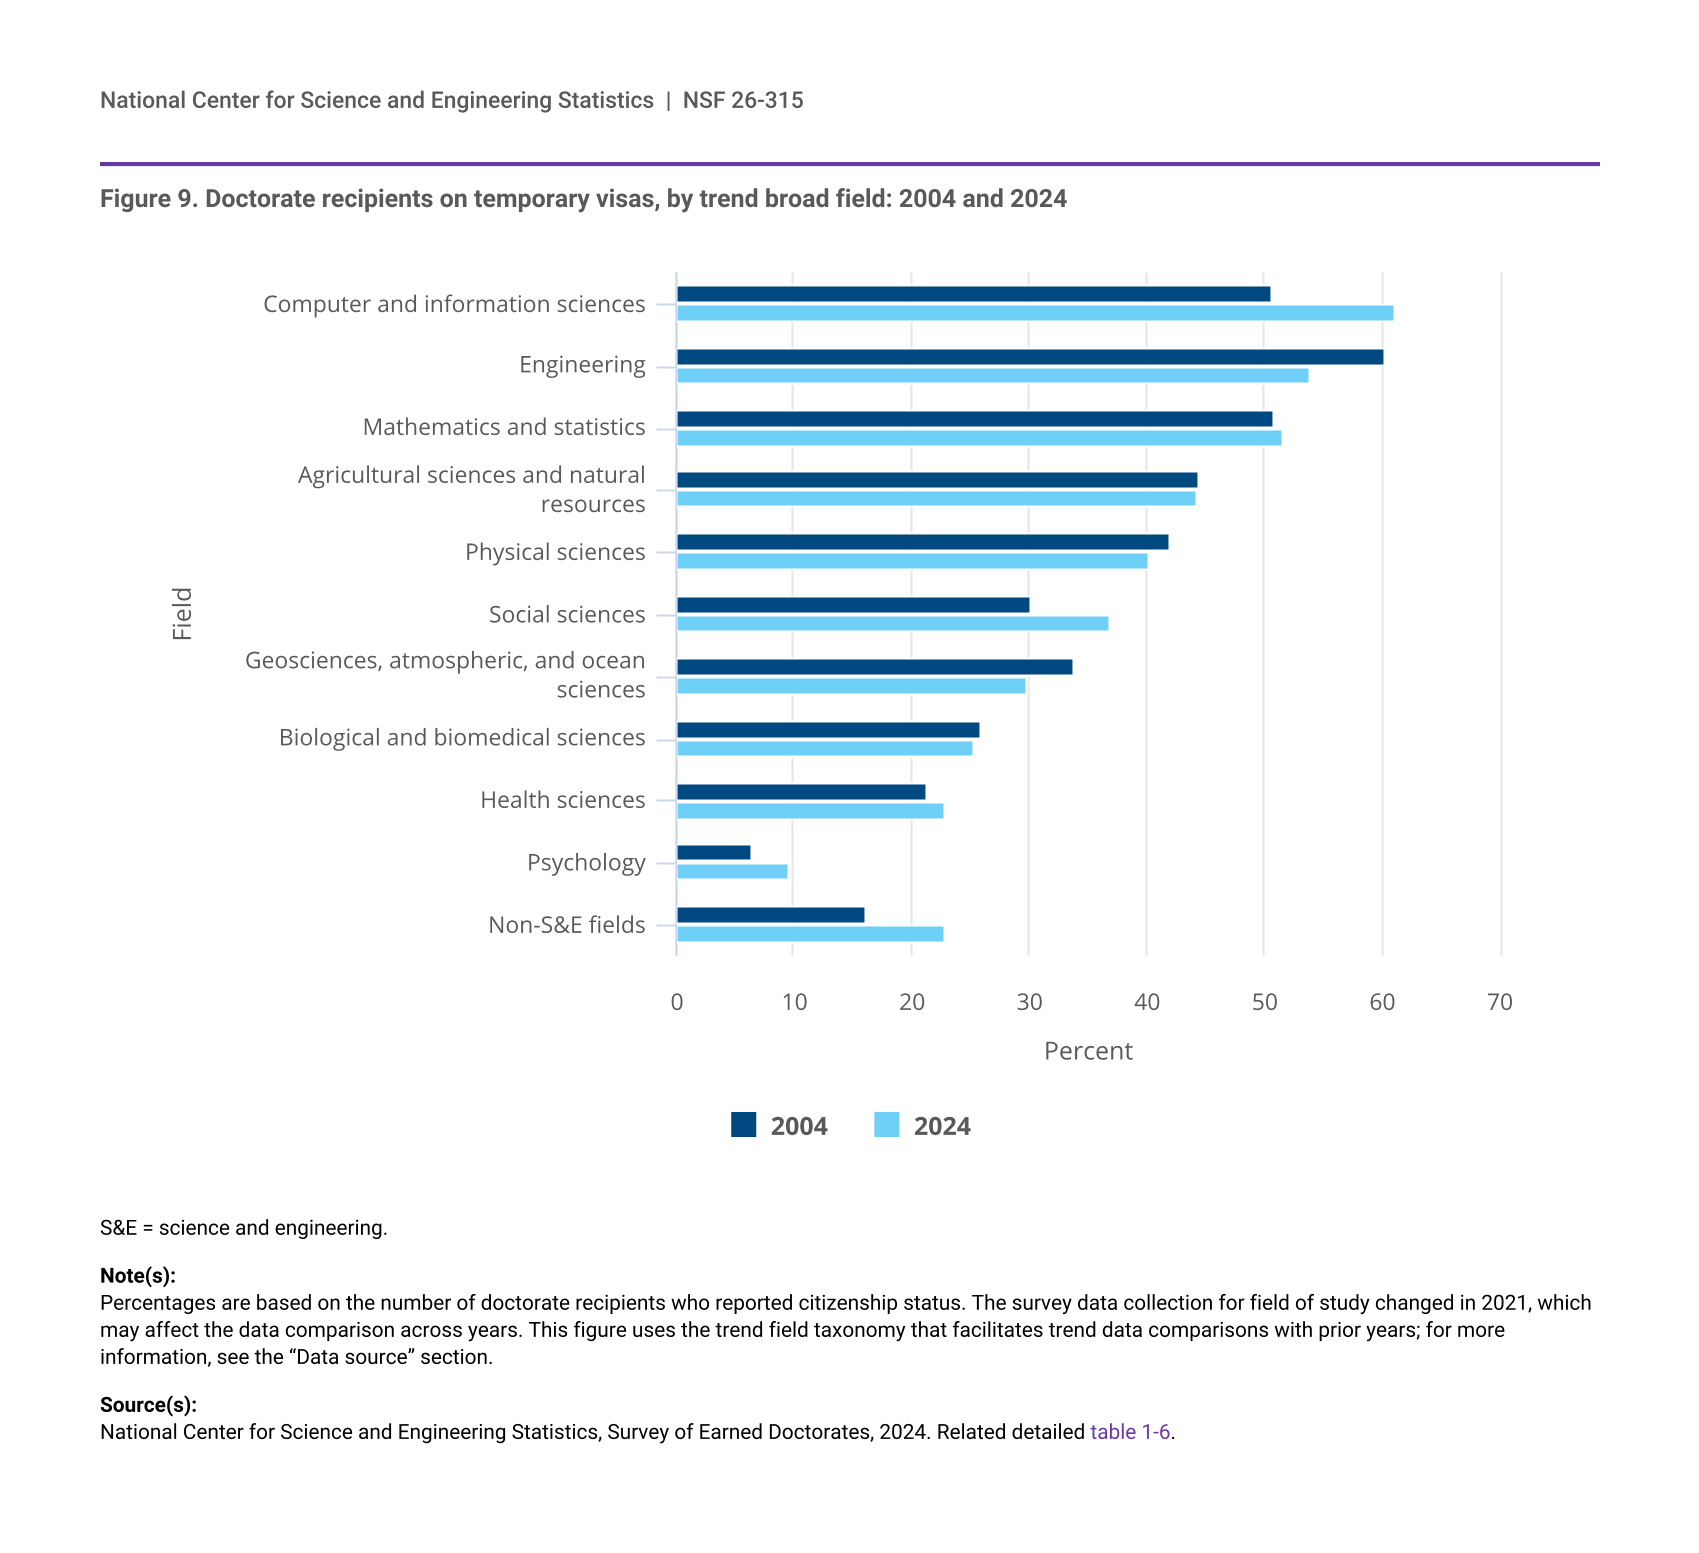
In the past 20 years, the number of doctorates awarded to temporary visa holders increased in every broad field except for education. In 2024, temporary visa holders earned the majority of doctorates in computer and information sciences (61%), engineering (54%), and mathematics and statistics (51%) (figure 9). The largest increases in the proportion of doctorates awarded to temporary visa holders since 2004 (3 percentage points or more) were in computer and information sciences, social sciences, psychology, and non-S&E fields. During this period, the proportion of temporary visa holder doctorate recipients declined in engineering and in geosciences, atmospheric, and ocean sciences.
| Field | 2004 | 2024 |
|---|---|---|
| Computer and information sciences | 50.6 | 61.1 |
| Engineering | 60.2 | 53.9 |
| Mathematics and statistics | 50.8 | 51.5 |
| Agricultural sciences and natural resources | 44.5 | 44.3 |
| Physical sciences | 42.0 | 40.3 |
| Social sciences | 30.2 | 36.9 |
| Geosciences, atmospheric, and ocean sciences | 33.9 | 29.7 |
| Biological and biomedical sciences | 25.8 | 25.3 |
| Health sciences | 21.2 | 22.9 |
| Psychology | 6.3 | 9.5 |
| Non-S&E fields | 16.1 | 22.9 |
S&E = science and engineering.
Percentages are based on the number of doctorate recipients who reported citizenship status. The survey data collection for field of study changed in 2021, which may affect the data comparison across years. This figure uses the trend field taxonomy that facilitates trend data comparisons with prior years; for more information, see the “Data source” section.
National Center for Science and Engineering Statistics, Survey of Earned Doctorates, 2024. Related detailed table 1-6.
U.S. citizens and permanent residents
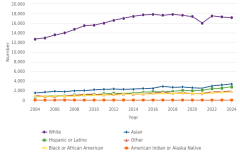
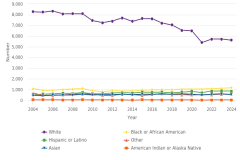
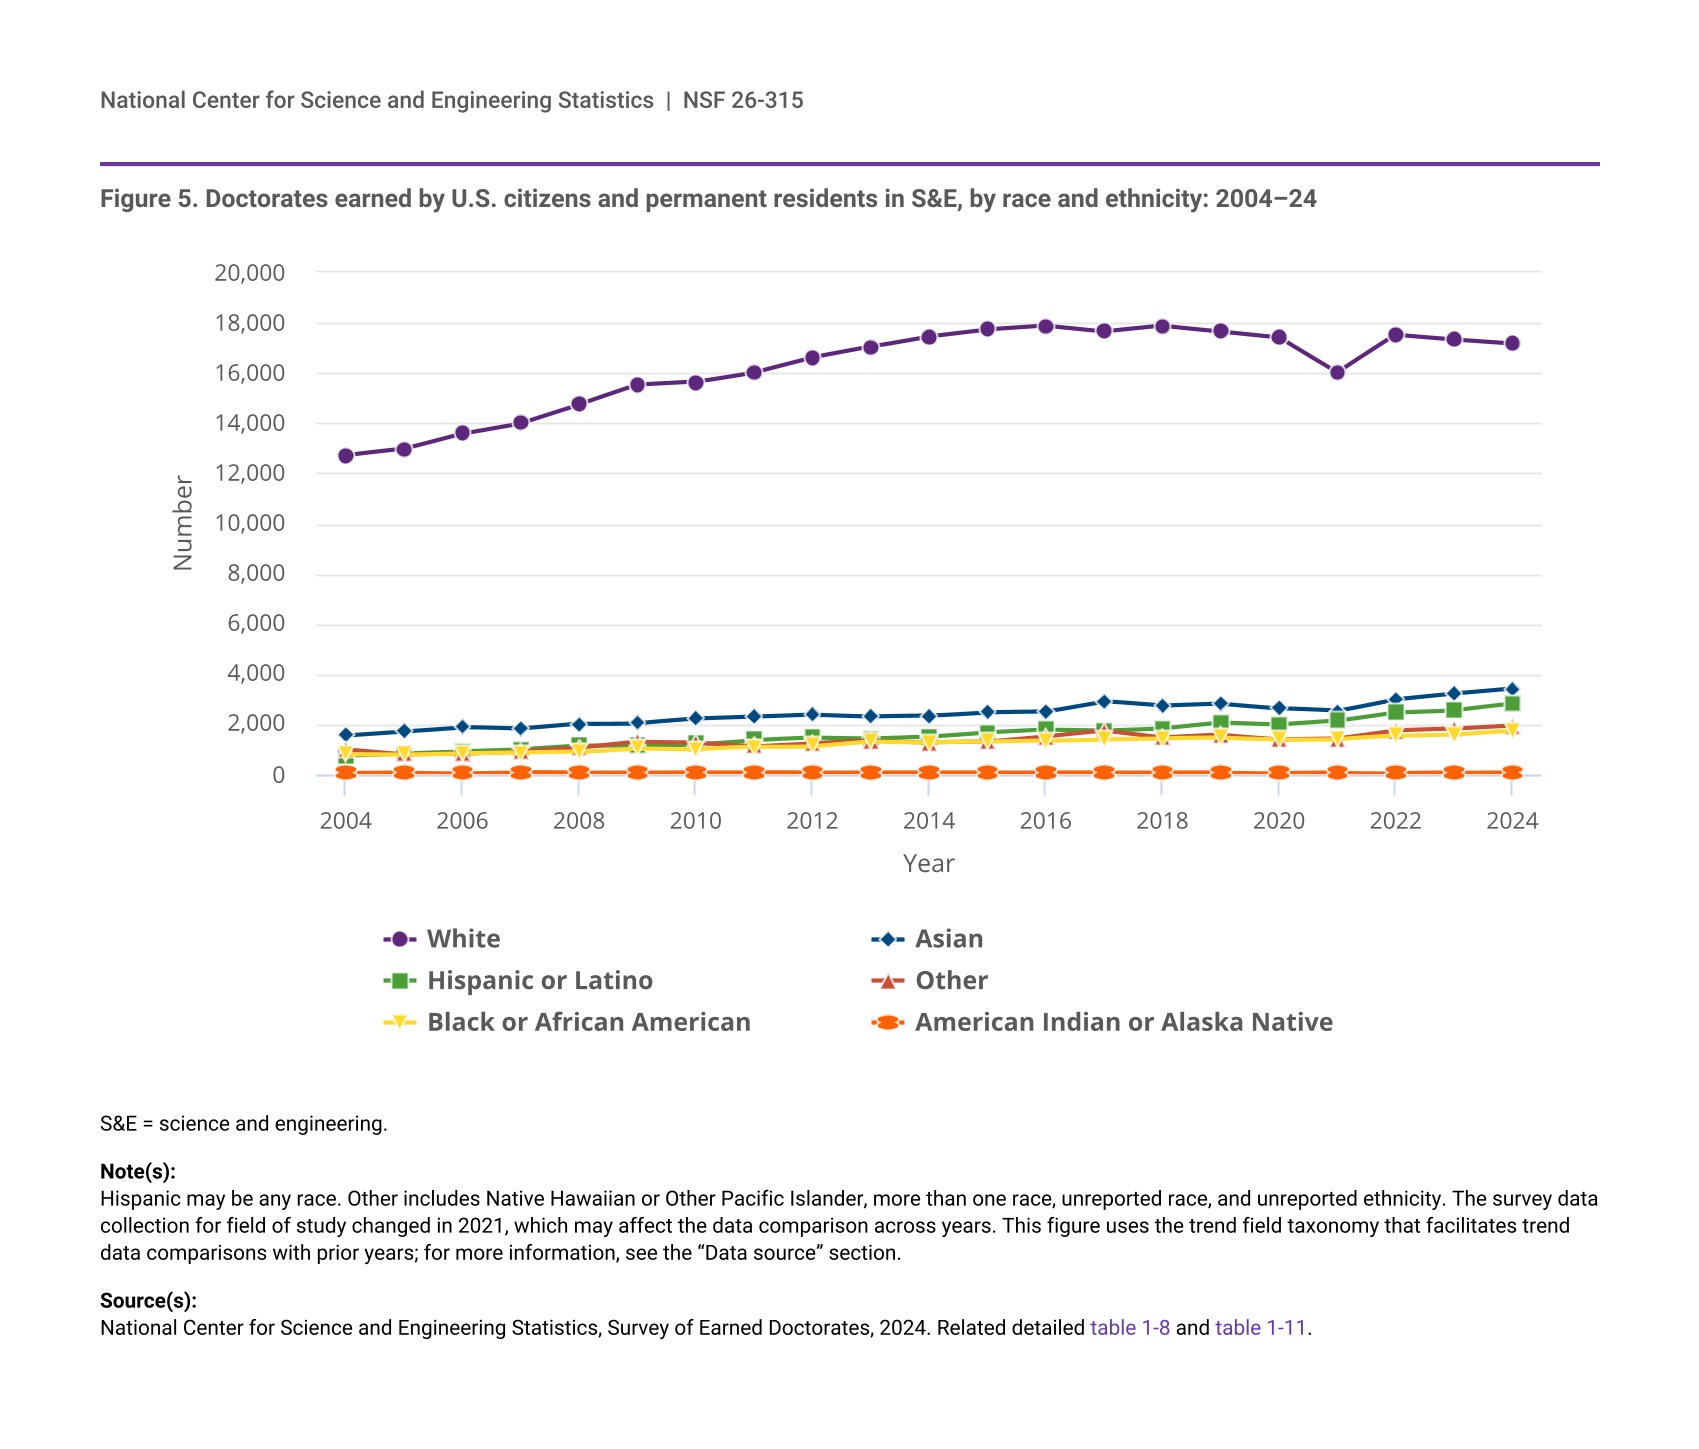
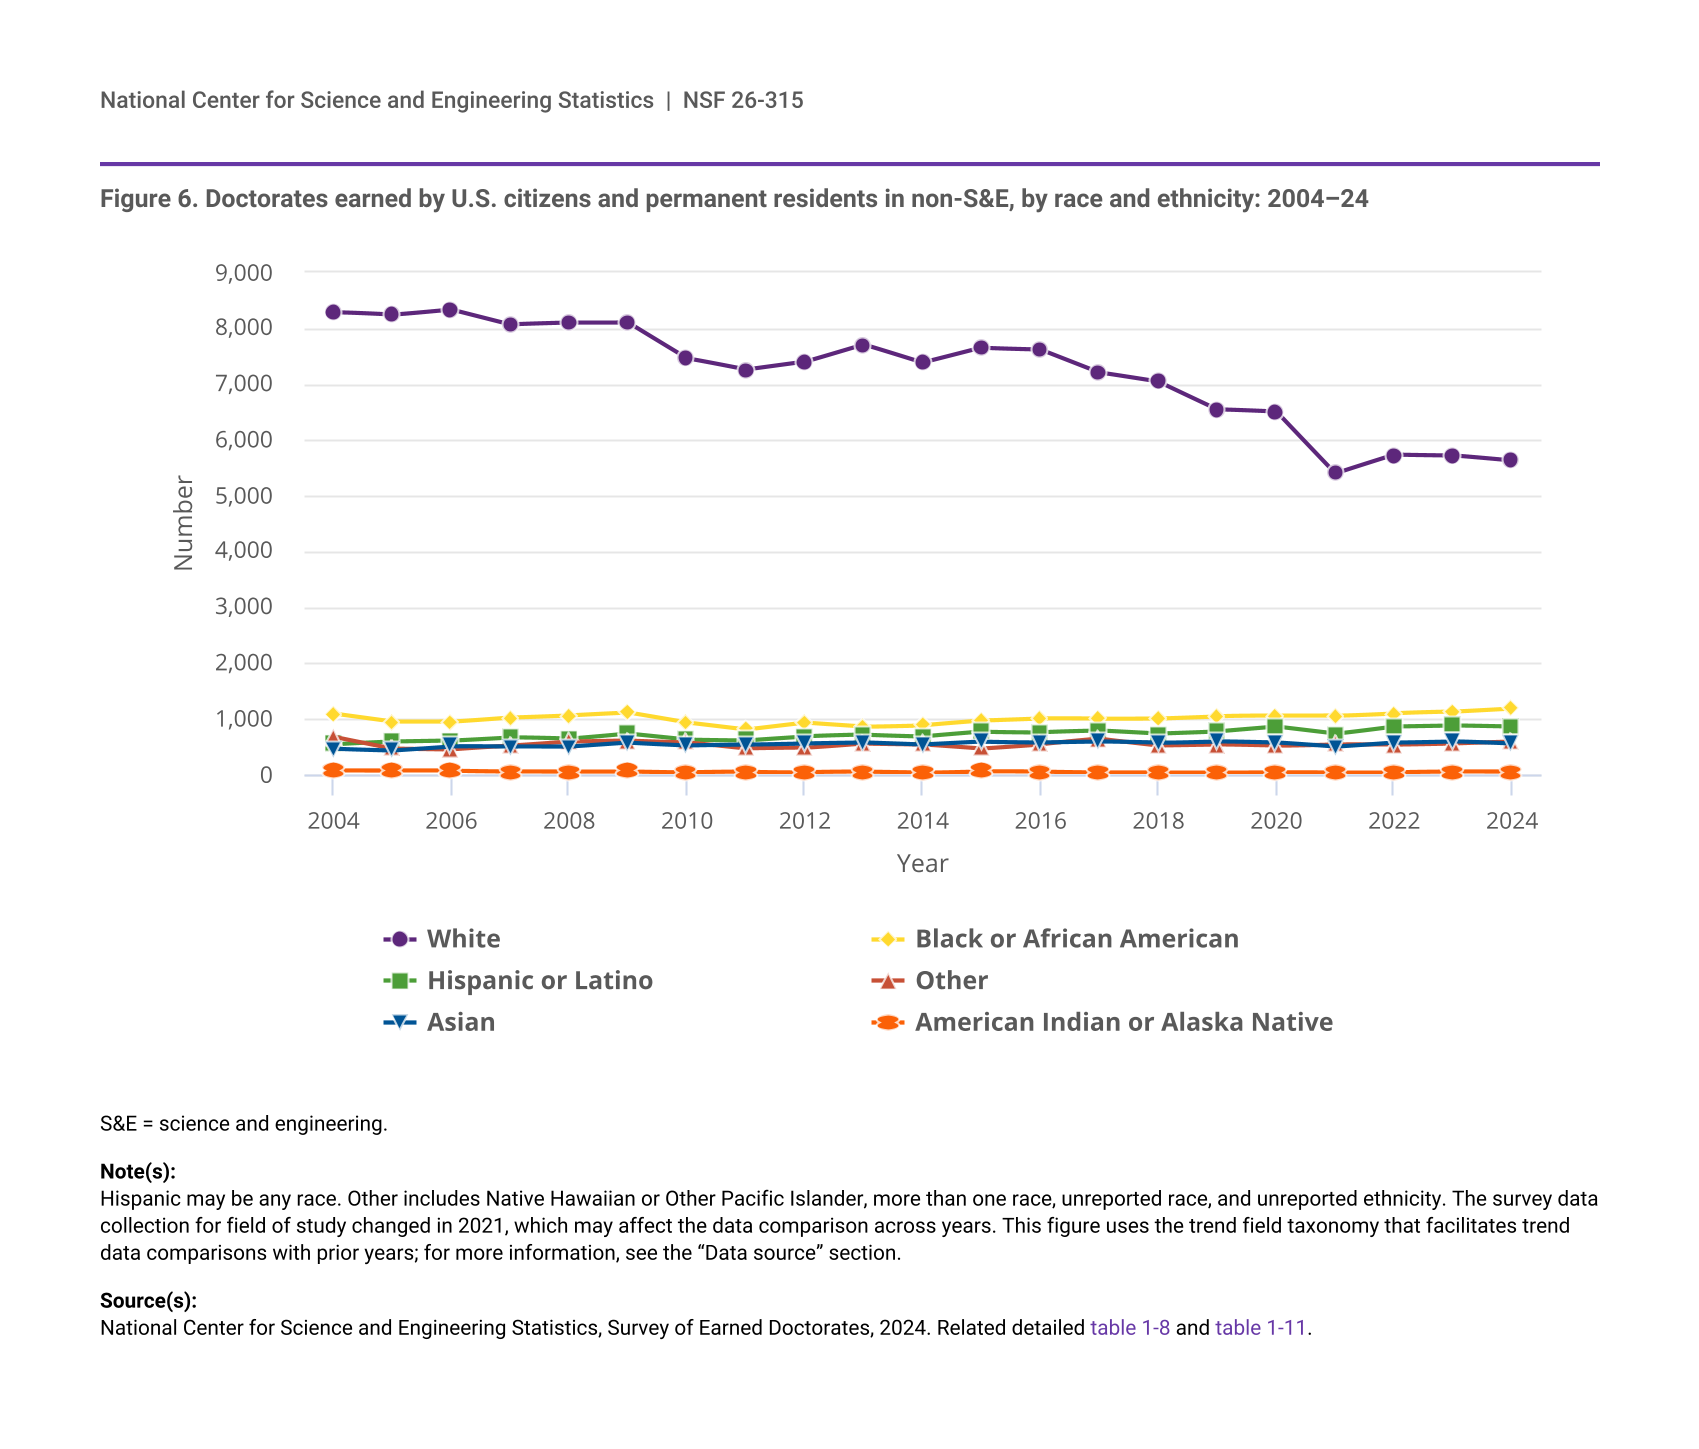
In 2024, 63% of the 27,204 U.S. citizen and permanent resident doctorate recipients in S&E fields identified as White, 13% as Asian, 10% as Hispanic or Latino, 6% as Black or African American, and 4% as more than one race (table 1). The remaining 3% identified as American Indian or Alaska Native, Native Hawaiian or Other Pacific Islander, or did not report their race or ethnicity. In 2024, White doctorate recipients accounted for the majority of the U.S. citizens and permanent residents in each S&E field, ranging from 55% in computer and information sciences to 75% in agricultural sciences and natural resources (table 2).
Among other U.S. citizen and permanent resident racial and ethnic groups, Asian doctorate recipients earned the next largest shares of S&E doctoral degrees in computer and information sciences (22%), engineering (17%), mathematics and statistics (15%), biological and biomedical sciences (14%), and physical sciences (12%); Hispanic or Latino doctorate recipients earned the next largest shares in psychology (13%), social sciences (11%), geosciences, atmospheric, and ocean sciences (9%), and agricultural sciences and natural resources (8%); and Black or African American doctorate recipients earned the next largest share in health sciences (14%).
S&E = science and engineering.
Hispanic may be any race. Other race or race not reported includes Native Hawaiian and Other Pacific Islanders and those who did not report their race. Percentages may not sum to 100% due to rounding. The survey data collection for field of study changed in 2021, which may affect the data comparison across years. This figure uses the trend field taxonomy that facilitates trend data comparisons with prior years; for more information, see the "Data source" section.
National Center for Science and Engineering Statistics, Survey of Earned Doctorates, 2024. Related detailed table 1-11.
S&E = science and engineering.
Hispanic may be any race. Other race or race not reported includes Native Hawaiian and Other Pacific Islanders and those who did not report their race. The survey data collection for field of study changed in 2021, which may affect the data comparison across years. This figure uses the trend field taxonomy that facilitates trend data comparisons with prior years; for more information, see the "Data source" section.
National Center for Science and Engineering Statistics, Survey of Earned Doctorates, 2024. Related detailed table 1-11.
Sex
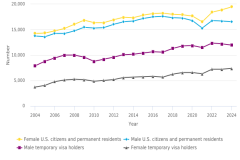
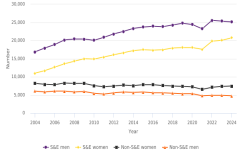
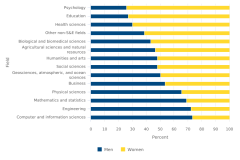
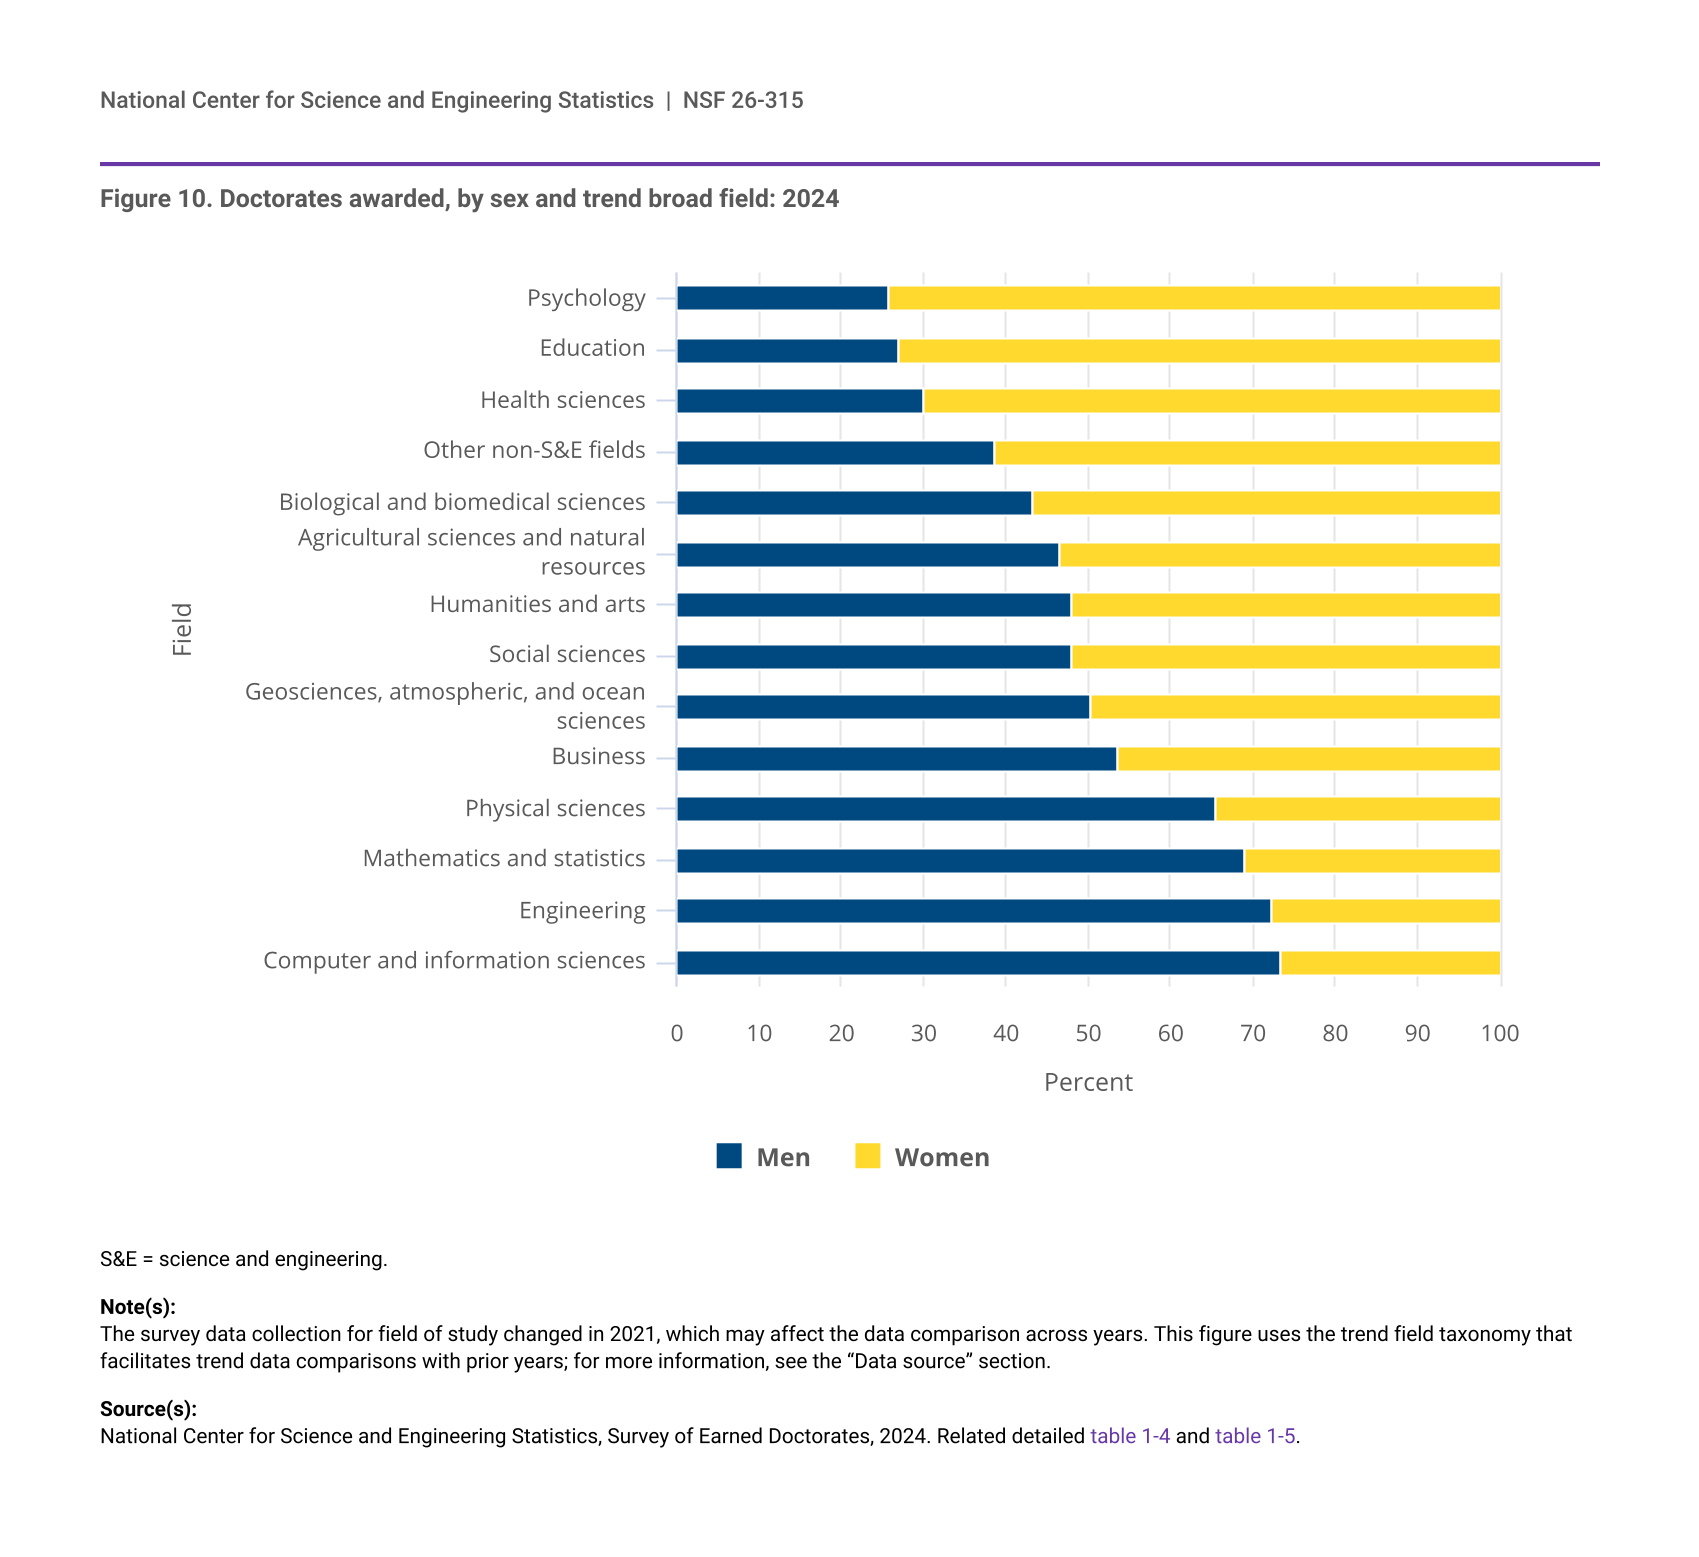
The distribution of men and women varies considerably across fields of study (figure 10). In 2024, women earned more than half of the doctorates in psychology, education, health sciences, other non-S&E fields, biological and biomedical sciences, and agricultural sciences and natural resources. Men earned more than half of the doctorates awarded in computer and information sciences, engineering, mathematics and statistics, physical sciences, and business. The percentage of men and women earning doctorates were similar in geosciences, atmospheric, and ocean sciences; humanities and arts; and social sciences.
From 2004 to 2024, the proportion of female doctorate recipients grew in all broad fields except for health sciences; the largest increases (9 percentage points or more) were in agricultural sciences and natural resources; geosciences, atmospheric, and ocean sciences; business; engineering; and biological and biomedical sciences. During this period, the shares of doctorates awarded to men and women in health sciences and in humanities and arts stayed relatively unchanged.
| Field | Men | Women |
|---|---|---|
| Psychology | 25.9 | 74.1 |
| Education | 27.0 | 73.0 |
| Health sciences | 30.1 | 69.9 |
| Other non-S&E fields | 38.8 | 61.2 |
| Biological and biomedical sciences | 43.4 | 56.6 |
| Agricultural sciences and natural resources | 46.5 | 53.5 |
| Humanities and arts | 48.0 | 52.0 |
| Social sciences | 48.2 | 51.8 |
| Geosciences, atmospheric, and ocean sciences | 50.4 | 49.6 |
| Business | 53.7 | 46.3 |
| Physical sciences | 65.6 | 34.4 |
| Mathematics and statistics | 69.2 | 30.8 |
| Engineering | 72.5 | 27.5 |
| Computer and information sciences | 73.3 | 26.7 |
S&E = science and engineering.
The survey data collection for field of study changed in 2021, which may affect the data comparison across years. This figure uses the trend field taxonomy that facilitates trend data comparisons with prior years; for more information, see the “Data source” section.