 An official website of the United States government
Report
Postgraduation trends
A graduate’s first position after earning a doctoral degree may reflect broad economic conditions and can shape later career opportunities, earnings, and choices. Over the longer term, the early career patterns of doctorate recipients may influence the decisions of future students considering careers as scientists, engineers, scholars, and researchers.
Definite commitments at graduation
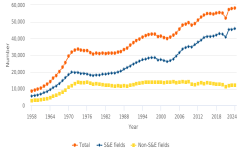
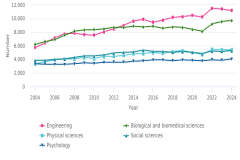
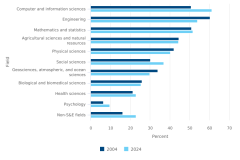
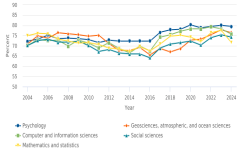
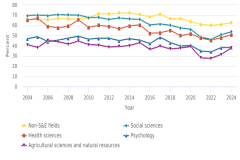
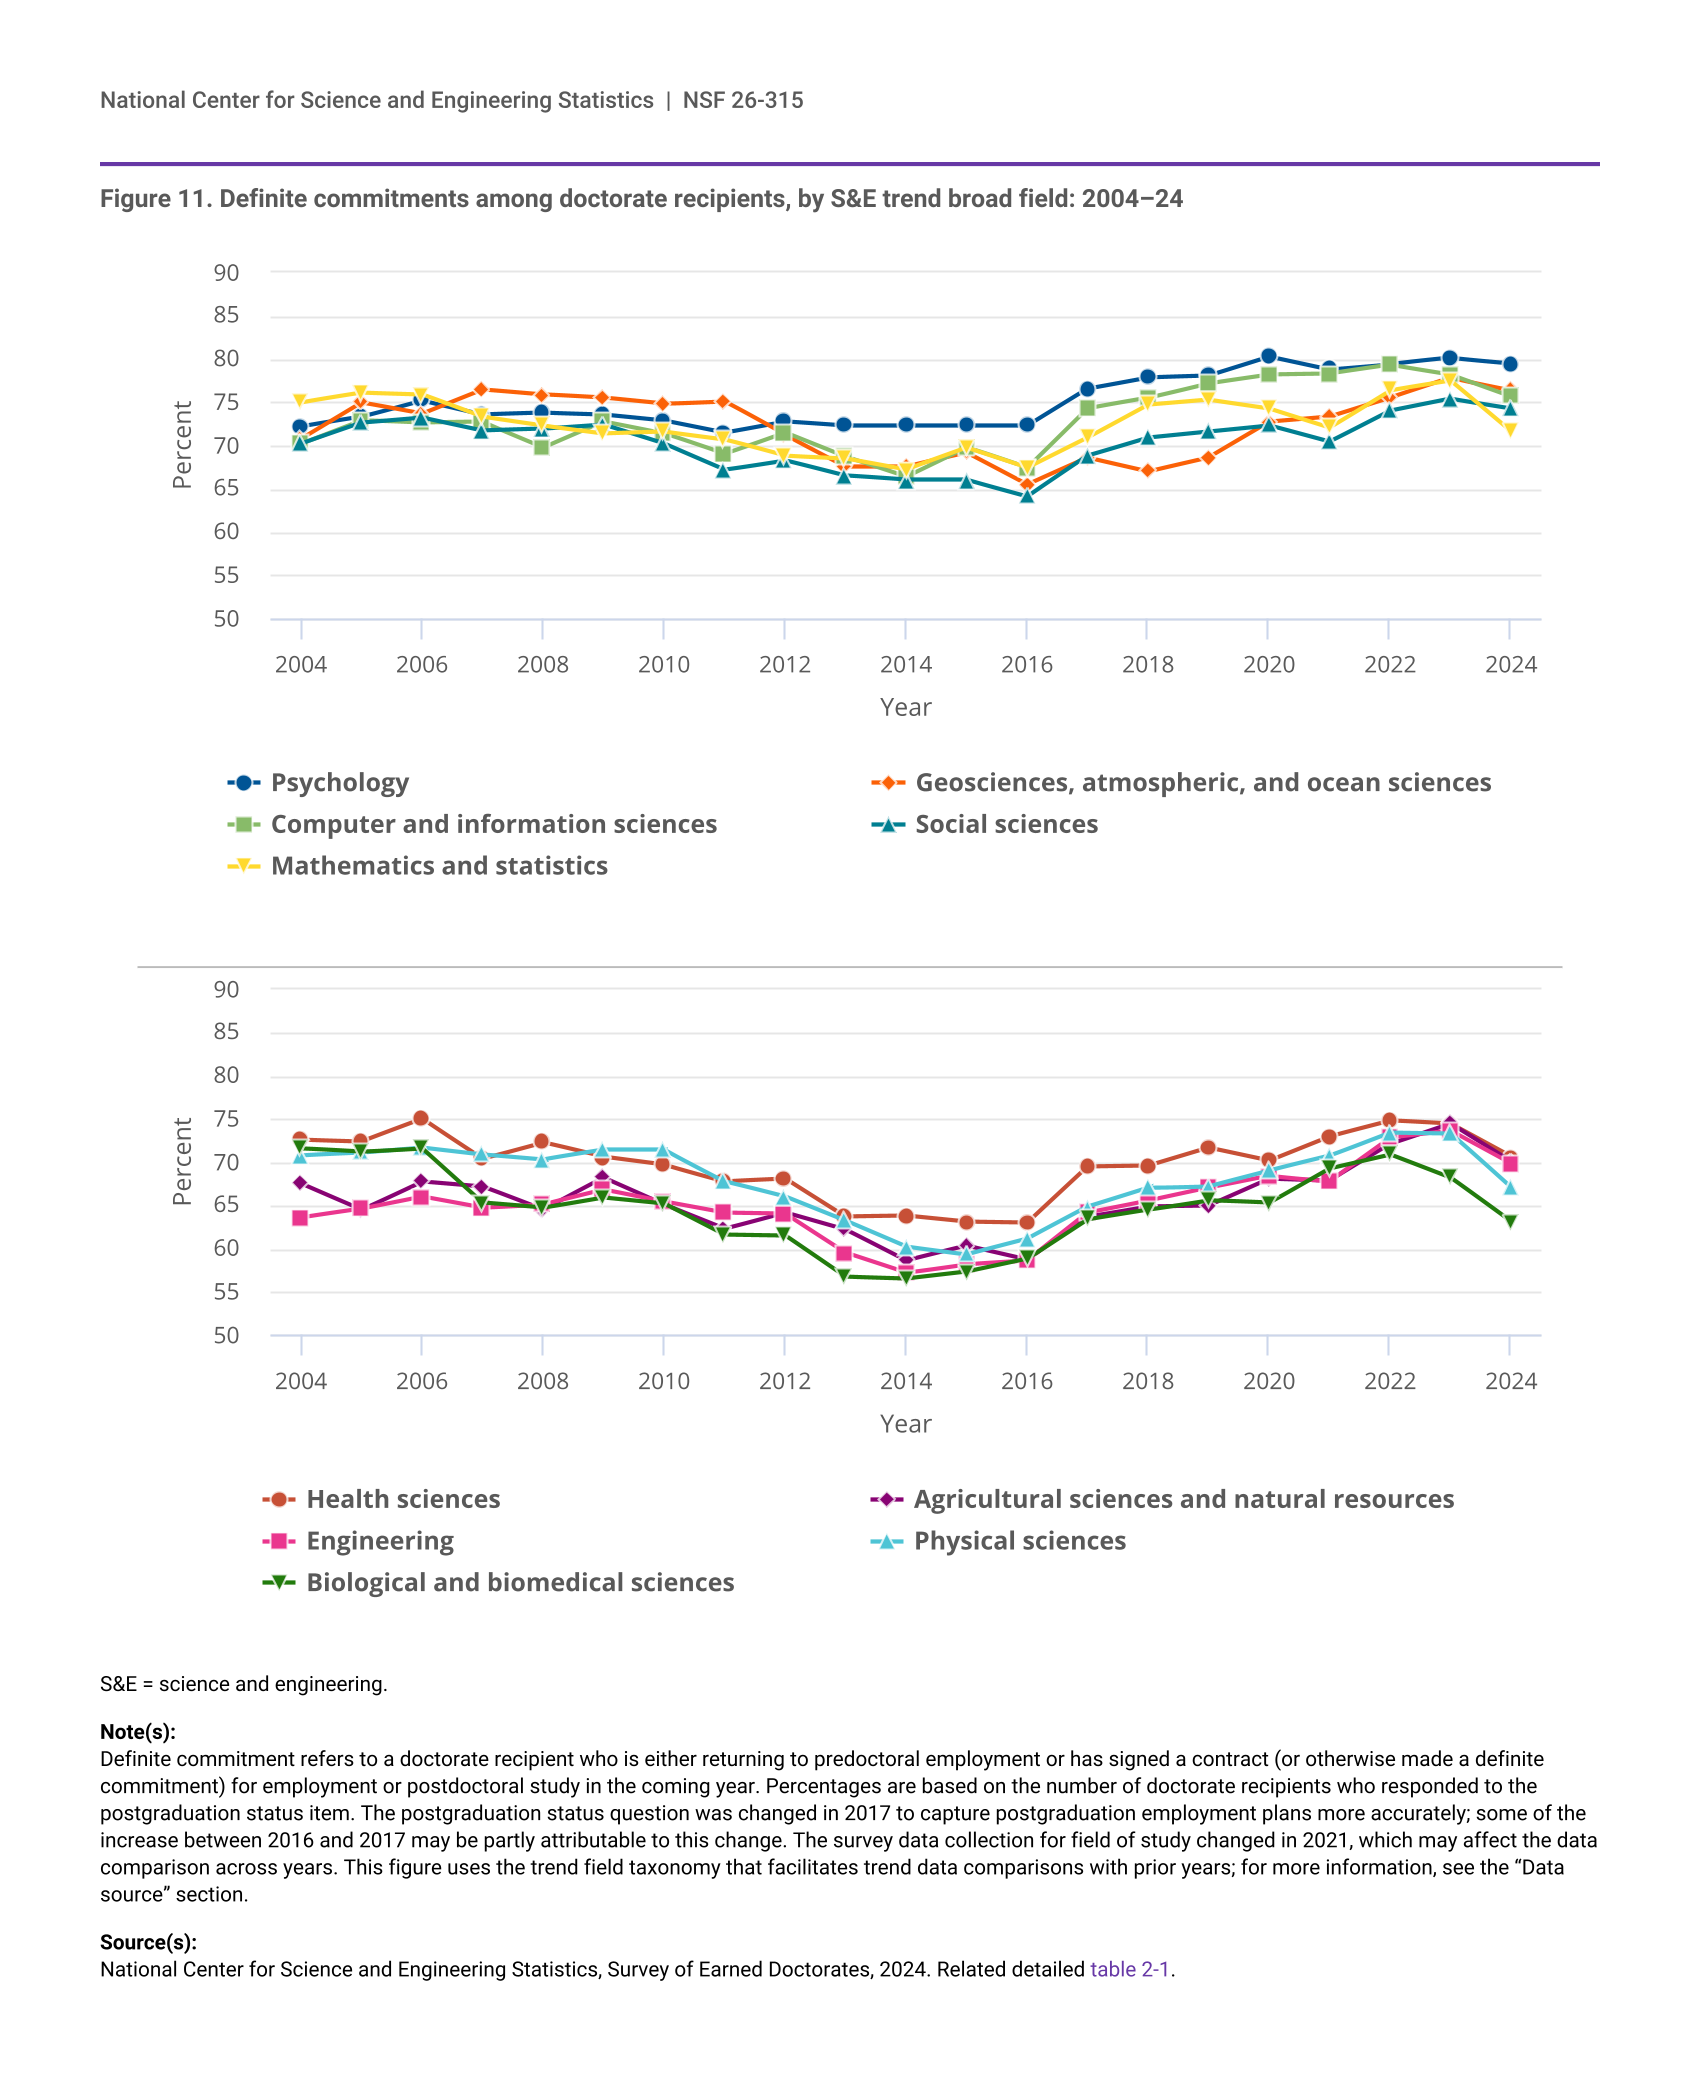
At any given time, the job market outlook for new doctorate recipients will be better in some doctorate fields than in others. In general, doctorate recipients in S&E fields tend to have robust postgraduation career prospects. Of the 45,929 S&E doctorate recipients in 2024, 41,567 responded to the postgraduation commitment questions at the time of survey completion. Of those who responded to this question, 29,122 (70%) had definite commitments for employment or postdoctoral study or training (postdoc) positions. The survey measures a point in time, and some of the 12,445 (30%) who did not indicate having a postgraduate commitment may have had one after responding to the survey. The proportions of 2024 doctorate recipients in S&E with definite commitments for employment or postdoc positions ranged from 63% in biological and biomedical sciences to 80% in psychology (figure 11). The overall proportion of S&E doctorate recipients with definite commitments was the same in 2024 and in 2004 (70%) but with a great deal of fluctuation throughout this period. In general, most fields show a decline in definite commitments between 2004 and the mid-2010s, with lows between 2014 and 2016, followed by a rebound through 2023 and a decline between 2023 and 2024. Psychology was the exception to this pattern; definite commitments among doctorate recipients in psychology did not experience a dip in the years between 2013 and 2017.
Between 2023 and 2024, the proportion of doctorate recipients with definite commitments declined in all S&E broad fields. The largest percentage-point declines in definite commitments were in physical sciences and mathematics and statistics (6 percentage points each); in biological and biomedical sciences (5 percentage points); and in agricultural sciences and natural resources, health sciences, and engineering (4 percentage points each). Smaller declines (between 1 and 2 percentage points) were experienced in computer and information sciences; geosciences, atmospheric, and ocean sciences; social sciences; and psychology.
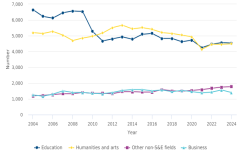
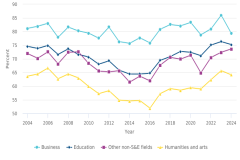
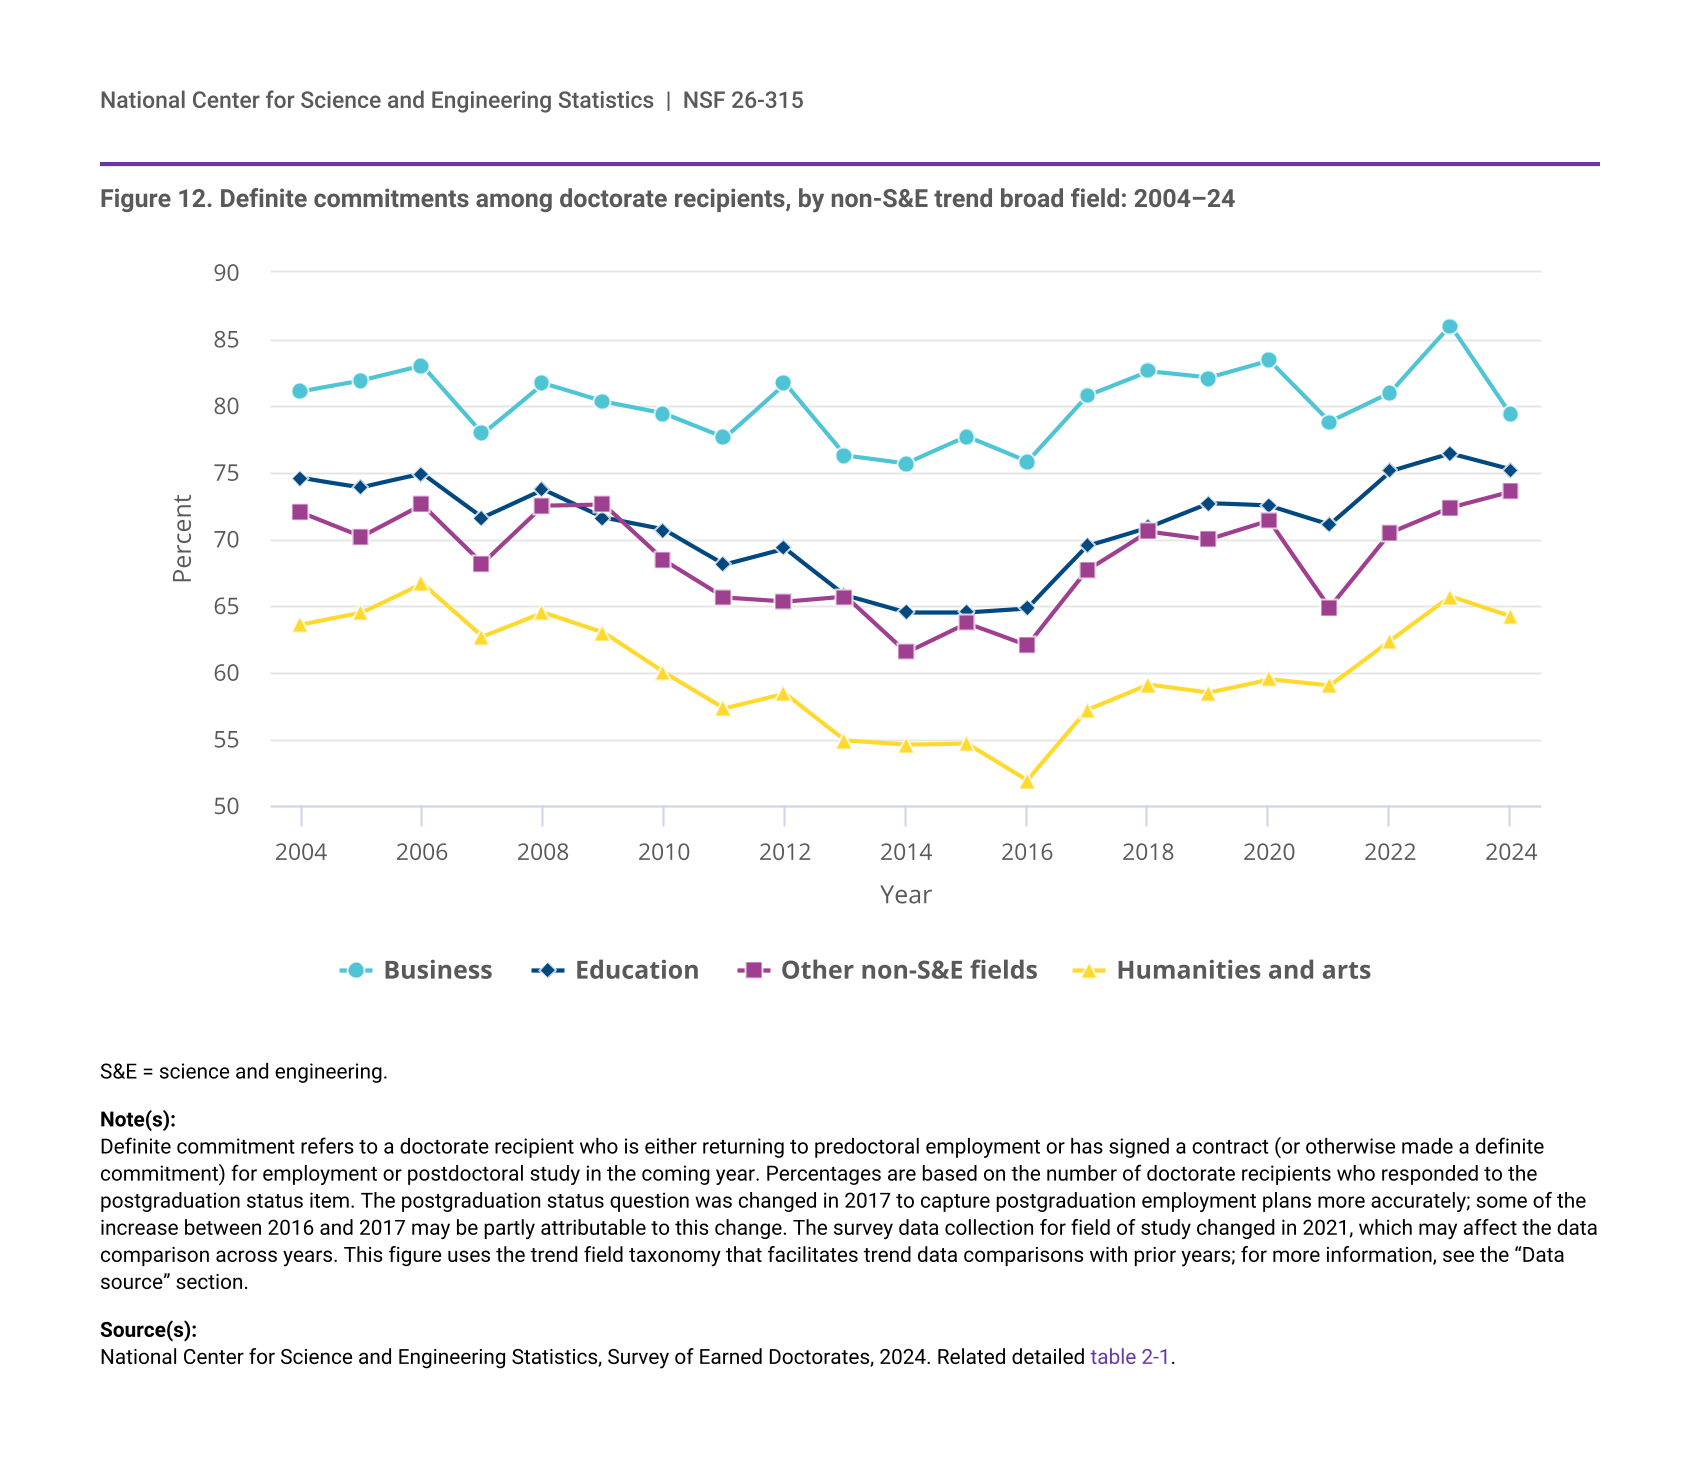
Overall, the proportion of non-S&E doctorate recipients reporting definite commitments was the same in 2024 as in 2004 (71%). Since 2004, the proportion of doctorate recipients reporting definite commitments increased about 1–2 percentage points in education, humanities and arts, and other non-S&E fields and declined by 2 percentage points in business. These proportions are still higher than during the dip from 2014 to 2016 (figure 12). Doctorate recipients in non-S&E fields experienced drops in commitments in 2021 during the COVID-19 pandemic, but commitments rebounded in 2022 and 2023 for all broad fields. However, between 2023 and 2024, definite commitments declined in each broad field except other non-S&E fields; the largest decline was in business (7 percentage points). In 2024, psychology had the highest proportion of definite commitments of all S&E and non-S&E fields (80%). Biological and biomedical sciences had the lowest proportion among all S&E and non-S&E fields (63%) (figure 11 and figure 12).
| Year | Psychology | Geosciences, atmospheric, and ocean sciences | Computer and information sciences | Social sciences | Mathematics and statistics |
|---|---|---|---|---|---|
| 2004 | 72.2 | 70.8 | 70.2 | 70.2 | 75.0 |
| 2005 | 73.3 | 75.0 | 72.9 | 72.6 | 76.1 |
| 2006 | 75.2 | 73.7 | 72.6 | 73.2 | 75.9 |
| 2007 | 73.6 | 76.5 | 72.7 | 71.7 | 73.3 |
| 2008 | 73.8 | 75.9 | 69.8 | 71.9 | 72.3 |
| 2009 | 73.6 | 75.5 | 72.8 | 72.4 | 71.4 |
| 2010 | 72.9 | 74.8 | 71.4 | 70.2 | 71.6 |
| 2011 | 71.5 | 75.1 | 69.0 | 67.2 | 70.7 |
| 2012 | 72.8 | 71.2 | 71.5 | 68.3 | 68.8 |
| 2013 | 72.3 | 67.6 | 68.7 | 66.5 | 68.5 |
| 2014 | 72.3 | 67.6 | 66.4 | 66.0 | 67.2 |
| 2015 | 72.3 | 69.2 | 69.8 | 66.0 | 69.7 |
| 2016 | 72.3 | 65.5 | 67.4 | 64.1 | 67.4 |
| 2017 | 76.6 | 68.6 | 74.3 | 68.8 | 70.9 |
| 2018 | 77.9 | 67.0 | 75.5 | 70.9 | 74.7 |
| 2019 | 78.1 | 68.6 | 77.2 | 71.6 | 75.3 |
| 2020 | 80.3 | 72.7 | 78.2 | 72.3 | 74.3 |
| 2021 | 78.8 | 73.3 | 78.3 | 70.4 | 72.1 |
| 2022 | 79.4 | 75.5 | 79.3 | 74.0 | 76.4 |
| 2023 | 80.1 | 77.8 | 78.2 | 75.4 | 77.5 |
| 2024 | 79.5 | 76.4 | 75.7 | 74.3 | 71.6 |
| Year | Health sciences | Agricultural sciences and natural resources | Engineering | Physical sciences | Biological and biomedical sciences |
|---|---|---|---|---|---|
| 2004 | 72.6 | 67.5 | 63.6 | 70.8 | 71.6 |
| 2005 | 72.4 | 64.5 | 64.6 | 71.1 | 71.2 |
| 2006 | 75.0 | 67.8 | 66.0 | 71.7 | 71.6 |
| 2007 | 70.4 | 67.2 | 64.7 | 70.9 | 65.3 |
| 2008 | 72.3 | 64.5 | 65.1 | 70.3 | 64.7 |
| 2009 | 70.6 | 68.2 | 66.8 | 71.4 | 65.9 |
| 2010 | 69.7 | 65.1 | 65.4 | 71.4 | 65.2 |
| 2011 | 67.8 | 62.3 | 64.1 | 67.8 | 61.6 |
| 2012 | 68.1 | 64.2 | 64.0 | 66.0 | 61.5 |
| 2013 | 63.7 | 62.2 | 59.5 | 63.2 | 56.7 |
| 2014 | 63.8 | 58.6 | 57.2 | 60.2 | 56.5 |
| 2015 | 63.1 | 60.3 | 58.2 | 59.3 | 57.3 |
| 2016 | 63.0 | 58.7 | 58.6 | 61.1 | 58.8 |
| 2017 | 69.5 | 63.7 | 64.1 | 64.8 | 63.4 |
| 2018 | 69.6 | 64.9 | 65.5 | 67.0 | 64.5 |
| 2019 | 71.7 | 65.0 | 67.0 | 67.2 | 65.6 |
| 2020 | 70.2 | 68.1 | 68.4 | 69.0 | 65.3 |
| 2021 | 73.0 | 67.9 | 67.8 | 70.7 | 69.3 |
| 2022 | 74.8 | 72.1 | 72.8 | 73.4 | 70.9 |
| 2023 | 74.4 | 74.5 | 73.6 | 73.3 | 68.2 |
| 2024 | 70.6 | 70.1 | 69.8 | 67.0 | 63.1 |
S&E = science and engineering.
Definite commitment refers to a doctorate recipient who is either returning to predoctoral employment or has signed a contract (or otherwise made a definite commitment) for employment or postdoctoral study in the coming year. Percentages are based on the number of doctorate recipients who responded to the postgraduation status item. The postgraduation status question was changed in 2017 to capture postgraduation employment plans more accurately; some of the increase between 2016 and 2017 may be partly attributable to this change. The survey data collection for field of study changed in 2021, which may affect the data comparison across years. This figure uses the trend field taxonomy that facilitates trend data comparisons with prior years; for more information, see the “Data source” section.
National Center for Science and Engineering Statistics, Survey of Earned Doctorates, 2024. Related detailed table 2-1.
| Year | Business | Education | Other non-S&E fields | Humanities and arts |
|---|---|---|---|---|
| 2004 | 81.1 | 74.6 | 72.0 | 63.6 |
| 2005 | 81.9 | 73.9 | 70.2 | 64.5 |
| 2006 | 83.0 | 74.9 | 72.6 | 66.7 |
| 2007 | 77.9 | 71.6 | 68.2 | 62.7 |
| 2008 | 81.7 | 73.7 | 72.5 | 64.5 |
| 2009 | 80.3 | 71.6 | 72.6 | 63.0 |
| 2010 | 79.4 | 70.7 | 68.4 | 60.0 |
| 2011 | 77.6 | 68.1 | 65.6 | 57.3 |
| 2012 | 81.7 | 69.3 | 65.3 | 58.4 |
| 2013 | 76.3 | 65.8 | 65.7 | 54.9 |
| 2014 | 75.7 | 64.5 | 61.5 | 54.6 |
| 2015 | 77.7 | 64.5 | 63.7 | 54.7 |
| 2016 | 75.8 | 64.8 | 62.0 | 51.9 |
| 2017 | 80.8 | 69.5 | 67.7 | 57.2 |
| 2018 | 82.6 | 70.9 | 70.6 | 59.1 |
| 2019 | 82.1 | 72.7 | 70.0 | 58.5 |
| 2020 | 83.4 | 72.5 | 71.4 | 59.5 |
| 2021 | 78.8 | 71.1 | 64.9 | 59.0 |
| 2022 | 81.0 | 75.1 | 70.5 | 62.4 |
| 2023 | 86.0 | 76.4 | 72.4 | 65.7 |
| 2024 | 79.3 | 75.2 | 73.6 | 64.2 |
S&E = science and engineering.
Definite commitment refers to a doctorate recipient who is either returning to predoctoral employment or has signed a contract (or otherwise made a definite commitment) for employment or postdoctoral study in the coming year. Percentages are based on the number of doctorate recipients who responded to the postgraduation status item. The postgraduation status question was changed in 2017 to capture postgraduation employment plans more accurately; some of the increase between 2016 and 2017 may be partly attributable to this change. The survey data collection for field of study changed in 2021, which may affect the data comparison across years. This figure uses the trend field taxonomy that facilitates trend data comparisons with prior years; for more information, see the “Data source” section.
National Center for Science and Engineering Statistics, Survey of Earned Doctorates, 2024. Related detailed table 2-1.
First postgraduate positions in the United States
In 2024, 20,469 doctorate recipients reported non-postdoc employment commitments in the United States. Of these recipients with non-postdoc employment commitments, 40% (8,098) were in academia, 40% (8,266) were in industry or business, 8% (1,552) were in government, 7% (1,331) were in nonprofits, and 6% (1,222) were in other or did not report the sector. In addition, 13,296 doctorate recipients reported having a postdoc commitment in the United States in 2024.
Academic employment
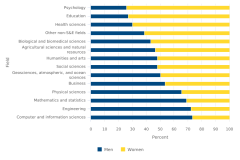
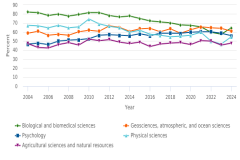
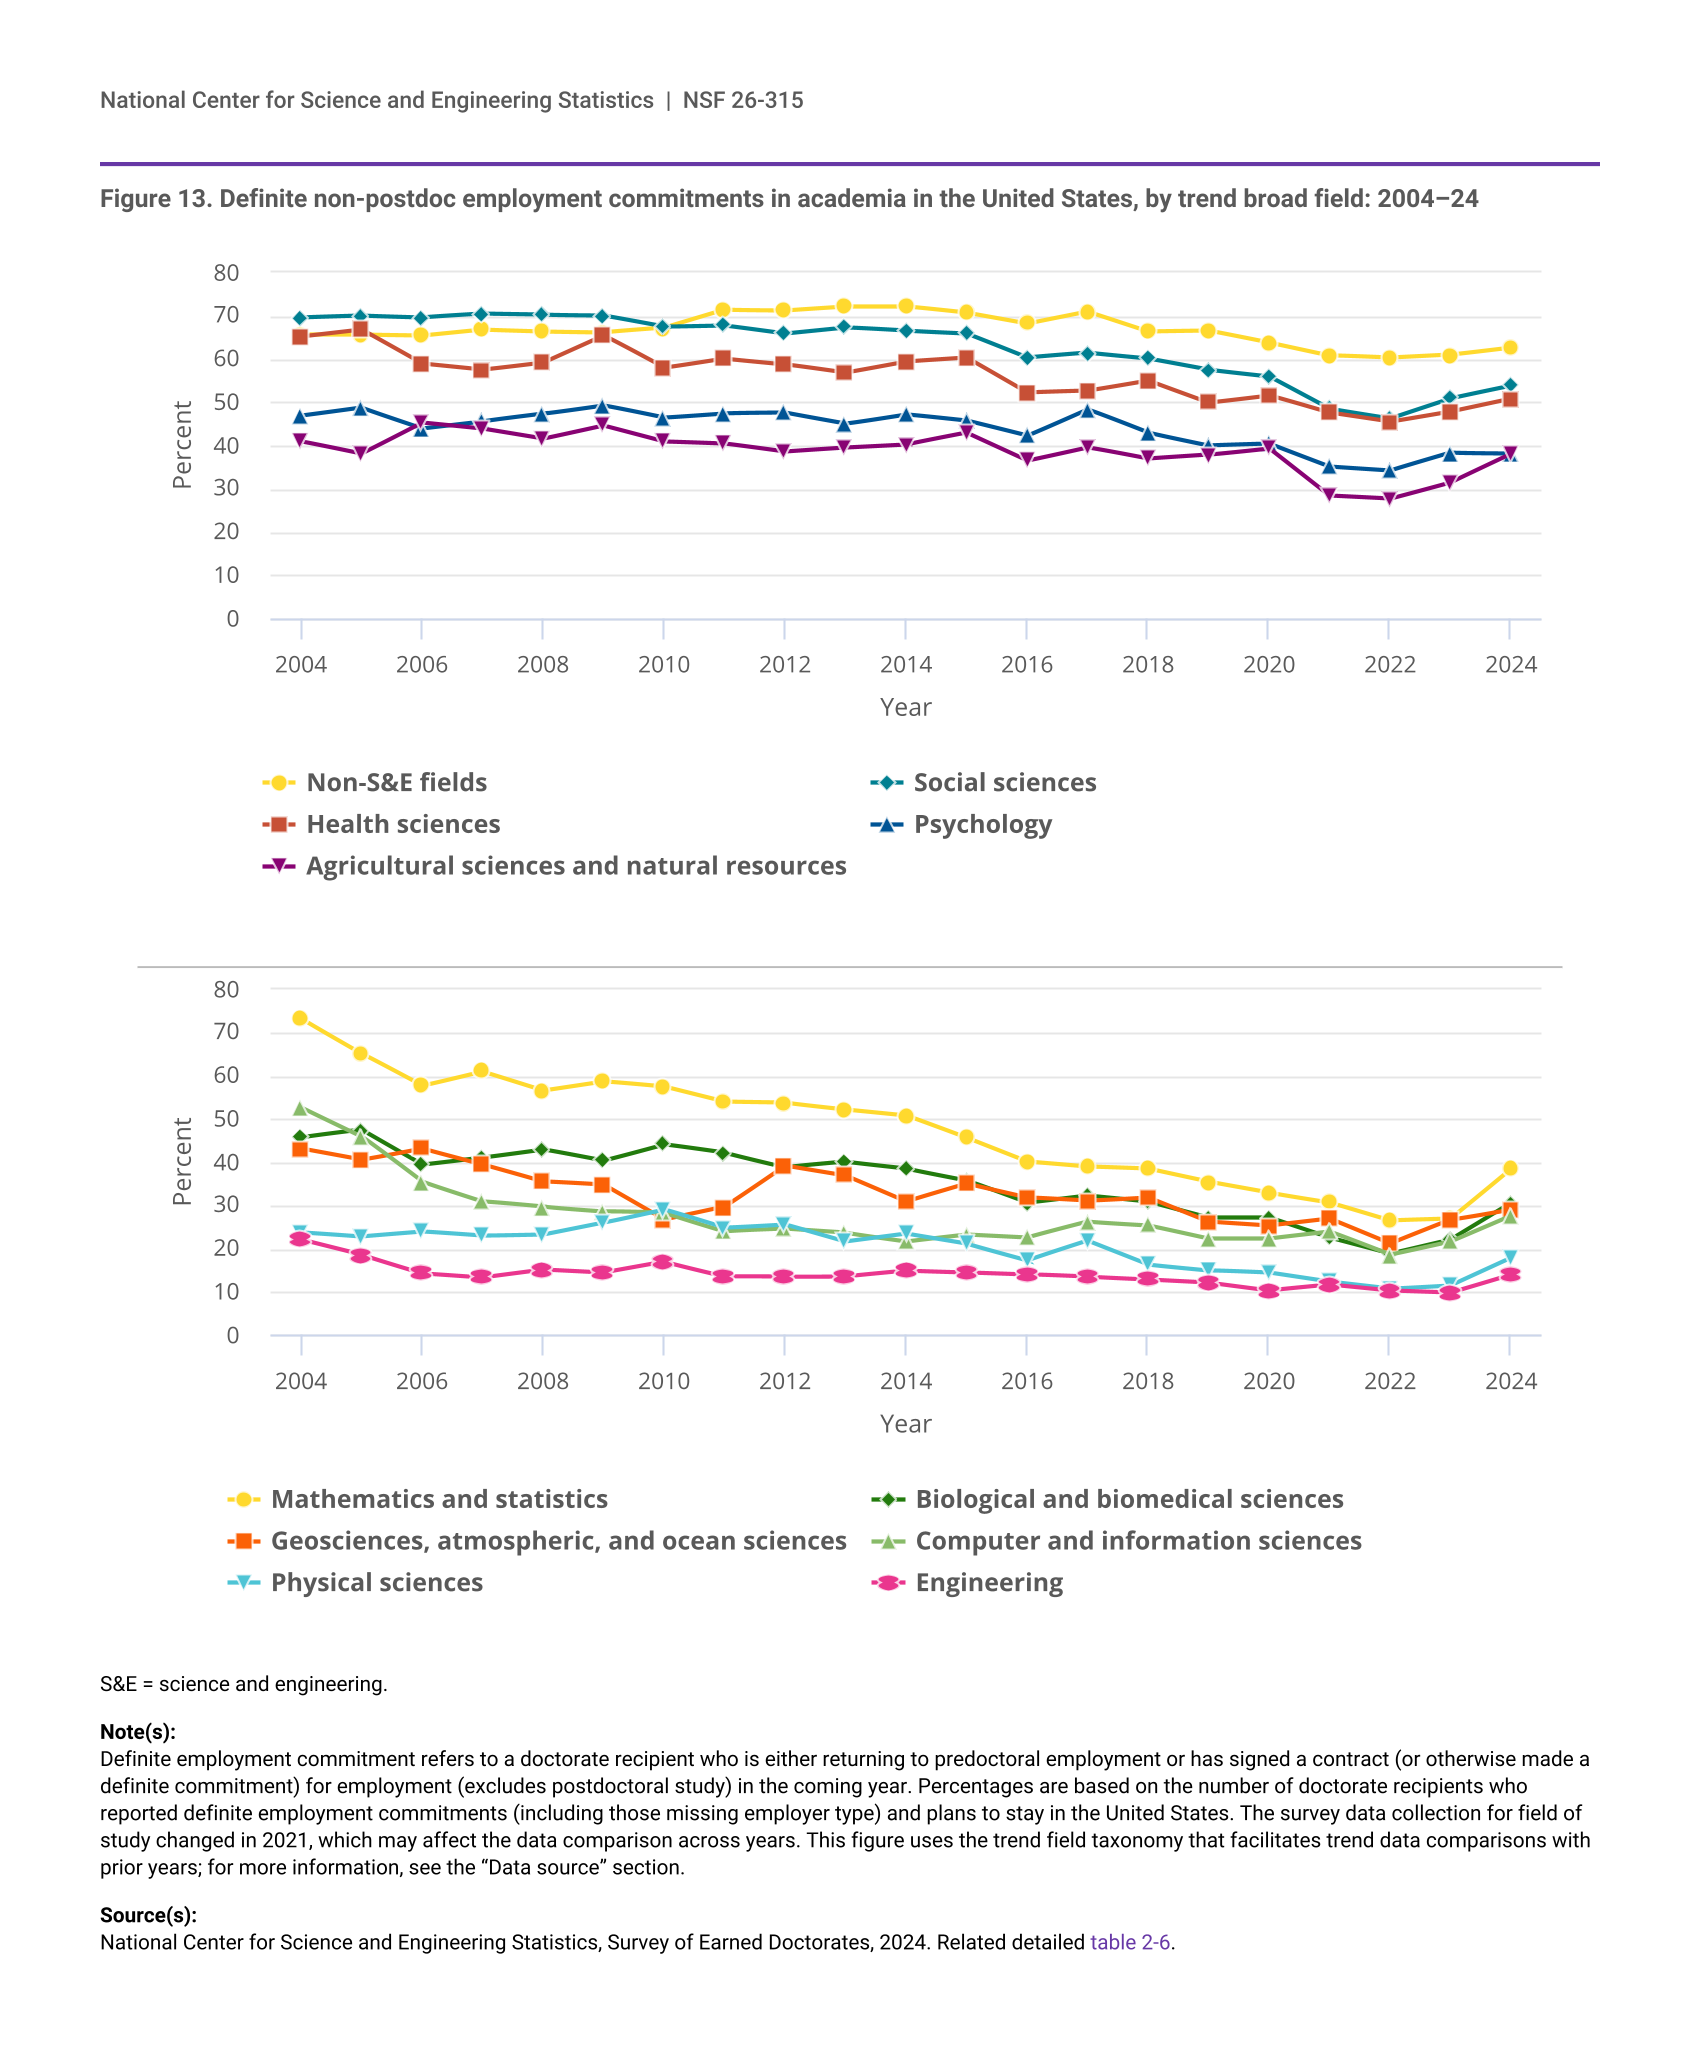
Doctorate recipients have shifted away from non-postdoc academic employment over time. In 2024, 40% of doctorate recipients with definite non-postdoc employment commitments in the United States reported that their principal job would be in academia, down from 56% in 2004. In the past 20 years, the proportion of non-postdoc academic employment commitments in the United States declined in all S&E fields. The largest percentage-point declines between 2004 and 2024 were in mathematics and statistics, dropping from 73% to 39%, followed by computer and information sciences, dropping from 53% to 28%.
The proportion of doctorate recipients who reported non-postdoc employment commitments in academia in 2024 was highest in non-S&E fields (63%) and lowest in physical sciences (18%) and engineering (14%) (figure 13). Between 2023 and 2024, the proportion of doctorate recipients with non-postdoc academic employment commitments increased in all S&E fields except psychology. The largest increases were in mathematics and statistics (12 percentage points), biological and biomedical sciences (8 percentage points), agricultural sciences and natural resources (7 percentage points), and physical sciences (6 percentage points).
| Year | Non-S&E fields | Social sciences | Health sciences | Psychology | Agricultural sciences and natural resources |
|---|---|---|---|---|---|
| 2004 | 65.6 | 69.6 | 65.2 | 46.8 | 41.0 |
| 2005 | 65.6 | 70.0 | 66.8 | 48.7 | 38.1 |
| 2006 | 65.4 | 69.6 | 58.9 | 44.0 | 45.3 |
| 2007 | 66.8 | 70.4 | 57.5 | 45.6 | 43.9 |
| 2008 | 66.4 | 70.2 | 59.2 | 47.3 | 41.6 |
| 2009 | 66.2 | 70.1 | 65.5 | 49.3 | 44.7 |
| 2010 | 67.2 | 67.5 | 57.9 | 46.4 | 41.0 |
| 2011 | 71.4 | 67.8 | 60.1 | 47.4 | 40.5 |
| 2012 | 71.3 | 65.9 | 58.8 | 47.5 | 38.6 |
| 2013 | 72.2 | 67.3 | 56.8 | 45.0 | 39.5 |
| 2014 | 72.2 | 66.5 | 59.4 | 47.2 | 40.2 |
| 2015 | 70.7 | 65.9 | 60.3 | 45.7 | 42.9 |
| 2016 | 68.2 | 60.3 | 52.2 | 42.2 | 36.5 |
| 2017 | 71.0 | 61.4 | 52.6 | 48.4 | 39.6 |
| 2018 | 66.4 | 60.1 | 55.0 | 42.9 | 36.9 |
| 2019 | 66.6 | 57.5 | 49.9 | 40.0 | 37.8 |
| 2020 | 63.8 | 56.0 | 51.6 | 40.4 | 39.3 |
| 2021 | 60.8 | 48.5 | 47.5 | 35.1 | 28.3 |
| 2022 | 60.2 | 46.3 | 45.4 | 34.2 | 27.6 |
| 2023 | 60.9 | 50.9 | 47.8 | 38.3 | 31.4 |
| 2024 | 62.6 | 53.8 | 50.8 | 38.2 | 38.0 |
| Year | Mathematics and statistics | Biological and biomedical sciences | Geosciences, atmospheric, and ocean sciences | Computer and information sciences | Physical sciences | Engineering |
|---|---|---|---|---|---|---|
| 2004 | 73.1 | 45.7 | 43.1 | 52.7 | 23.8 | 22.0 |
| 2005 | 65.1 | 47.4 | 40.5 | 46.0 | 22.8 | 18.5 |
| 2006 | 57.6 | 39.4 | 43.2 | 35.4 | 23.9 | 14.3 |
| 2007 | 61.0 | 41.1 | 39.5 | 30.9 | 22.9 | 13.3 |
| 2008 | 56.6 | 43.0 | 35.5 | 29.6 | 23.2 | 15.1 |
| 2009 | 58.7 | 40.3 | 34.7 | 28.6 | 26.0 | 14.4 |
| 2010 | 57.4 | 44.1 | 26.6 | 28.2 | 29.1 | 16.9 |
| 2011 | 53.9 | 42.1 | 29.6 | 24.0 | 24.8 | 13.6 |
| 2012 | 53.7 | 38.8 | 39.2 | 24.5 | 25.6 | 13.5 |
| 2013 | 52.2 | 40.0 | 36.9 | 23.6 | 21.6 | 13.6 |
| 2014 | 50.8 | 38.5 | 30.9 | 21.7 | 23.4 | 14.9 |
| 2015 | 45.6 | 35.8 | 35.0 | 23.3 | 21.1 | 14.5 |
| 2016 | 40.1 | 30.6 | 31.8 | 22.6 | 17.3 | 14.0 |
| 2017 | 38.9 | 32.3 | 31.0 | 26.2 | 21.8 | 13.4 |
| 2018 | 38.4 | 30.9 | 31.8 | 25.4 | 16.3 | 12.8 |
| 2019 | 35.4 | 27.2 | 26.2 | 22.3 | 15.0 | 12.1 |
| 2020 | 32.9 | 27.2 | 25.3 | 22.3 | 14.4 | 10.3 |
| 2021 | 30.7 | 22.5 | 26.9 | 23.9 | 12.3 | 11.6 |
| 2022 | 26.5 | 18.8 | 21.1 | 18.5 | 10.7 | 10.2 |
| 2023 | 26.9 | 22.1 | 26.6 | 21.6 | 11.5 | 9.7 |
| 2024 | 38.5 | 30.6 | 29.1 | 27.6 | 17.9 | 13.9 |
S&E = science and engineering.
Definite employment commitment refers to a doctorate recipient who is either returning to predoctoral employment or has signed a contract (or otherwise made a definite commitment) for employment (excludes postdoctoral study) in the coming year. Percentages are based on the number of doctorate recipients who reported definite employment commitments (including those missing employer type) and plans to stay in the United States. The survey data collection for field of study changed in 2021, which may affect the data comparison across years. This figure uses the trend field taxonomy that facilitates trend data comparisons with prior years; for more information, see the “Data source” section.
National Center for Science and Engineering Statistics, Survey of Earned Doctorates, 2024. Related detailed table 2-6.
Industry or business employment
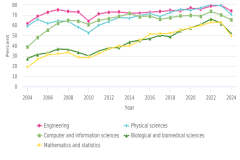
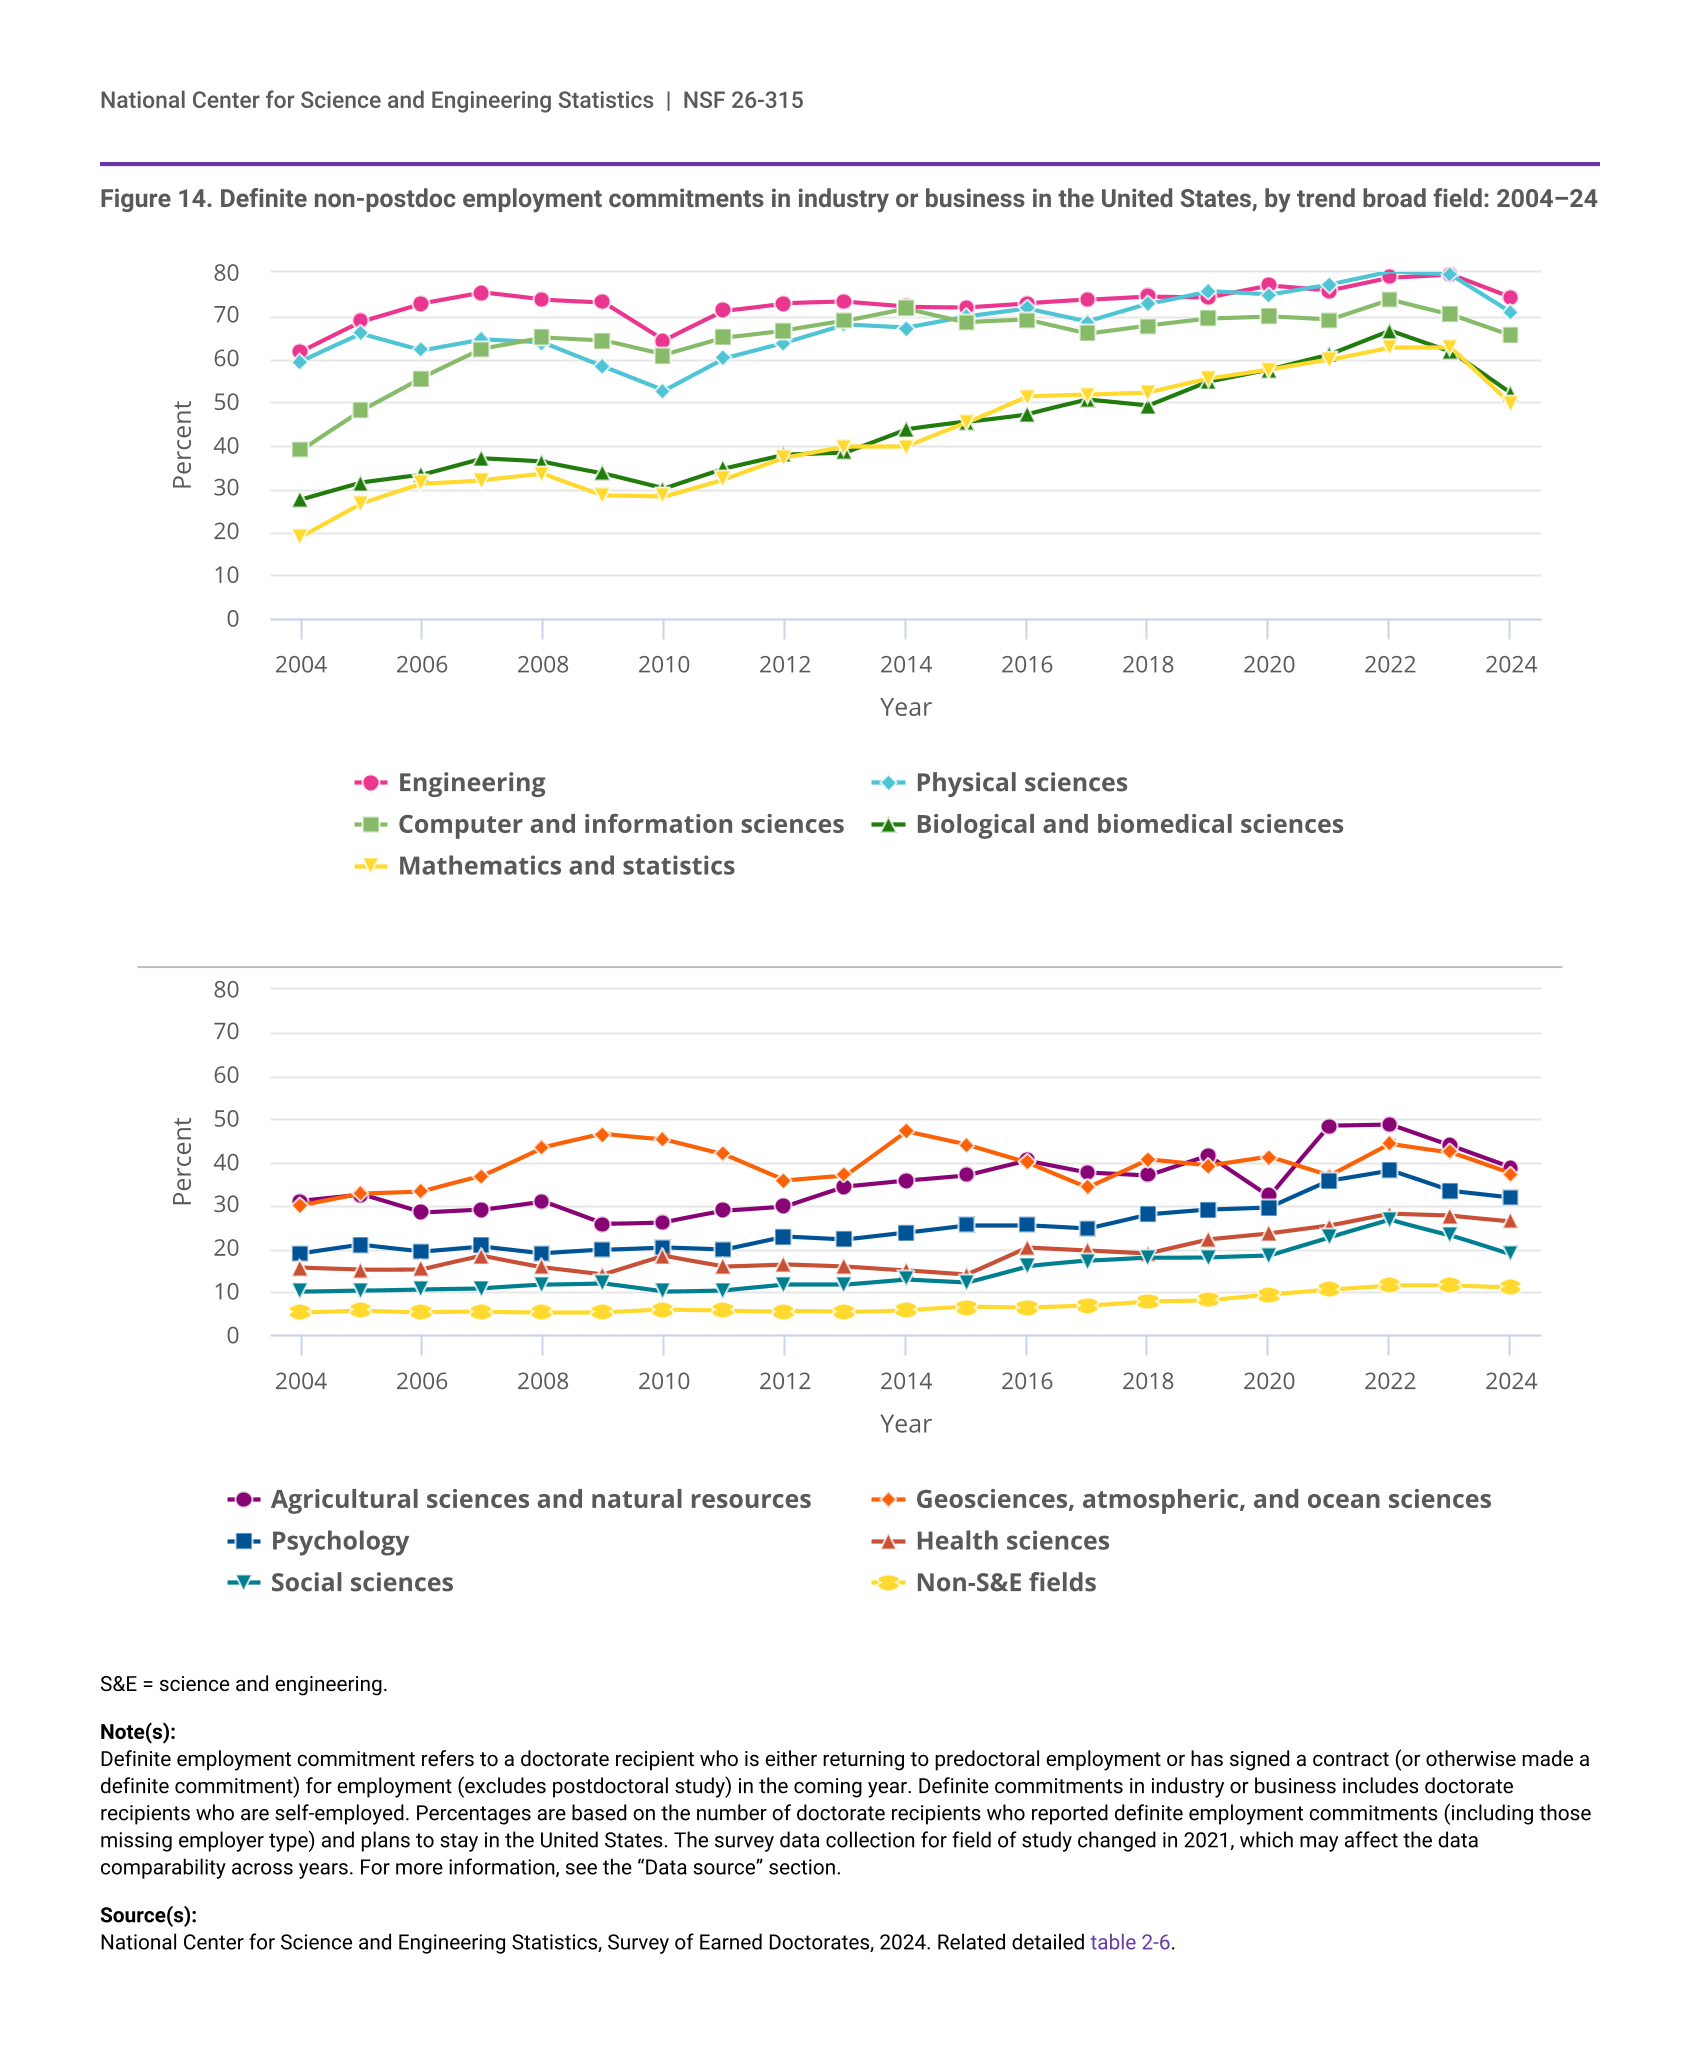
In contrast to the decline in definite non-postdoc employment commitments in academia, the proportion of doctorate recipients with non-postdoc commitments in industry or business in the United States more than doubled since 2004, comprising 40% of all 2024 doctorate recipient employment commitments. Definite commitments in industry or business have become more prevalent in all fields. In 2004, only physical sciences (60%) and engineering (62%) had more than half of their doctorate recipients commit to non-postdoc employment positions in industry or business (figure 14). By 2024, several more fields had nearly 50% or more of their doctorate recipients commit to industry or business positions: computer and information sciences, biological and biomedical sciences, and mathematics and statistics. In comparison, 26% of the doctorate recipients in health sciences and 19% of those in social sciences had definite commitments in industry or business—the lowest among S&E fields. While employment commitments in industry or business increased across all fields over the past 20 years, they have declined in each field since at least 2022.
| Year | Engineering | Physical sciences | Computer and information sciences | Biological and biomedical sciences | Mathematics and statistics |
|---|---|---|---|---|---|
| 2004 | 61.8 | 59.5 | 38.9 | 27.5 | 18.9 |
| 2005 | 68.7 | 65.8 | 48.0 | 31.4 | 26.6 |
| 2006 | 72.9 | 62.0 | 55.6 | 33.2 | 31.1 |
| 2007 | 75.4 | 64.5 | 62.3 | 37.0 | 31.9 |
| 2008 | 73.7 | 63.7 | 64.9 | 36.2 | 33.4 |
| 2009 | 73.1 | 58.2 | 64.2 | 33.6 | 28.5 |
| 2010 | 64.3 | 52.7 | 60.9 | 30.1 | 28.2 |
| 2011 | 71.1 | 60.1 | 64.9 | 34.7 | 32.2 |
| 2012 | 72.9 | 63.7 | 66.6 | 37.9 | 37.1 |
| 2013 | 73.2 | 67.9 | 68.8 | 38.4 | 39.7 |
| 2014 | 72.1 | 67.2 | 71.7 | 43.7 | 39.7 |
| 2015 | 72.0 | 69.8 | 68.5 | 45.4 | 45.2 |
| 2016 | 72.9 | 71.6 | 69.0 | 47.2 | 51.3 |
| 2017 | 73.7 | 68.6 | 65.8 | 50.5 | 51.7 |
| 2018 | 74.5 | 72.7 | 67.7 | 49.1 | 52.2 |
| 2019 | 74.3 | 75.7 | 69.3 | 54.7 | 55.4 |
| 2020 | 77.0 | 74.8 | 69.8 | 57.5 | 57.5 |
| 2021 | 75.8 | 77.2 | 69.0 | 61.0 | 59.8 |
| 2022 | 78.8 | 80.2 | 73.7 | 66.5 | 62.7 |
| 2023 | 79.6 | 79.4 | 70.3 | 61.7 | 62.7 |
| 2024 | 74.2 | 70.7 | 65.4 | 51.9 | 49.5 |
| Year | Agricultural sciences and natural resources | Geosciences, atmospheric, and ocean sciences | Psychology | Health sciences | Social sciences | Non-S&E fields |
|---|---|---|---|---|---|---|
| 2004 | 31.0 | 30.0 | 18.8 | 15.5 | 10.0 | 5.1 |
| 2005 | 32.5 | 32.7 | 20.8 | 15.1 | 10.3 | 5.6 |
| 2006 | 28.2 | 33.2 | 19.3 | 15.2 | 10.6 | 5.2 |
| 2007 | 28.9 | 36.8 | 20.5 | 18.3 | 10.8 | 5.3 |
| 2008 | 30.9 | 43.4 | 18.9 | 15.7 | 11.6 | 5.2 |
| 2009 | 25.7 | 46.5 | 19.7 | 14.0 | 11.9 | 5.2 |
| 2010 | 26.1 | 45.3 | 20.3 | 18.3 | 10.0 | 5.8 |
| 2011 | 28.7 | 41.8 | 19.8 | 15.9 | 10.3 | 5.6 |
| 2012 | 29.7 | 35.8 | 22.8 | 16.4 | 11.6 | 5.5 |
| 2013 | 34.3 | 36.9 | 22.1 | 15.9 | 11.6 | 5.3 |
| 2014 | 35.7 | 47.1 | 23.7 | 15.0 | 12.8 | 5.7 |
| 2015 | 36.9 | 44.0 | 25.4 | 14.0 | 12.1 | 6.5 |
| 2016 | 40.3 | 39.9 | 25.4 | 20.3 | 15.9 | 6.3 |
| 2017 | 37.6 | 34.1 | 24.6 | 19.6 | 17.1 | 6.8 |
| 2018 | 36.9 | 40.6 | 27.9 | 18.9 | 17.9 | 7.8 |
| 2019 | 41.5 | 39.1 | 29.0 | 22.1 | 18.0 | 8.0 |
| 2020 | 32.1 | 41.2 | 29.5 | 23.4 | 18.4 | 9.3 |
| 2021 | 48.4 | 36.8 | 35.7 | 25.2 | 22.6 | 10.5 |
| 2022 | 48.7 | 44.2 | 38.1 | 28.0 | 26.6 | 11.5 |
| 2023 | 43.8 | 42.3 | 33.3 | 27.6 | 23.1 | 11.4 |
| 2024 | 38.7 | 37.3 | 31.8 | 26.3 | 18.6 | 10.9 |
S&E = science and engineering.
Definite employment commitment refers to a doctorate recipient who is either returning to predoctoral employment or has signed a contract (or otherwise made a definite commitment) for employment (excludes postdoctoral study) in the coming year. Definite commitments in industry or business includes doctorate recipients who are self-employed. Percentages are based on the number of doctorate recipients who reported definite employment commitments (including those missing employer type) and plans to stay in the United States. The survey data collection for field of study changed in 2021, which may affect the data comparability across years. For more information, see the “Data source” section.
National Center for Science and Engineering Statistics, Survey of Earned Doctorates, 2024. Related detailed table 2-6.
Postdoc positions
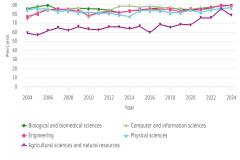
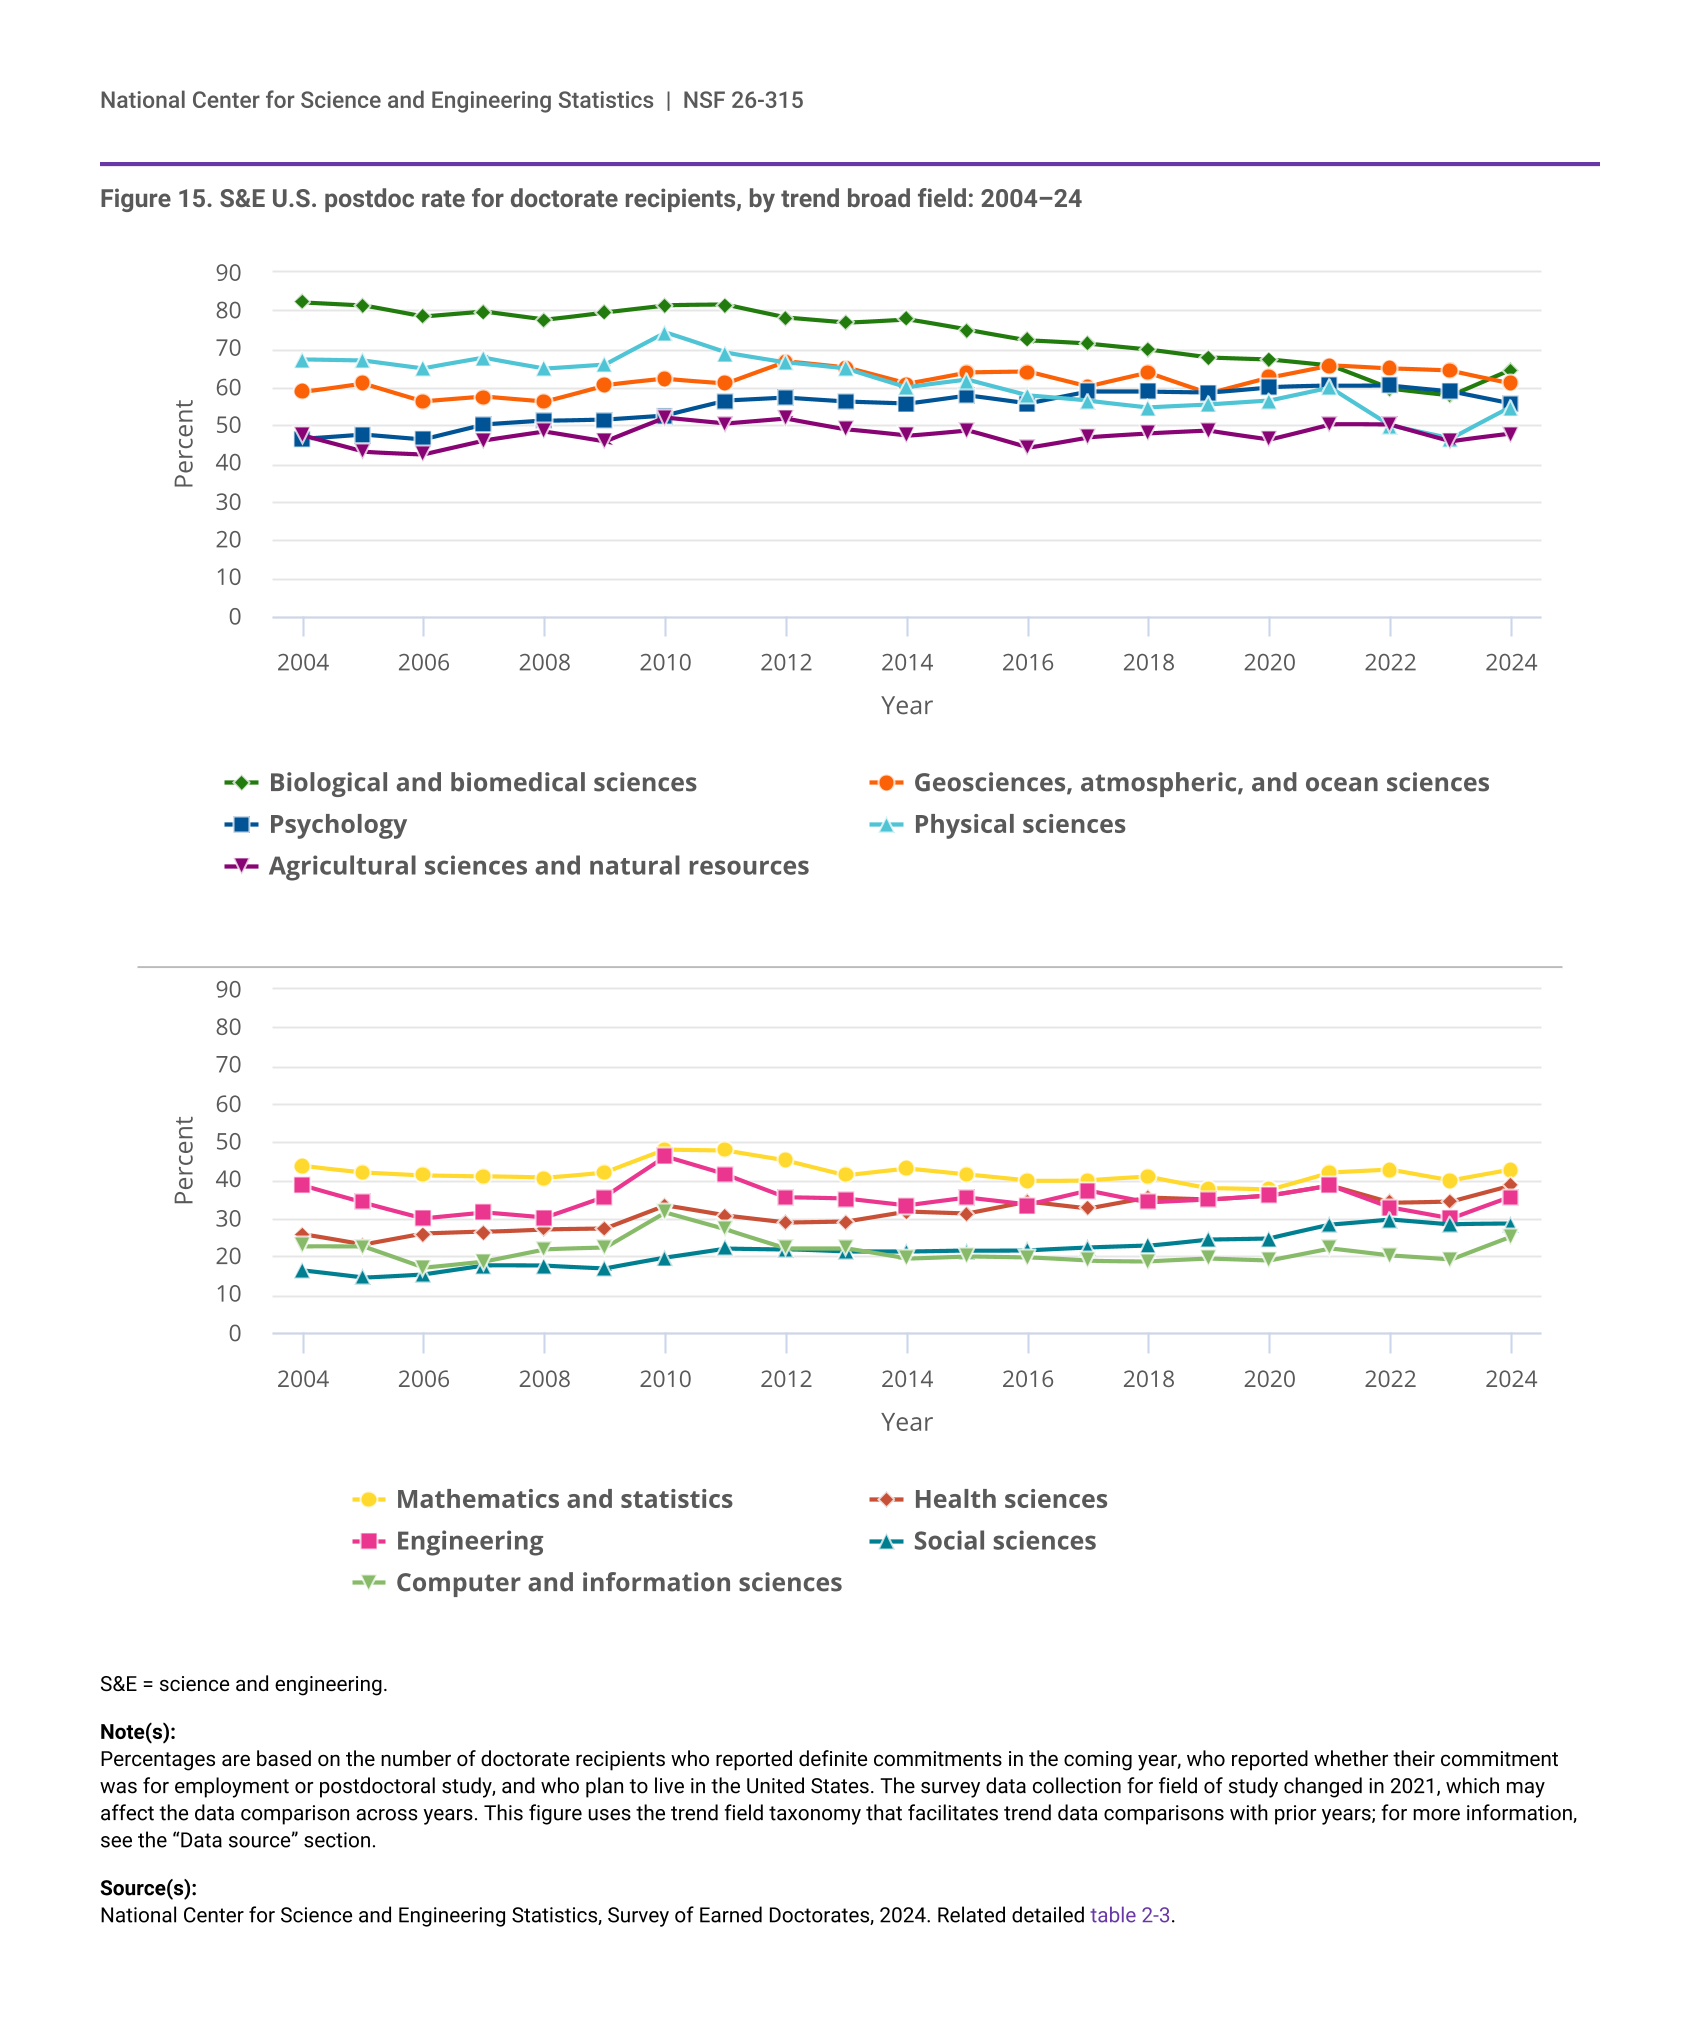
Twenty-year trends in postdoc commitments varied by field. Historically, postdoc positions have been a customary part of the early career paths of doctorate recipients in biological and biomedical sciences; physical sciences; and geosciences, atmospheric, and ocean sciences—comprising half or more of definite commitments. Although the proportions of postdoc commitments in biological and biomedical sciences and in physical sciences remained above 50%, between 2004 and 2024 they dropped 18 and 12 percentage points, respectively (figure 15). In the past 20 years, 6 of the 10 S&E broad fields experienced increases in postdoc rates. The largest increases in postdoc rates were in health sciences (13 percentage points), social sciences (12 percentage points), and psychology (9 percentage points). The postdoc rate in geosciences, atmospheric, and ocean sciences has been above 50% since at least 2004 and the rate in psychology has been above 50% since 2007. Between 2023 and 2024, the postdoc rate increased in most of the S&E broad fields. The largest increases were in physical sciences (8 percentage points), in biological and biomedical sciences (7 percentage points), and in computer and information sciences and engineering (6 percentage points each). Between 2023 and 2024, the postdoc rate decreased in geosciences, atmospheric, and ocean sciences and in psychology (3 percentage points each).
| Year | Biological and biomedical sciences | Geosciences, atmospheric, and ocean sciences | Psychology | Physical sciences | Agricultural sciences and natural resources |
|---|---|---|---|---|---|
| 2004 | 82.2 | 58.7 | 46.4 | 67.3 | 47.2 |
| 2005 | 81.4 | 61.0 | 47.6 | 67.0 | 43.0 |
| 2006 | 78.4 | 56.3 | 46.3 | 64.9 | 42.4 |
| 2007 | 79.7 | 57.5 | 50.1 | 67.6 | 46.0 |
| 2008 | 77.6 | 56.2 | 51.1 | 64.9 | 48.3 |
| 2009 | 79.6 | 60.5 | 51.5 | 66.0 | 45.7 |
| 2010 | 81.4 | 62.1 | 52.6 | 74.3 | 51.9 |
| 2011 | 81.5 | 61.0 | 56.4 | 69.0 | 50.4 |
| 2012 | 78.2 | 66.7 | 57.2 | 66.5 | 51.7 |
| 2013 | 76.9 | 65.0 | 56.2 | 64.8 | 48.9 |
| 2014 | 77.8 | 60.8 | 55.7 | 60.0 | 47.2 |
| 2015 | 75.0 | 63.8 | 57.9 | 61.9 | 48.7 |
| 2016 | 72.3 | 64.0 | 55.7 | 57.8 | 44.1 |
| 2017 | 71.4 | 60.1 | 58.8 | 56.4 | 46.9 |
| 2018 | 69.9 | 63.7 | 58.8 | 54.7 | 47.8 |
| 2019 | 67.8 | 58.4 | 58.6 | 55.4 | 48.5 |
| 2020 | 67.3 | 62.5 | 60.0 | 56.4 | 46.3 |
| 2021 | 65.7 | 65.7 | 60.3 | 59.8 | 50.3 |
| 2022 | 59.5 | 64.8 | 60.4 | 49.9 | 50.1 |
| 2023 | 57.8 | 64.2 | 58.9 | 46.5 | 45.8 |
| 2024 | 64.6 | 61.0 | 55.7 | 54.8 | 47.7 |
| Year | Mathematics and statistics | Health sciences | Engineering | Social sciences | Computer and information sciences |
|---|---|---|---|---|---|
| 2004 | 43.7 | 25.8 | 38.5 | 16.4 | 22.7 |
| 2005 | 42.1 | 23.0 | 34.1 | 14.5 | 22.6 |
| 2006 | 41.3 | 25.9 | 30.0 | 15.4 | 17.0 |
| 2007 | 41.0 | 26.4 | 31.5 | 17.7 | 18.7 |
| 2008 | 40.6 | 27.1 | 30.1 | 17.6 | 21.9 |
| 2009 | 42.1 | 27.3 | 35.7 | 16.9 | 22.3 |
| 2010 | 48.0 | 33.3 | 46.1 | 19.7 | 31.5 |
| 2011 | 47.8 | 30.6 | 41.4 | 22.1 | 27.1 |
| 2012 | 45.2 | 28.8 | 35.5 | 21.9 | 22.2 |
| 2013 | 41.3 | 29.1 | 35.1 | 21.2 | 22.2 |
| 2014 | 43.0 | 31.7 | 33.3 | 21.2 | 19.5 |
| 2015 | 41.4 | 31.2 | 35.3 | 21.5 | 20.1 |
| 2016 | 39.8 | 34.3 | 33.5 | 21.6 | 19.8 |
| 2017 | 40.0 | 32.5 | 37.2 | 22.3 | 18.9 |
| 2018 | 40.9 | 35.4 | 34.1 | 22.8 | 18.8 |
| 2019 | 37.9 | 34.9 | 34.8 | 24.5 | 19.5 |
| 2020 | 37.4 | 36.0 | 35.9 | 24.8 | 19.0 |
| 2021 | 42.0 | 38.6 | 38.6 | 28.3 | 22.1 |
| 2022 | 42.8 | 34.1 | 32.8 | 29.7 | 20.2 |
| 2023 | 40.0 | 34.5 | 29.9 | 28.4 | 19.1 |
| 2024 | 42.8 | 38.7 | 35.6 | 28.5 | 25.1 |
S&E = science and engineering.
Percentages are based on the number of doctorate recipients who reported definite commitments in the coming year, who reported whether their commitment was for employment or postdoctoral study, and who plan to live in the United States. The survey data collection for field of study changed in 2021, which may affect the data comparison across years. This figure uses the trend field taxonomy that facilitates trend data comparisons with prior years; for more information, see the “Data source” section.
National Center for Science and Engineering Statistics, Survey of Earned Doctorates, 2024. Related detailed table 2-3.
Temporary visa holders
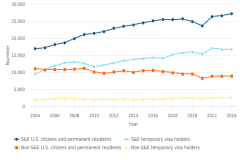
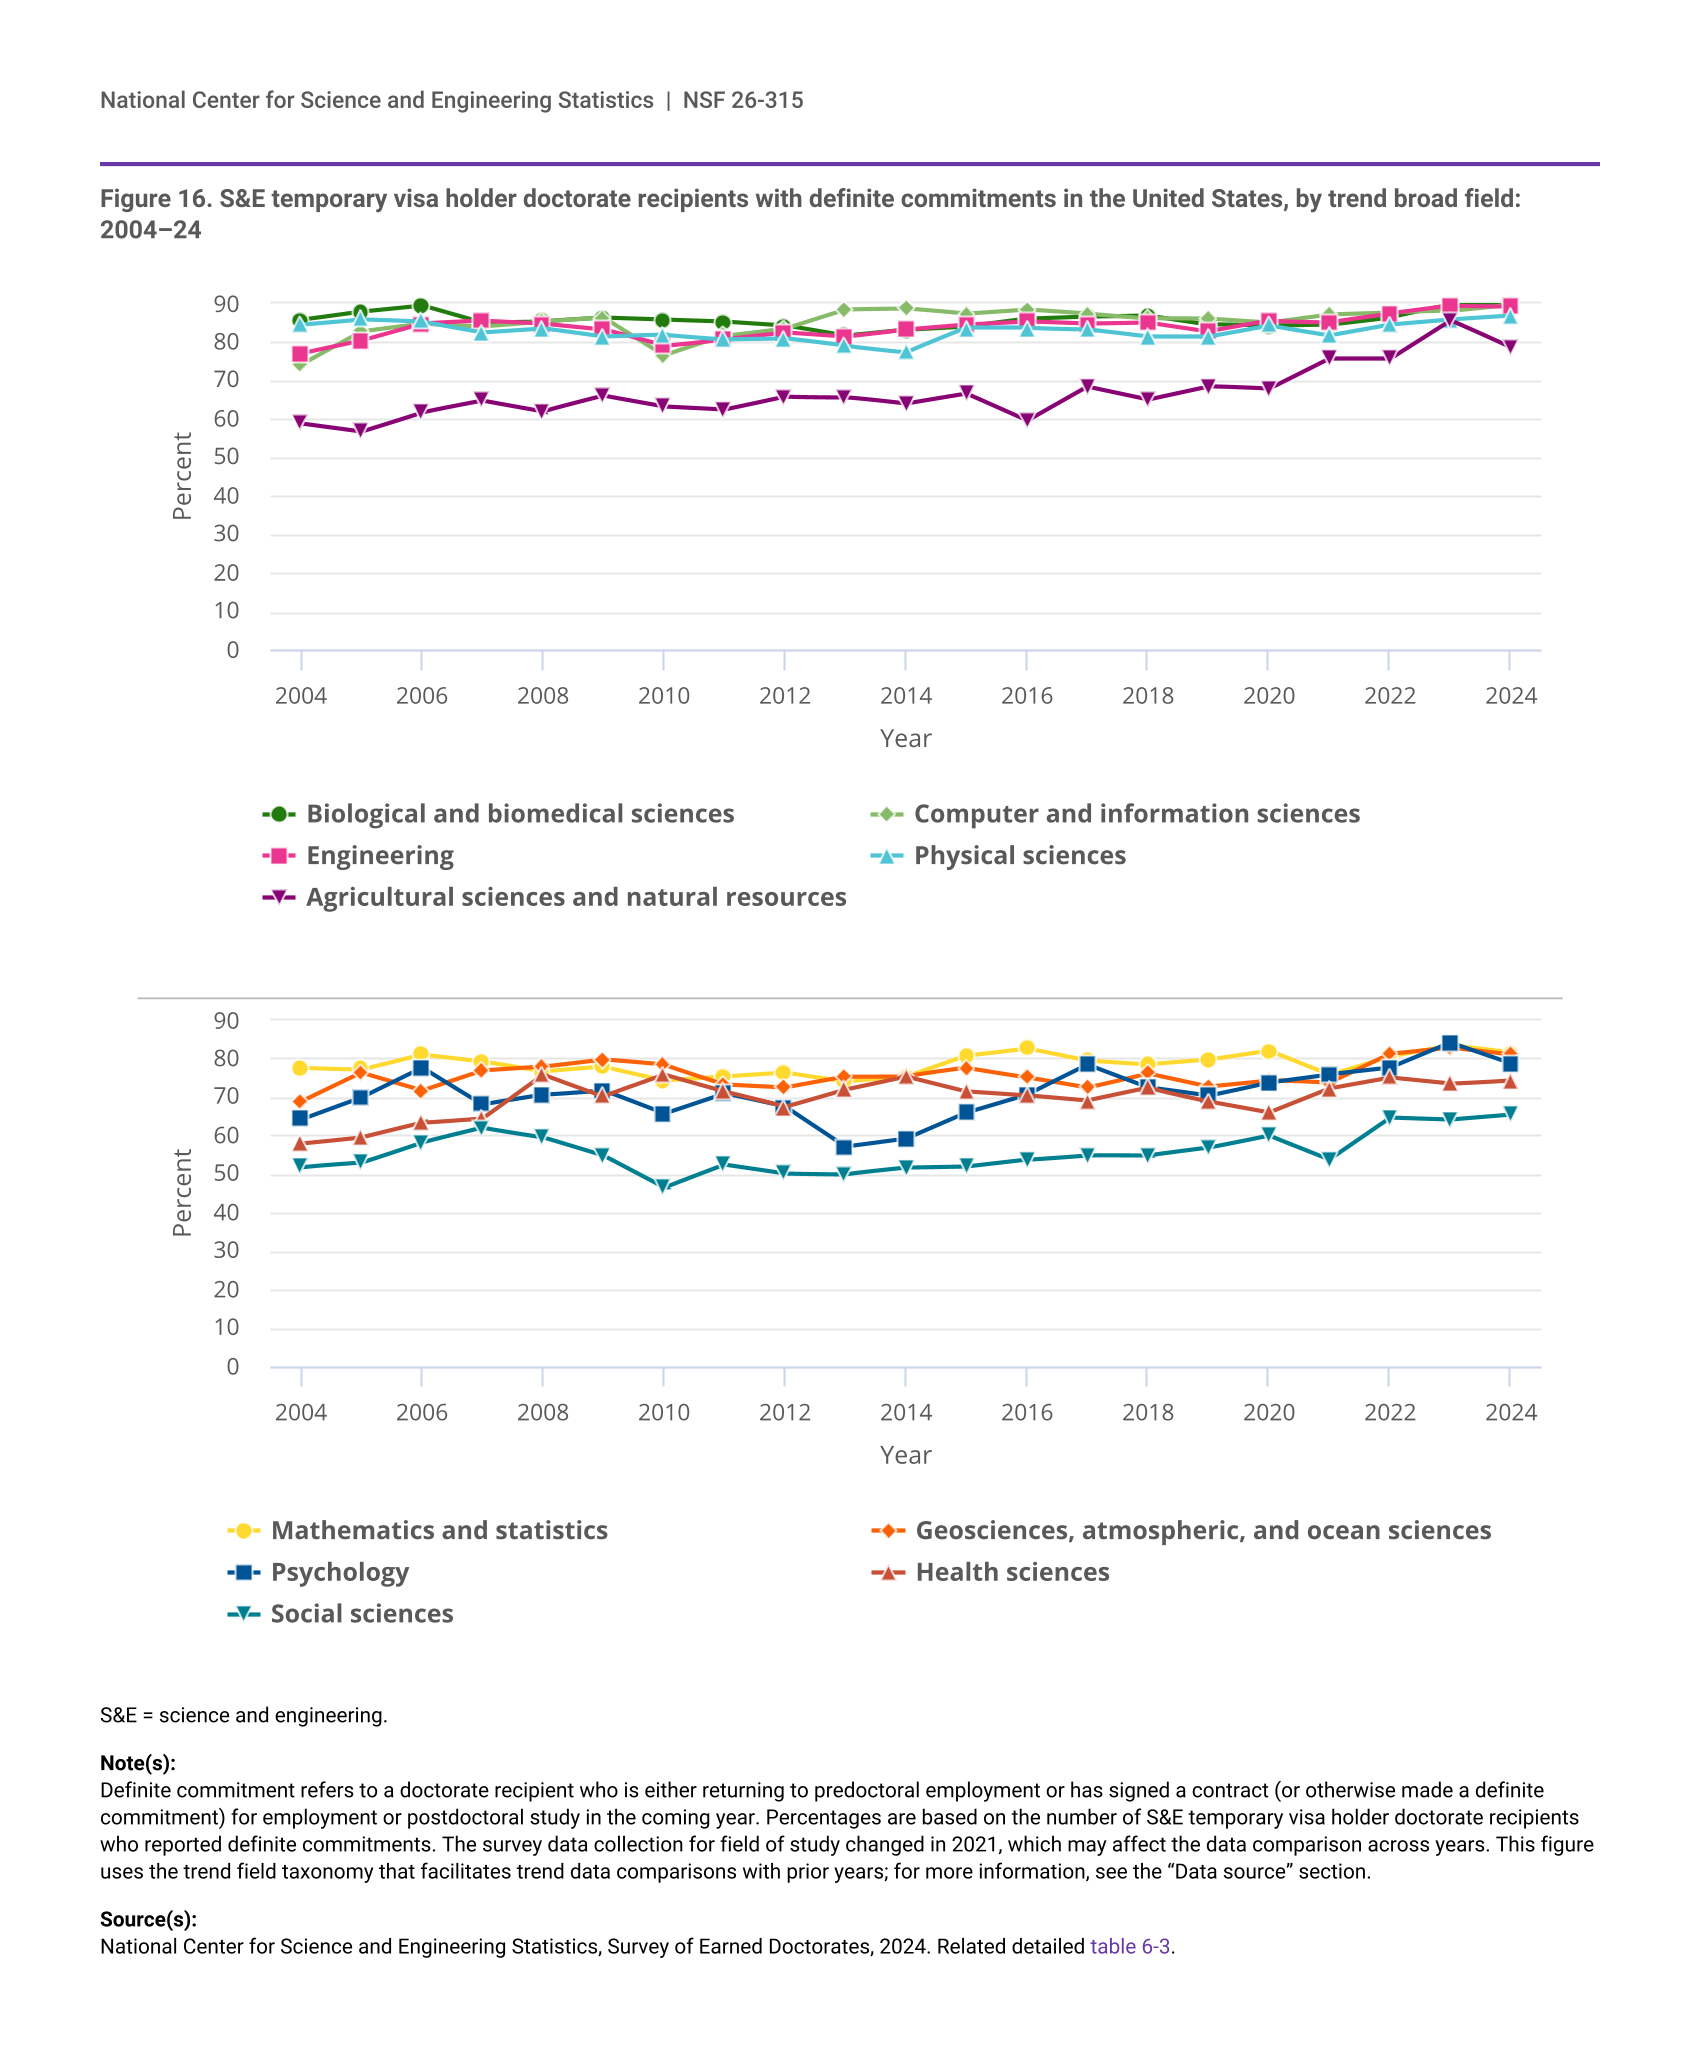
Among S&E doctorate recipients who are temporary visa holders, the proportion reporting definite commitments in the United States after earning a doctoral degree generally increased from 2004 to 2024. In 2024, 85% of S&E temporary visa holder doctorate recipients with definite commitments reported that the location of their postdoc or employment position was in the United States, up from 75% in 2004. Between 2004 and 2024, the largest increase in the expected stay rate (see “Glossary”) of temporary visa holder doctorate recipients was in agricultural sciences and natural resources (20 percentage points); the smallest was in physical sciences (2 percentage points) (figure 16).
In 2024, in all S&E fields, the majority of temporary visa holder doctorate recipients expected to stay in the United States. Expected stay rates were over 80% in 6 out of the 10 S&E fields. The highest rates were in biological and biomedical sciences (90%), computer and information sciences (90%), engineering (89%), and physical sciences (87%); the lowest were among doctorate recipients in health sciences (74%) and social sciences (65%). Between 2023 and 2024, stay rates increased between 1 and 2 percentage points in most S&E fields but declined by 7 percentage points in agricultural and natural resources, by 5 percentage points in psychology, and by 2 percentage points each in mathematics and statistics and in geosciences, atmospheric, and ocean sciences.
| Year | Biological and biomedical sciences | Computer and information sciences | Engineering | Physical sciences | Agricultural sciences and natural resources |
|---|---|---|---|---|---|
| 2004 | 85.8 | 74.2 | 77.1 | 84.6 | 58.9 |
| 2005 | 88.0 | 82.8 | 80.4 | 86.0 | 56.8 |
| 2006 | 89.6 | 84.8 | 84.8 | 85.4 | 61.8 |
| 2007 | 85.1 | 84.1 | 85.5 | 82.6 | 64.8 |
| 2008 | 85.4 | 85.4 | 84.8 | 83.6 | 62.0 |
| 2009 | 86.3 | 86.4 | 83.3 | 81.4 | 66.0 |
| 2010 | 85.8 | 76.6 | 79.0 | 81.9 | 63.2 |
| 2011 | 85.3 | 81.6 | 80.8 | 80.8 | 62.4 |
| 2012 | 84.3 | 83.6 | 82.5 | 81.0 | 65.8 |
| 2013 | 81.6 | 88.6 | 81.4 | 79.0 | 65.7 |
| 2014 | 83.2 | 88.8 | 83.3 | 77.4 | 63.9 |
| 2015 | 84.1 | 87.4 | 84.6 | 83.7 | 66.5 |
| 2016 | 86.1 | 88.5 | 85.4 | 83.7 | 59.5 |
| 2017 | 86.7 | 87.4 | 84.8 | 83.4 | 68.4 |
| 2018 | 87.0 | 86.2 | 85.1 | 81.5 | 65.1 |
| 2019 | 84.7 | 86.1 | 82.8 | 81.5 | 68.5 |
| 2020 | 84.3 | 85.1 | 85.5 | 84.4 | 67.8 |
| 2021 | 84.6 | 87.2 | 85.2 | 81.8 | 75.7 |
| 2022 | 86.5 | 87.7 | 87.4 | 84.6 | 75.7 |
| 2023 | 89.7 | 88.1 | 89.4 | 85.9 | 85.7 |
| 2024 | 90.4 | 89.9 | 89.3 | 86.9 | 78.5 |
| Year | Mathematics and statistics | Geosciences, atmospheric, and ocean sciences | Psychology | Health sciences | Social sciences |
|---|---|---|---|---|---|
| 2004 | 77.6 | 68.8 | 64.3 | 57.9 | 51.8 |
| 2005 | 77.3 | 76.3 | 70.0 | 59.5 | 52.9 |
| 2006 | 81.2 | 71.7 | 77.7 | 63.3 | 58.2 |
| 2007 | 79.4 | 76.9 | 68.1 | 64.5 | 62.0 |
| 2008 | 76.7 | 77.9 | 70.6 | 75.9 | 59.6 |
| 2009 | 77.9 | 79.8 | 71.8 | 70.3 | 54.8 |
| 2010 | 74.4 | 78.4 | 65.7 | 75.8 | 46.5 |
| 2011 | 75.4 | 73.4 | 71.0 | 71.4 | 52.5 |
| 2012 | 76.4 | 72.6 | 67.5 | 67.5 | 50.2 |
| 2013 | 74.1 | 75.4 | 57.1 | 72.1 | 50.0 |
| 2014 | 75.3 | 75.5 | 59.2 | 75.5 | 51.6 |
| 2015 | 80.8 | 77.6 | 66.0 | 71.6 | 51.9 |
| 2016 | 82.7 | 75.2 | 70.7 | 70.5 | 53.7 |
| 2017 | 79.5 | 72.5 | 78.5 | 69.1 | 54.9 |
| 2018 | 78.5 | 76.2 | 72.6 | 72.4 | 54.8 |
| 2019 | 79.7 | 72.8 | 70.4 | 69.0 | 56.8 |
| 2020 | 82.1 | 74.4 | 73.9 | 66.1 | 60.0 |
| 2021 | 75.9 | 73.7 | 76.0 | 72.3 | 53.8 |
| 2022 | 80.7 | 81.3 | 77.7 | 75.1 | 64.6 |
| 2023 | 83.5 | 83.0 | 84.2 | 73.5 | 64.1 |
| 2024 | 81.5 | 81.2 | 78.8 | 74.4 | 65.4 |
S&E = science and engineering.
Definite commitment refers to a doctorate recipient who is either returning to predoctoral employment or has signed a contract (or otherwise made a definite commitment) for employment or postdoctoral study in the coming year. Percentages are based on the number of S&E temporary visa holder doctorate recipients who reported definite commitments. The survey data collection for field of study changed in 2021, which may affect the data comparison across years. This figure uses the trend field taxonomy that facilitates trend data comparisons with prior years; for more information, see the “Data source” section.
National Center for Science and Engineering Statistics, Survey of Earned Doctorates, 2024. Related detailed table 6-3.