 An official website of the United States government
 Student Learning in Mathematics and Science
The COVID-19 pandemic led to severe disruptions in K–12 student learning beginning with the abrupt switch to remote instruction for the majority of schools and students in March 2020. Specifically, in spring 2020, 77% of public schools reported that they transitioned to online remote instruction, and 83% of public school teachers reported that all or some of their classes were moved to online distance-learning formats (Berger et al. 2022). Schools began a slow transition back to in-person instruction during the 2020–21 school year, although only about half of fourth- and eighth-grade public school students attended full-time, in-person classes by the end of May 2021. That percentage had increased to nearly 100% by spring 2022 (National Center for Education Statistics [NCES] 2022).
Assessment data released in 2022 by the National Assessment of Educational Progress (NAEP) show sharp declines in student mathematics performance compared with pre-pandemic scores. These data also show a disproportionate negative impact of COVID-19 on assessment scores for students living in poverty and for students from historically marginalized racial and ethnic groups who are underrepresented in the STEM workforce. The use of assessment data to understand the impact of disrupted learning is critical as policymakers, school systems, state leaders, educators, and parents seek ways to support students who were affected by school-related closures and learning disruptions during the pandemic. This section of the report will focus on indicators related to the impact of COVID-19 on elementary and secondary students and an analysis of student performance in an international context in 2019 prior to the pandemic.
National Trends in K–12 Student Achievement
Overall Scores Declined in 2022 following Disrupted Learning in 2020
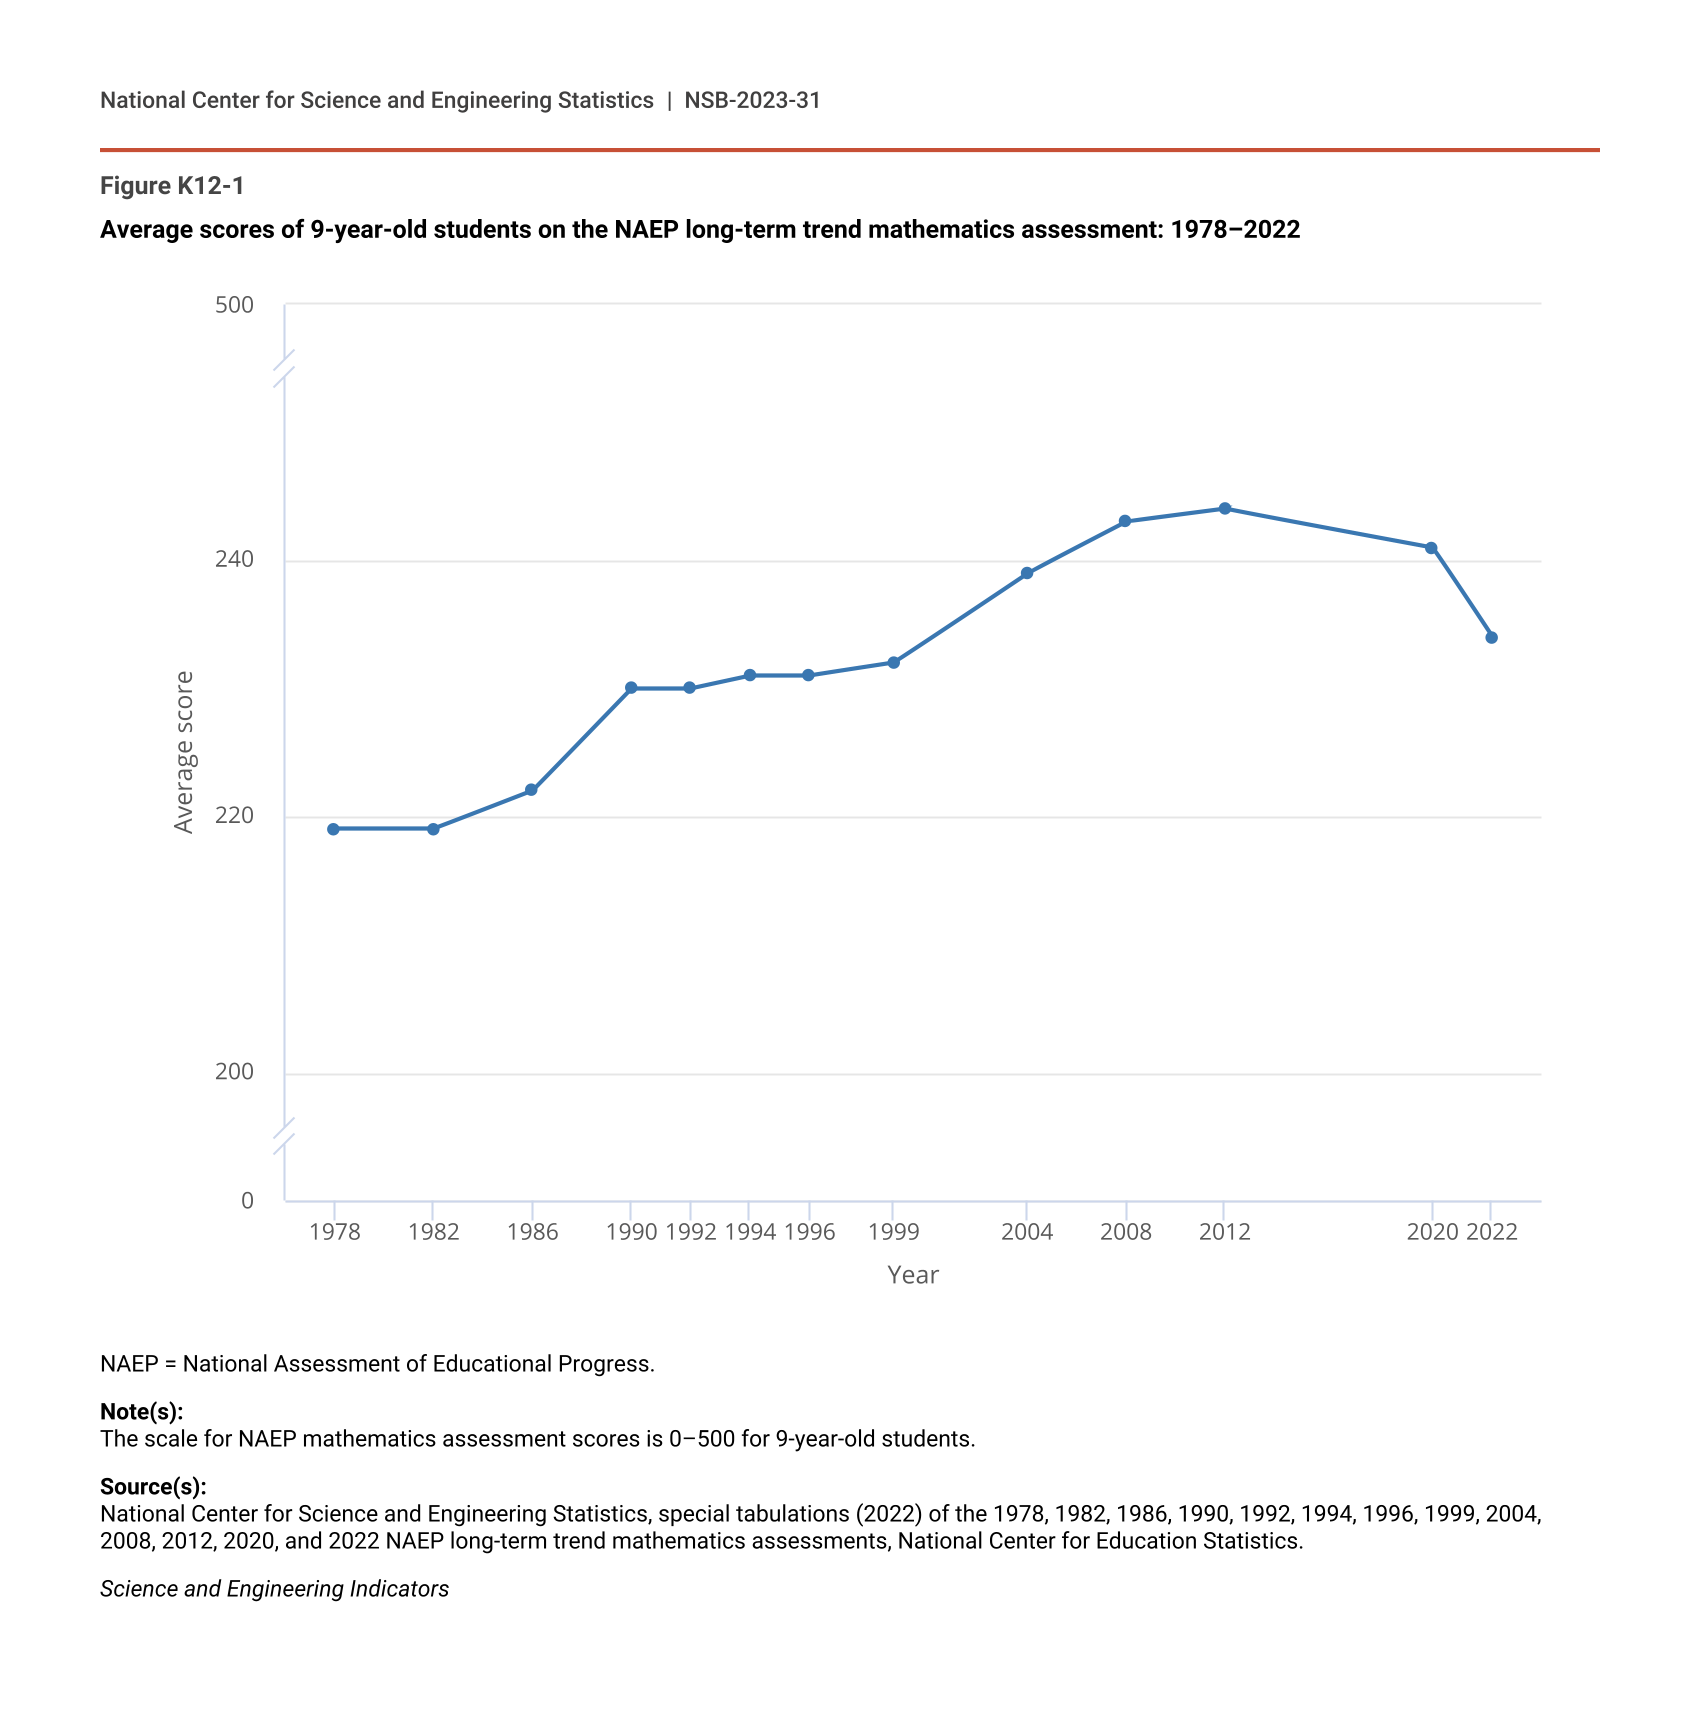
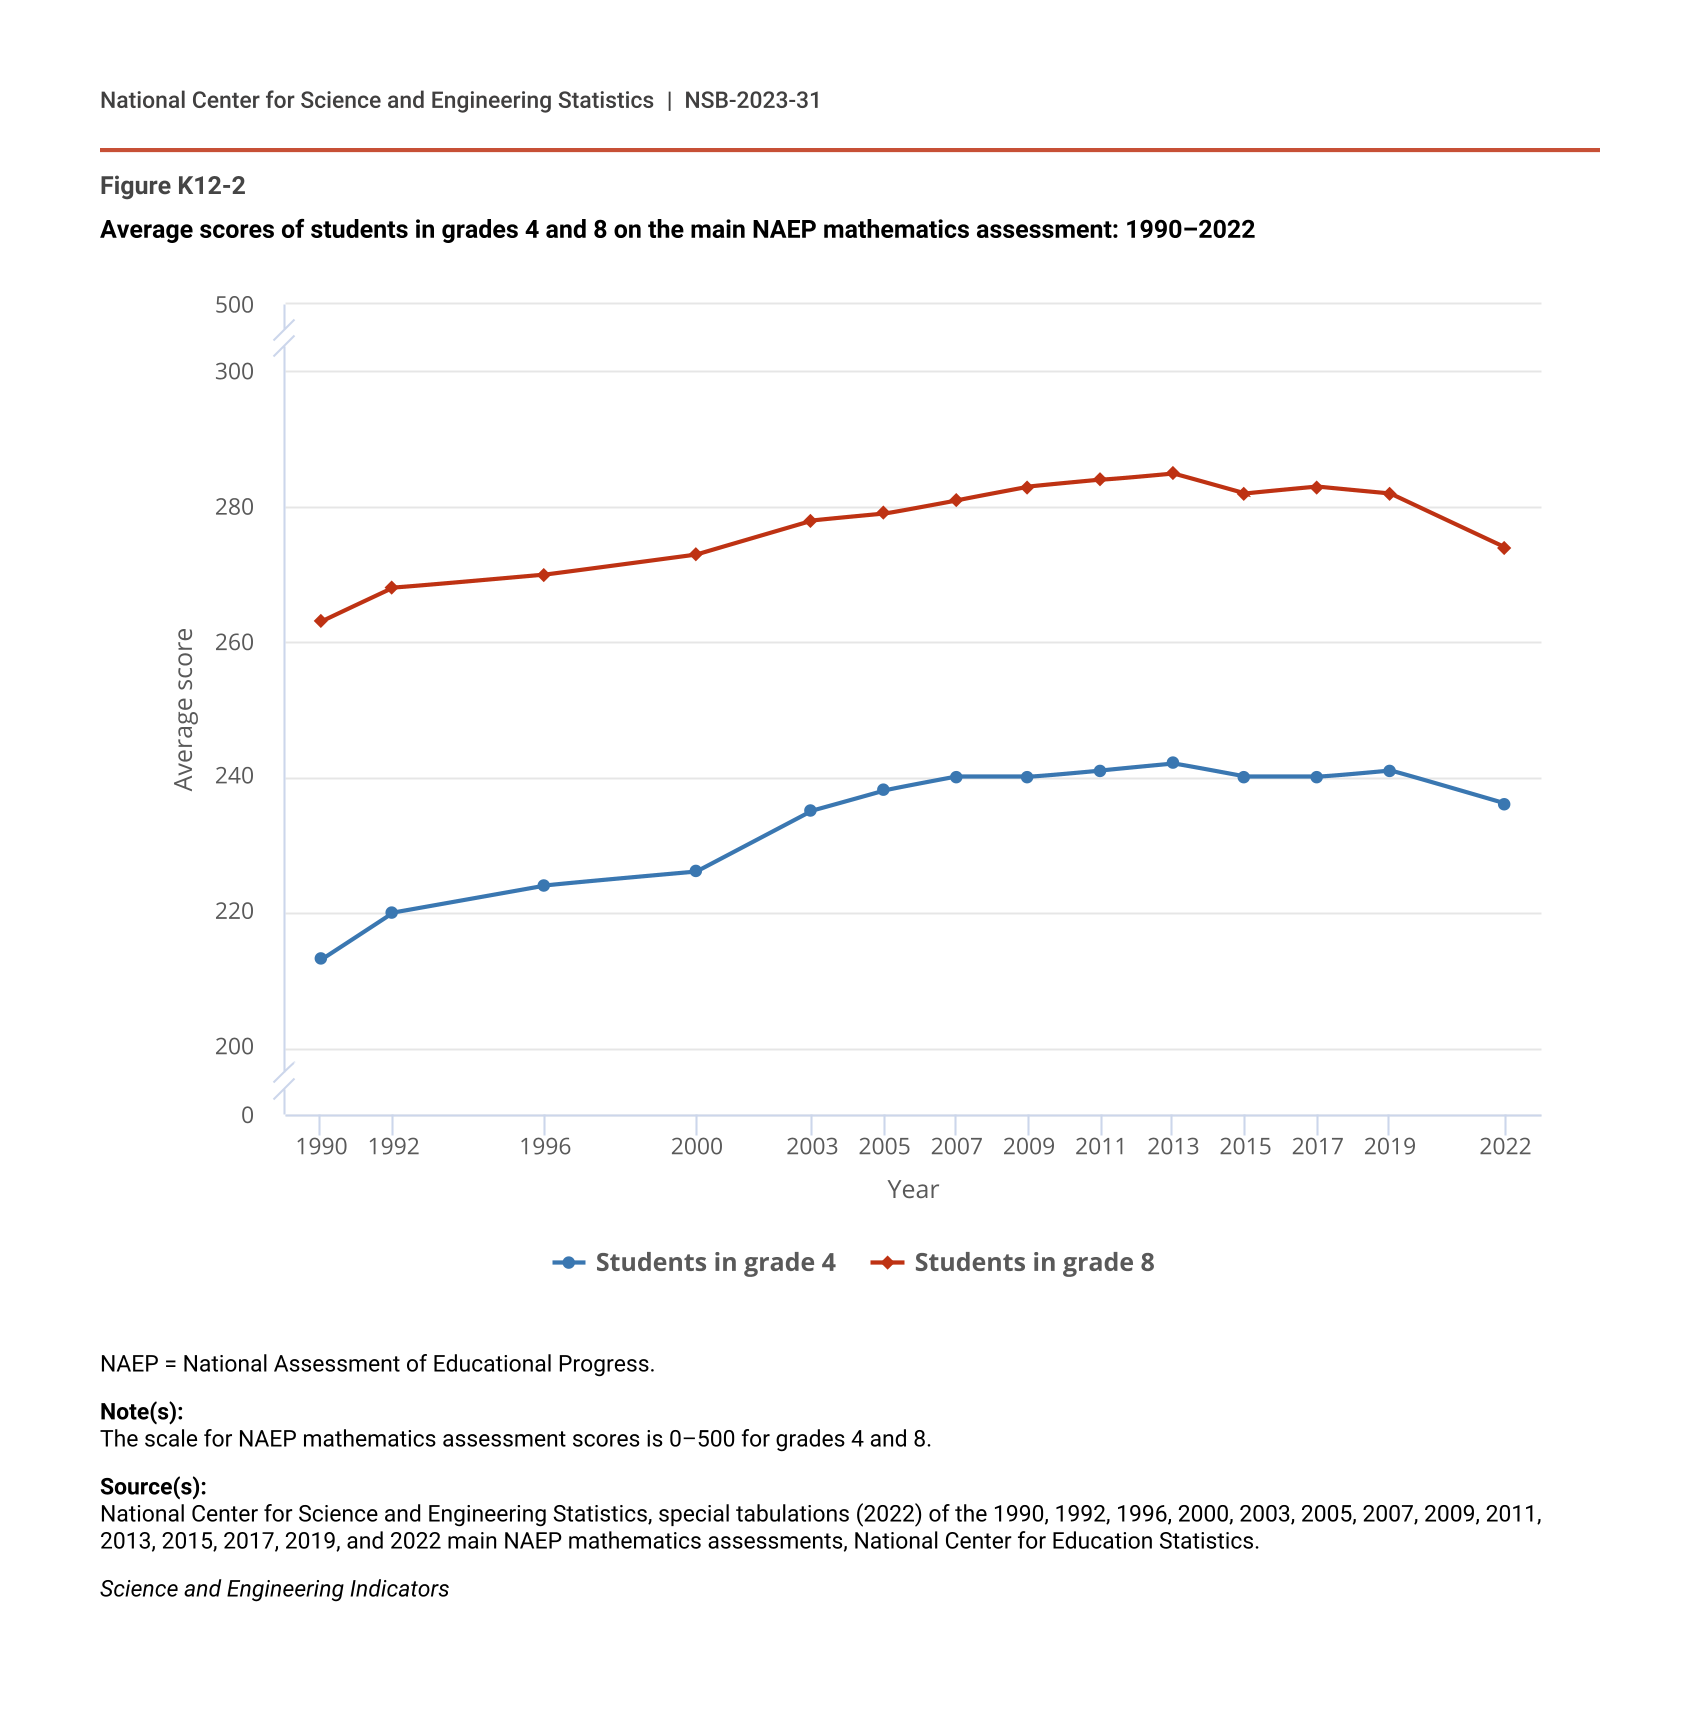
Assessment data indicate that the COVID-19 pandemic set national educational progress in mathematics back approximately 20 years in terms of point drops in NAEP assessment scores. The NAEP data collected in 2022 show sharp declines in fourth- and eighth-grade student mathematics performance compared with pre-pandemic scores. The NAEP long-term trend (LTT) assessment in mathematics shows a 7-point drop among 9-year-old students from 2020 to 2022 (Figure K12-1). The main NAEP assessment in mathematics shows a 5-point drop among fourth graders and an 8-point drop among eighth graders from 2019 to 2022 (Figure K12-2). These average mathematics scores in 2022 are lower than scores going back to 2004 for 9-year-olds, 2005 for fourth graders, and 2003 for eighth graders.
Average scores of 9-year-old students on the NAEP long-term trend mathematics assessment: 1978–2022
| Year | All 9-year-old students |
|---|---|
| 1978 | 219 |
| 1982 | 219 |
| 1986 | 222 |
| 1990 | 230 |
| 1992 | 230 |
| 1994 | 231 |
| 1996 | 231 |
| 1999 | 232 |
| 2004 | 239 |
| 2008 | 243 |
| 2012 | 244 |
| 2020 | 241 |
| 2022 | 234 |
NAEP = National Assessment of Educational Progress.
Note(s):
The scale for NAEP mathematics assessment scores is 0–500 for 9-year-old students.
Source(s):
National Center for Science and Engineering Statistics, special tabulations (2022) of the 1978, 1982, 1986, 1990, 1992, 1994, 1996, 1999, 2004, 2008, 2012, 2020, and 2022 NAEP long-term trend mathematics assessments, National Center for Education Statistics.
Science and Engineering Indicators
Average scores of students in grades 4 and 8 on the main NAEP mathematics assessment: 1990–2022
| Year | Students in grade 4 | Students in grade 8 |
|---|---|---|
| 1990 | 213 | 263 |
| 1992 | 220 | 268 |
| 1996 | 224 | 270 |
| 2000 | 226 | 273 |
| 2003 | 235 | 278 |
| 2005 | 238 | 279 |
| 2007 | 240 | 281 |
| 2009 | 240 | 283 |
| 2011 | 241 | 284 |
| 2013 | 242 | 285 |
| 2015 | 240 | 282 |
| 2017 | 240 | 283 |
| 2019 | 241 | 282 |
| 2022 | 236 | 274 |
NAEP = National Assessment of Educational Progress.
Note(s):
The scale for NAEP mathematics assessment scores is 0–500 for grades 4 and 8.
Source(s):
National Center for Science and Engineering Statistics, special tabulations (2022) of the 1990, 1992, 1996, 2000, 2003, 2005, 2007, 2009, 2011, 2013, 2015, 2017, 2019, and 2022 main NAEP mathematics assessments, National Center for Education Statistics.
Science and Engineering Indicators
Score Differences, by Student Groups in Fourth and Eighth Grades in 2022
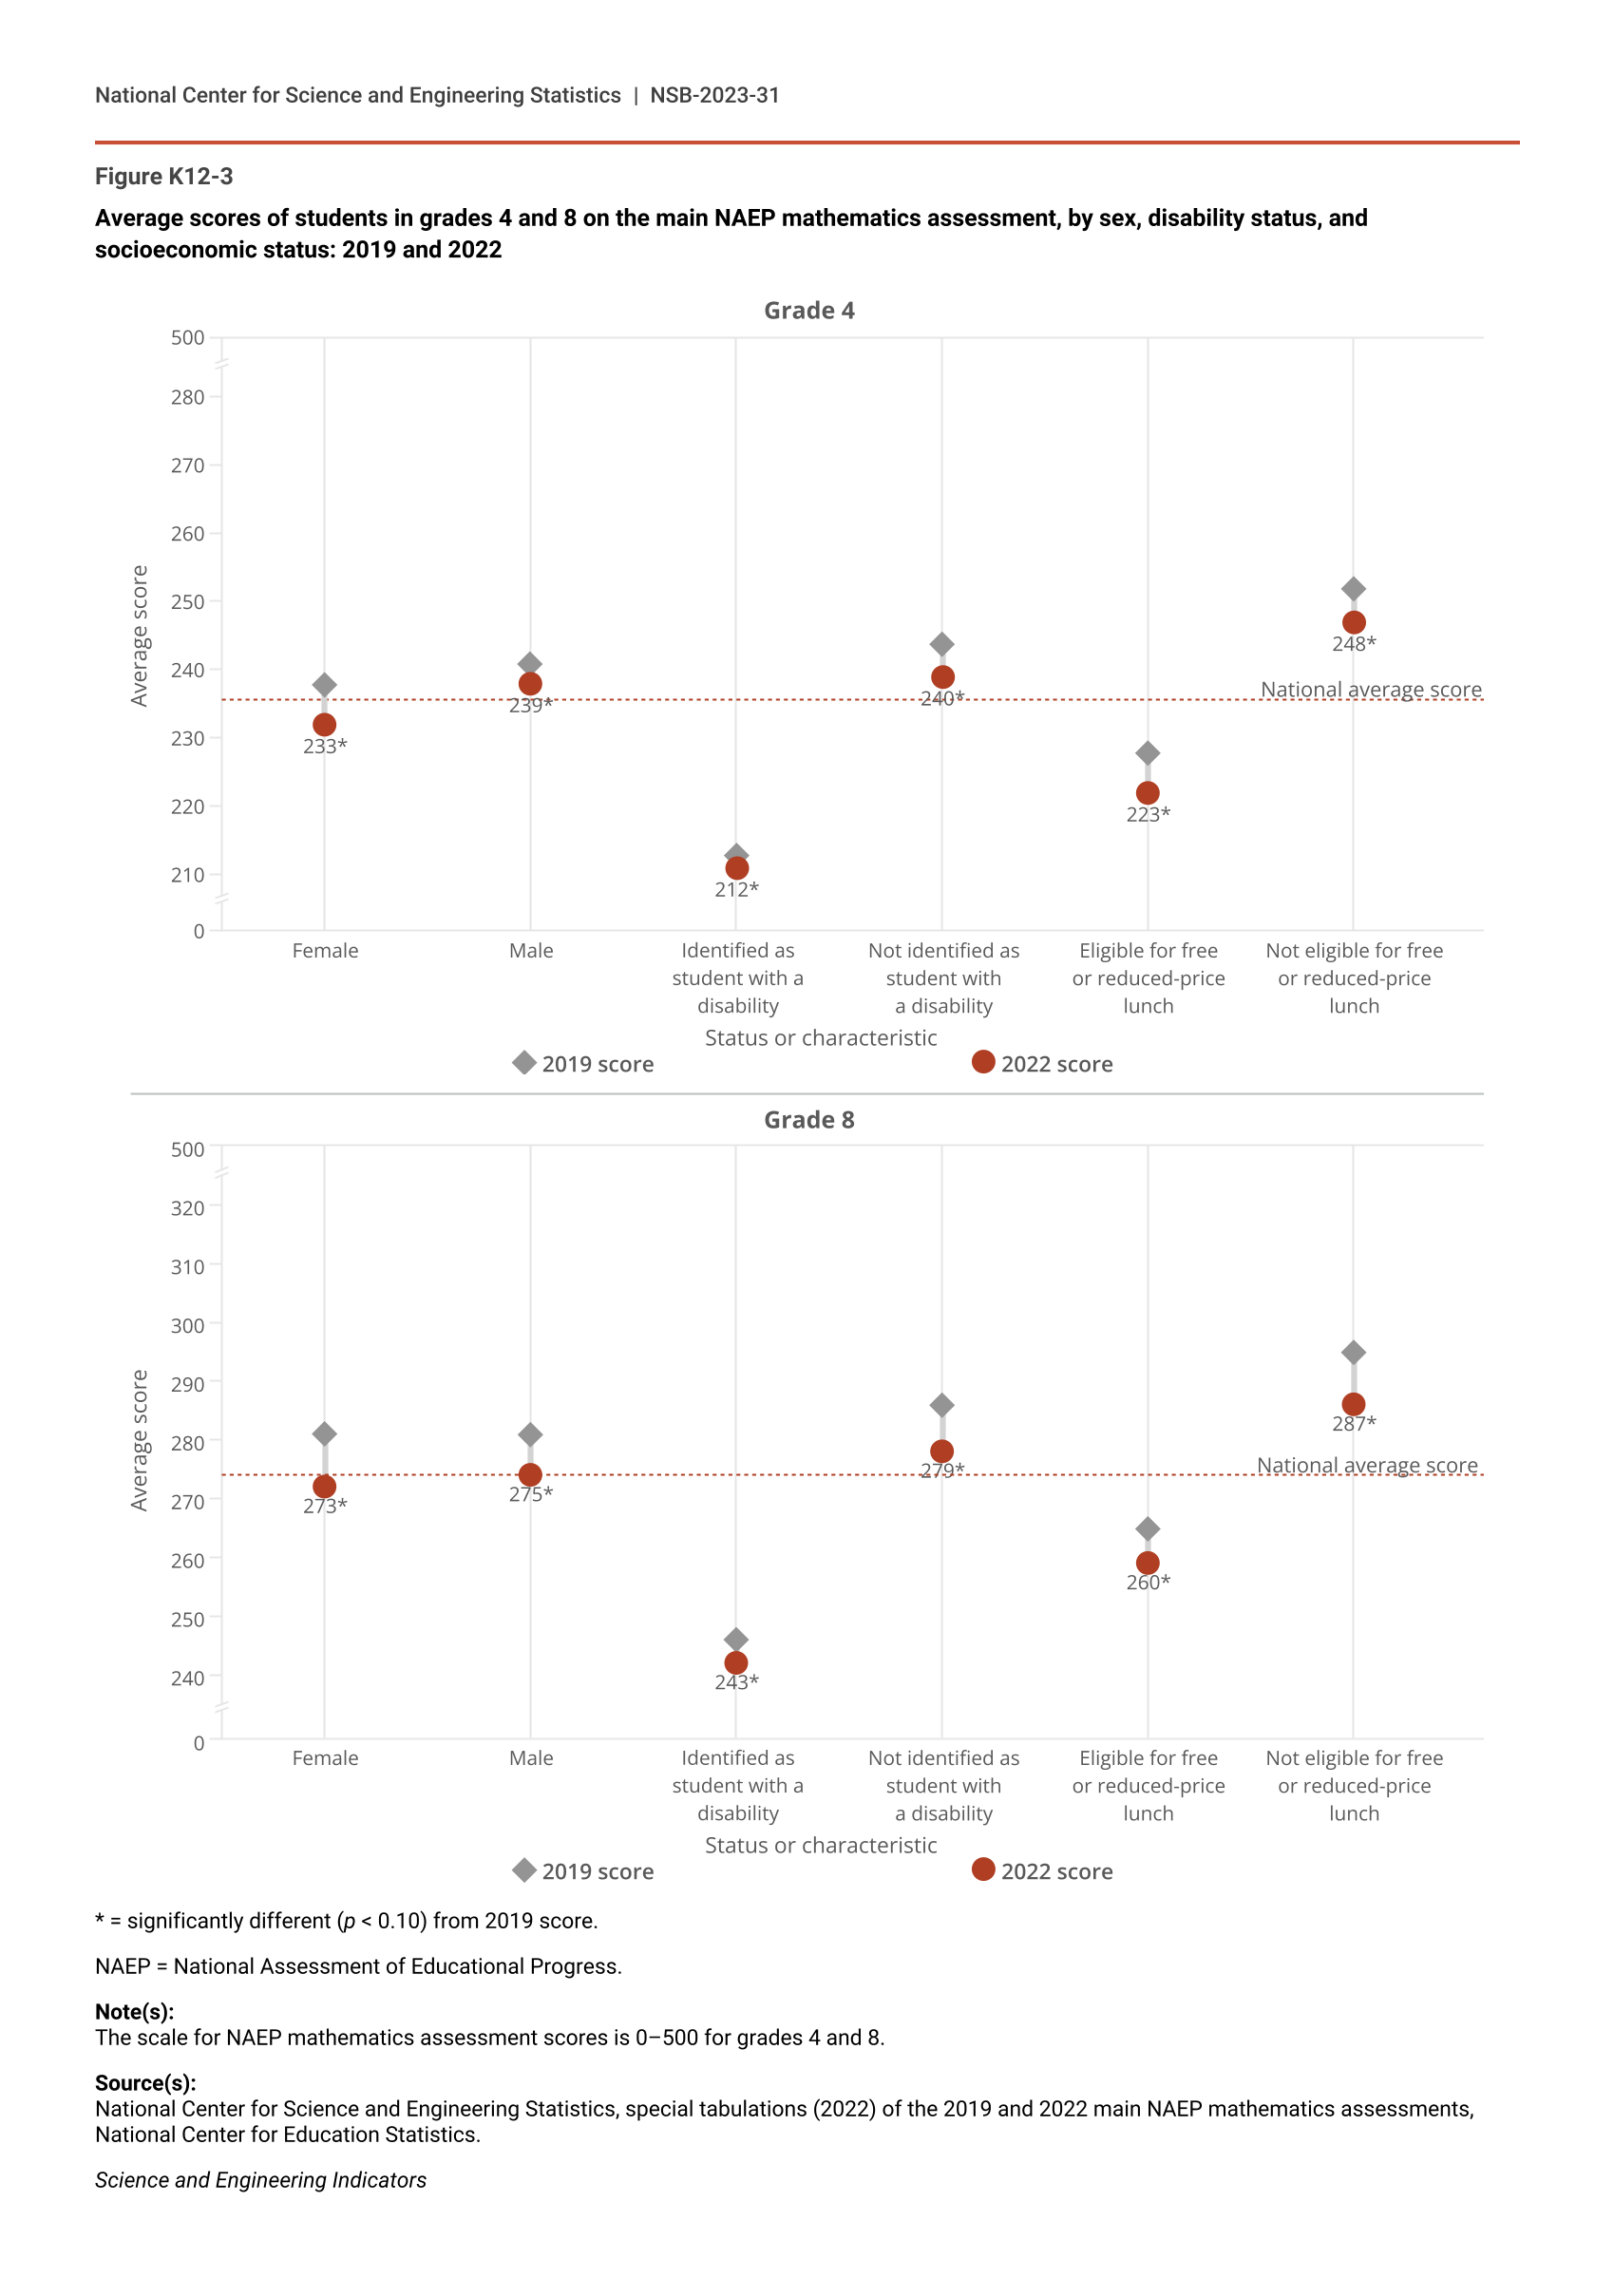
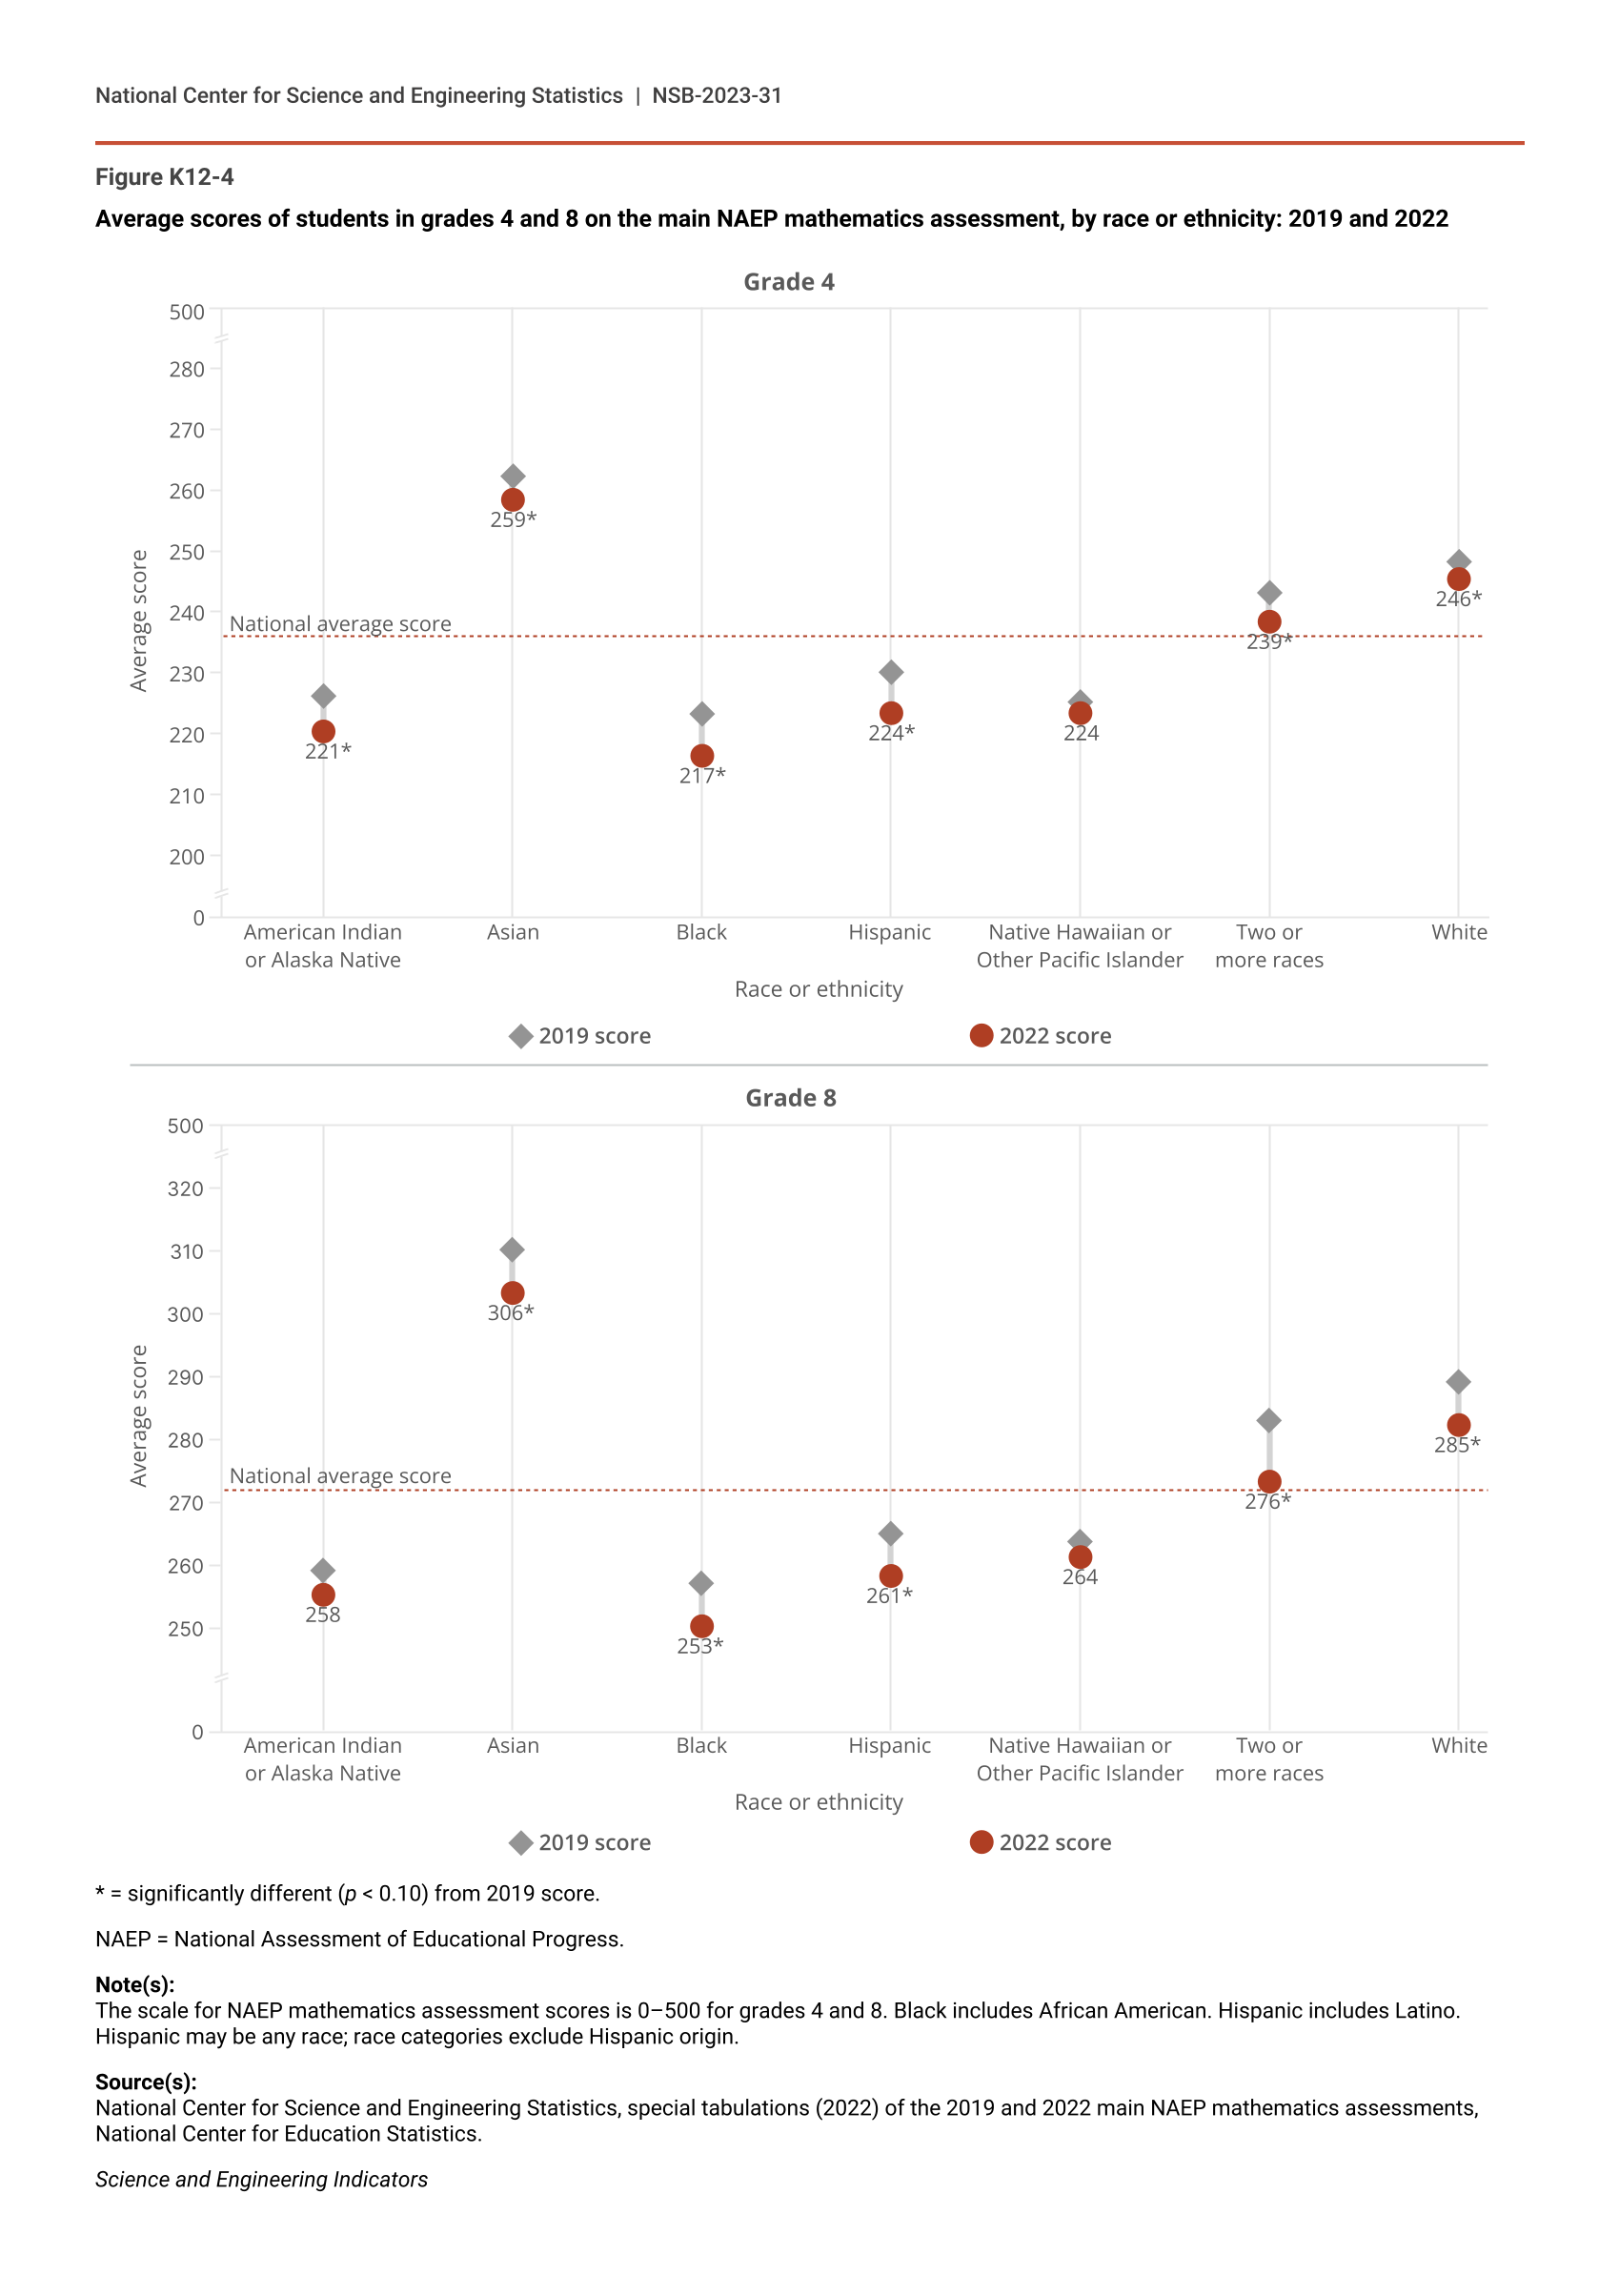
In addition to illustrating the differences in scores from 2019 to 2022, an examination of 2022 main NAEP scores reveals differences within student groups. Male students scored higher than female students in the fourth and eighth grades, with differences of 6 points in 2022 and 3 points in 2019, respectively (Figure K12-3). Students eligible for free or reduced-price lunch at both grade levels scored approximately 25 points lower than students not eligible for free or reduced-price lunch. Score differences by race or ethnicity ranged from 42 points in fourth grade to 53 points in eighth grade, with Asian students at the high end and Black students at the low end of the distribution (Figure K12-4). An analysis of score differences by race or ethnicity within school lunch categories shows that these score differences exist regardless of lunch eligibility status (Table K12-1).
Average scores of students in grades 4 and 8 on the main NAEP mathematics assessment, by sex, disability status, and socioeconomic status: 2019 and 2022
* = significantly different (p < 0.10) from 2019 score.
NAEP = National Assessment of Educational Progress.
Note(s):
The scale for NAEP mathematics assessment scores is 0–500 for grades 4 and 8.
Source(s):
National Center for Science and Engineering Statistics, special tabulations (2022) of the 2019 and 2022 main NAEP mathematics assessments, National Center for Education Statistics.
Science and Engineering Indicators
Average scores of students in grades 4 and 8 on the main NAEP mathematics assessment, by race or ethnicity: 2019 and 2022
* = significantly different (p < 0.10) from 2019 score.
NAEP = National Assessment of Educational Progress.
Note(s):
The scale for NAEP mathematics assessment scores is 0–500 for grades 4 and 8. Black includes African American. Hispanic includes Latino. Hispanic may be any race; race categories exclude Hispanic origin.
Source(s):
National Center for Science and Engineering Statistics, special tabulations (2022) of the 2019 and 2022 main NAEP mathematics assessments, National Center for Education Statistics.
Science and Engineering Indicators
Average scores of students in grades 4 and 8 on the main NAEP mathematics assessment, by race or ethnicity and socioeconomic status: 2022
NAEP = National Assessment of Educational Progress.
Note(s):
The scale for NAEP mathematics assessment scores is 0–500 for grades 4 and 8. Black includes African American. Hispanic includes Latino. Hispanic may be any race; race categories exclude Hispanic origin.
Source(s):
National Center for Science and Engineering Statistics, special tabulations (2022) of the 2022 main NAEP mathematics assessment, National Center for Education Statistics.
Science and Engineering Indicators
The substantial score differences among different student groups in the fourth and eighth grades highlight the existence of inequality and racial disparities in the nation’s education system. Research literature suggests that persistently lower scores for economically disadvantaged students and students from historically marginalized groups, including Black students, Hispanic students, and American Indian or Alaska Native students, may be attributable to a variety of educational and social inequities, including (but not limited to) schools with inadequate resources and less-qualified teachers, inadequate medical care, food insecurity, disproportionate disciplinary practices, lack of a social safety net, and exposure to trauma (Bowman, Comer, and Johns 2018; Carnevale et al. 2019; Gordon and Reber 2021; National Academies of Sciences, Engineering, and Medicine [NASEM] 2019; Pearman 2020; Reardon, Kalogrides, and Shores 2019).
Disproportionate Impact of COVID-19 among Student Groups
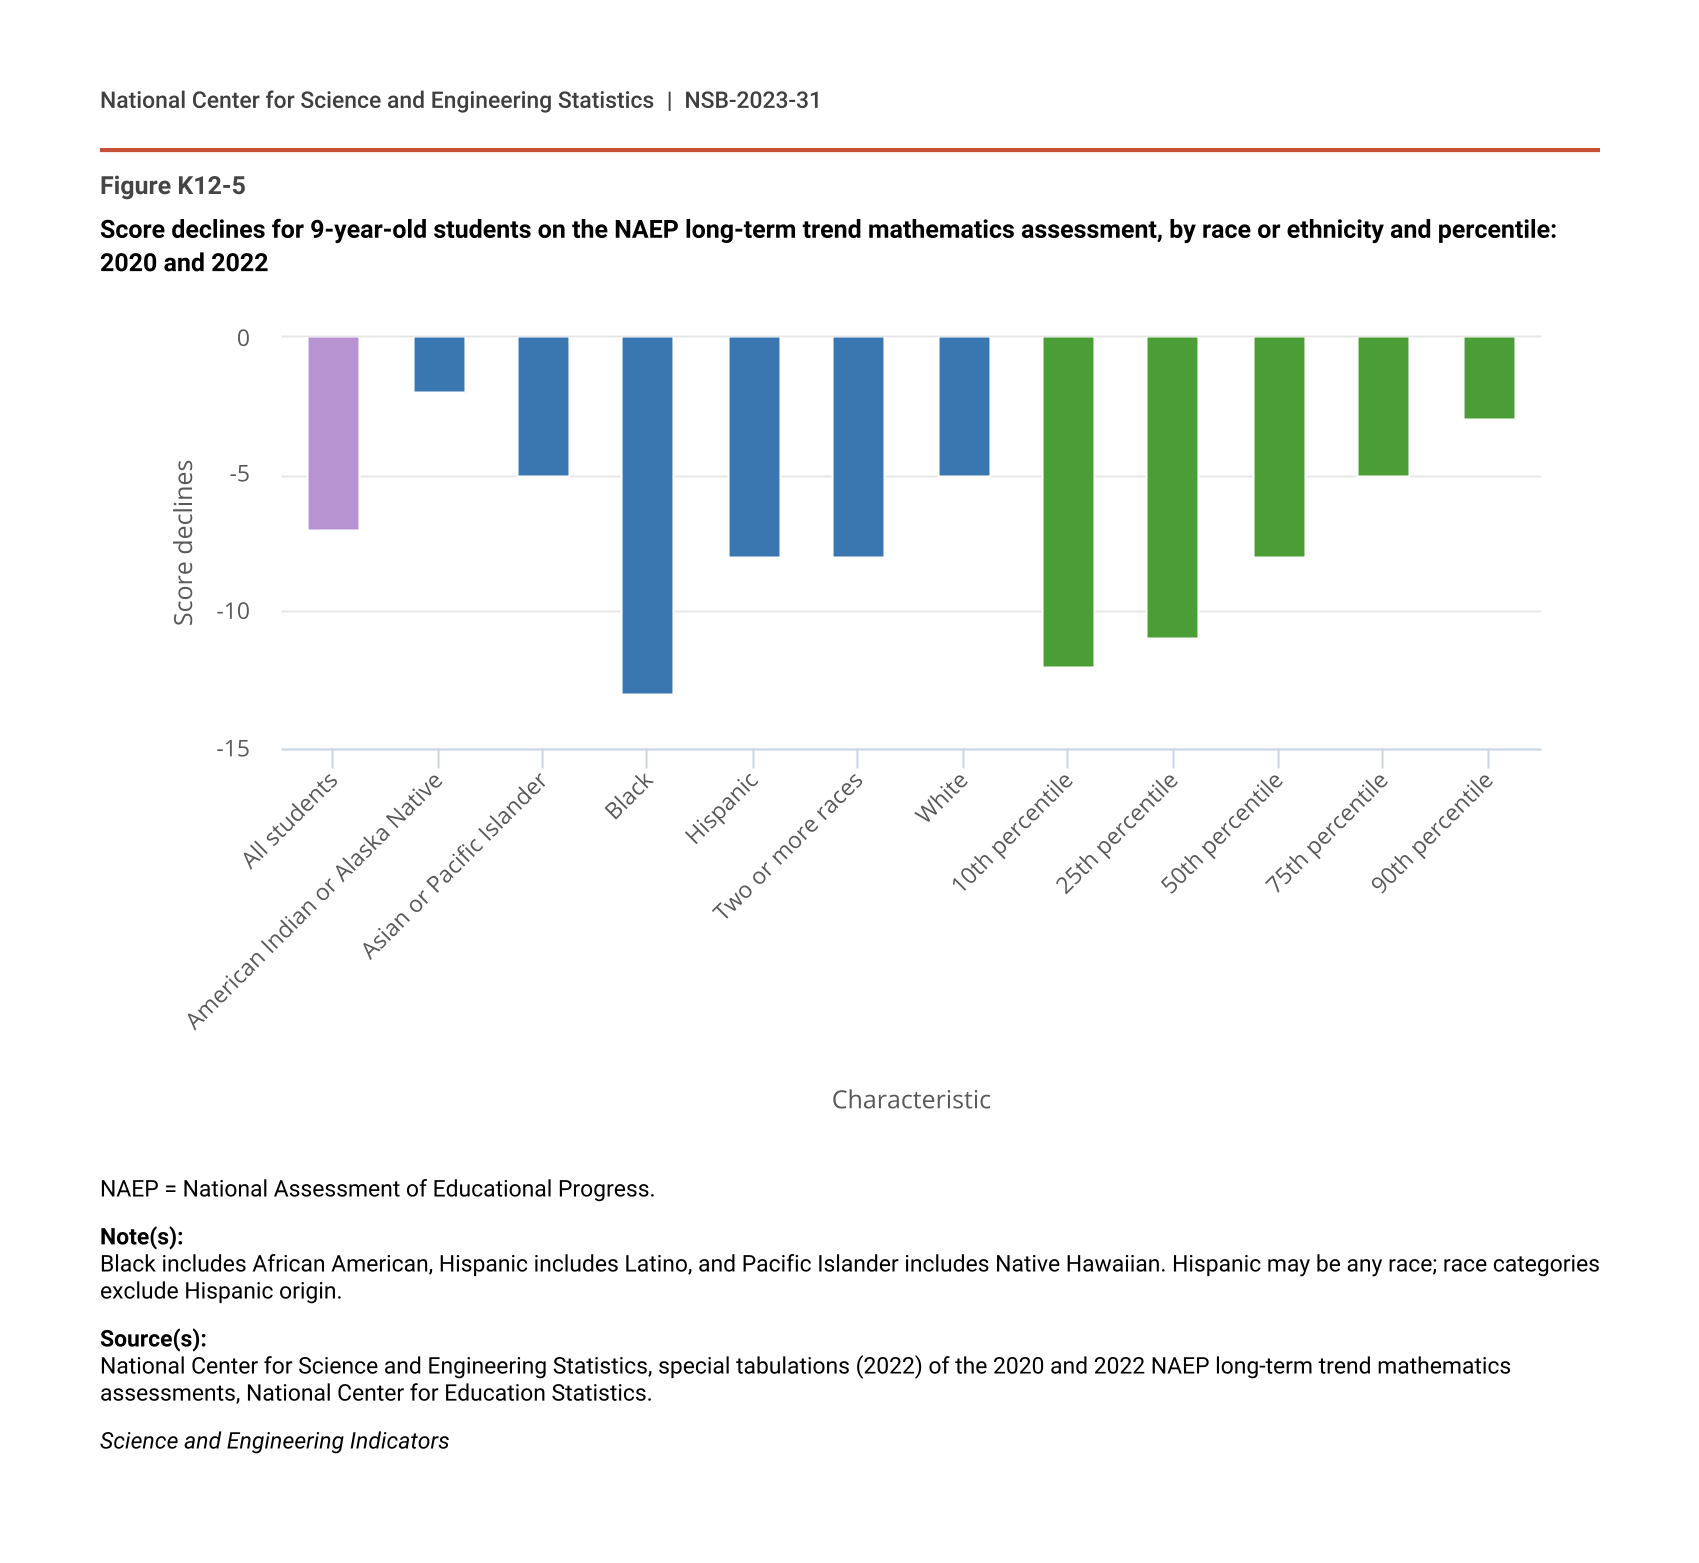
Results from the 2022 NAEP LTT show that COVID-19 had a greater negative impact on outcomes for certain student groups, including Black students and Hispanic students, students eligible for free or reduced-price lunch, and students scoring in the 10th percentile on mathematics assessments. Students already at a disadvantage because of persistently lower scores are now farther behind because they had higher declines in 2022 than other students did. For example, the NAEP LTT shows that scores in 2022 dropped 13 points for Black 9-year-old students, 8 points for Hispanic 9-year-old students, and 5 points for White 9-year-old students compared with scores in 2020 (Figure K12-5). These declines in average scores resulted in a score gap of 33 points between White students and Black students (Table SK12-1). Similarly, the average score for students scoring in the 90th percentile dropped 3 points from 2020 to 2022, compared with a drop of 12 points for students scoring in the 10th percentile. As a result, the gap between the 90th and 10th percentile scores widened to 105 points, the largest it has been since the assessment began. A review of publications about the effects of COVID-19 provides additional insight into the short- and long-term impacts on elementary and secondary students. (See sidebar Impact of COVID-19 on K–12 Students.)
Score declines for 9-year-old students on the NAEP long-term trend mathematics assessment, by race or ethnicity and percentile: 2020 and 2022
| Characteristic | Score declines between 2020 and 2022 |
|---|---|
| All students | -7 |
| American Indian or Alaska Native | -2 |
| Asian or Pacific Islander | -5 |
| Black | -13 |
| Hispanic | -8 |
| Two or more races | -8 |
| White | -5 |
| 10th percentile | -12 |
| 25th percentile | -11 |
| 50th percentile | -8 |
| 75th percentile | -5 |
| 90th percentile | -3 |
NAEP = National Assessment of Educational Progress.
Note(s):
Black includes African American, Hispanic includes Latino, and Pacific Islander includes Native Hawaiian. Hispanic may be any race; race categories exclude Hispanic origin.
Source(s):
National Center for Science and Engineering Statistics, special tabulations (2022) of the 2020 and 2022 NAEP long-term trend mathematics assessments, National Center for Education Statistics.
Science and Engineering Indicators
Analysis of NAEP Achievement Levels in 2019 and 2022
In addition to providing scale scores, the main NAEP also reports student performance in terms of achievement levels. The assessment’s three achievement levels—NAEP Basic, NAEP Proficient, and NAEP Advanced—are measures of what students should know and be able to do at each grade level. Unlike NAEP scale scores, which are not comparable across grade levels, NAEP achievement levels allow for comparison of student performance across grade levels. NAEP Proficient represents solid academic performance for each grade assessed. Students reaching this level have demonstrated competency over challenging subject matter. NAEP Proficient represents the goal for what all students should know.
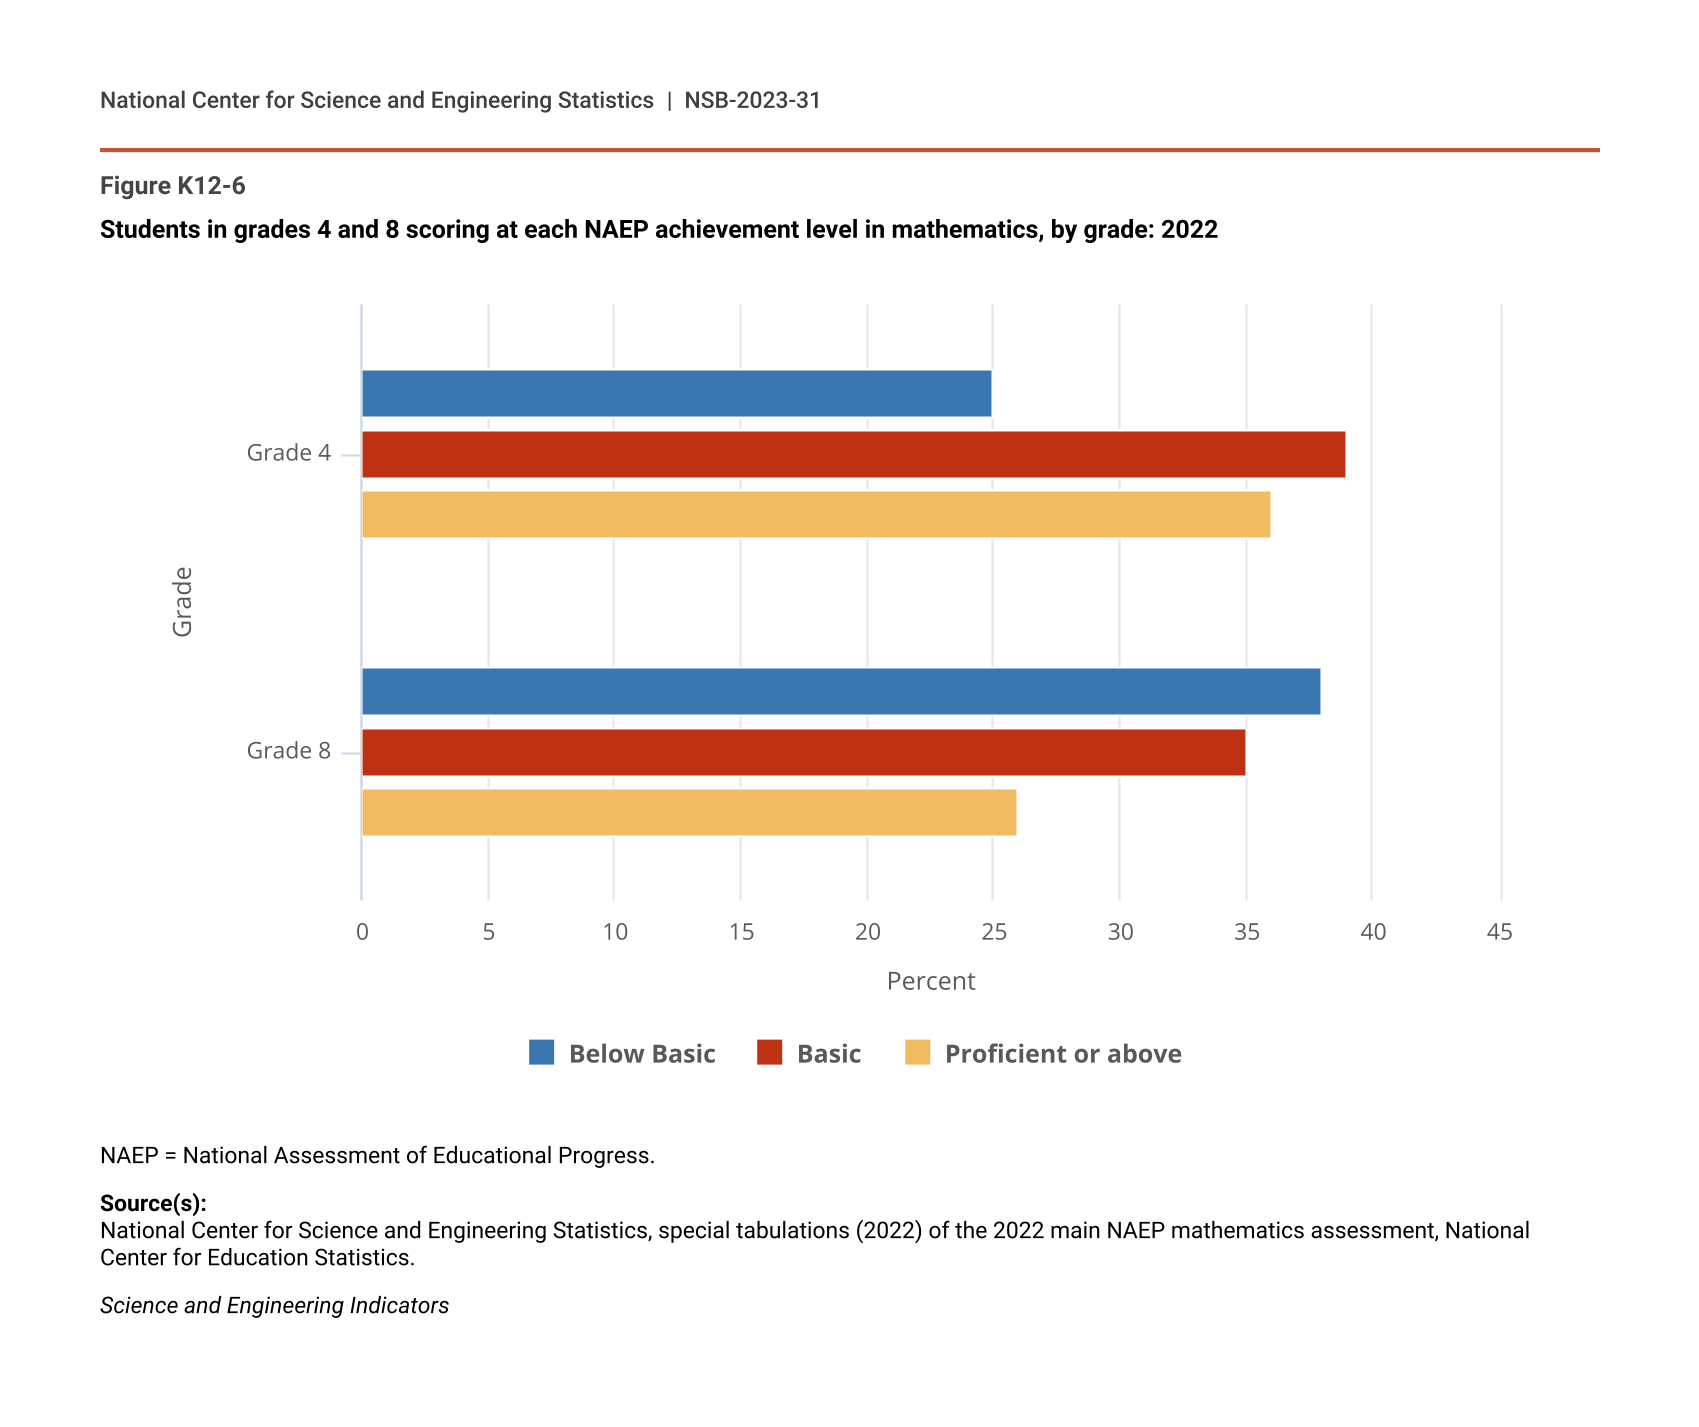
In 2022, the percentage of students scoring NAEP Proficient or above declined to the lowest level since 2005 for fourth graders and since 2000 for eighth graders. In 2022, 36% of fourth graders and 26% of eighth graders scored NAEP Proficient or above, indicating that student performance is lower in higher grades (Figure K12-6). The percentages in 2022 represent drops of 5 percentage points for fourth graders and 7 percentage points for eighth graders compared with 2019 (Table SK12-3).
Students in grades 4 and 8 scoring at each NAEP achievement level in mathematics, by grade: 2022
| Grade | Below Basic | Basic | Proficient or above |
|---|---|---|---|
| Grade 4 | 25 | 39 | 36 |
| Grade 8 | 38 | 35 | 26 |
NAEP = National Assessment of Educational Progress.
Source(s):
National Center for Science and Engineering Statistics, special tabulations (2022) of the 2022 main NAEP mathematics assessment, National Center for Education Statistics.
Science and Engineering Indicators
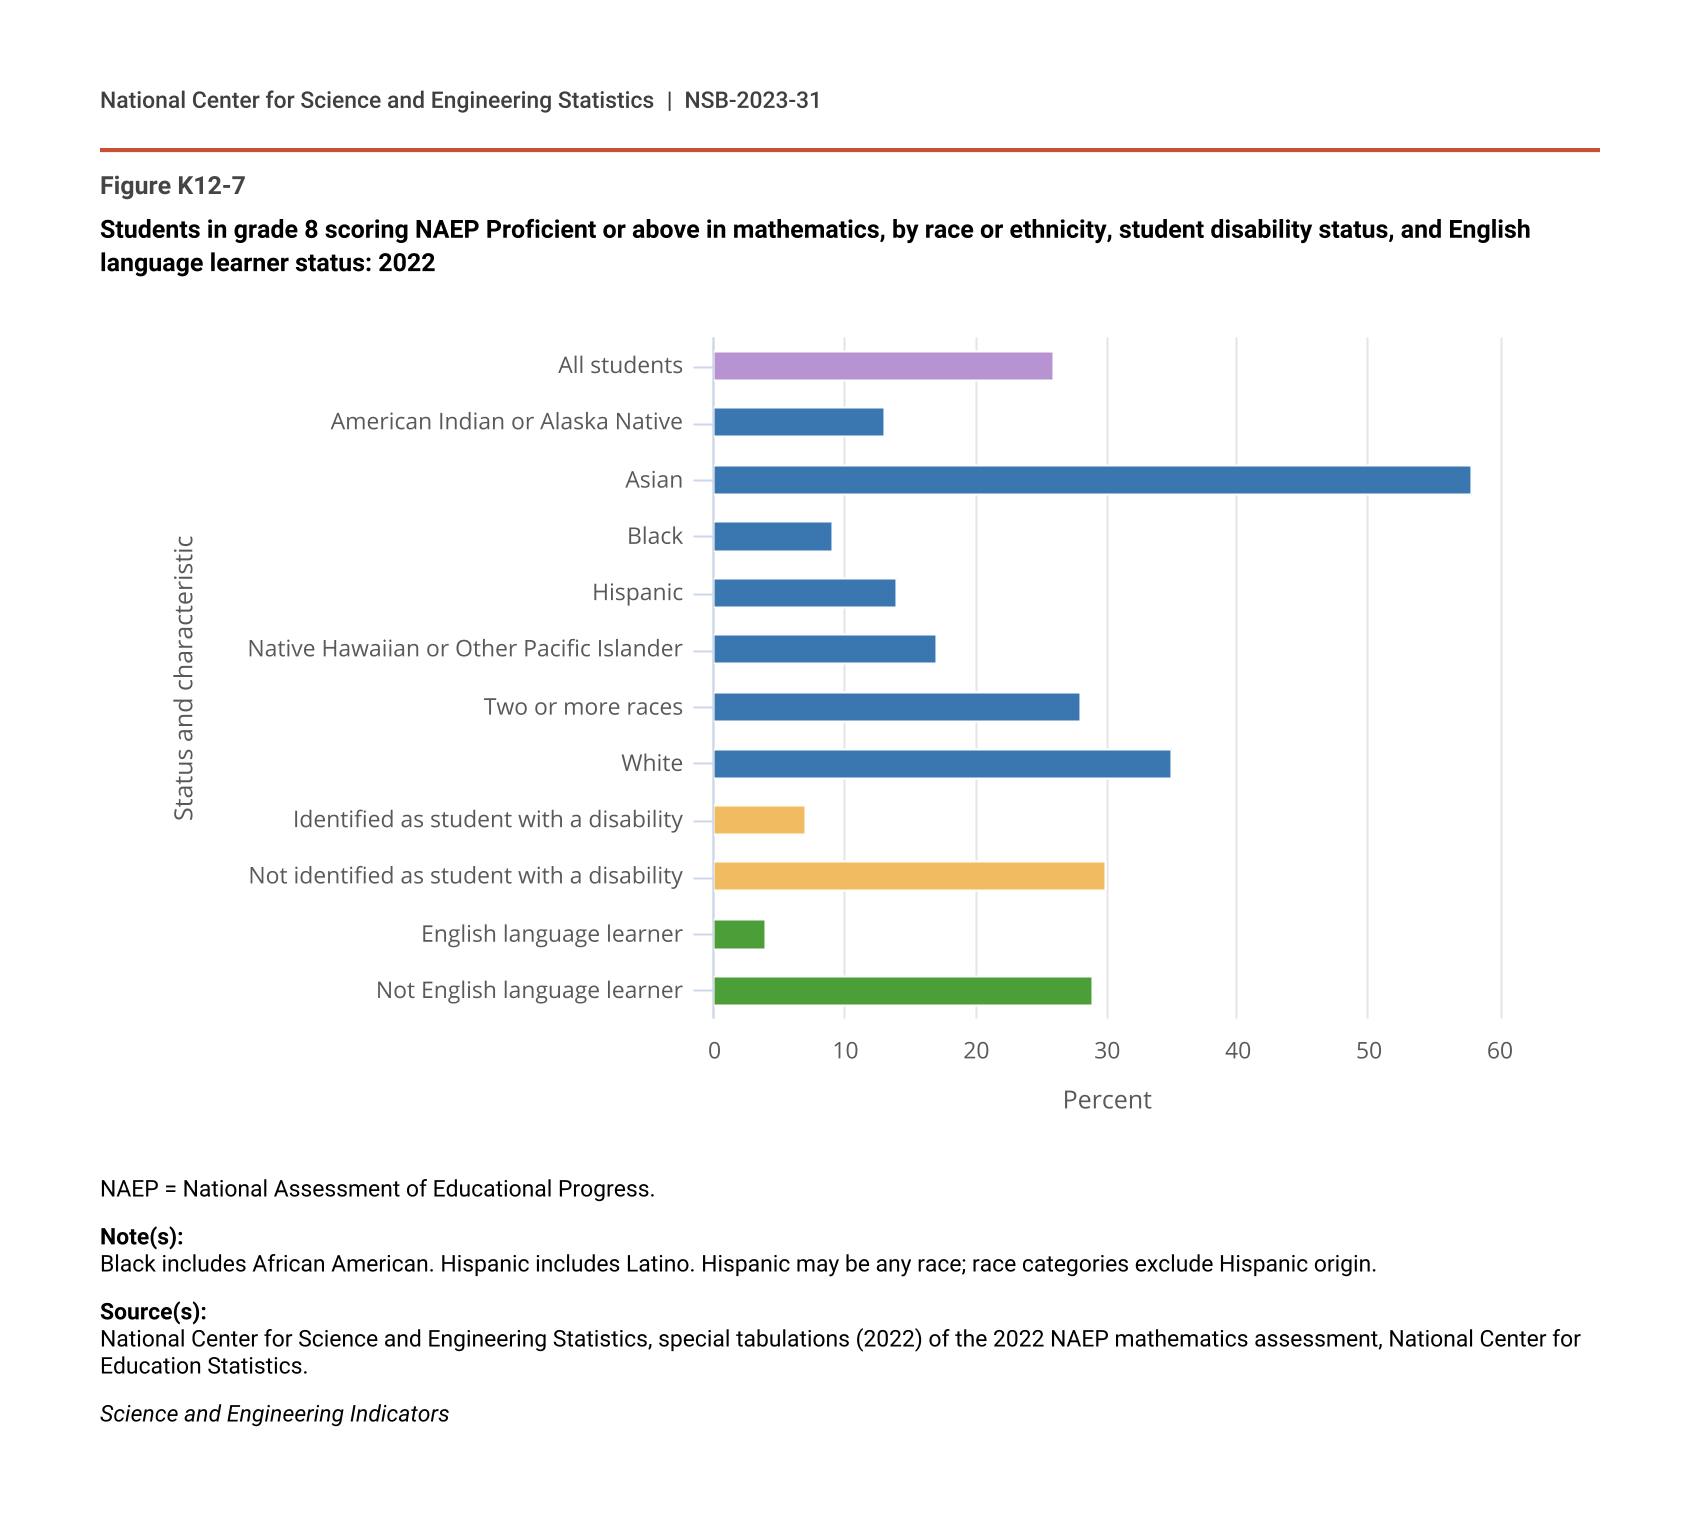
Comparison of proficiency levels by student characteristics shows that many student groups have low percentages of students scoring NAEP Proficient or above in mathematics. In 2022, 9% of Black eighth graders and 14% of Hispanic eighth graders scored NAEP Proficient or above (Figure K12-7). Lower percentages were seen for eighth graders identified as students with a disability at 7% and for eighth graders identified as English learners at 4%.
Students in grade 8 scoring NAEP Proficient or above in mathematics, by race or ethnicity, student disability status, and English language learner status: 2022
| Status and characteristic | 2022 |
|---|---|
| All students | 26 |
| American Indian or Alaska Native | 13 |
| Asian | 58 |
| Black | 9 |
| Hispanic | 14 |
| Native Hawaiian or Other Pacific Islander | 17 |
| Two or more races | 28 |
| White | 35 |
| Identified as student with a disability | 7 |
| Not identified as student with a disability | 30 |
| English language learner | 4 |
| Not English language learner | 29 |
NAEP = National Assessment of Educational Progress.
Note(s):
Black includes African American. Hispanic includes Latino. Hispanic may be any race; race categories exclude Hispanic origin.
Source(s):
National Center for Science and Engineering Statistics, special tabulations (2022) of the 2022 NAEP mathematics assessment, National Center for Education Statistics.
Science and Engineering Indicators
Geographic Analysis of NAEP Achievement Scores
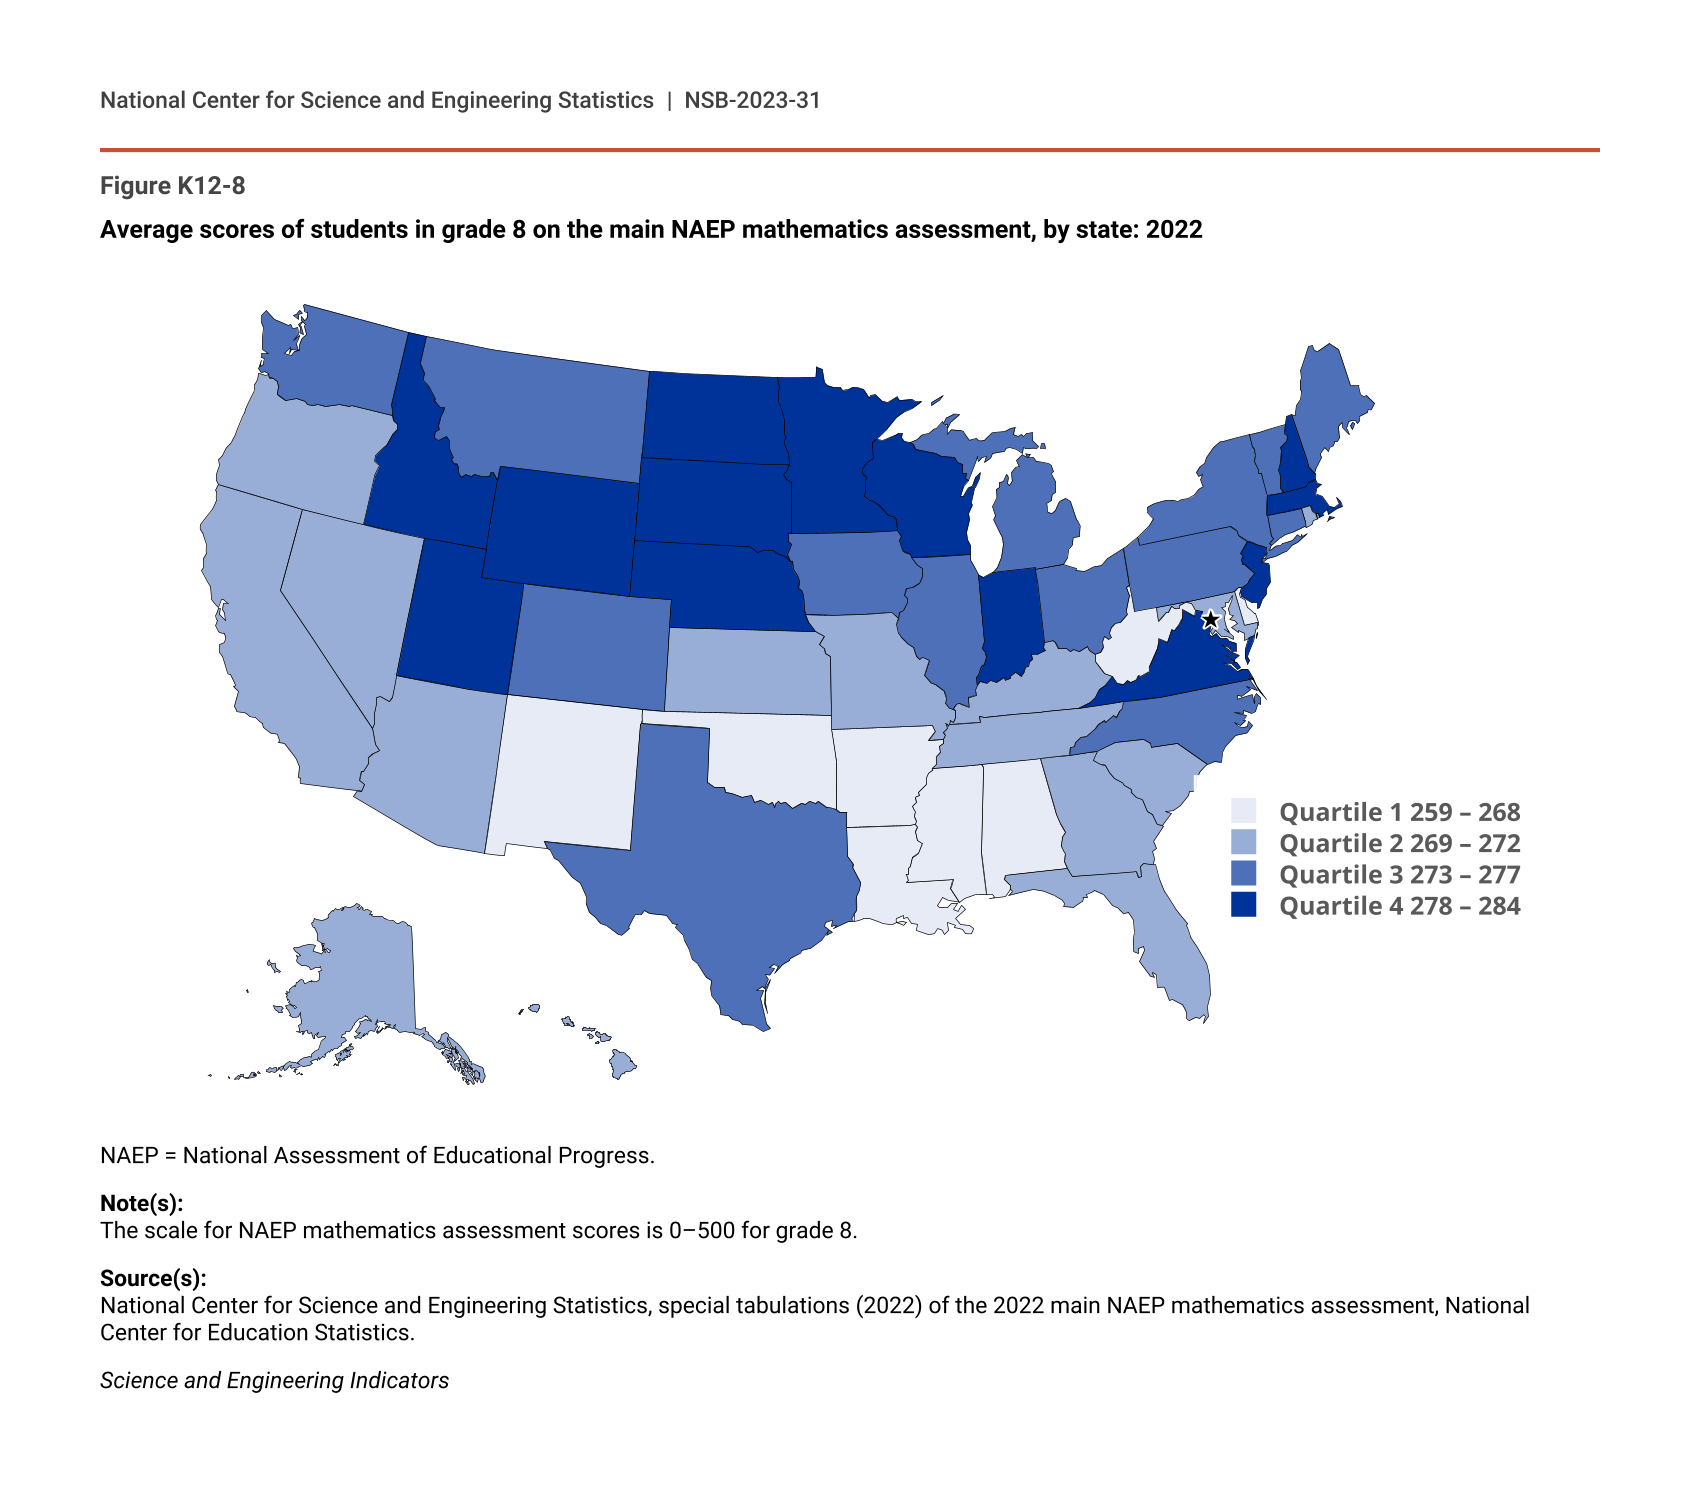
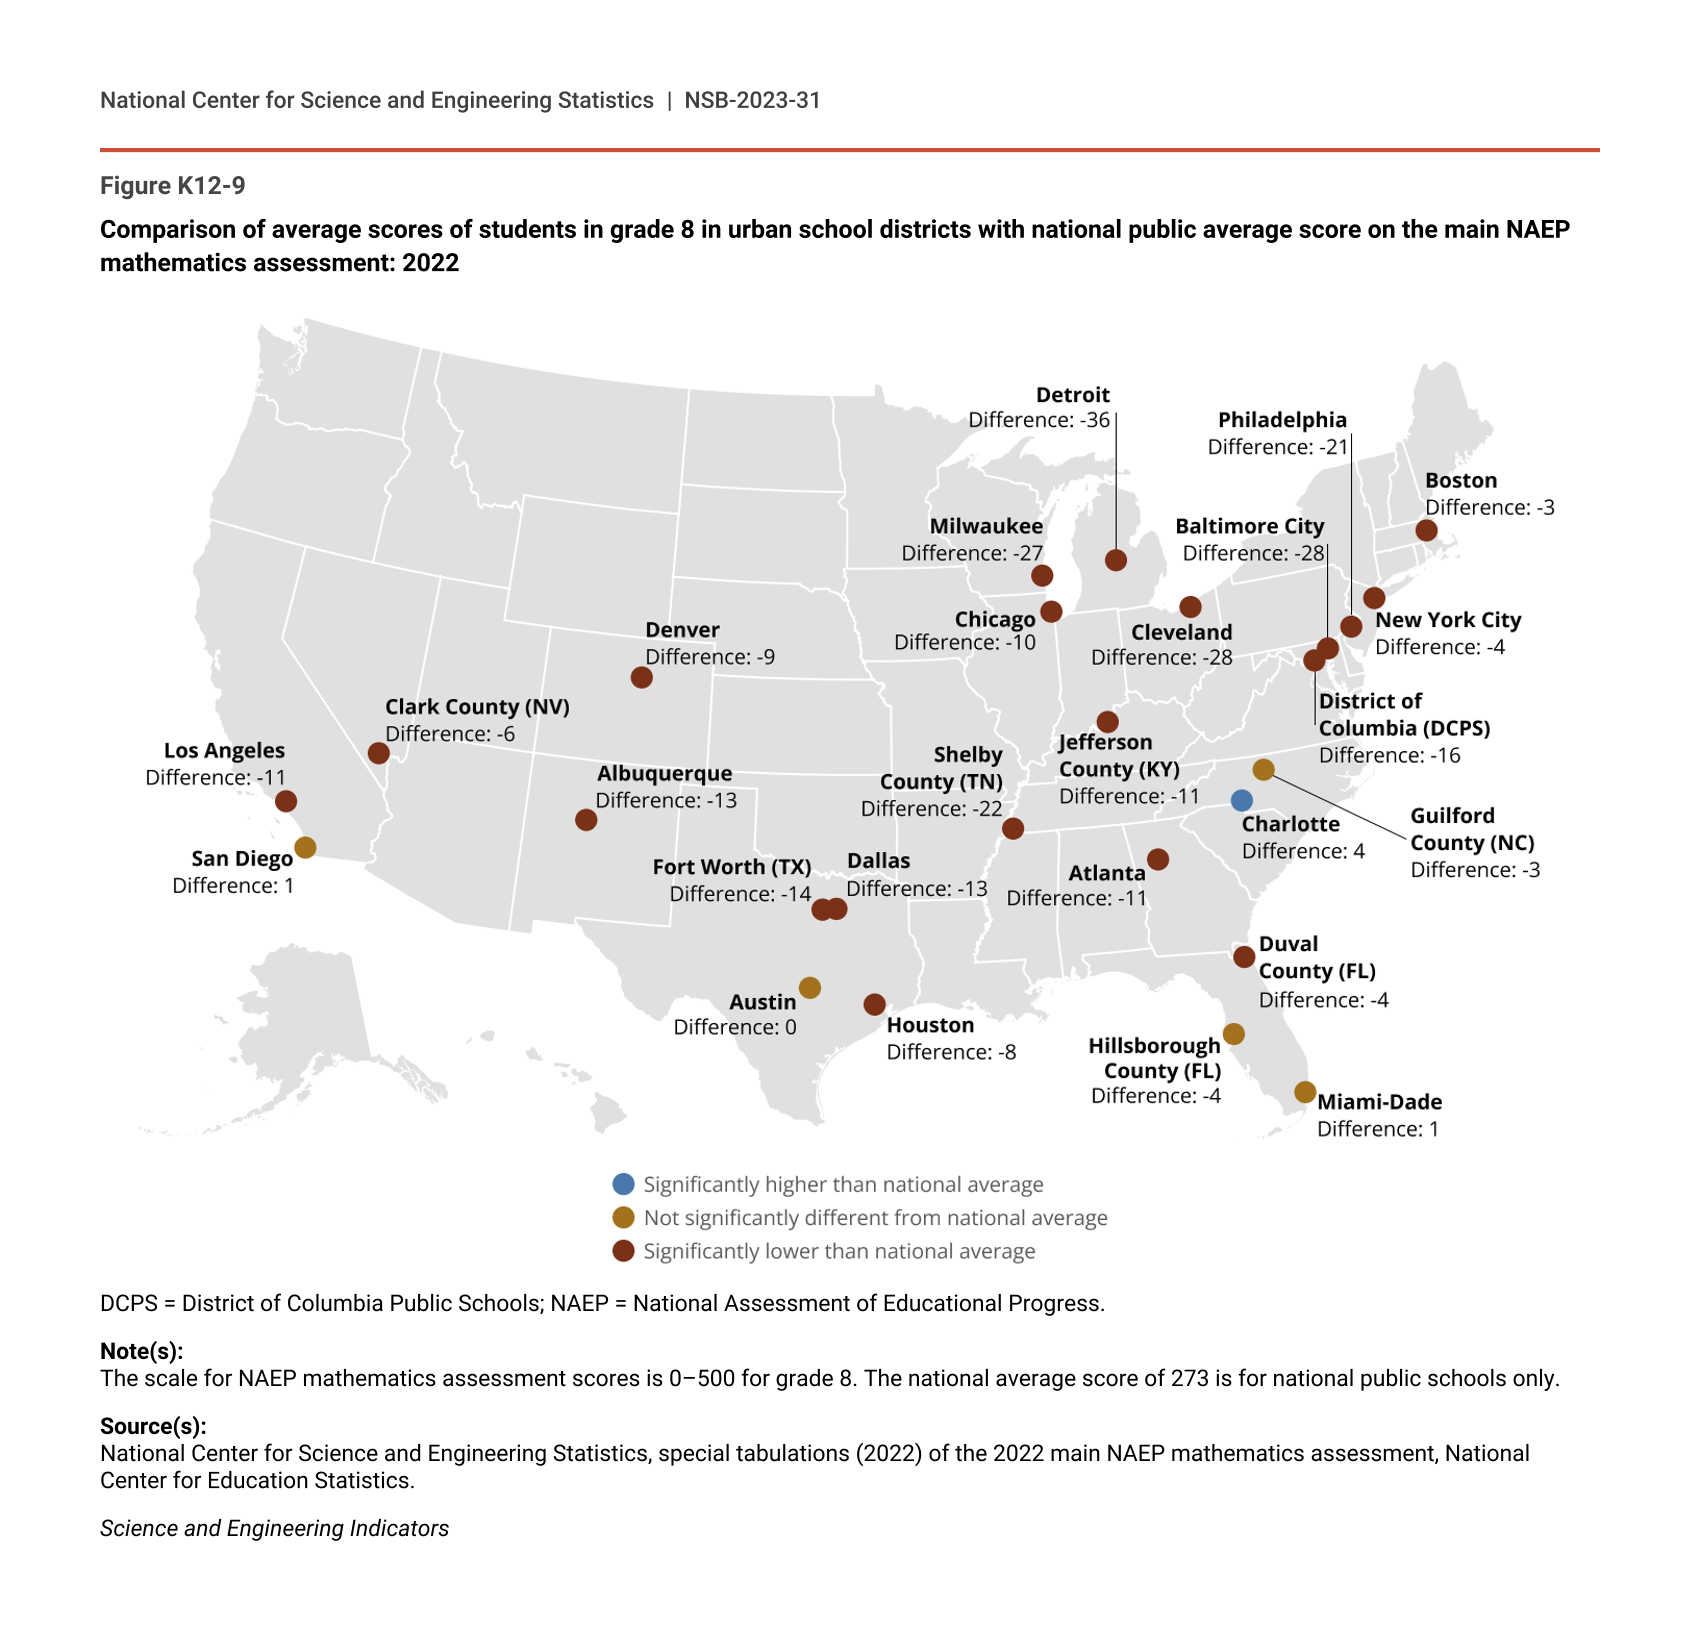
Average student scores also varied by state. Average NAEP mathematics scores in 2022 for students in eighth grade ranged from 259 to 284 (Figure K12-8). Students in New Mexico, the District of Columbia, and West Virginia had the lowest average scores, whereas students in Massachusetts, Utah, and Idaho had average scores that were higher than average scores for students in 40 other states. At the regional level, students in the Northeast (278) and Midwest (277) scored higher than students in the West (273) and South (272) (Table SK12-2). NAEP also provides average scores for students in 26 urban districts across the United States. In 2022, students in Charlotte had a higher average score than students in all urban districts except for San Diego. Students in Detroit had the lowest average score (Figure K12-9). Charlotte was the only district whose students scored significantly higher than the national average, whereas in 23 districts, including New York, Chicago, and Los Angeles, student scores were significantly lower than the national average score.
Average scores of students in grade 8 on the main NAEP mathematics assessment, by state: 2022
| State | Average score |
|---|---|
| Alabama | 264 |
| Alaska | 270 |
| Arizona | 271 |
| Arkansas | 267 |
| California | 270 |
| Colorado | 275 |
| Connecticut | 276 |
| Delaware | 264 |
| District of Columbia | 260 |
| Florida | 271 |
| Georgia | 271 |
| Hawaii | 270 |
| Idaho | 282 |
| Illinois | 275 |
| Indiana | 279 |
| Iowa | 277 |
| Kansas | 272 |
| Kentucky | 269 |
| Louisiana | 266 |
| Maine | 273 |
| Maryland | 269 |
| Massachusetts | 284 |
| Michigan | 273 |
| Minnesota | 280 |
| Mississippi | 266 |
| Missouri | 272 |
| Montana | 277 |
| Nebraska | 279 |
| Nevada | 269 |
| New Hampshire | 279 |
| New Jersey | 281 |
| New Mexico | 259 |
| New York | 274 |
| North Carolina | 274 |
| North Dakota | 278 |
| Ohio | 276 |
| Oklahoma | 264 |
| Oregon | 270 |
| Pennsylvania | 274 |
| Rhode Island | 270 |
| South Carolina | 269 |
| South Dakota | 281 |
| Tennessee | 272 |
| Texas | 273 |
| Utah | 282 |
| Vermont | 276 |
| Virginia | 279 |
| Washington | 276 |
| West Virginia | 260 |
| Wisconsin | 281 |
| Wyoming | 281 |
NAEP = National Assessment of Educational Progress.
Note(s):
The scale for NAEP mathematics assessment scores is 0–500 for grade 8.
Source(s):
National Center for Science and Engineering Statistics, special tabulations (2022) of the 2022 main NAEP mathematics assessment, National Center for Education Statistics.
Science and Engineering Indicators
Comparison of average scores of students in grade 8 in urban school districts with national public average score on the main NAEP mathematics assessment: 2022
DCPS = District of Columbia Public Schools; NAEP = National Assessment of Educational Progress.
Note(s):
The scale for NAEP mathematics assessment scores is 0–500 for grade 8. The national average score of 273 is for national public schools only.
Source(s):
National Center for Science and Engineering Statistics, special tabulations (2022) of the 2022 main NAEP mathematics assessment, National Center for Education Statistics.
Science and Engineering Indicators
International Comparisons of Mathematics and Science Performance
A nation’s knowledge and skills in STEM derive from a foundation of elementary and secondary mathematics and science education. Assessing these skills in an international context allows policymakers and educators to assess the status and progress of STEM education in the competitive landscape of a rapidly changing global economy and to design approaches to improve STEM learning (Bush 2019; Committee on STEM Education 2018; Department of Education 2022). The Trends in International Mathematics and Science Study (TIMSS) provides data on the mathematics and science achievement of students in the United States and in a wide array of other countries. TIMSS, conducted every 4 years beginning in 1995 (and, most recently, in 2019), assesses mathematics and science at the fourth and eighth grades.
The analyses here focus on results for the United States and other advanced economies, as defined by the International Monetary Fund (IMF) (IMF 2022). The analyses also focus on the eighth-grade results. Another international assessment, the Programme for International Student Assessment (PISA), measures the performance of 15-year-old students in mathematics and science literacy every 3 years. Indicators 2022 discusses the 2018 PISA results; new data were not available for the current Indicators report. (See the Indicators 2022 report “Elementary and Secondary STEM Education,” specifically the “International Comparisons of Mathematics and Science Performance” section.)
U.S. Performance in 2019
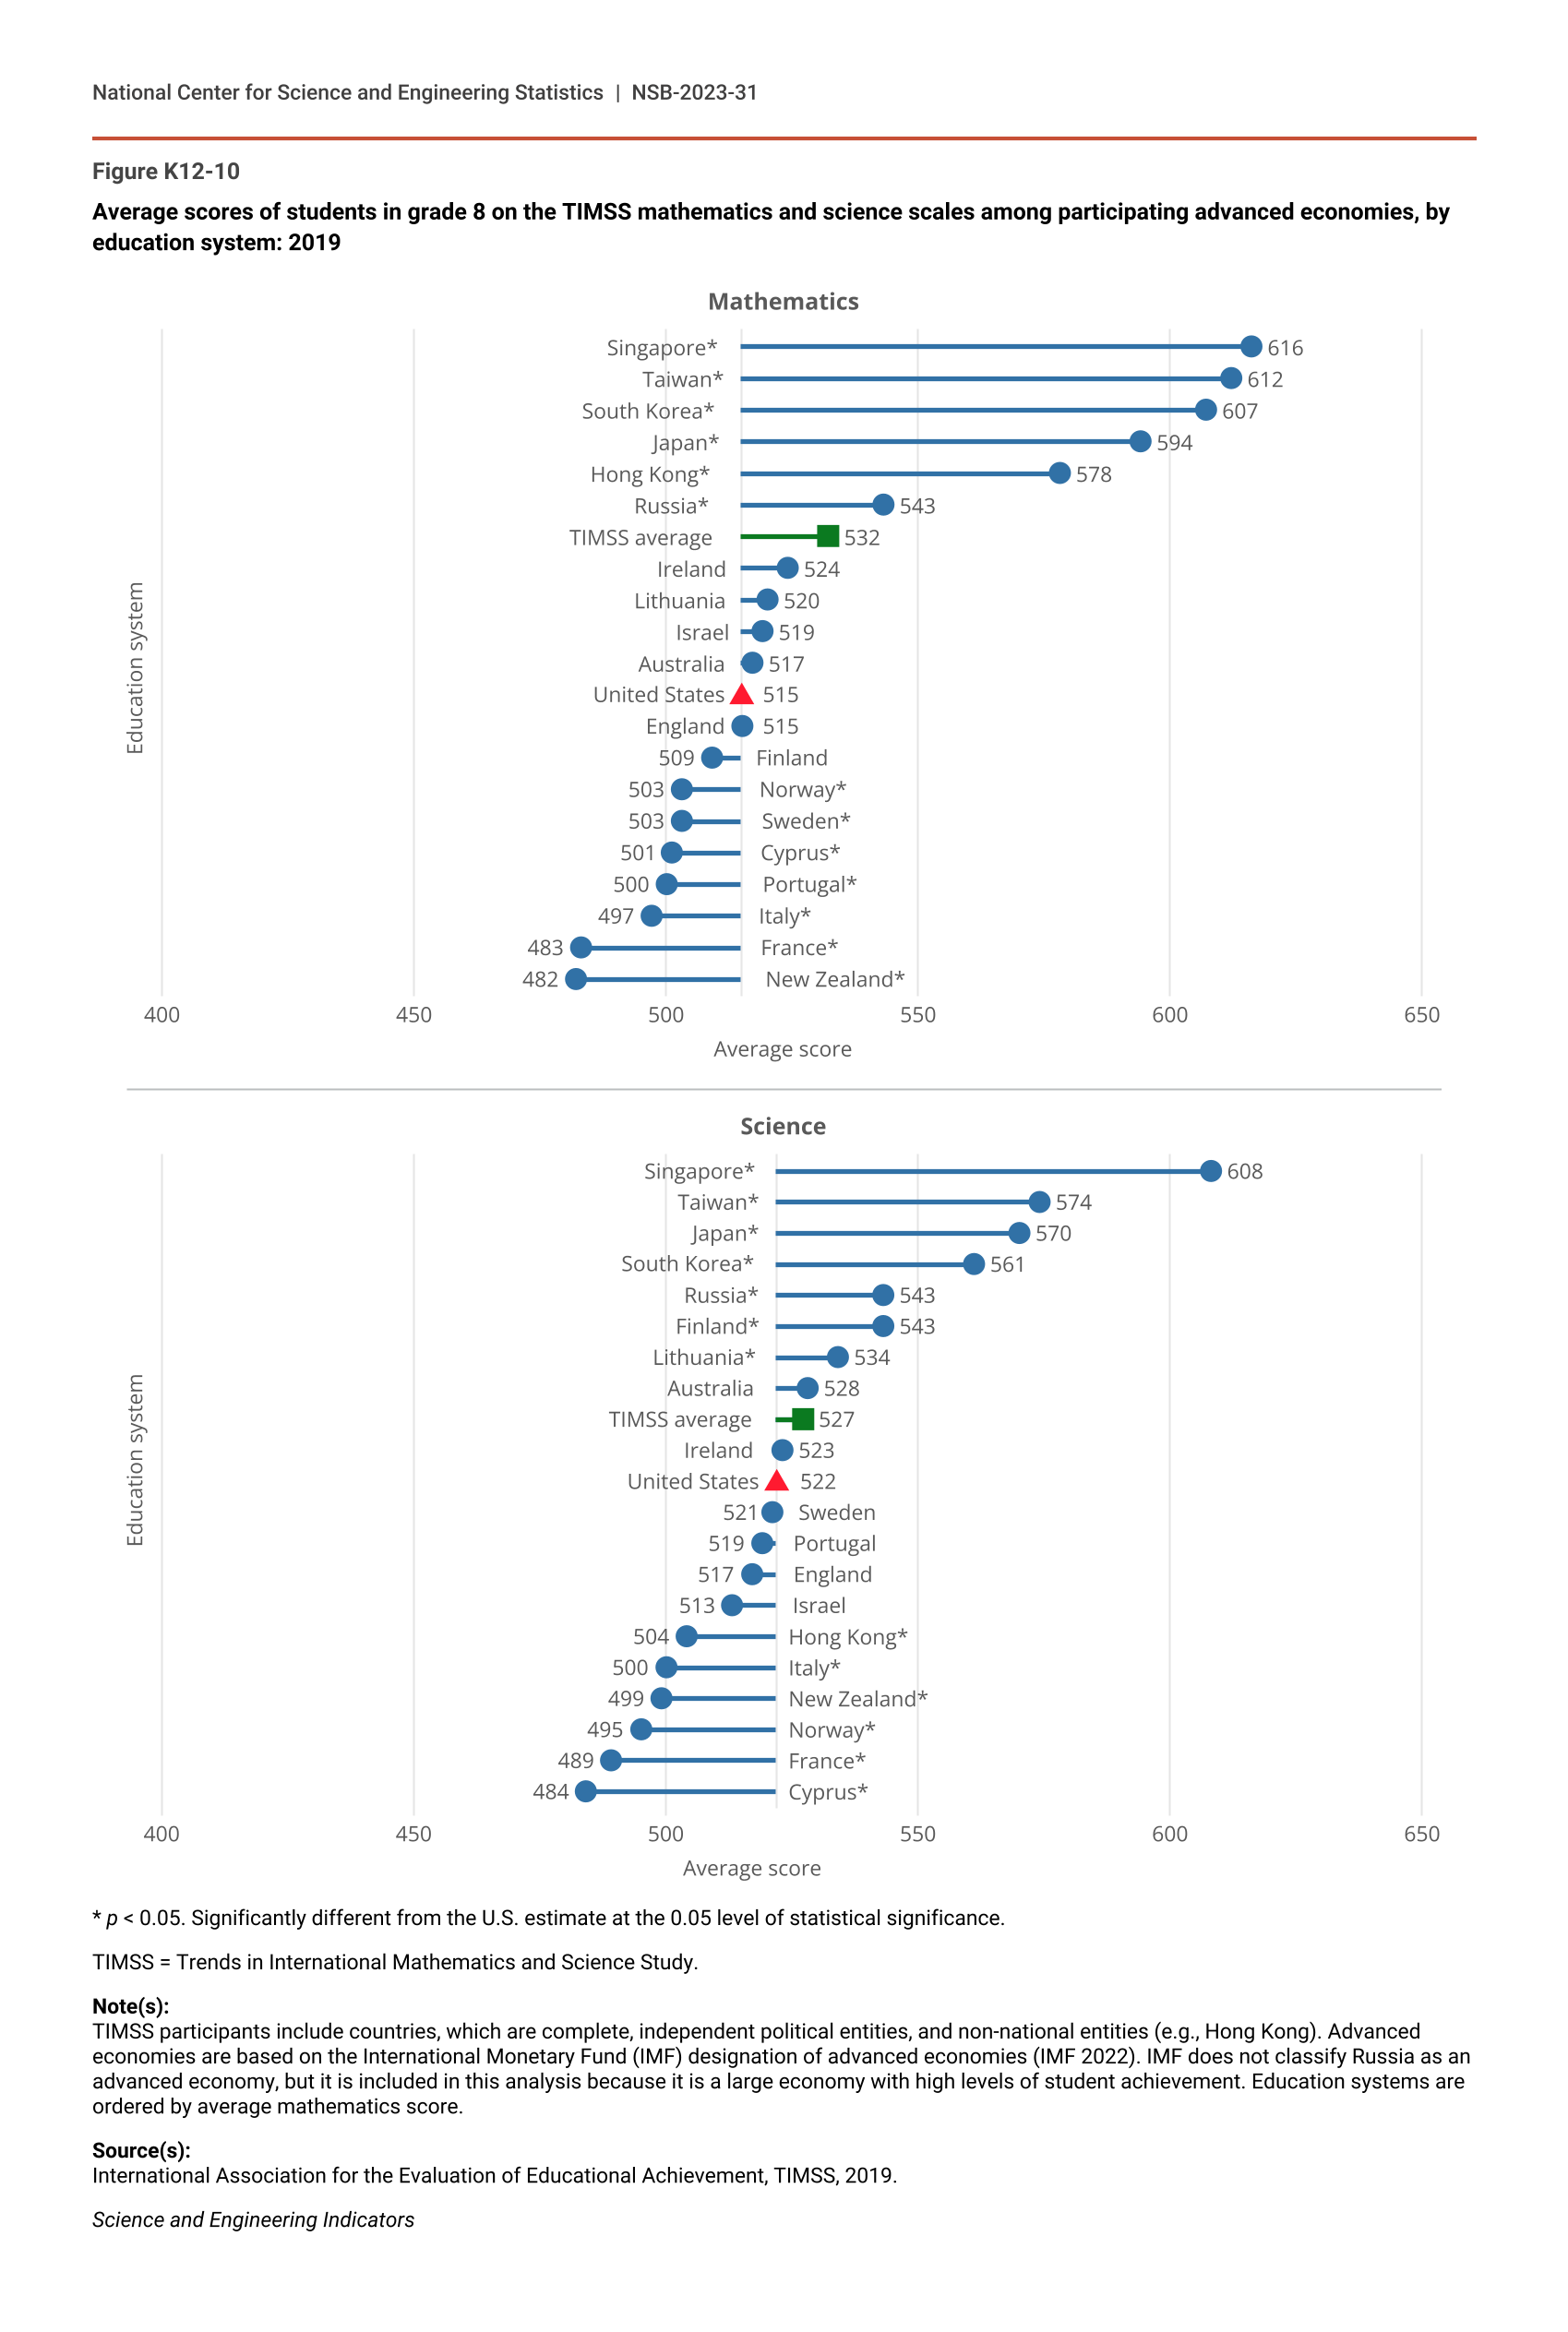
In general, U.S. eighth-grade students ranked in the middle of students from other advanced economies participating in TIMSS in 2019. Among 19 advanced economies that participated in TIMSS 2019 at the eighth-grade level, the United States placed 7th in mathematics, with scores statistically similar to those of six other systems, including England, Finland, and Australia (Figure K12-10). Six systems, including Singapore and Taiwan, had average mathematics scores that were statistically higher than the U.S. score; seven systems, including Norway and Sweden, had scores that were statistically lower. U.S. eighth graders’ average science scores placed them 8th among the 19 advanced economies, with scores statistically similar to those of six other systems. Seven systems, including Singapore and Taiwan, had average scores that were statistically higher than the U.S. score; six systems, including Hong Kong and France, had scores that were statistically lower.
Average scores of students in grade 8 on the TIMSS mathematics and science scales among participating advanced economies, by education system: 2019
* p < 0.05. Significantly different from the U.S. estimate at the 0.05 level of statistical significance.
TIMSS = Trends in International Mathematics and Science Study.
Note(s):
TIMSS participants include countries, which are complete, independent political entities, and non-national entities (e.g., Hong Kong). Advanced economies are based on the International Monetary Fund (IMF) designation of advanced economies (IMF 2022). IMF does not classify Russia as an advanced economy, but it is included in this analysis because it is a large economy with high levels of student achievement. Education systems are ordered by average mathematics score.
Source(s):
International Association for the Evaluation of Educational Achievement, TIMSS, 2019.
Science and Engineering Indicators
U.S. Performance over Time
U.S. performance has improved in mathematics since the first administration of TIMSS in 1995 (Table K12-2). At the fourth- and eighth-grade levels, U.S. students on average scored higher in mathematics in 2019 than in 1995. U.S. performance in science in 2019 has shown no statistically significant change compared with 1995 at either grade level.
Average TIMSS mathematics and science scores of students in grades 4 and 8: 1995–2019
NA = not available; assessments were not given for grade 4 in 1999.
TIMSS = Trends in International Mathematics and Science Study.
Source(s):
International Association for the Evaluation of Educational Achievement, TIMSS, 1995, 1999, 2003, 2007, 2011, 2015, and 2019.
Science and Engineering Indicators
Percentage of Students Reaching TIMSS Advanced Benchmarks
In addition to providing average scores across education systems and over time, TIMSS data also provide information on the percentage of students reaching defined benchmarks of performance. TIMSS designates four international benchmarks, each of which corresponds to a specific score on the 0–1,000 TIMSS scale: Low (400), Intermediate (475), High (550), and Advanced (625). Students scoring at or above a specific benchmark have demonstrated a specific set of skills and knowledge that enables a concrete interpretation of student performance at that level. For example, at the Advanced level in eighth-grade mathematics, students can “apply and reason in a variety of problem situations, solve linear equations, and make generalizations,” including solving problems involving fractions, proportions, percentages; algebraic expressions; angles, areas, and surface areas; and data displays and statistical concepts such as mean and median. For more information on the TIMSS international benchmarks, see Mullis et al. (2020).
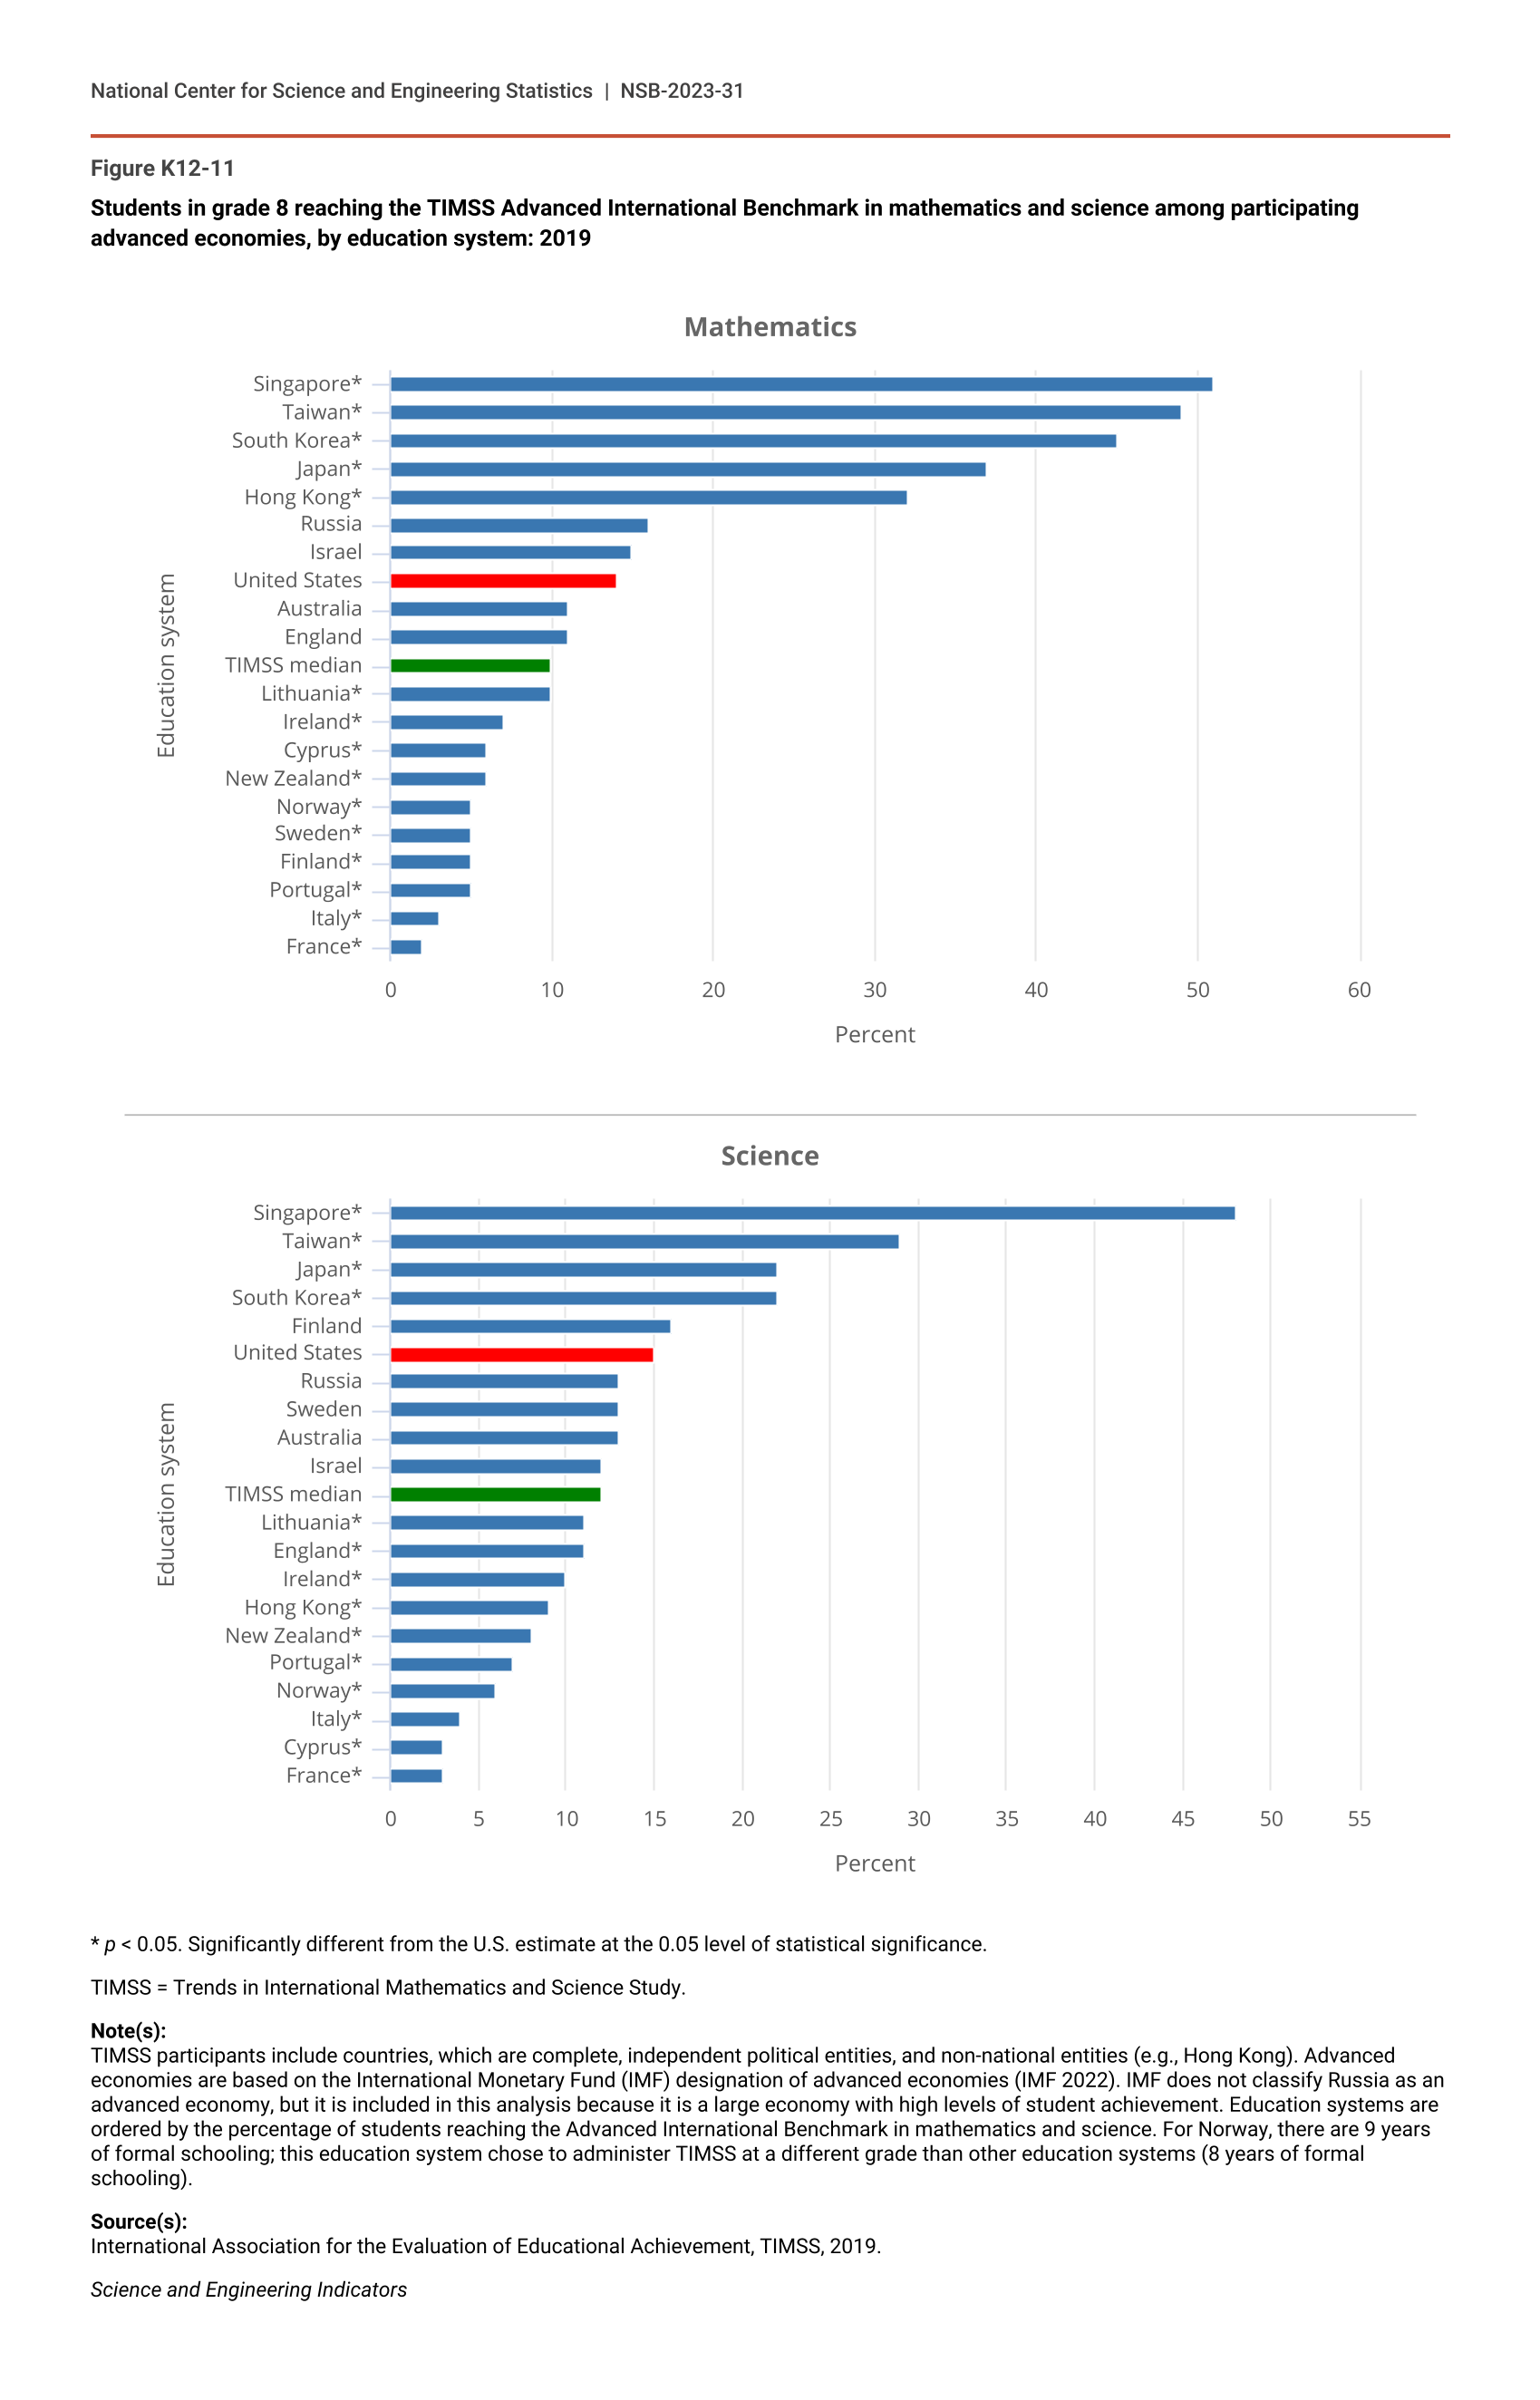
Approximately 15% of U.S. eighth graders reached the Advanced benchmark in mathematics and science, a considerably lower percentage than those in the top-scoring countries (Figure K12-11). Half of the eighth-grade students in Singapore and in Taiwan reached the Advanced benchmark in mathematics, compared with 14% of U.S. students. The U.S. percentage of eighth-grade students reaching the Advanced benchmark in mathematics was similar to those for Russia, Australia, and Israel. In science, Singapore outpaced all advanced economies in the percentage of eighth-grade students reaching the Advanced benchmark (48%), followed by the next closest, Taiwan, at 29%. The U.S. percentage of 15% at the Advanced benchmark in science was similar to those of Finland, Russia, Sweden, and Australia. The United States posted gains in the percentage of students scoring at or above Advanced between 2015 and 2019. During that time, the percentage of eighth-grade students reaching the Advanced benchmark increased from 10% to 14% in mathematics and from 12% to 15% in science (Table SK12-6).
Students in grade 8 reaching the TIMSS Advanced International Benchmark in mathematics and science among participating advanced economies, by education system: 2019
| Education system | Advanced (625) |
|---|---|
| Singapore* | 51 |
| Taiwan* | 49 |
| South Korea* | 45 |
| Japan* | 37 |
| Hong Kong* | 32 |
| Russia | 16 |
| Israel | 15 |
| United States | 14 |
| Australia | 11 |
| England | 11 |
| TIMSS median | 10 |
| Lithuania* | 10 |
| Ireland* | 7 |
| Cyprus* | 6 |
| New Zealand* | 6 |
| Norway* | 5 |
| Sweden* | 5 |
| Finland* | 5 |
| Portugal* | 5 |
| Italy* | 3 |
| France* | 2 |
| Education system | Advanced (625) |
|---|---|
| Singapore* | 48 |
| Taiwan* | 29 |
| Japan* | 22 |
| South Korea* | 22 |
| Finland | 16 |
| United States | 15 |
| Russia | 13 |
| Sweden | 13 |
| Australia | 13 |
| Israel | 12 |
| TIMSS median | 12 |
| Lithuania* | 11 |
| England* | 11 |
| Ireland* | 10 |
| Hong Kong* | 9 |
| New Zealand* | 8 |
| Portugal* | 7 |
| Norway* | 6 |
| Italy* | 4 |
| Cyprus* | 3 |
| France* | 3 |
* p < 0.05. Significantly different from the U.S. estimate at the 0.05 level of statistical significance.
TIMSS = Trends in International Mathematics and Science Study.
Note(s):
TIMSS participants include countries, which are complete, independent political entities, and non-national entities (e.g., Hong Kong). Advanced economies are based on the International Monetary Fund (IMF) designation of advanced economies (IMF 2022). IMF does not classify Russia as an advanced economy, but it is included in this analysis because it is a large economy with high levels of student achievement. Education systems are ordered by the percentage of students reaching the Advanced International Benchmark in mathematics and science. For Norway, there are 9 years of formal schooling; this education system chose to administer TIMSS at a different grade than other education systems (8 years of formal schooling).
Source(s):
International Association for the Evaluation of Educational Achievement, TIMSS, 2019.
Science and Engineering Indicators
TIMSS Scores, by Student Groups
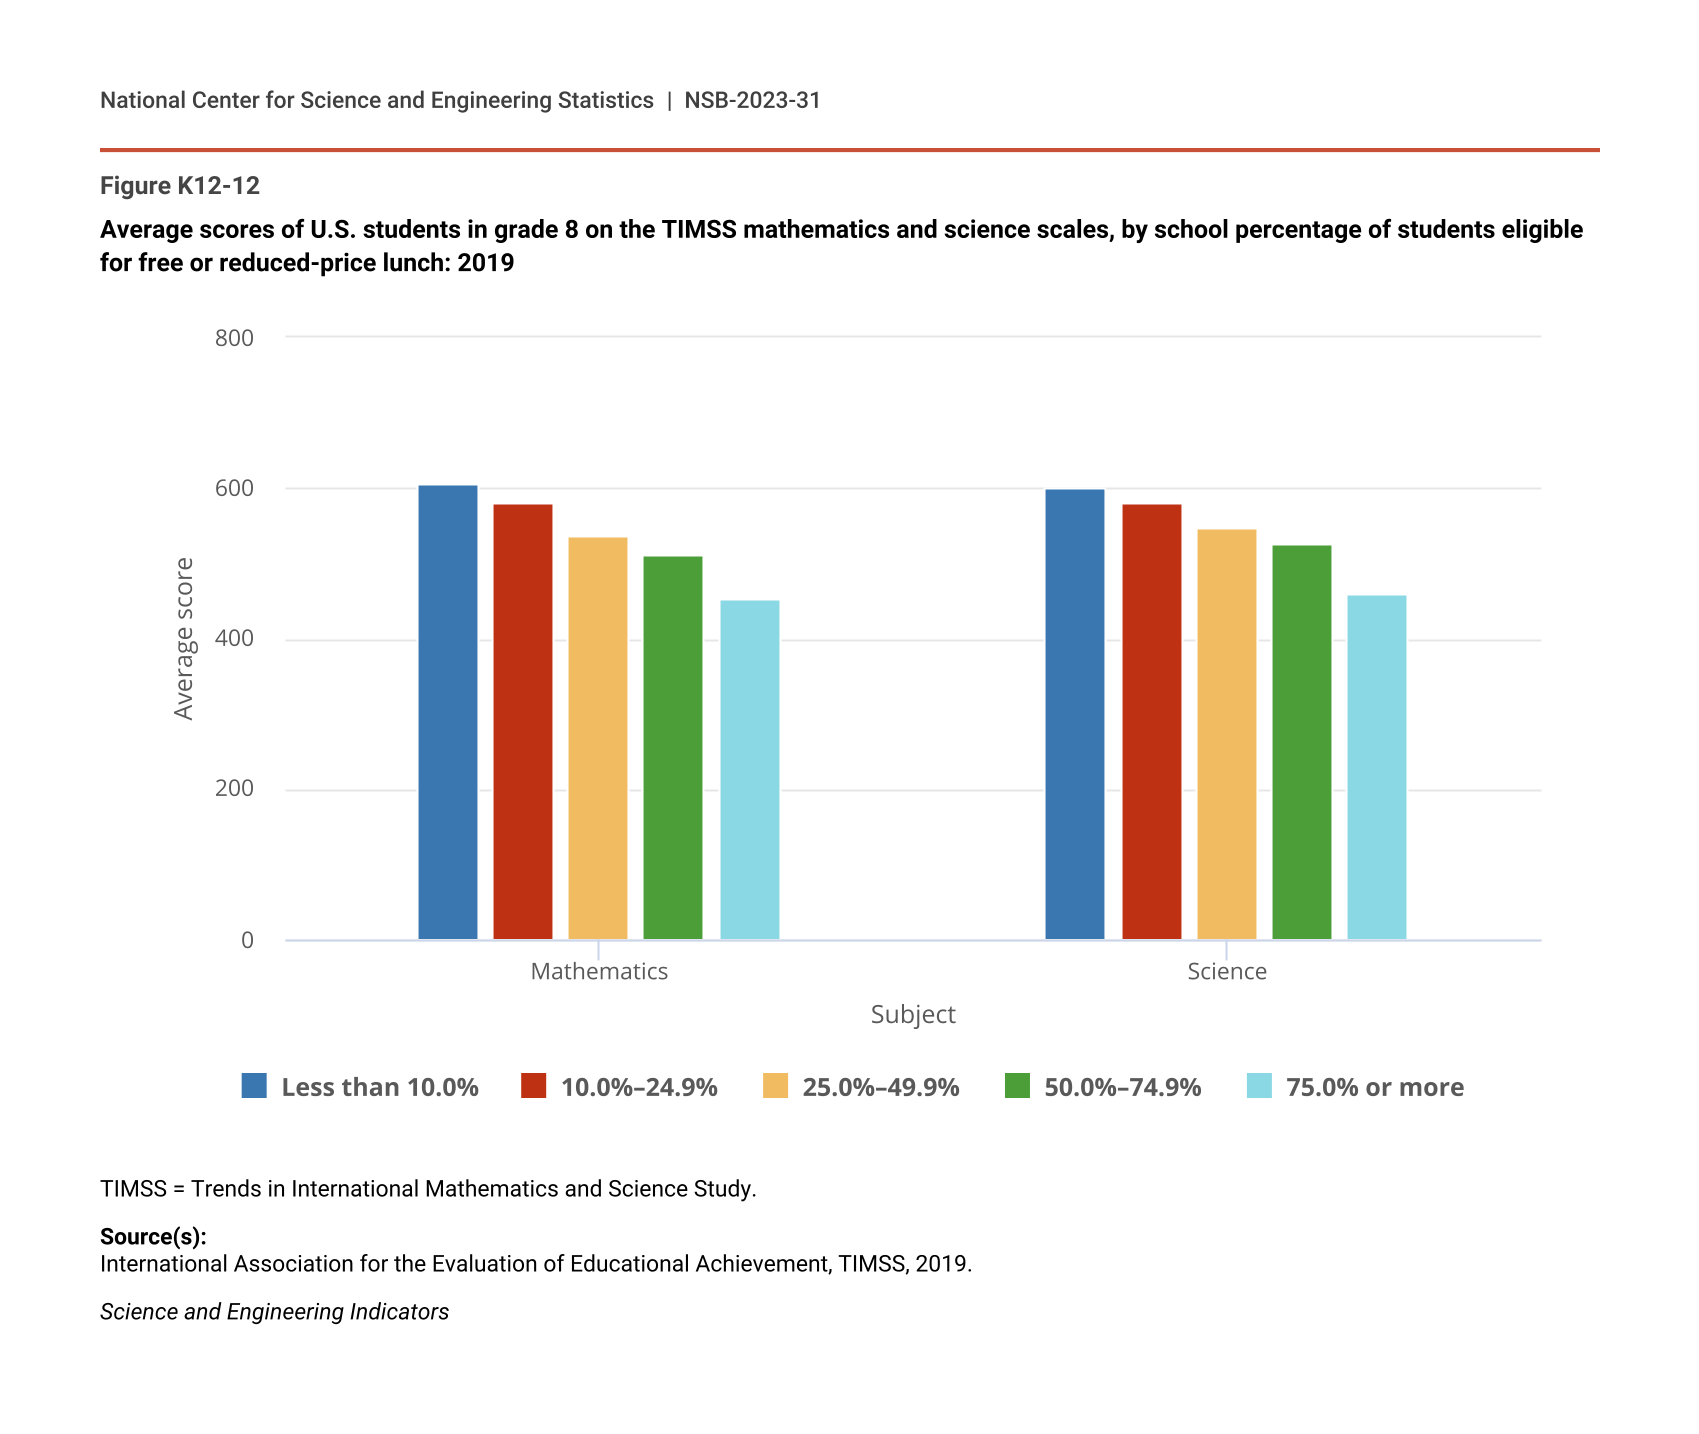
TIMSS data also provide insight into student performance by demographic groups in the United States, including by sex and by school percentages of students eligible for free or reduced-price lunch. In 2019, there was no statistical difference in the average mathematics or science scores of female and male eighth graders (Table SK12-9). Eighth-grade students in schools where more than 75% of students qualify for free or reduced-price lunch scored 454 in mathematics in 2019, compared with an average score of 606 for students at schools with less than 10% of students qualifying (Figure K12-12). The pattern for science is similar, with average scores of 460 and 602 at the respective high and low ends.
Average scores of U.S. students in grade 8 on the TIMSS mathematics and science scales, by school percentage of students eligible for free or reduced-price lunch: 2019
| Subject | Less than 10.0% | 10.0%–24.9% | 25.0%–49.9% | 50.0%–74.9% | 75.0% or more |
|---|---|---|---|---|---|
| Mathematics | 606 | 580 | 538 | 513 | 454 |
| Science | 602 | 580 | 547 | 527 | 460 |
TIMSS = Trends in International Mathematics and Science Study.
Source(s):
International Association for the Evaluation of Educational Achievement, TIMSS, 2019.
Science and Engineering Indicators