 An official website of the United States government
 Patterns of Academic R&D Spending
This section presents data on the distribution of academic R&D expenditures along several key dimensions, including the type of R&D, the characteristics of receiving institutions, and fields of S&E.
Spending, by Type of R&D
In the collection of statistical data, R&D is composed of three types: basic research, applied research, and experimental development. Of the nearly $90 billion spent on academic R&D in 2021, 62% of this amount ($56 billion) went to the performance of basic research, down from 65% in 2012. About 28% was spent on applied research and 10% on experimental development. These proportions have remained roughly stable since 2012, when 26% of academic R&D was spent on applied research and 9% on experimental development (NCSES HERD 2021: Table 9).
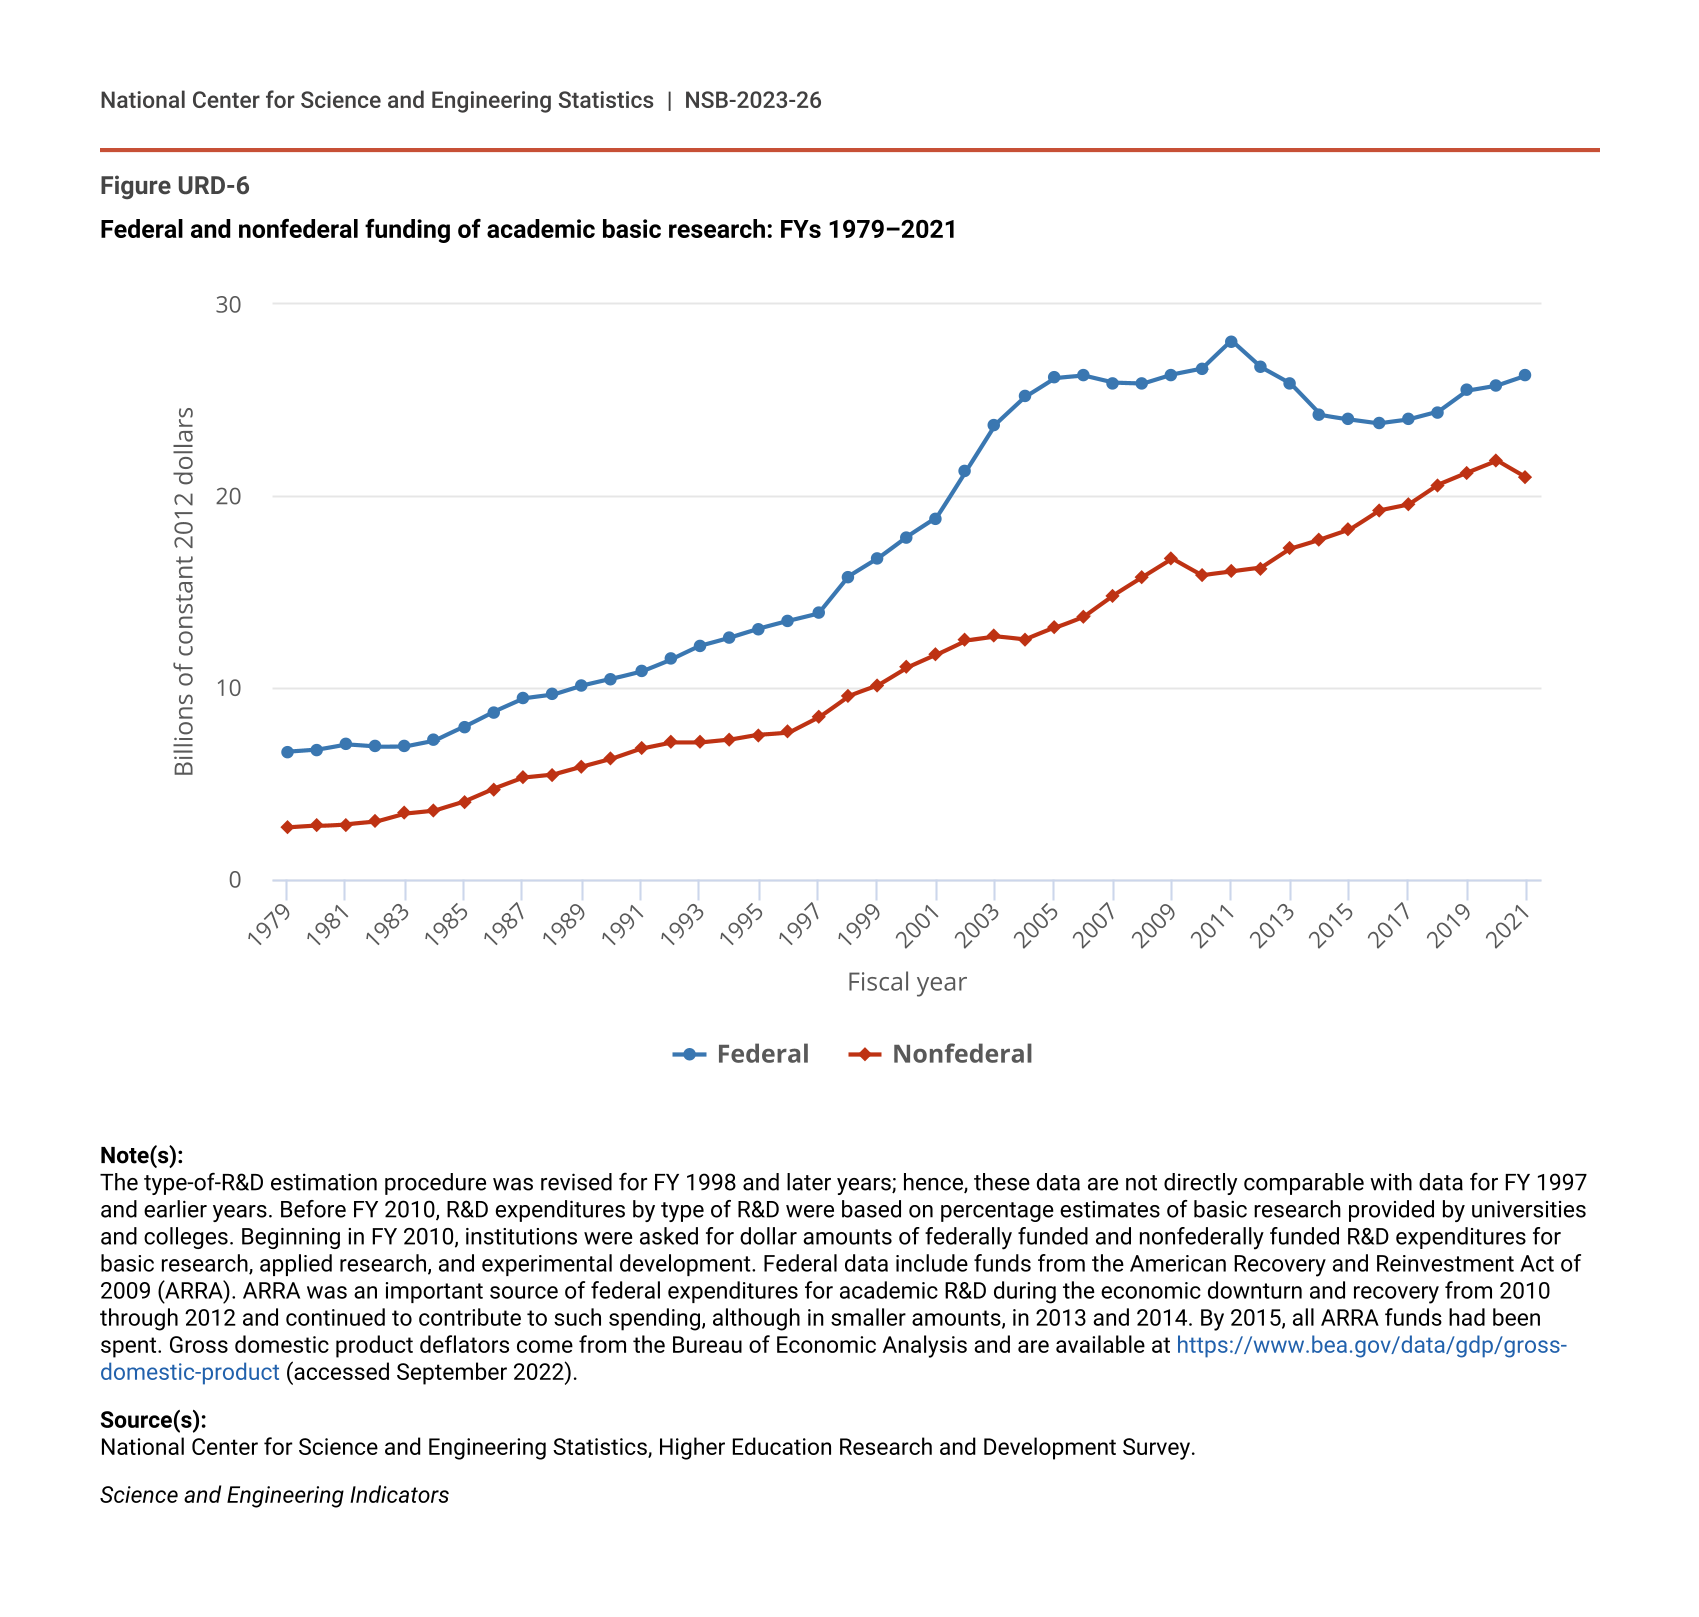
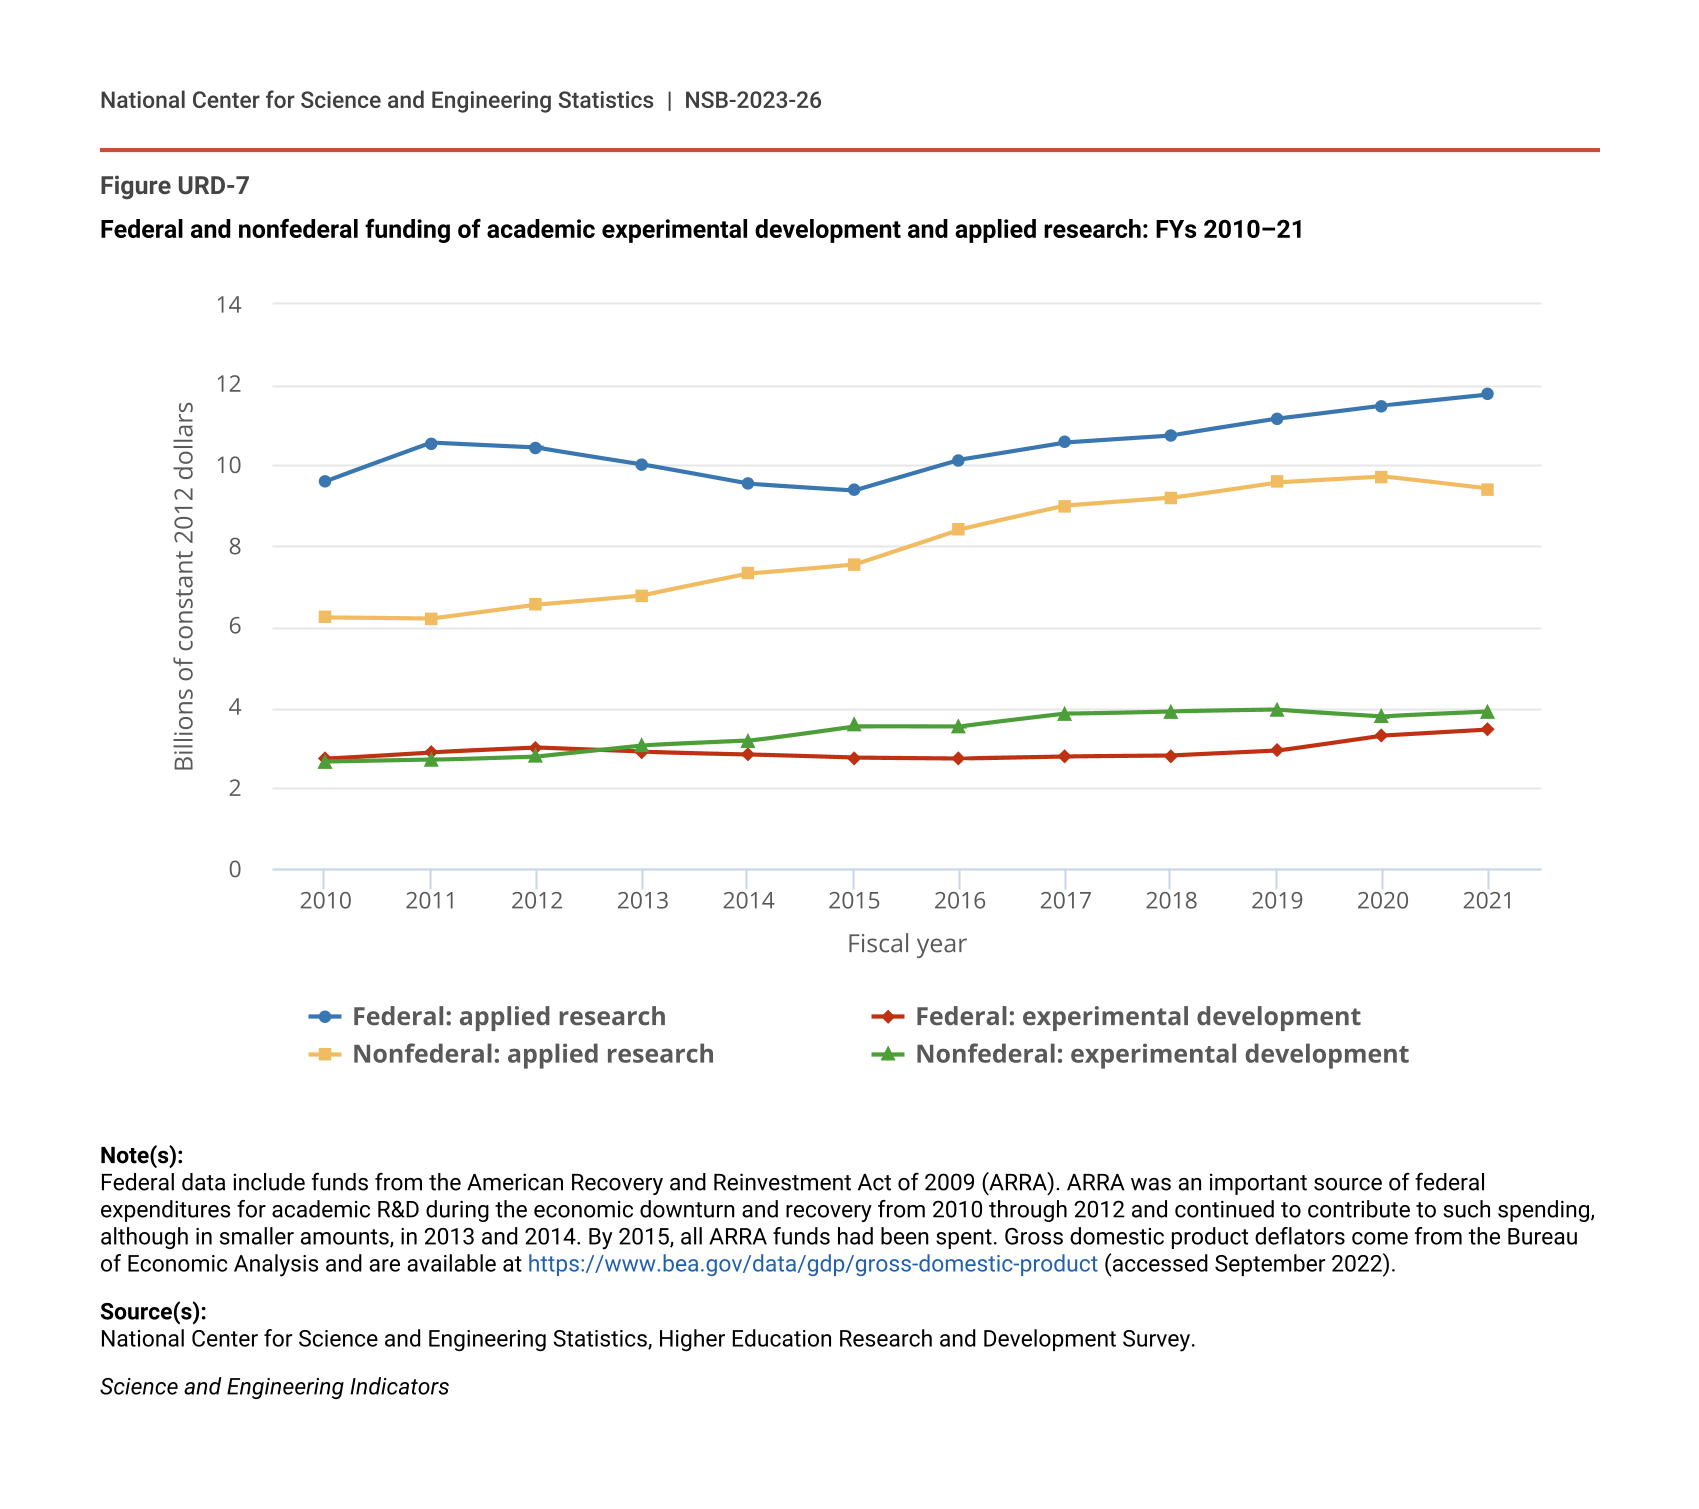
Federal support for basic research at academic institutions increased more rapidly between 1997 and 2005 than in any earlier period, spurred in particular by the effort to double the research budget at NIH (Kaiser 2002). That support began declining in 2011 (in constant dollar terms) but started to increase again in 2016. In 2021, federal support for basic research at academic institutions was 11% higher than in 2016, after adjusting for inflation (Figure URD-6) but remained below its level in 2011. In contrast, basic research support from nonfederal sources has increased fairly consistently in constant dollars since 1983. Federal and nonfederal support for applied research and experimental development were higher in 2021 than in 2011 (Figure URD-7).
Federal and nonfederal funding of academic basic research: FYs 1979–2021
| Fiscal year | Federal | Nonfederal |
|---|---|---|
| 1979 | 6.65 | 2.69 |
| 1980 | 6.77 | 2.78 |
| 1981 | 7.05 | 2.88 |
| 1982 | 6.93 | 3.01 |
| 1983 | 6.95 | 3.44 |
| 1984 | 7.25 | 3.60 |
| 1985 | 7.96 | 4.06 |
| 1986 | 8.75 | 4.72 |
| 1987 | 9.43 | 5.29 |
| 1988 | 9.62 | 5.45 |
| 1989 | 10.10 | 5.87 |
| 1990 | 10.45 | 6.28 |
| 1991 | 10.84 | 6.81 |
| 1992 | 11.47 | 7.13 |
| 1993 | 12.19 | 7.12 |
| 1994 | 12.62 | 7.27 |
| 1995 | 13.09 | 7.54 |
| 1996 | 13.49 | 7.67 |
| 1997 | 13.87 | 8.45 |
| 1998 | 15.77 | 9.56 |
| 1999 | 16.71 | 10.10 |
| 2000 | 17.86 | 11.04 |
| 2001 | 18.85 | 11.72 |
| 2002 | 21.30 | 12.47 |
| 2003 | 23.75 | 12.68 |
| 2004 | 25.17 | 12.50 |
| 2005 | 26.15 | 13.11 |
| 2006 | 26.27 | 13.73 |
| 2007 | 25.91 | 14.82 |
| 2008 | 25.87 | 15.77 |
| 2009 | 26.34 | 16.72 |
| 2010 | 26.64 | 15.87 |
| 2011 | 28.09 | 16.05 |
| 2012 | 26.70 | 16.24 |
| 2013 | 25.84 | 17.24 |
| 2014 | 24.23 | 17.72 |
| 2015 | 24.01 | 18.24 |
| 2016 | 23.80 | 19.24 |
| 2017 | 23.99 | 19.55 |
| 2018 | 24.39 | 20.59 |
| 2019 | 25.51 | 21.23 |
| 2020 | 25.78 | 21.85 |
| 2021 | 26.30 | 20.97 |
Note(s):
The type-of-R&D estimation procedure was revised for FY 1998 and later years; hence, these data are not directly comparable with data for FY 1997 and earlier years. Before FY 2010, R&D expenditures by type of R&D were based on percentage estimates of basic research provided by universities and colleges. Beginning in FY 2010, institutions were asked for dollar amounts of federally funded and nonfederally funded R&D expenditures for basic research, applied research, and experimental development. Federal data include funds from the American Recovery and Reinvestment Act of 2009 (ARRA). ARRA was an important source of federal expenditures for academic R&D during the economic downturn and recovery from 2010 through 2012 and continued to contribute to such spending, although in smaller amounts, in 2013 and 2014. By 2015, all ARRA funds had been spent. Gross domestic product deflators come from the Bureau of Economic Analysis and are available at https://www.bea.gov/data/gdp/gross-domestic-product (accessed September 2022).
Source(s):
National Center for Science and Engineering Statistics, Higher Education Research and Development Survey.
Science and Engineering Indicators
Federal and nonfederal funding of academic experimental development and applied research: FYs 2010–21
| Fiscal year | Federal: applied research | Federal: experimental development | Nonfederal: applied research | Nonfederal: experimental development |
|---|---|---|---|---|
| 2010 | 9.61 | 2.73 | 6.24 | 2.65 |
| 2011 | 10.56 | 2.89 | 6.21 | 2.70 |
| 2012 | 10.44 | 3.00 | 6.56 | 2.79 |
| 2013 | 10.03 | 2.90 | 6.79 | 3.06 |
| 2014 | 9.55 | 2.84 | 7.32 | 3.17 |
| 2015 | 9.39 | 2.76 | 7.55 | 3.54 |
| 2016 | 10.15 | 2.74 | 8.42 | 3.53 |
| 2017 | 10.58 | 2.79 | 9.00 | 3.84 |
| 2018 | 10.75 | 2.81 | 9.20 | 3.90 |
| 2019 | 11.16 | 2.93 | 9.59 | 3.94 |
| 2020 | 11.49 | 3.31 | 9.73 | 3.78 |
| 2021 | 11.76 | 3.46 | 9.42 | 3.89 |
Note(s):
Federal data include funds from the American Recovery and Reinvestment Act of 2009 (ARRA). ARRA was an important source of federal expenditures for academic R&D during the economic downturn and recovery from 2010 through 2012 and continued to contribute to such spending, although in smaller amounts, in 2013 and 2014. By 2015, all ARRA funds had been spent. Gross domestic product deflators come from the Bureau of Economic Analysis and are available at https://www.bea.gov/data/gdp/gross-domestic-product (accessed September 2022).
Source(s):
National Center for Science and Engineering Statistics, Higher Education Research and Development Survey.
Science and Engineering Indicators
Spending, by Type of Institution
The level and distribution of spending on academic R&D vary across institutions. Out of 3,733 postsecondary degree–granting institutions in the United States in 2020, 620 reported more than $1 million in R&D expenditures in that year (NCSES HERD 2021: Table A-5). The 131 doctoral universities with very high research activity, based on the Carnegie Classification as of 2018, spent nearly 75% of all reported academic R&D funds in 2021. These institutions also awarded approximately 80% of U.S. doctoral degrees in S&E in 2021 (NCSES SED 2021: Table 1-2) and enrolled more than 81% of doctoral students in those fields (NCSES GSS 2021: Table 5-3).
In 2021, the top 30 institutions, ranked by total R&D spending, accounted for over 42% of all U.S. academic R&D (NCSES HERD 2021: Table 21). This concentration of R&D spending in a relatively small number of institutions is a long-standing characteristic of U.S. academic R&D spending (see [NSB Indicators 2018: Figure 5-5]). Furthermore, the composition of the top-ranked institutions, as measured by academic R&D expenditures, has not shifted significantly over the past two decades (Table URD-2). Of the 10 top-ranked institutions in 2001, 9 institutions remained among the top 10 in 2021, although they were in a different order. Of the 30 top-ranked institutions in 2001, 24 institutions remained among the top 30 in 2021.
Top 30 institutions, ranked by R&D expenditures: FYs 2001, 2011, and 2021
a Institution does not have a medical school.
Source(s):
National Center for Science and Engineering Statistics, Higher Education Research and Development Survey.
Science and Engineering Indicators
Spending at Public and Private Institutions
In 2021, public universities were responsible for 65% of academic R&D spending, and private universities spent the remainder; this proportion has remained roughly stable for more than a decade (NCSES HERD 2021: Table 17). R&D spending is more concentrated among private institutions. In 2021, the top 25 private universities spent more than 75% of the private academic R&D total, whereas the top 25 public universities spent around 46% of the public total (NCSES HERD 2021: Table 37 and Table 38).
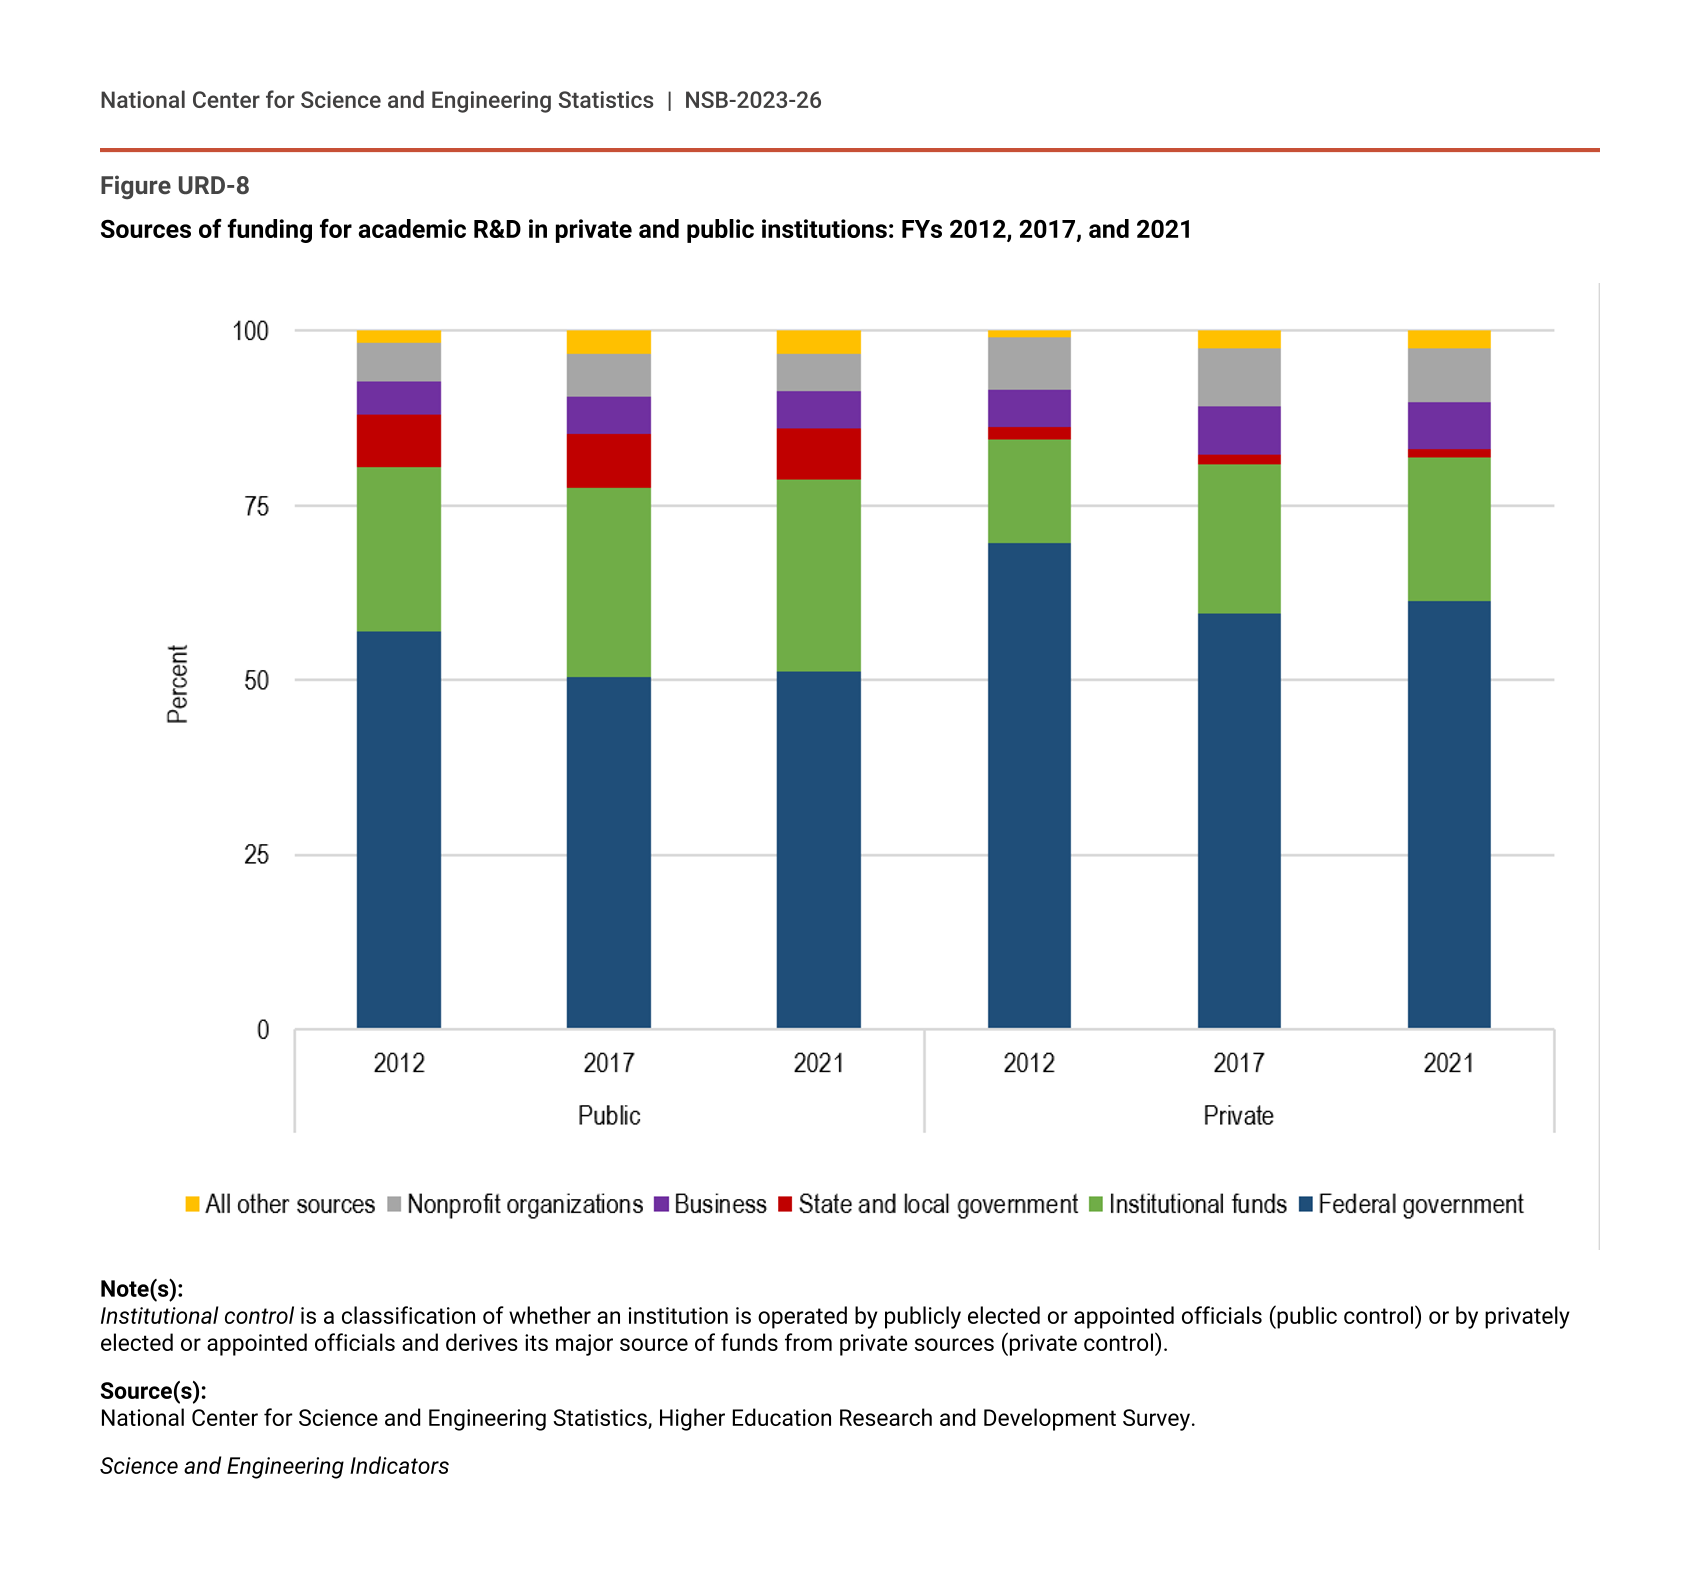
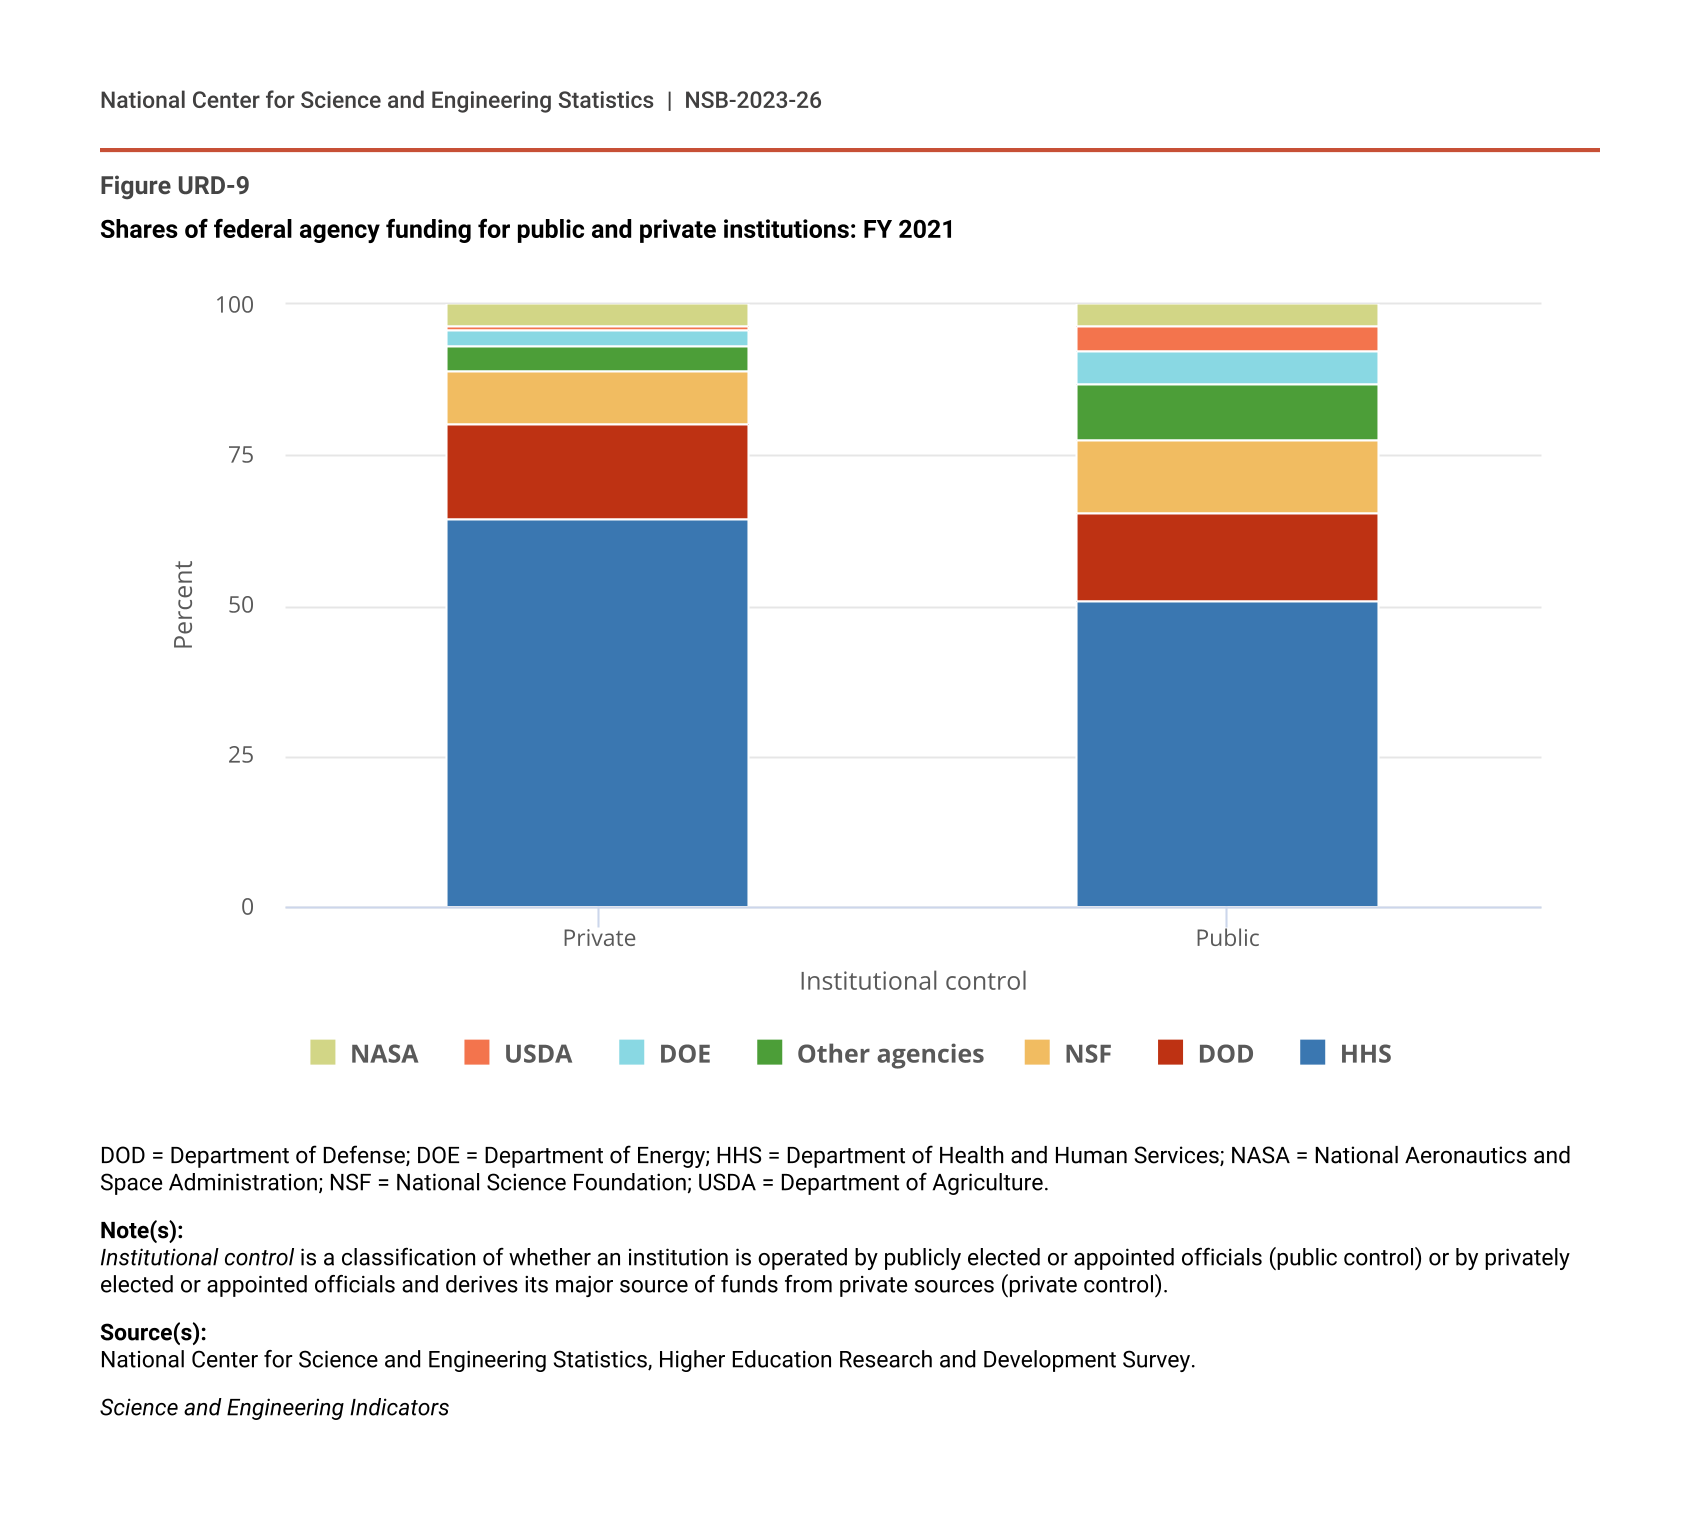
Sources of funding for academic R&D in public and private universities differ (Figure URD-8). Since at least 2012, private universities have received a greater share of their R&D spending from federal support, whereas institutional funds and funding from state and local government have been more prevalent sources for public universities. Within the share funded by federal sources, HHS contributed to R&D spending at private universities to a greater degree than at public universities, and the Department of Agriculture (USDA) contributed relatively more to spending at public universities (Figure URD-9).
Sources of funding for academic R&D in private and public institutions: FYs 2012, 2017, and 2021
Note(s):
Institutional control is a classification of whether an institution is operated by publicly elected or appointed officials (public control) or by privately elected or appointed officials and derives its major source of funds from private sources (private control).
Source(s):
National Center for Science and Engineering Statistics, Higher Education Research and Development Survey.
Science and Engineering Indicators
Shares of federal agency funding for public and private institutions: FY 2021
| Institutional control | HHS | DOD | NSF | Other agencies | DOE | USDA | NASA |
|---|---|---|---|---|---|---|---|
| Private | 64.3 | 15.9 | 8.9 | 3.9 | 2.9 | 0.5 | 3.6 |
| Public | 50.8 | 14.4 | 12.3 | 9.3 | 5.5 | 4.0 | 3.6 |
DOD = Department of Defense; DOE = Department of Energy; HHS = Department of Health and Human Services; NASA = National Aeronautics and Space Administration; NSF = National Science Foundation; USDA = Department of Agriculture.
Note(s):
Institutional control is a classification of whether an institution is operated by publicly elected or appointed officials (public control) or by privately elected or appointed officials and derives its major source of funds from private sources (private control).
Source(s):
National Center for Science and Engineering Statistics, Higher Education Research and Development Survey.
Science and Engineering Indicators
Spending at Institutions with and without Medical Schools
Spending on biomedical R&D exerts considerable influence on overall patterns in academic R&D spending, such that more R&D support is concentrated in academic institutions that have medical schools. In 2021, 75% of all federally sourced spending for academic R&D went to institutions that also house a medical school, totaling $37 billion. Of the federally supported R&D at institutions with a medical school, $24.4 billion was provided by HHS, or about 89% of all HHS funds for academic R&D in that year (NCSES HERD 2021: Table 26 and Table 72). Institutions with medical schools accounted for more than half of the R&D spending supported by funds from each federal agency except USDA, although few agencies beyond NIH directly supported R&D at the medical schools themselves (NCSES HERD 2021: Table 26 and Table 72). These institutions also received 65% of nonfederal support for R&D spending in 2021, amounting to $28 billion (NCSES HERD 2021: Table 26, Table 69, and Table 72).
Spending at Minority-Serving Institutions
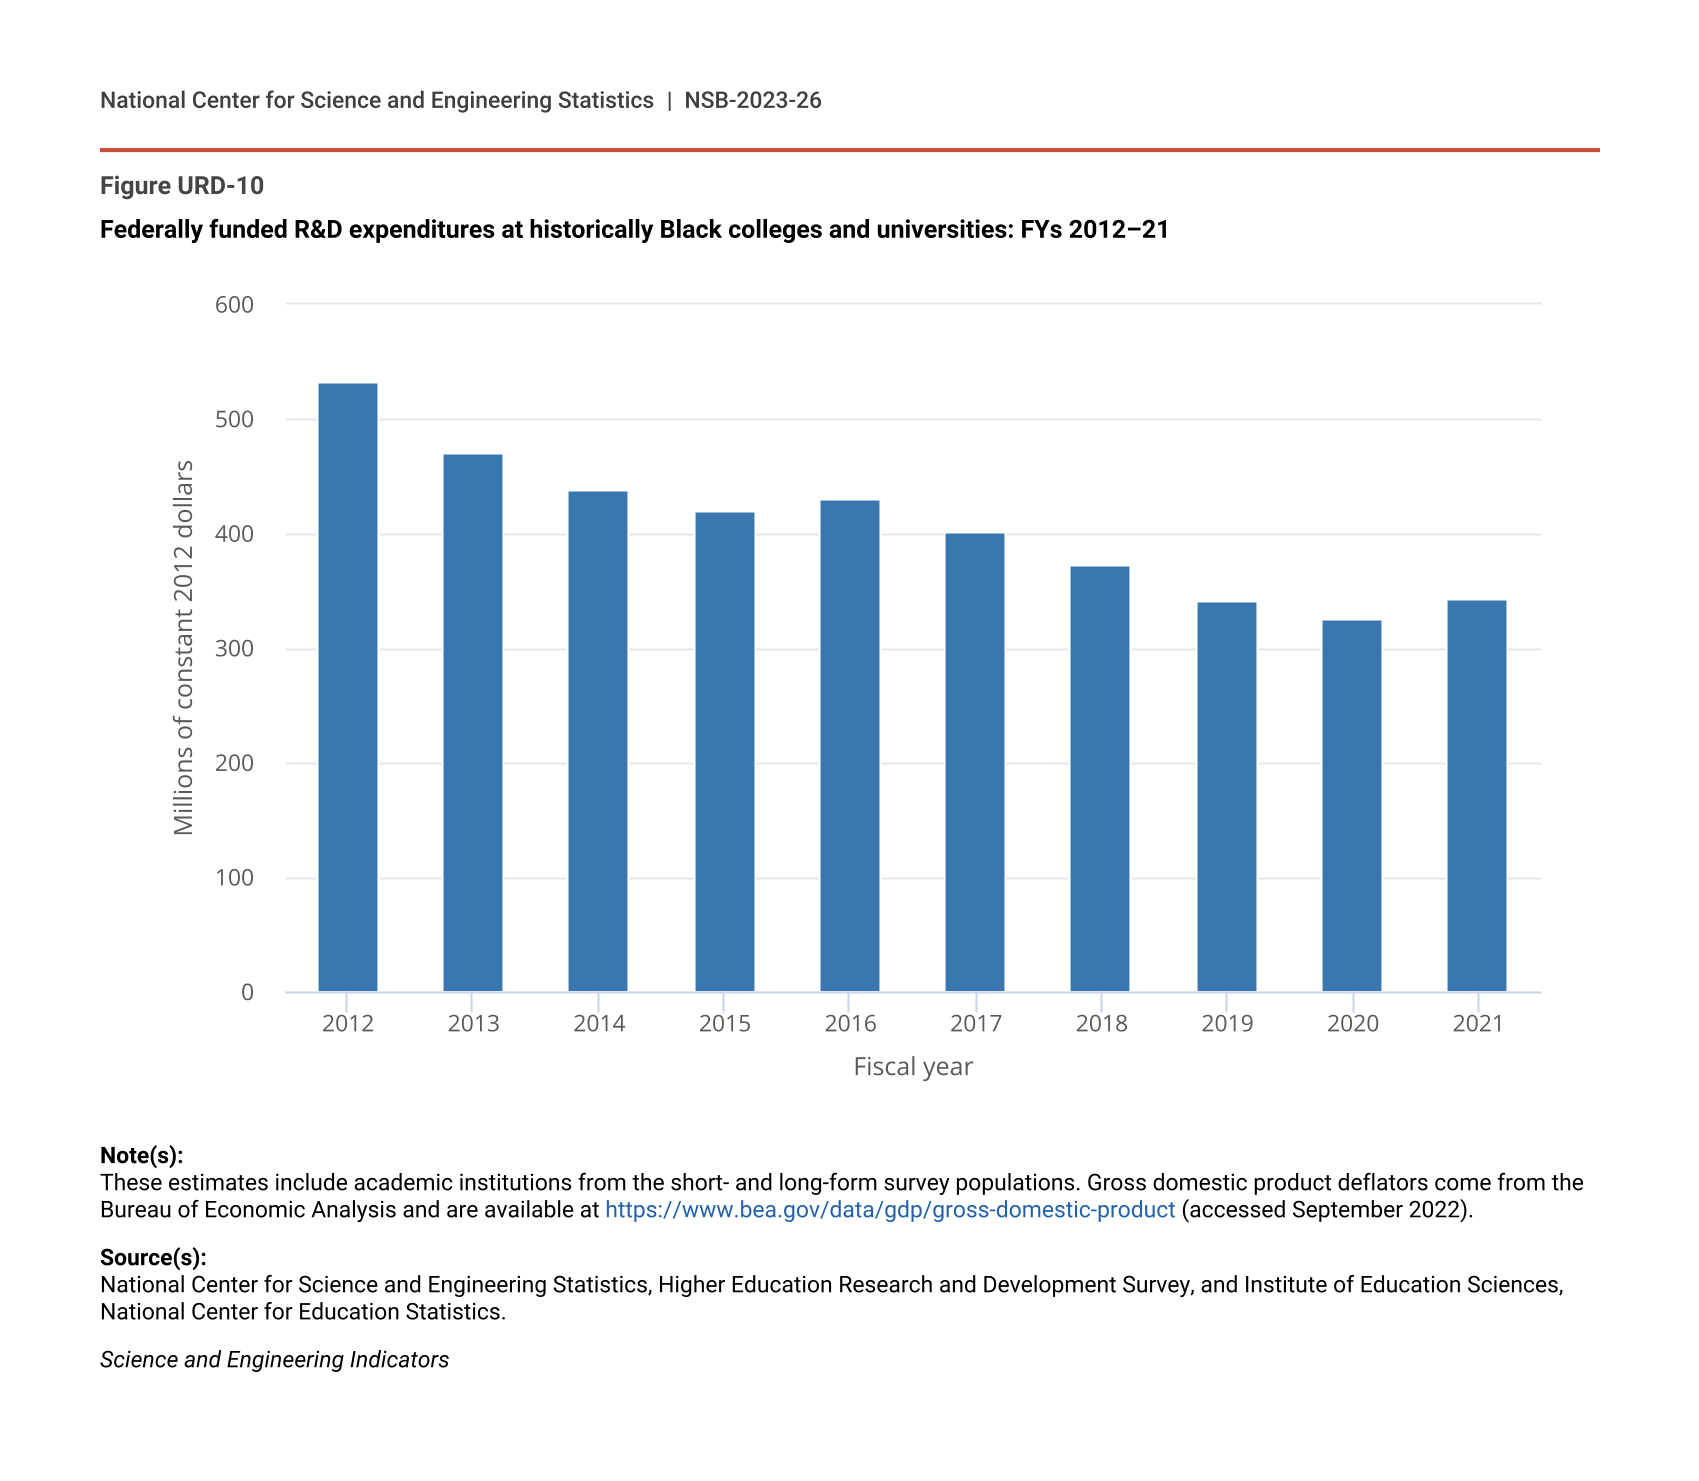
Minority-serving institutions (MSIs) include a diverse array of more than 800 federally designated institutions including, but not limited to, historically Black colleges and universities (HBCUs), high-Hispanic-enrollment (HHE) institutions, and tribal colleges and universities (TCUs). The HBCUs are institutions that are defined under the Higher Education Act of 1965 as those that were established to serve Black or African American (hereafter referred to as Black) students in the years before desegregation; according to the U.S. Department of Education, 103 HBCUs are operating as of 2022 (NCES 2023). In 2021, 56 HBCUs reported R&D expenditures in the HERD Survey, and their federally supported R&D spending totaled $339 million in constant 2012 dollars (Figure URD-10; NCSES HERD 2021: Table 32 and Table 84). These expenditures constitute less than 1% of total federally financed for U.S. academic R&D in 2021 (Figure URD-4). In 2012, 60 HBCUs responding to the survey reported $516 million in federally funded R&D expenditures, indicating that federal funding of R&D spending at HBCUs declined by 34% in constant dollars over this period. The federally funded expenditures reported in 2021 were 2% higher than the total reported in 2020, but it is not clear if this increase indicates a reversal of the long-term trend (Figure URD-10).
Federally funded R&D expenditures at historically Black colleges and universities: FYs 2012–21
| Fiscal year | R&D expenditures |
|---|---|
| 2012 | 533 |
| 2013 | 471 |
| 2014 | 439 |
| 2015 | 420 |
| 2016 | 431 |
| 2017 | 401 |
| 2018 | 372 |
| 2019 | 341 |
| 2020 | 325 |
| 2021 | 344 |
Note(s):
These estimates include academic institutions from the short- and long-form survey populations. Gross domestic product deflators come from the Bureau of Economic Analysis and are available at https://www.bea.gov/data/gdp/gross-domestic-product (accessed September 2022).
Source(s):
National Center for Science and Engineering Statistics, Higher Education Research and Development Survey, and Institute of Education Sciences, National Center for Education Statistics.
Science and Engineering Indicators
HHE institutions are universities in which Hispanic or Latino (hereafter referred to as Hispanic) students constitute at least 25% of full-time equivalent (FTE) student enrollment. In 2021, the 130 HHE institutions reporting expenditures in the HERD Survey spent a total of around $8.8 billion on academic R&D (NCSES HERD 2021: Table 34). The federal government provided around $4 billion (about 46%) of this spending, a lower percentage than its share of support for academic R&D at all institutions. The distribution of academic R&D spending across fields at HHE institutions did not differ substantially from the distribution by field for all U.S. universities (NCSES HERD 2021: Table 13 and Table 34).
Several 4-year TCUs reported R&D expenditures above the $150,000 reporting threshold in recent years; in some years, a few reported over $1 million in R&D spending. Four TCUs were represented in the population of reporting institutions for the HERD Survey in 2021, with R&D spending totaling approximately $3.1 million (NCSES HERD 2021: Table 82).
Geographic Distribution of Academic R&D Spending, by State
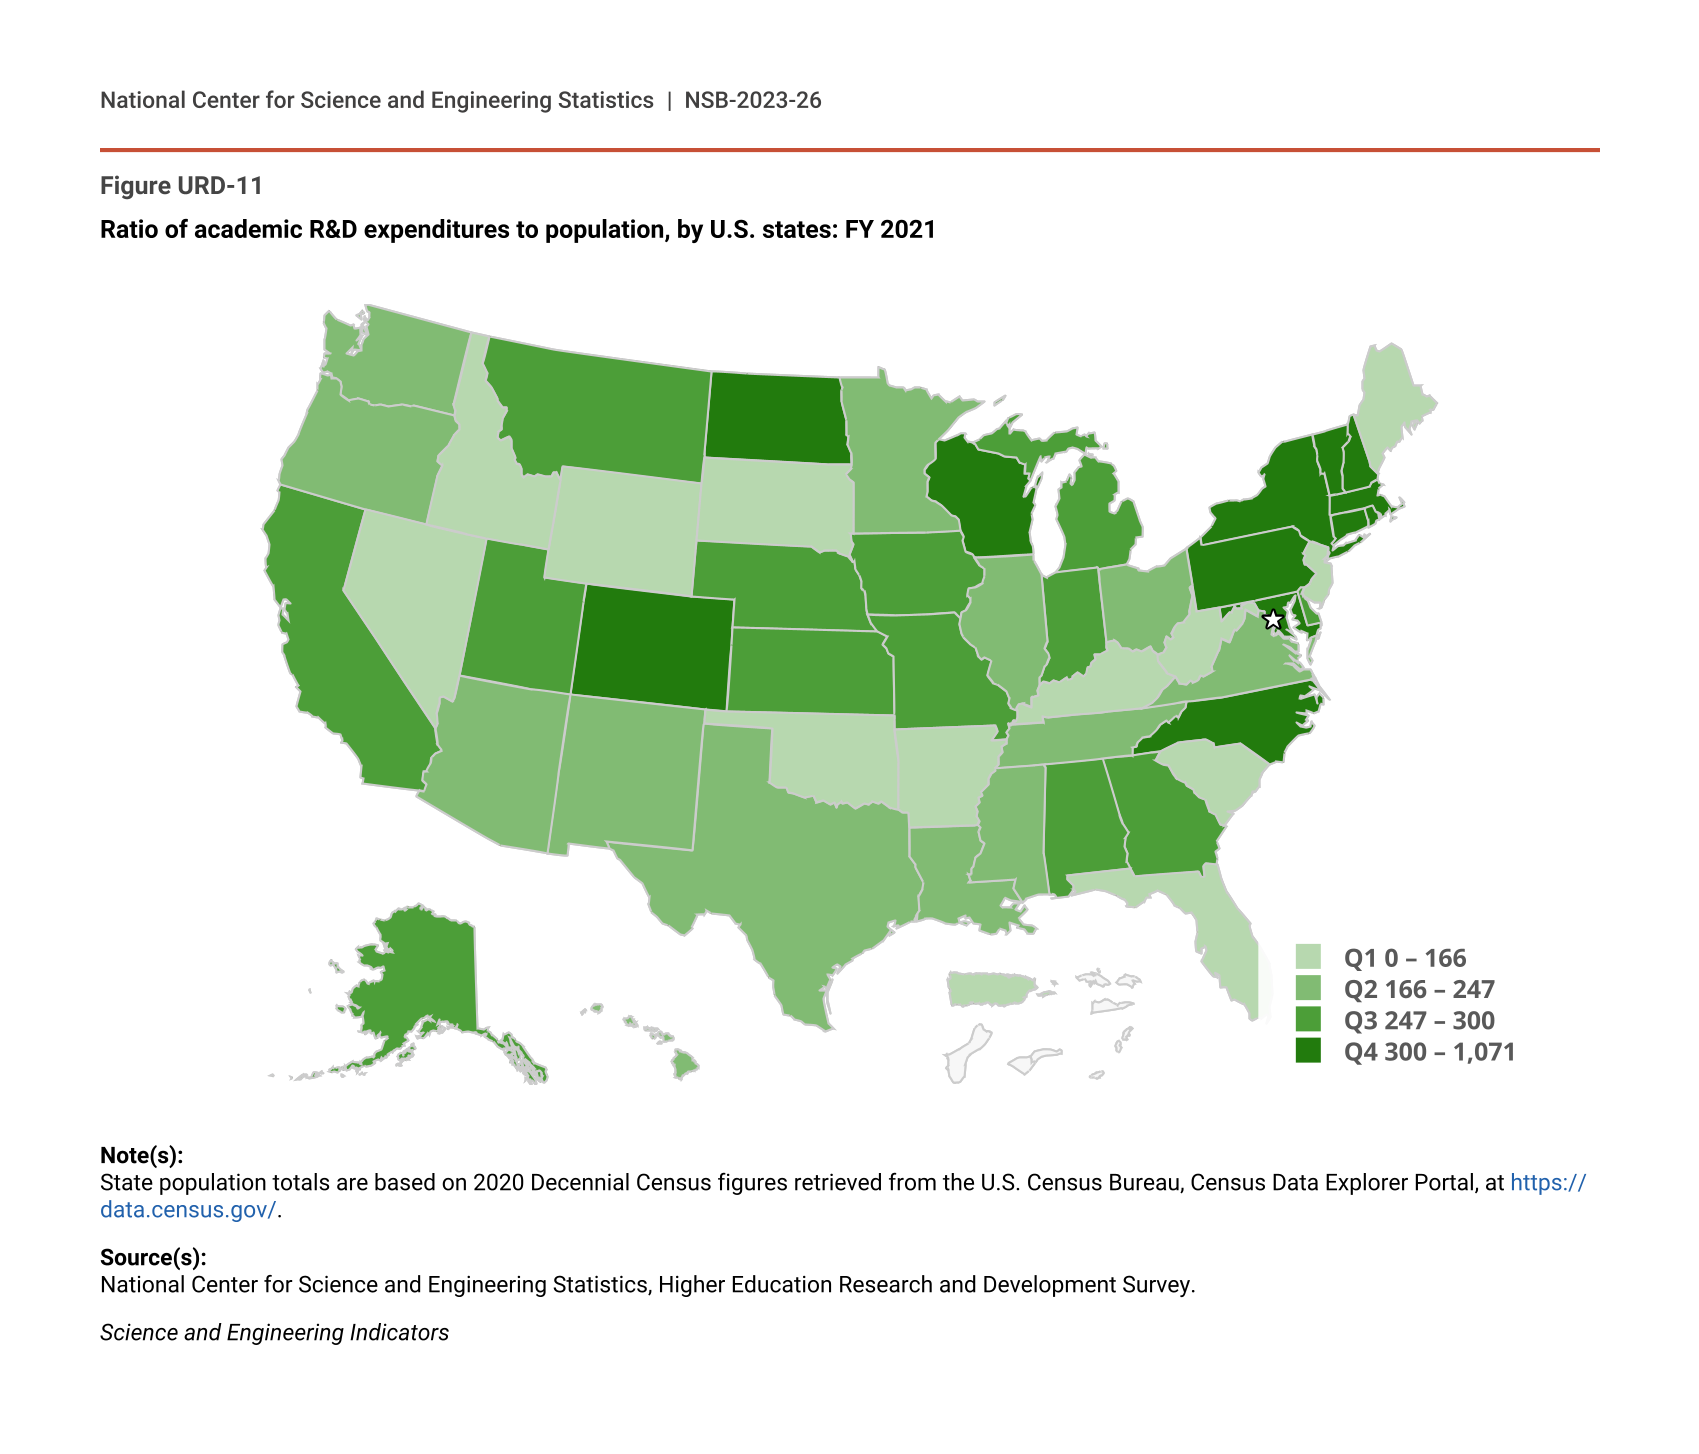
In 2021, academic R&D spending at institutions located in individual states ranged from about $93.0 million in Wyoming to about $11.2 billion in California (NCSES HERD 2021: Table 67). Differences in the level of academic R&D across states stem from the size of the states’ populations, the number and size of the academic research institutions in each state, and the interest and success of those institutions in attracting external research funding. Among the top 30 institutions ranked by R&D expenditures, most were public universities in states with large populations (e.g., California, Texas, Florida, Ohio) or prominent private universities (Table URD-2). Normalizing for the populations of the states (i.e., dividing total academic R&D spending in each state by that state’s population) provides an alternative perspective on geographical distribution of academic R&D spending. Some states with small populations, such as Maryland and Massachusetts, ranked highly, whereas some states with large populations, such as Texas and Florida, ranked much lower when viewed this way (Figure URD-11). More details on R&D spending in specific states can be found at the Indicators website (https://ncses.nsf.gov/indicators/states/).
Ratio of academic R&D expenditures to population, by U.S. states: FY 2021
| State | R&D expenditures (current dollars) | Population | Ratio of academic R&D expenditures to population |
|---|---|---|---|
| District of Columbia | 717,928,000 | 670,050 | 1,071 |
| Maryland | 4,914,256,000 | 6,165,129 | 797 |
| Massachusetts | 4,568,999,000 | 6,984,723 | 654 |
| Connecticut | 1,494,357,000 | 3,605,597 | 414 |
| North Dakota | 307,556,000 | 774,948 | 397 |
| Rhode Island | 425,750,000 | 1,095,610 | 389 |
| New York | 7,577,235,000 | 19,835,913 | 382 |
| Pennsylvania | 4,934,724,000 | 12,964,056 | 381 |
| New Hampshire | 498,518,000 | 1,388,992 | 359 |
| North Carolina | 3,503,943,000 | 10,551,162 | 332 |
| Vermont | 198,247,000 | 645,570 | 307 |
| Colorado | 1,746,975,000 | 5,812,069 | 301 |
| Wisconsin | 1,771,499,000 | 5,895,908 | 300 |
| Montana | 330,081,000 | 1,104,271 | 299 |
| Utah | 993,876,000 | 3,337,975 | 298 |
| Nebraska | 575,986,000 | 1,963,692 | 293 |
| Iowa | 931,207,000 | 3,193,079 | 292 |
| California | 11,229,857,000 | 39,237,836 | 286 |
| Michigan | 2,842,492,000 | 10,050,811 | 283 |
| Georgia | 2,949,654,000 | 10,799,566 | 273 |
| Alaska | 196,501,000 | 732,673 | 268 |
| Kansas | 785,055,000 | 2,934,582 | 268 |
| Missouri | 1,582,870,000 | 6,168,187 | 257 |
| Delaware | 254,725,000 | 1,003,384 | 254 |
| Alabama | 1,272,489,000 | 5,039,877 | 252 |
| Indiana | 1,699,302,000 | 6,805,985 | 250 |
| Washington | 1,881,044,000 | 7,738,692 | 243 |
| Ohio | 2,787,835,000 | 11,780,017 | 237 |
| Tennessee | 1,629,860,000 | 6,975,218 | 234 |
| Texas | 6,849,522,000 | 29,527,941 | 232 |
| Illinois | 2,914,398,000 | 12,671,469 | 230 |
| Virginia | 1,942,260,000 | 8,642,274 | 225 |
| New Mexico | 473,020,000 | 2,115,877 | 224 |
| Oregon | 929,355,000 | 4,246,155 | 219 |
| Arizona | 1,516,463,000 | 7,276,316 | 208 |
| Hawaii | 294,913,000 | 1,441,553 | 205 |
| Minnesota | 1,115,363,000 | 5,707,390 | 195 |
| Louisiana | 830,787,000 | 4,624,047 | 180 |
| Mississippi | 491,172,000 | 2,949,965 | 167 |
| Wyoming | 93,202,000 | 578,803 | 161 |
| Oklahoma | 622,581,000 | 3,986,639 | 156 |
| New Jersey | 1,352,770,000 | 9,267,130 | 146 |
| Kentucky | 655,290,000 | 4,509,394 | 145 |
| South Carolina | 753,287,000 | 5,190,705 | 145 |
| West Virginia | 231,347,000 | 1,782,959 | 130 |
| Arkansas | 387,674,000 | 3,025,891 | 128 |
| Florida | 2,769,387,000 | 21,781,128 | 127 |
| Maine | 165,224,000 | 1,372,247 | 120 |
| South Dakota | 100,534,000 | 895,376 | 112 |
| Nevada | 308,745,000 | 3,143,991 | 98 |
| Idaho | 165,913,000 | 1,900,923 | 87 |
| Puerto Rico | 123,707,000 | 3,263,584 | 38 |
Note(s):
State population totals are based on 2020 Decennial Census figures retrieved from the U.S. Census Bureau, Census Data Explorer Portal, at https://data.census.gov/.
Source(s):
National Center for Science and Engineering Statistics, Higher Education Research and Development Survey.
Science and Engineering Indicators
Academic R&D Spending, by Field
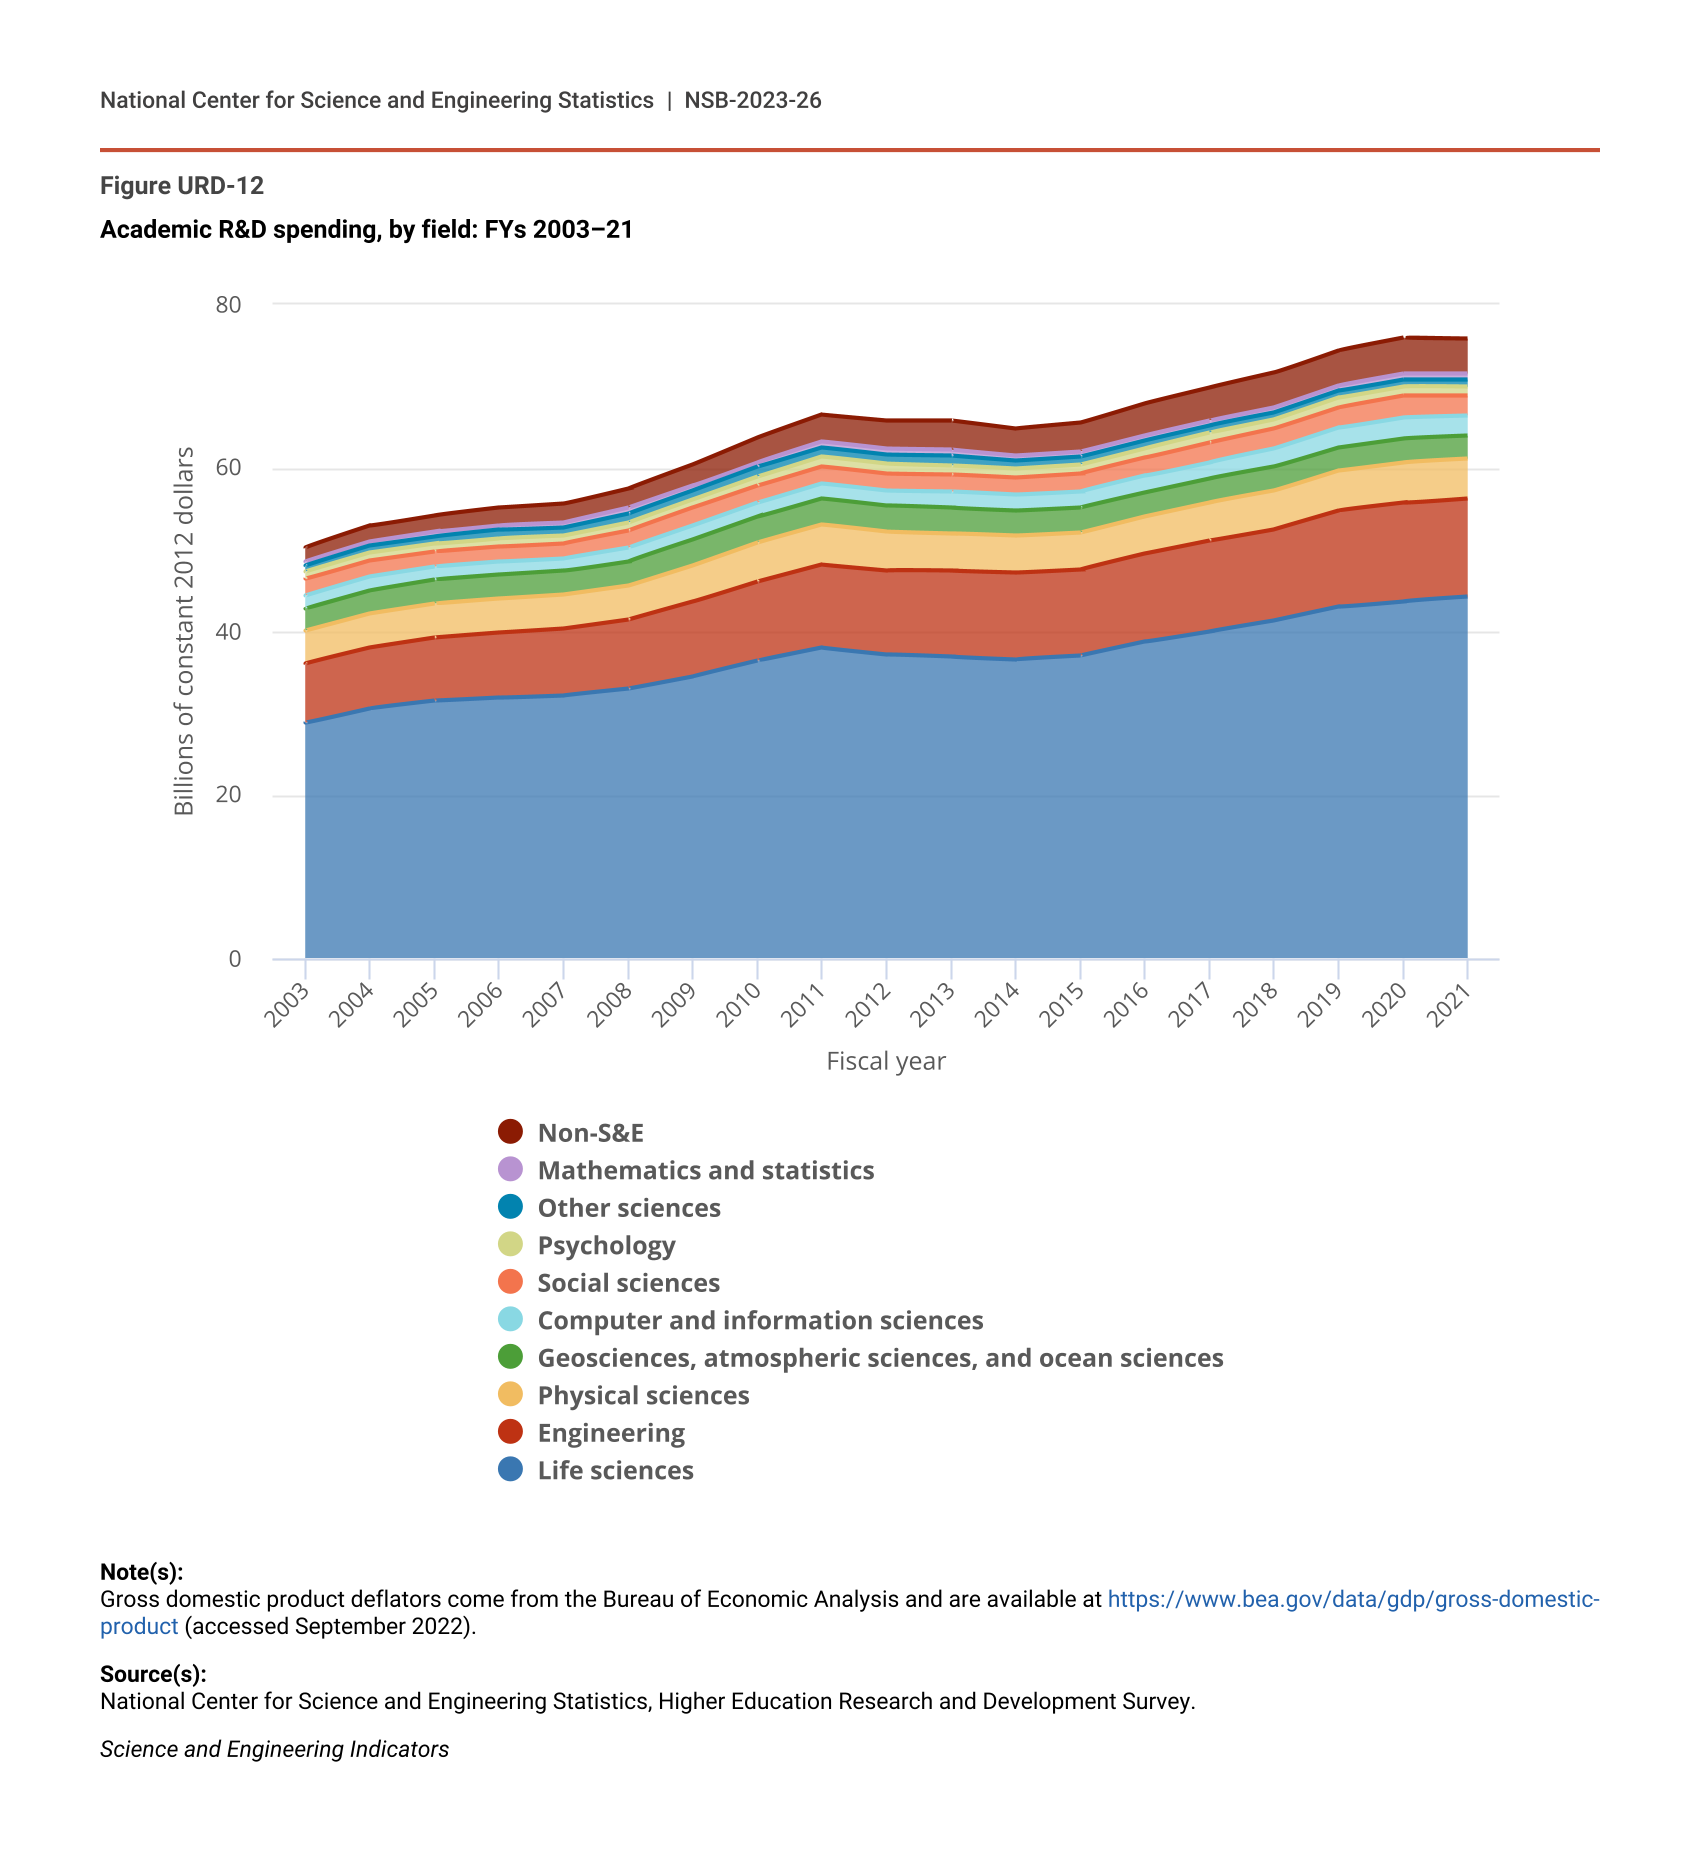
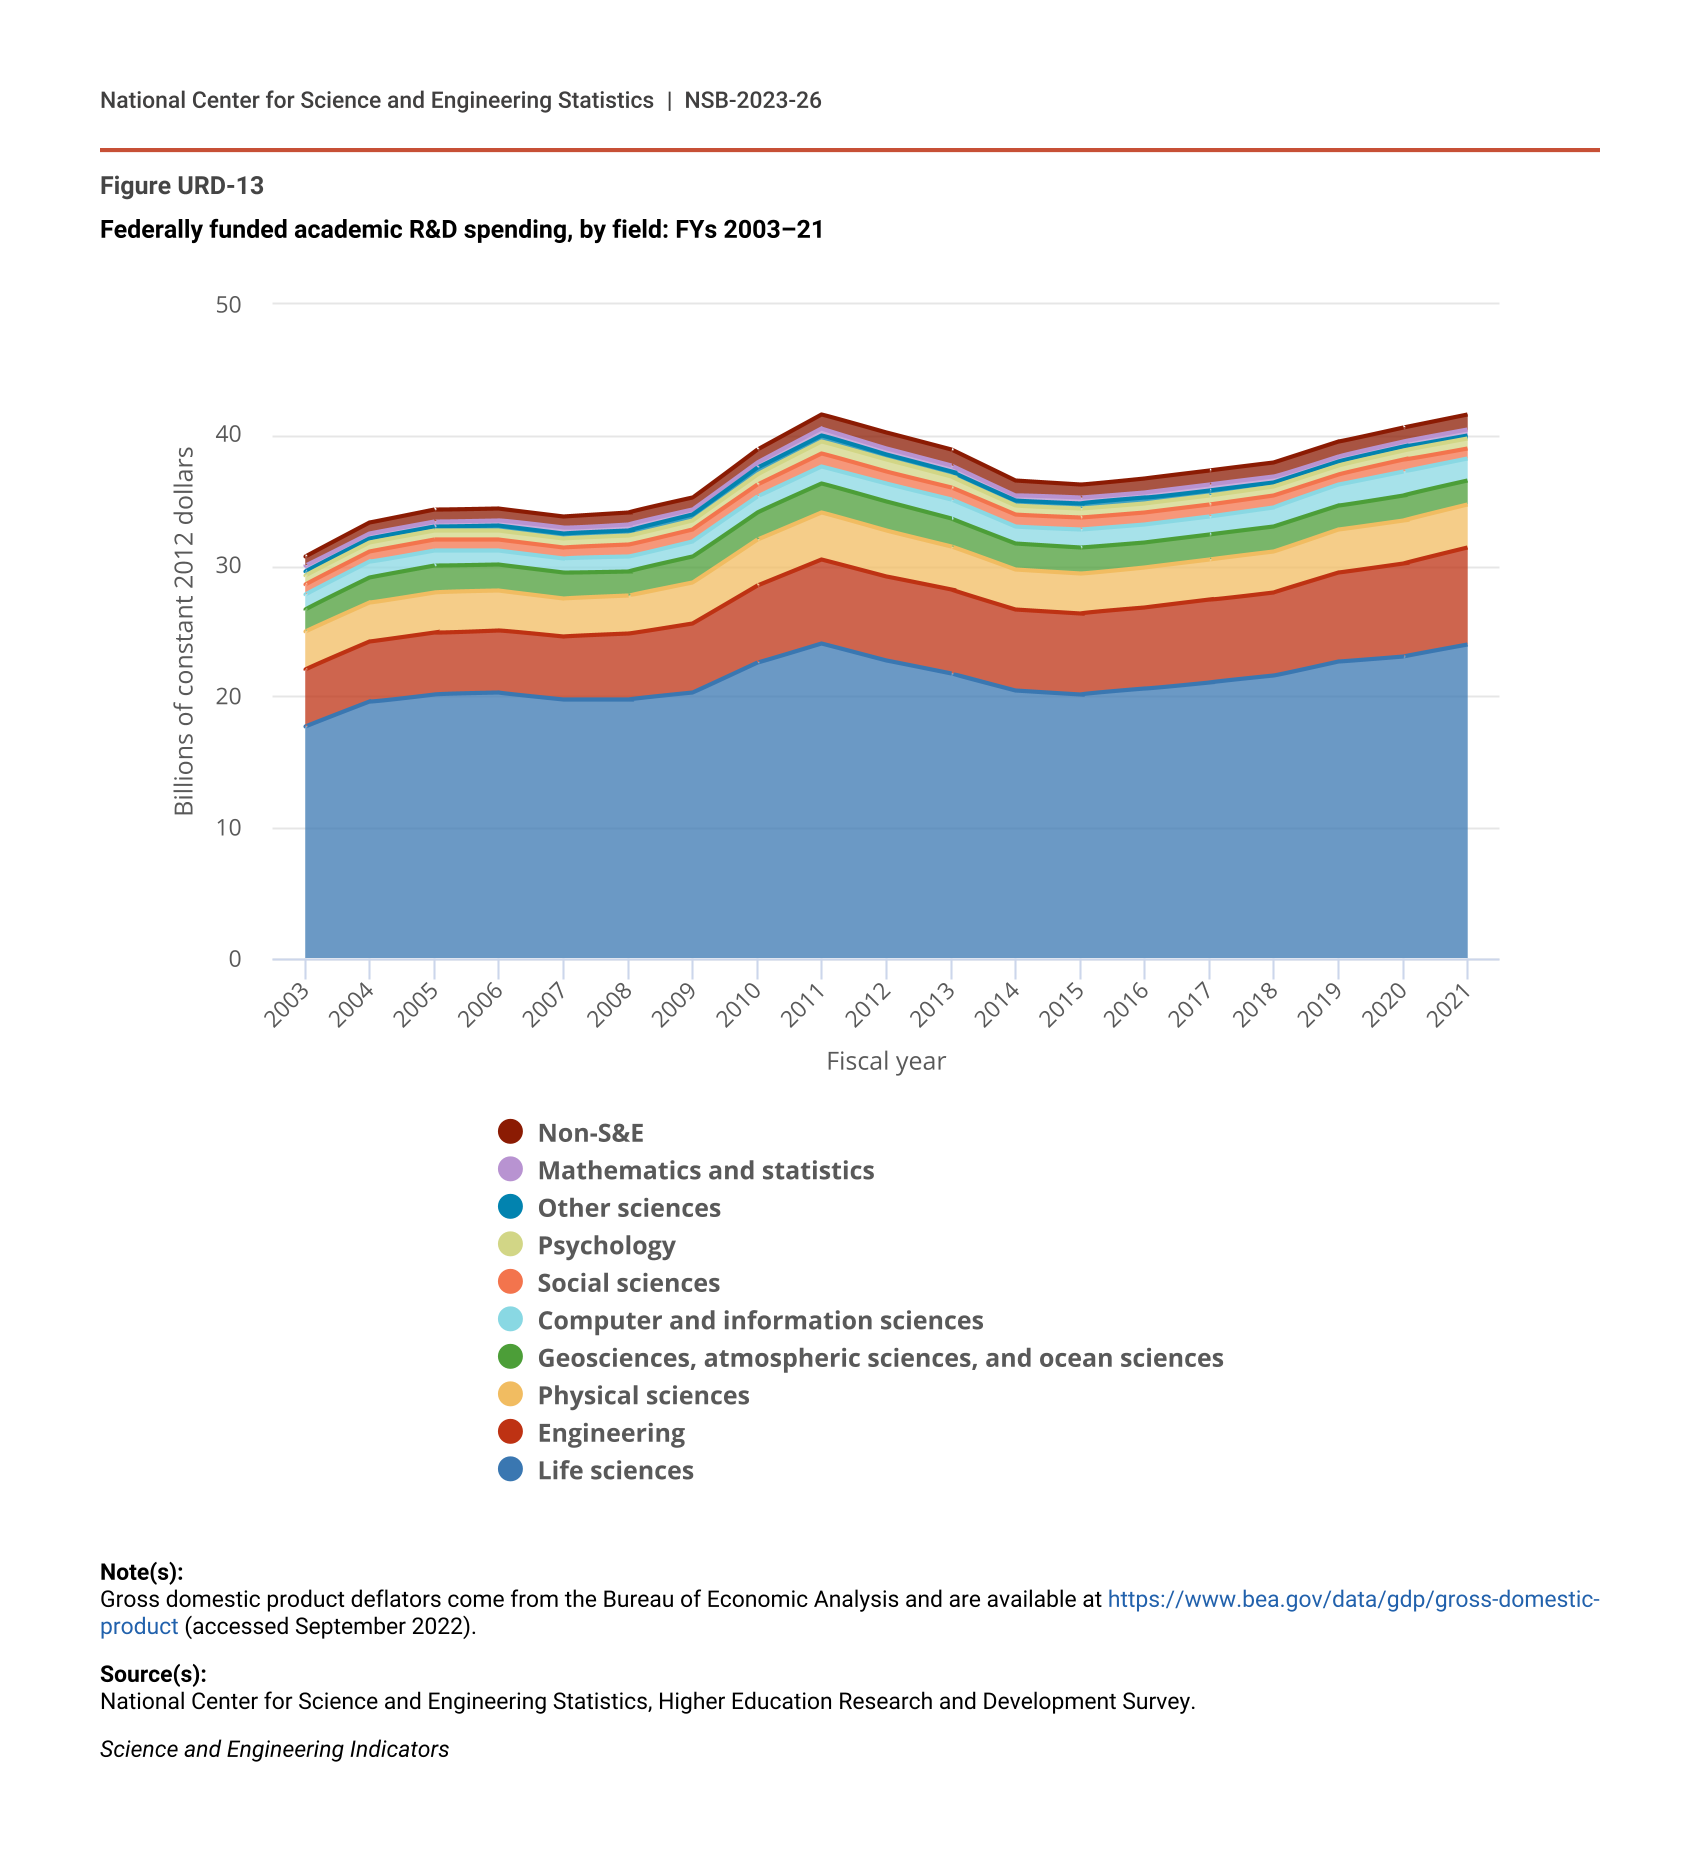
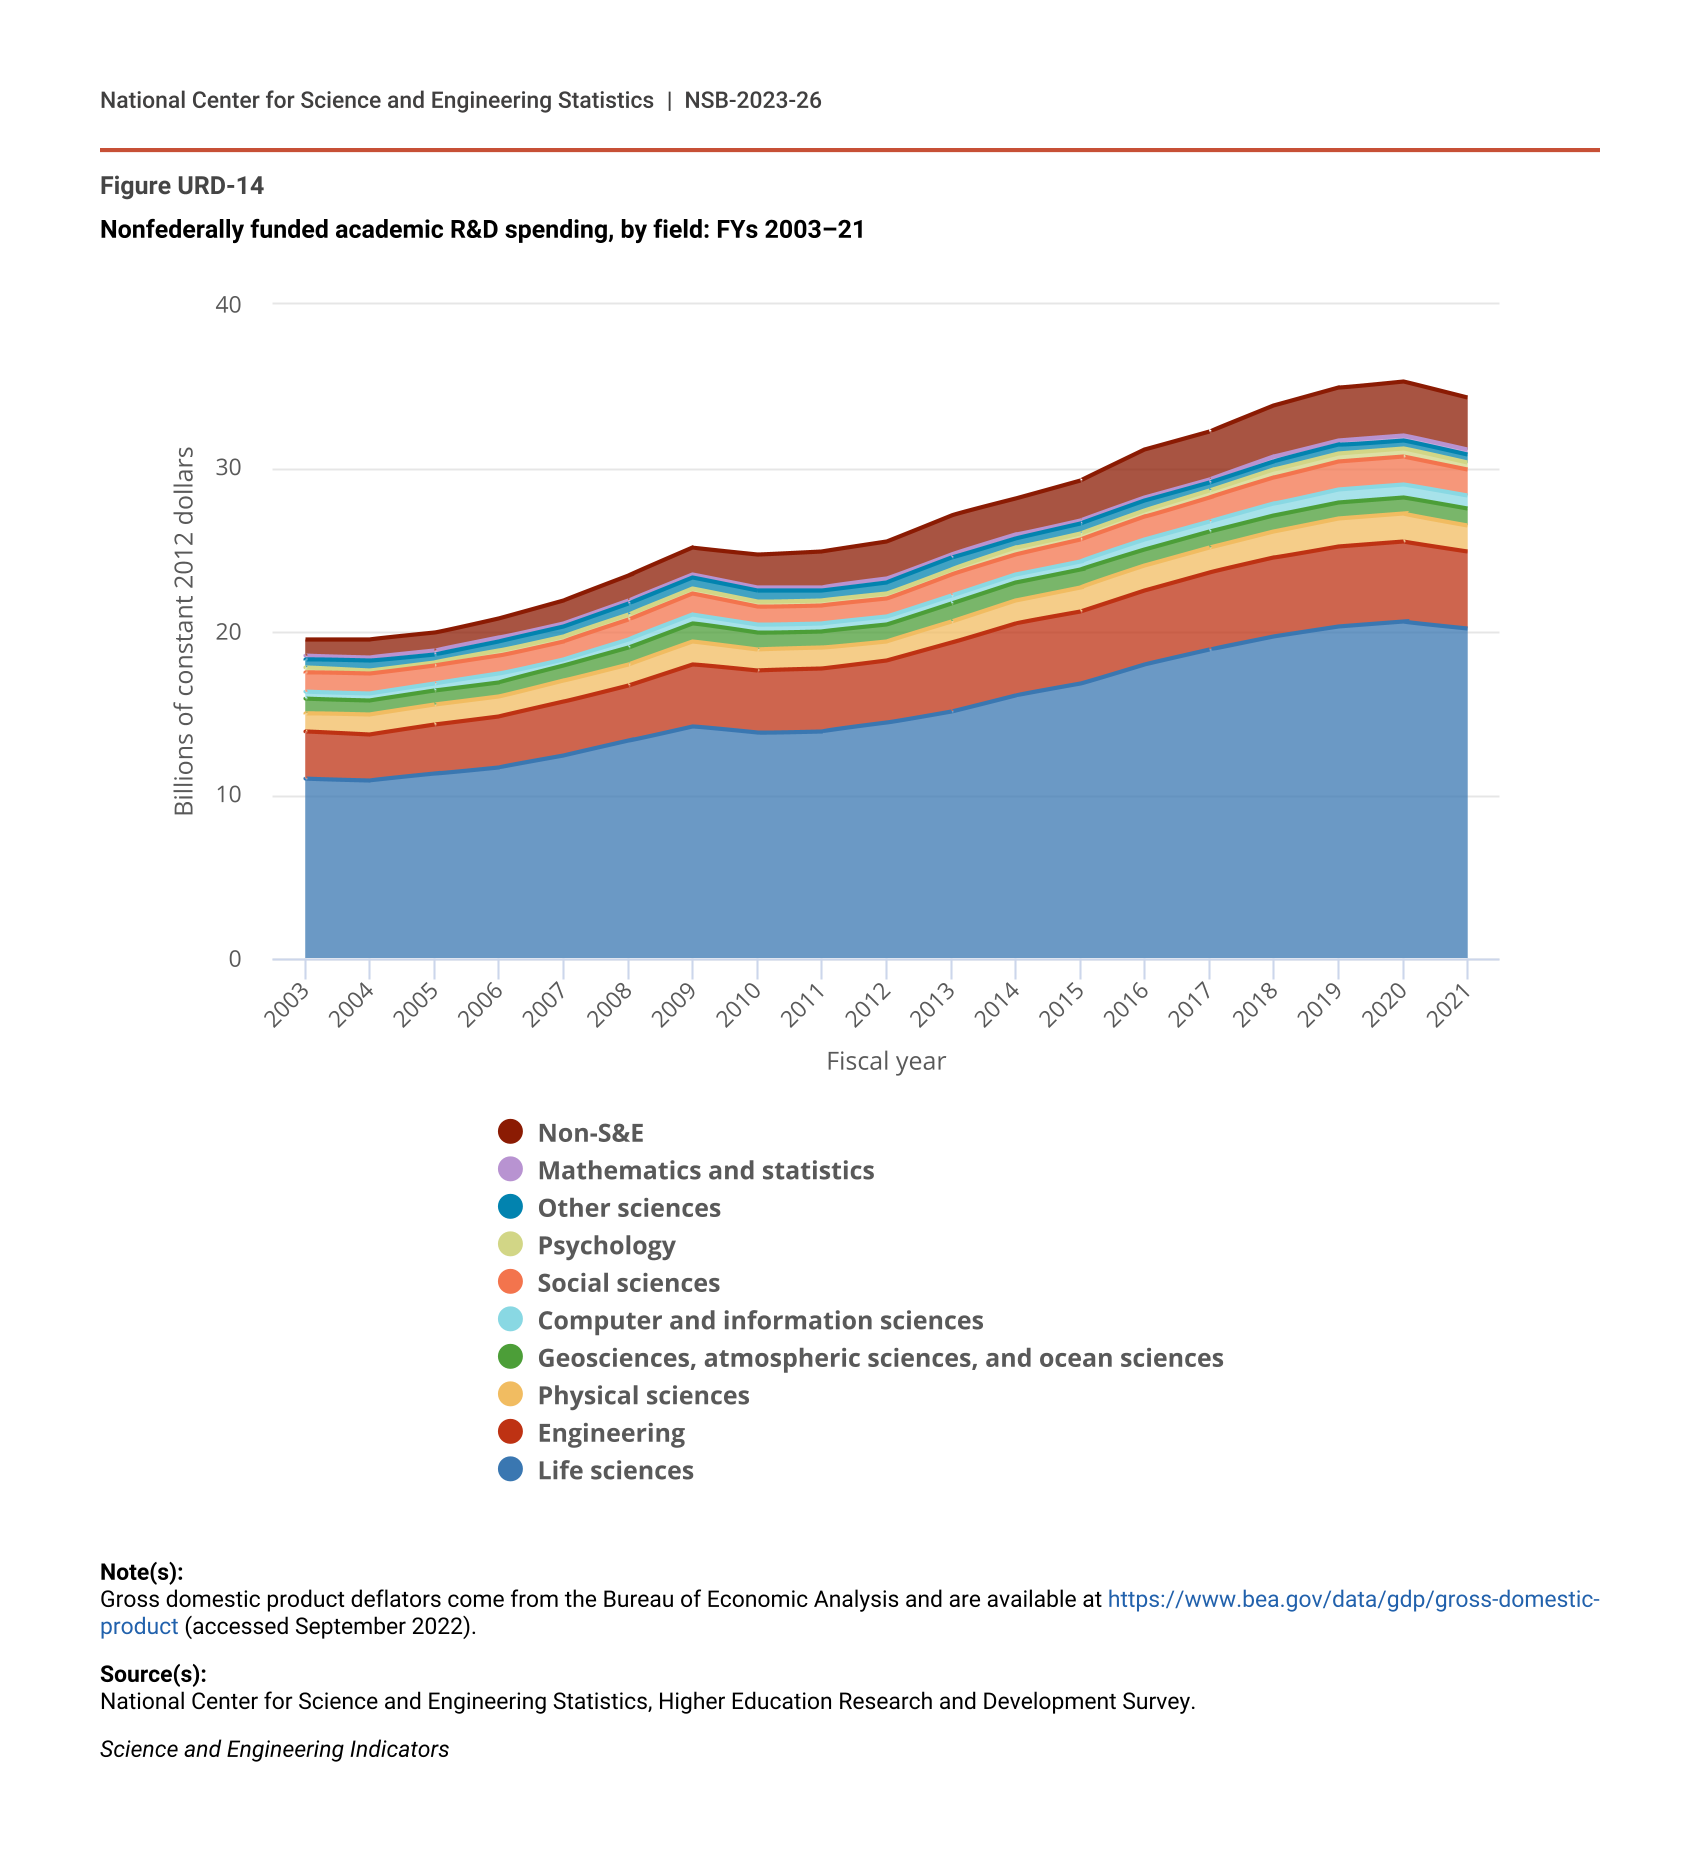
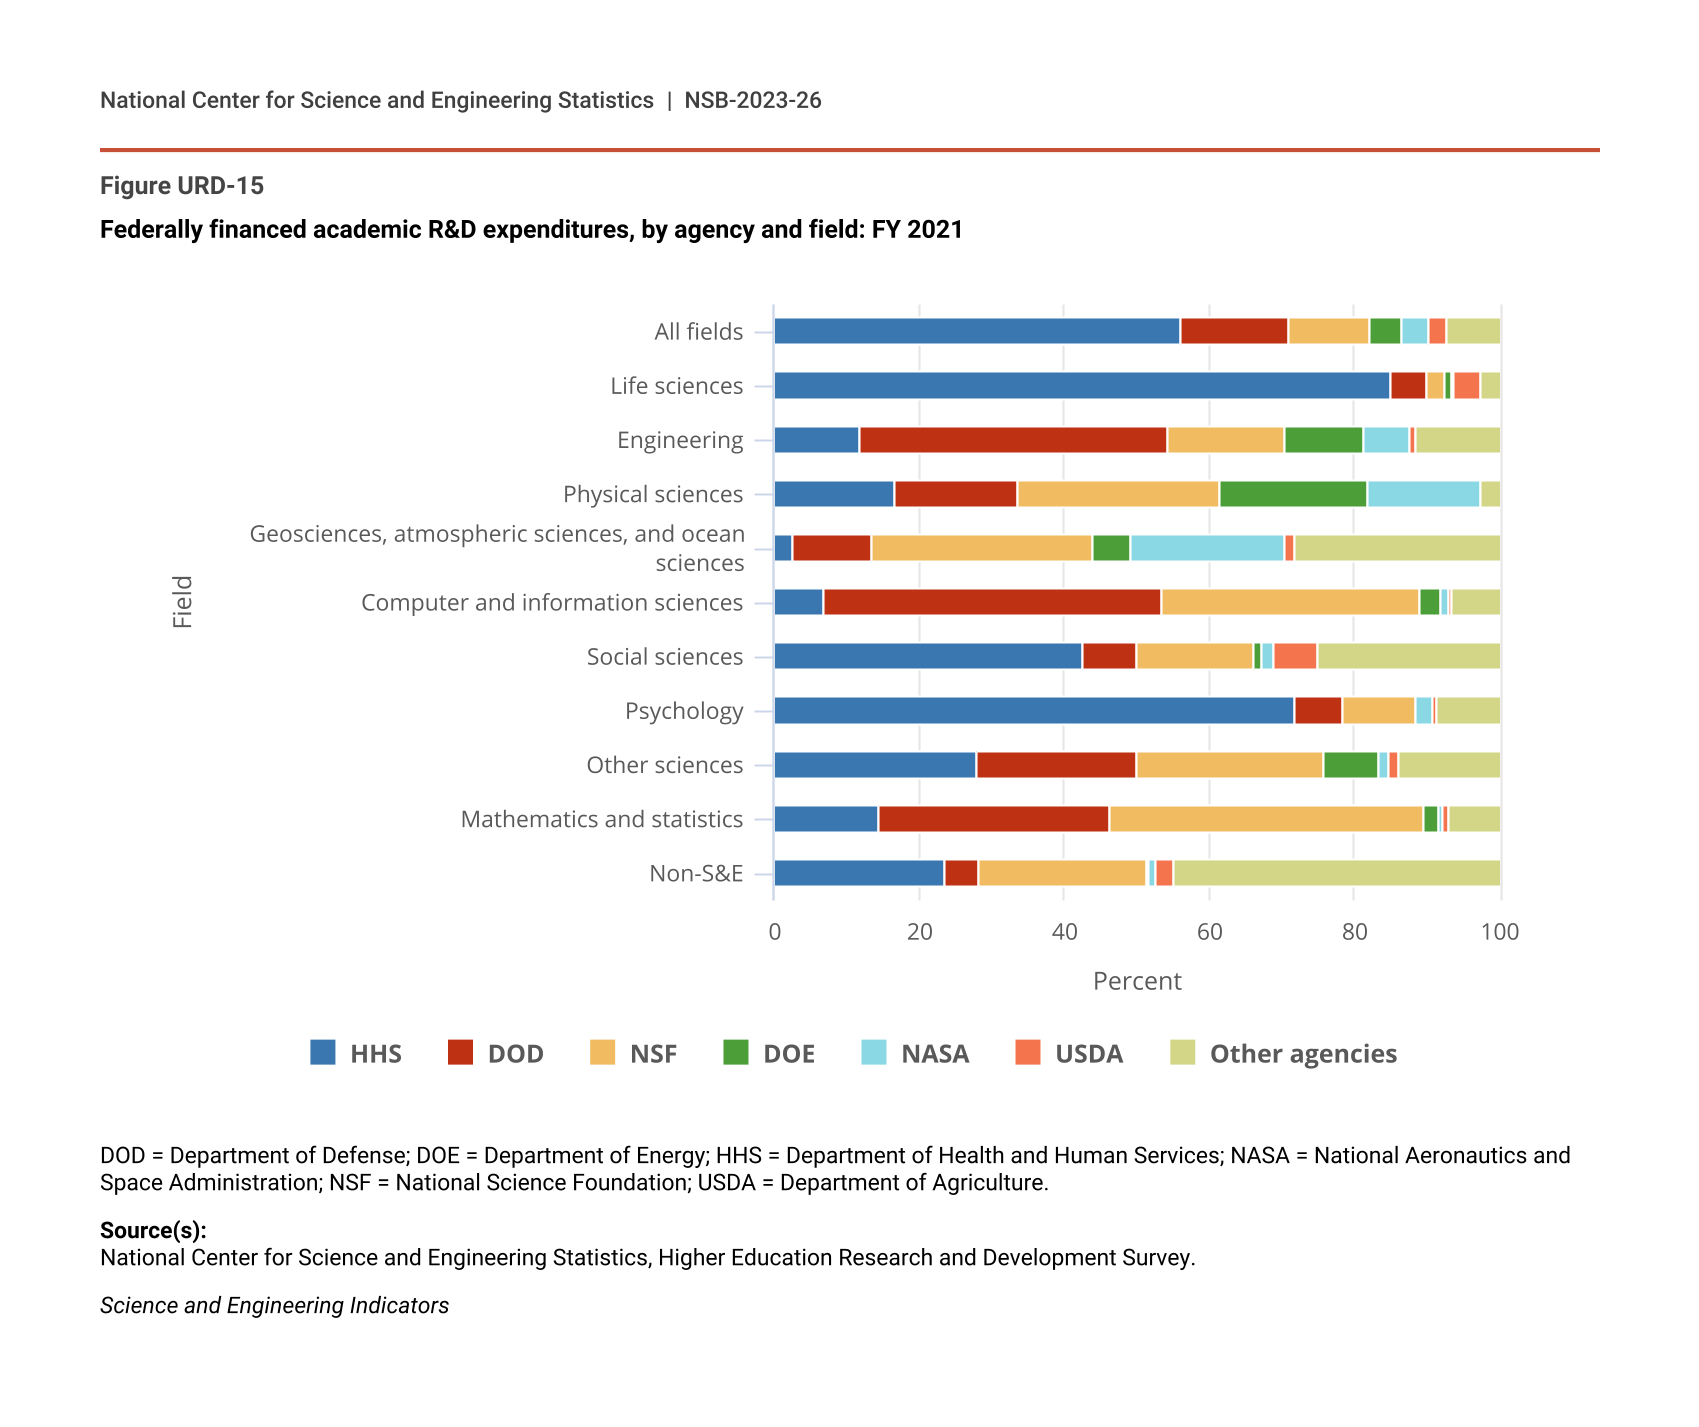
The distribution of academic R&D spending across research fields has changed little over the past decade (Figure URD-12). The life sciences have long accounted for the bulk of academic R&D spending, reaching 58% of the total in 2021. Research funded by federal and nonfederal sources showed similar distribution patterns across fields (Figure URD-13 and Figure URD-14). In contrast, the contributions of the various federal departments and agencies to academic research spending differed widely by S&E field (Figure URD-15). For example, HHS supported most academic R&D in life sciences, psychology, and social sciences, whereas the Department of Defense (DOD) was one of the top two agencies funding research in computer and information sciences, engineering, and mathematics and statistics. NSF was the leading funder among all federal agencies of academic R&D in mathematics and statistics; geosciences, atmospheric sciences, and ocean sciences; and physical sciences. NSF also provided a considerable share of funding for computing and information sciences research.
Academic R&D spending, by field: FYs 2003–21
| Fiscal year | Life sciences | Engineering | Physical sciences | Geosciences, atmospheric sciences, and ocean sciences | Computer and information sciences | Social sciences | Psychology | Other sciences | Mathematics and statistics | Non-S&E |
|---|---|---|---|---|---|---|---|---|---|---|
| 2003 | 28.8 | 7.3 | 4.0 | 2.7 | 1.6 | 2.0 | 0.9 | 0.8 | 0.5 | 1.7 |
| 2004 | 30.6 | 7.4 | 4.2 | 2.8 | 1.7 | 2.0 | 0.9 | 0.9 | 0.5 | 1.9 |
| 2005 | 31.5 | 7.7 | 4.2 | 2.9 | 1.6 | 1.9 | 0.9 | 0.9 | 0.6 | 2.0 |
| 2006 | 31.9 | 7.9 | 4.2 | 2.9 | 1.6 | 1.9 | 1.0 | 1.0 | 0.6 | 2.1 |
| 2007 | 32.2 | 8.1 | 4.2 | 2.9 | 1.5 | 1.9 | 0.9 | 1.0 | 0.6 | 2.3 |
| 2008 | 33.0 | 8.4 | 4.2 | 3.0 | 1.6 | 2.1 | 1.0 | 1.1 | 0.7 | 2.4 |
| 2009 | 34.5 | 9.1 | 4.5 | 3.1 | 1.7 | 2.2 | 1.0 | 1.1 | 0.6 | 2.6 |
| 2010 | 36.4 | 9.7 | 4.8 | 3.1 | 1.7 | 2.1 | 1.1 | 1.2 | 0.6 | 3.0 |
| 2011 | 38.0 | 10.2 | 4.9 | 3.2 | 1.8 | 2.1 | 1.2 | 1.1 | 0.7 | 3.3 |
| 2012 | 37.2 | 10.3 | 4.7 | 3.2 | 1.8 | 2.1 | 1.2 | 1.1 | 0.7 | 3.5 |
| 2013 | 36.9 | 10.5 | 4.6 | 3.1 | 2.0 | 2.1 | 1.1 | 1.2 | 0.7 | 3.6 |
| 2014 | 36.6 | 10.6 | 4.5 | 3.1 | 1.9 | 2.1 | 1.1 | 1.0 | 0.6 | 3.3 |
| 2015 | 37.0 | 10.6 | 4.5 | 3.1 | 1.9 | 2.2 | 1.1 | 1.0 | 0.6 | 3.5 |
| 2016 | 38.7 | 10.8 | 4.6 | 2.9 | 2.0 | 2.2 | 1.2 | 1.0 | 0.6 | 3.9 |
| 2017 | 40.0 | 11.1 | 4.7 | 2.9 | 2.0 | 2.4 | 1.2 | 0.9 | 0.6 | 4.0 |
| 2018 | 41.3 | 11.2 | 4.7 | 2.9 | 2.2 | 2.5 | 1.1 | 0.8 | 0.7 | 4.2 |
| 2019 | 43.0 | 11.8 | 4.9 | 2.8 | 2.4 | 2.5 | 1.2 | 0.8 | 0.7 | 4.3 |
| 2020 | 43.7 | 12.0 | 5.0 | 2.9 | 2.6 | 2.6 | 1.2 | 0.8 | 0.7 | 4.4 |
| 2021 | 44.2 | 12.1 | 4.8 | 2.8 | 2.5 | 2.4 | 1.1 | 0.9 | 0.7 | 4.3 |
Note(s):
Gross domestic product deflators come from the Bureau of Economic Analysis and are available at https://www.bea.gov/data/gdp/gross-domestic-product (accessed September 2022).
Source(s):
National Center for Science and Engineering Statistics, Higher Education Research and Development Survey.
Science and Engineering Indicators
Federally funded academic R&D spending, by field: FYs 2003–21
| Fiscal year | Life sciences | Engineering | Physical sciences | Geosciences, atmospheric sciences, and ocean sciences | Computer and information sciences | Social sciences | Psychology | Other sciences | Mathematics and statistics | Non-S&E |
|---|---|---|---|---|---|---|---|---|---|---|
| 2003 | 17.7 | 4.4 | 2.9 | 1.7 | 1.1 | 0.8 | 0.7 | 0.3 | 0.4 | 0.7 |
| 2004 | 19.6 | 4.6 | 3.0 | 1.9 | 1.2 | 0.8 | 0.7 | 0.3 | 0.4 | 0.8 |
| 2005 | 20.2 | 4.7 | 3.1 | 2.0 | 1.2 | 0.8 | 0.7 | 0.3 | 0.4 | 0.9 |
| 2006 | 20.3 | 4.8 | 3.0 | 2.0 | 1.1 | 0.8 | 0.7 | 0.4 | 0.4 | 0.9 |
| 2007 | 19.8 | 4.8 | 2.9 | 2.0 | 1.1 | 0.8 | 0.7 | 0.4 | 0.4 | 0.9 |
| 2008 | 19.8 | 5.0 | 2.9 | 1.9 | 1.1 | 0.9 | 0.7 | 0.4 | 0.5 | 0.9 |
| 2009 | 20.3 | 5.3 | 3.1 | 2.0 | 1.2 | 0.9 | 0.7 | 0.4 | 0.4 | 0.9 |
| 2010 | 22.6 | 5.9 | 3.5 | 2.1 | 1.2 | 0.9 | 0.8 | 0.5 | 0.4 | 1.0 |
| 2011 | 24.1 | 6.4 | 3.6 | 2.2 | 1.3 | 1.0 | 0.9 | 0.5 | 0.5 | 1.1 |
| 2012 | 22.8 | 6.4 | 3.5 | 2.2 | 1.4 | 0.9 | 0.9 | 0.4 | 0.5 | 1.2 |
| 2013 | 21.8 | 6.4 | 3.3 | 2.1 | 1.5 | 0.9 | 0.8 | 0.4 | 0.5 | 1.2 |
| 2014 | 20.5 | 6.2 | 3.0 | 2.0 | 1.3 | 0.9 | 0.7 | 0.4 | 0.4 | 1.1 |
| 2015 | 20.2 | 6.2 | 3.0 | 2.0 | 1.4 | 0.9 | 0.7 | 0.4 | 0.4 | 1.0 |
| 2016 | 20.6 | 6.2 | 3.1 | 1.9 | 1.4 | 0.9 | 0.7 | 0.4 | 0.4 | 1.1 |
| 2017 | 21.1 | 6.3 | 3.1 | 1.9 | 1.4 | 0.9 | 0.7 | 0.4 | 0.4 | 1.1 |
| 2018 | 21.6 | 6.4 | 3.1 | 1.9 | 1.5 | 0.9 | 0.7 | 0.3 | 0.4 | 1.1 |
| 2019 | 22.7 | 6.8 | 3.3 | 1.8 | 1.6 | 0.8 | 0.7 | 0.3 | 0.4 | 1.1 |
| 2020 | 23.1 | 7.1 | 3.3 | 1.9 | 1.8 | 0.9 | 0.7 | 0.3 | 0.4 | 1.1 |
| 2021 | 24.0 | 7.4 | 3.3 | 1.8 | 1.7 | 0.8 | 0.7 | 0.3 | 0.4 | 1.2 |
Note(s):
Gross domestic product deflators come from the Bureau of Economic Analysis and are available at https://www.bea.gov/data/gdp/gross-domestic-product (accessed September 2022).
Source(s):
National Center for Science and Engineering Statistics, Higher Education Research and Development Survey.
Science and Engineering Indicators
Nonfederally funded academic R&D spending, by field: FYs 2003–21
| Fiscal year | Life sciences | Engineering | Physical sciences | Geosciences, atmospheric sciences, and ocean sciences | Computer and information sciences | Social sciences | Psychology | Other sciences | Mathematics and statistics | Non-S&E |
|---|---|---|---|---|---|---|---|---|---|---|
| 2003 | 11.0 | 2.9 | 1.1 | 0.9 | 0.4 | 1.2 | 0.3 | 0.5 | 0.2 | 1.0 |
| 2004 | 10.9 | 2.8 | 1.2 | 0.9 | 0.4 | 1.2 | 0.2 | 0.6 | 0.2 | 1.1 |
| 2005 | 11.3 | 3.0 | 1.2 | 0.9 | 0.4 | 1.1 | 0.2 | 0.5 | 0.2 | 1.1 |
| 2006 | 11.7 | 3.1 | 1.2 | 0.9 | 0.5 | 1.1 | 0.3 | 0.6 | 0.2 | 1.2 |
| 2007 | 12.4 | 3.3 | 1.3 | 0.9 | 0.4 | 1.1 | 0.3 | 0.6 | 0.2 | 1.4 |
| 2008 | 13.3 | 3.4 | 1.3 | 1.0 | 0.5 | 1.2 | 0.3 | 0.7 | 0.2 | 1.5 |
| 2009 | 14.2 | 3.8 | 1.4 | 1.1 | 0.5 | 1.3 | 0.3 | 0.7 | 0.2 | 1.6 |
| 2010 | 13.8 | 3.8 | 1.3 | 1.0 | 0.5 | 1.1 | 0.3 | 0.7 | 0.2 | 2.0 |
| 2011 | 13.9 | 3.8 | 1.3 | 1.0 | 0.5 | 1.1 | 0.3 | 0.6 | 0.2 | 2.2 |
| 2012 | 14.4 | 3.8 | 1.2 | 1.0 | 0.5 | 1.1 | 0.3 | 0.7 | 0.2 | 2.3 |
| 2013 | 15.1 | 4.2 | 1.3 | 1.1 | 0.5 | 1.3 | 0.3 | 0.7 | 0.2 | 2.4 |
| 2014 | 16.1 | 4.4 | 1.4 | 1.1 | 0.5 | 1.2 | 0.4 | 0.6 | 0.2 | 2.2 |
| 2015 | 16.8 | 4.4 | 1.5 | 1.1 | 0.5 | 1.3 | 0.4 | 0.6 | 0.2 | 2.4 |
| 2016 | 18.0 | 4.5 | 1.5 | 1.0 | 0.6 | 1.4 | 0.4 | 0.6 | 0.2 | 2.9 |
| 2017 | 18.9 | 4.7 | 1.5 | 1.0 | 0.6 | 1.5 | 0.4 | 0.5 | 0.2 | 2.9 |
| 2018 | 19.7 | 4.8 | 1.6 | 1.0 | 0.7 | 1.6 | 0.5 | 0.5 | 0.3 | 3.1 |
| 2019 | 20.3 | 4.9 | 1.7 | 1.0 | 0.8 | 1.7 | 0.5 | 0.5 | 0.3 | 3.2 |
| 2020 | 20.6 | 4.9 | 1.7 | 1.0 | 0.8 | 1.7 | 0.5 | 0.5 | 0.3 | 3.3 |
| 2021 | 20.2 | 4.7 | 1.6 | 1.0 | 0.8 | 1.6 | 0.4 | 0.5 | 0.3 | 3.2 |
Note(s):
Gross domestic product deflators come from the Bureau of Economic Analysis and are available at https://www.bea.gov/data/gdp/gross-domestic-product (accessed September 2022).
Source(s):
National Center for Science and Engineering Statistics, Higher Education Research and Development Survey.
Science and Engineering Indicators
Federally financed academic R&D expenditures, by agency and field: FY 2021
| Field | HHS | DOD | NSF | DOE | NASA | USDA | Other agencies |
|---|---|---|---|---|---|---|---|
| All fields | 56.0 | 15.0 | 11.0 | 4.5 | 3.6 | 2.6 | 7.2 |
| Life sciences | 85.0 | 5.0 | 2.6 | 0.8 | 0.3 | 3.8 | 2.5 |
| Engineering | 11.8 | 42.5 | 16.0 | 11.0 | 6.4 | 0.9 | 11.4 |
| Physical sciences | 16.7 | 16.9 | 27.8 | 20.6 | 15.3 | 0.2 | 2.5 |
| Geosciences, atmospheric sciences, and ocean sciences | 2.5 | 11.0 | 30.5 | 5.2 | 21.1 | 1.5 | 28.1 |
| Computer and information sciences | 7.0 | 46.5 | 35.5 | 2.9 | 1.2 | 0.4 | 6.5 |
| Social sciences | 42.6 | 7.3 | 16.1 | 1.1 | 1.8 | 6.1 | 25.0 |
| Psychology | 71.9 | 6.5 | 9.9 | 0.1 | 2.3 | 0.6 | 8.6 |
| Other sciences | 27.9 | 22.2 | 25.9 | 7.3 | 1.6 | 1.4 | 13.7 |
| Mathematics and statistics | 14.3 | 32.1 | 43.2 | 2.0 | 0.6 | 1.0 | 6.8 |
| Non-S&E | 23.6 | 4.6 | 23.1 | 0.5 | 0.7 | 2.7 | 44.8 |
DOD = Department of Defense; DOE = Department of Energy; HHS = Department of Health and Human Services; NASA = National Aeronautics and Space Administration; NSF = National Science Foundation; USDA = Department of Agriculture.
Source(s):
National Center for Science and Engineering Statistics, Higher Education Research and Development Survey.
Science and Engineering Indicators