 An official website of the United States government
 Innovation
Innovation is the translation of knowledge arising from R&D activities into new or improved products, processes, or services with real-world applications. Innovation is measured through its incidence (survey measurement), activities (science, technology, engineering, and mathematics education and workforce), outputs (products and processes), outcomes (economic growth and societal benefits), and the creation of intangible capital (Aizcorbe, Moylan, and Robbins 2009). Like physical capital, the use of intangible capital provides future value; however, intangible capital has no separate physical existence, making it less costly to share. Computer software and R&D activities are two types of intangible capital included in measures of gross domestic product (GDP). Spending on software and R&D provides indicators of business investment in innovation activities (Corrado, Hulten, and Sichel 2009). R&D activity is described in depth in the Indicators 2026 report “Discovery: R&D Activity and Research Publications” (NSB 2025). This section provides data on business registration of trademarks as well as business survey data on the introduction of new products and processes.
Other types of innovative activity are less well measured and, analogous to the unseen “dark matter” in the universe, have been referred to as “dark innovation” (Martin 2016). This unmeasured innovation can take place as products are used and freely shared, such as OSS. Data on open-source contributors and repositories show the growth and global reach of this software development activity.
Trademarks
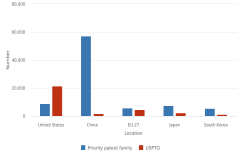
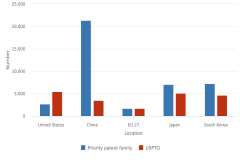
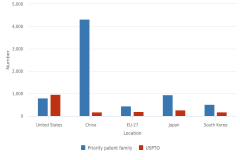
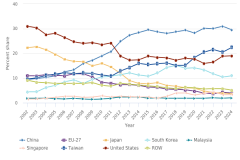
Trademark data complement patent data as indicators of innovation activity. Trademark registrations from USPTO “capture the moment at which products or services are introduced into the market, turning inventions into innovations” (von Graevenitz, Graham, and Myers 2022:227–28). Academic studies in the last two decades have consistently found trademark activity to be correlated with innovation activity (Flikkema, Castaldi, and de Man 2025; Millot 2009). In 2024, USPTO registered about 378,000 trademarks to owners across the world, including about 212,000 registered to U.S. owners (Table STRN-30).
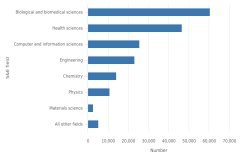
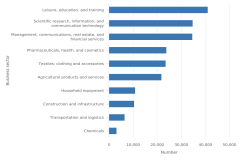
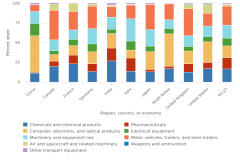
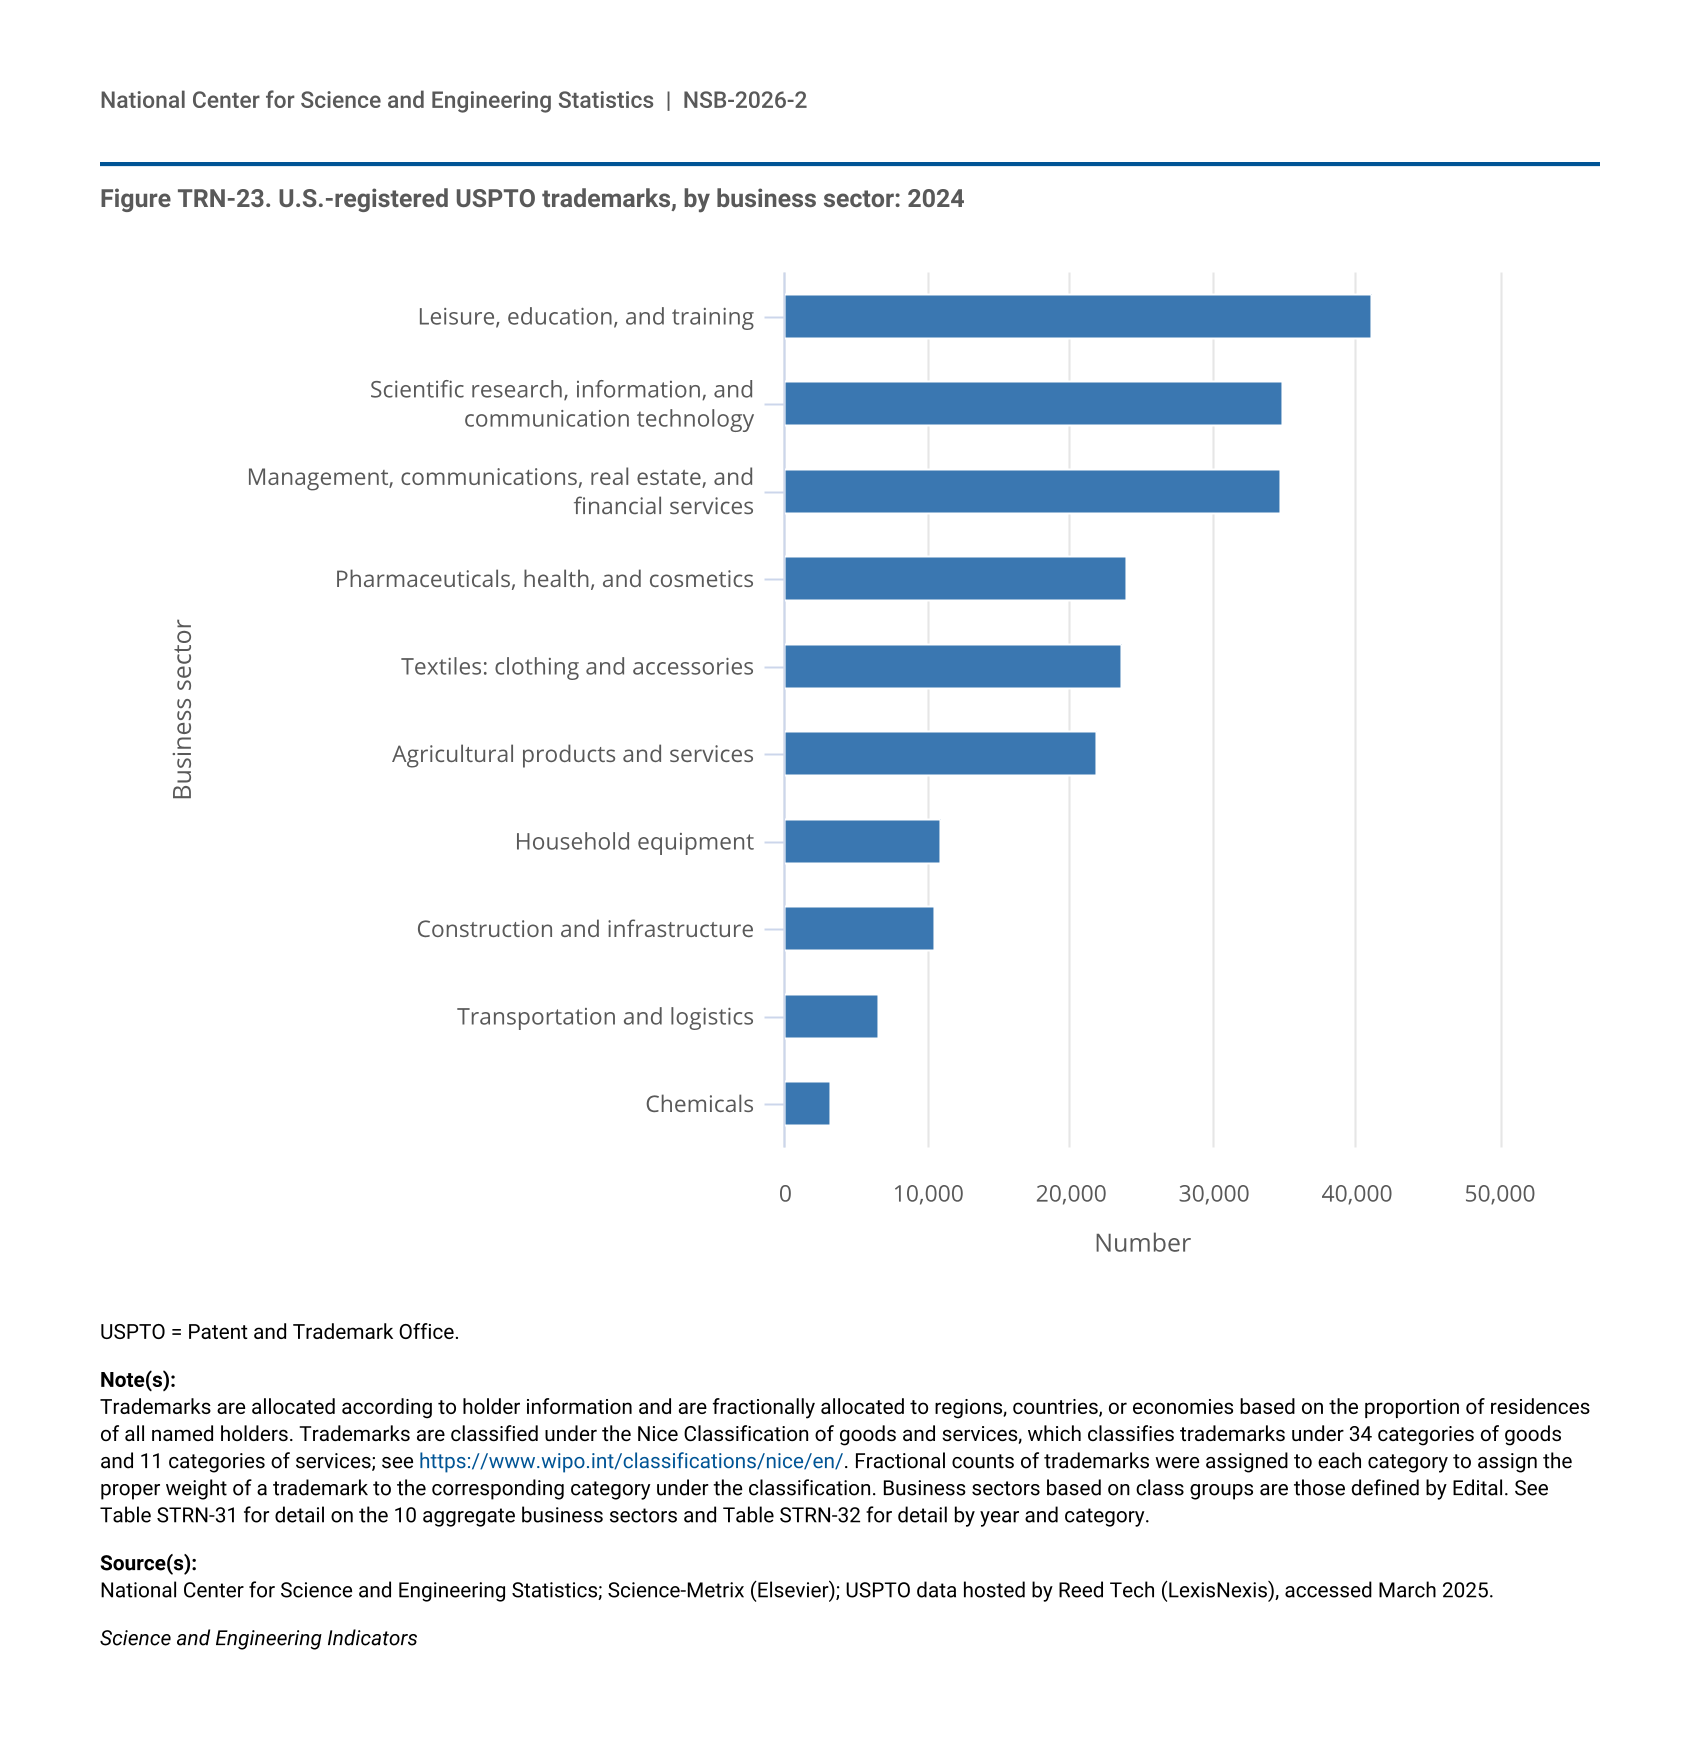
Trademarks are particularly valuable as innovation indicators for firms that produce services and firms that are knowledge or innovation intensive (Gotsch and Hipp 2014; Mendonça, Santos Pereira, and Godinho 2004). Trademark data can be analyzed by product type, based on 45 distinct classes that correspond to business sectors (Table STRN-31, Table STRN-32). For U.S.-registered trademarks in 2024, three service-industry categories had the highest numbers registered: the category that includes leisure, education, and training (41,000); the category that includes scientific research, information, and communication technology (35,000); and the category that includes management, communications, real estate, and financial services (35,000) (Figure TRN-23).
| Business sector | Number |
|---|---|
| Leisure, education, and training | 41,161 |
| Scientific research, information, and communication technology | 34,845 |
| Management, communications, real estate, and financial services | 34,676 |
| Pharmaceuticals, health, and cosmetics | 23,842 |
| Textiles: clothing and accessories | 23,544 |
| Agricultural products and services | 21,900 |
| Household equipment | 10,943 |
| Construction and infrastructure | 10,521 |
| Transportation and logistics | 6,599 |
| Chemicals | 3,223 |
USPTO = Patent and Trademark Office.
Trademarks are allocated according to holder information and are fractionally allocated to regions, countries, or economies based on the proportion of residences of all named holders. Trademarks are classified under the Nice Classification of goods and services, which classifies trademarks under 34 categories of goods and 11 categories of services; see https://www.wipo.int/classifications/nice/en/. Fractional counts of trademarks were assigned to each category to assign the proper weight of a trademark to the corresponding category under the classification. Business sectors based on class groups are those defined by Edital. See Table STRN-31 for detail on the 10 aggregate business sectors and Table STRN-32 for detail by year and category.
National Center for Science and Engineering Statistics; Science-Metrix (Elsevier); USPTO data hosted by Reed Tech (LexisNexis), accessed March 2025.
Science and Engineering Indicators
Open-Source Software
As described in the sidebar Intellectual Property Measures in Context, some inventions and knowledge products are created with the intention of being widely shared. Broadly defined, OSS is any software that is accessed, modified, and distributed freely. In this report, it refers to software with an Open Source Initiative–approved license. Linux, Apache, Python, and Kubernetes are examples. Economists have estimated a value of $8.8 trillion for the OSS used by businesses for 2020 (Hoffman, Nagle, and Zhou 2024).
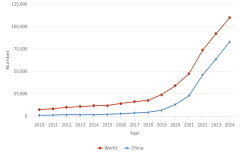
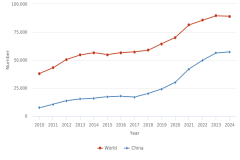
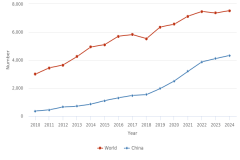
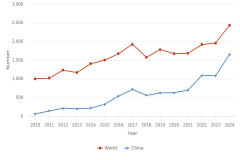
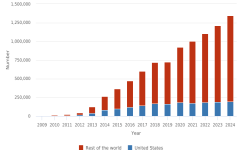
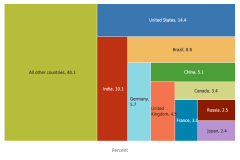
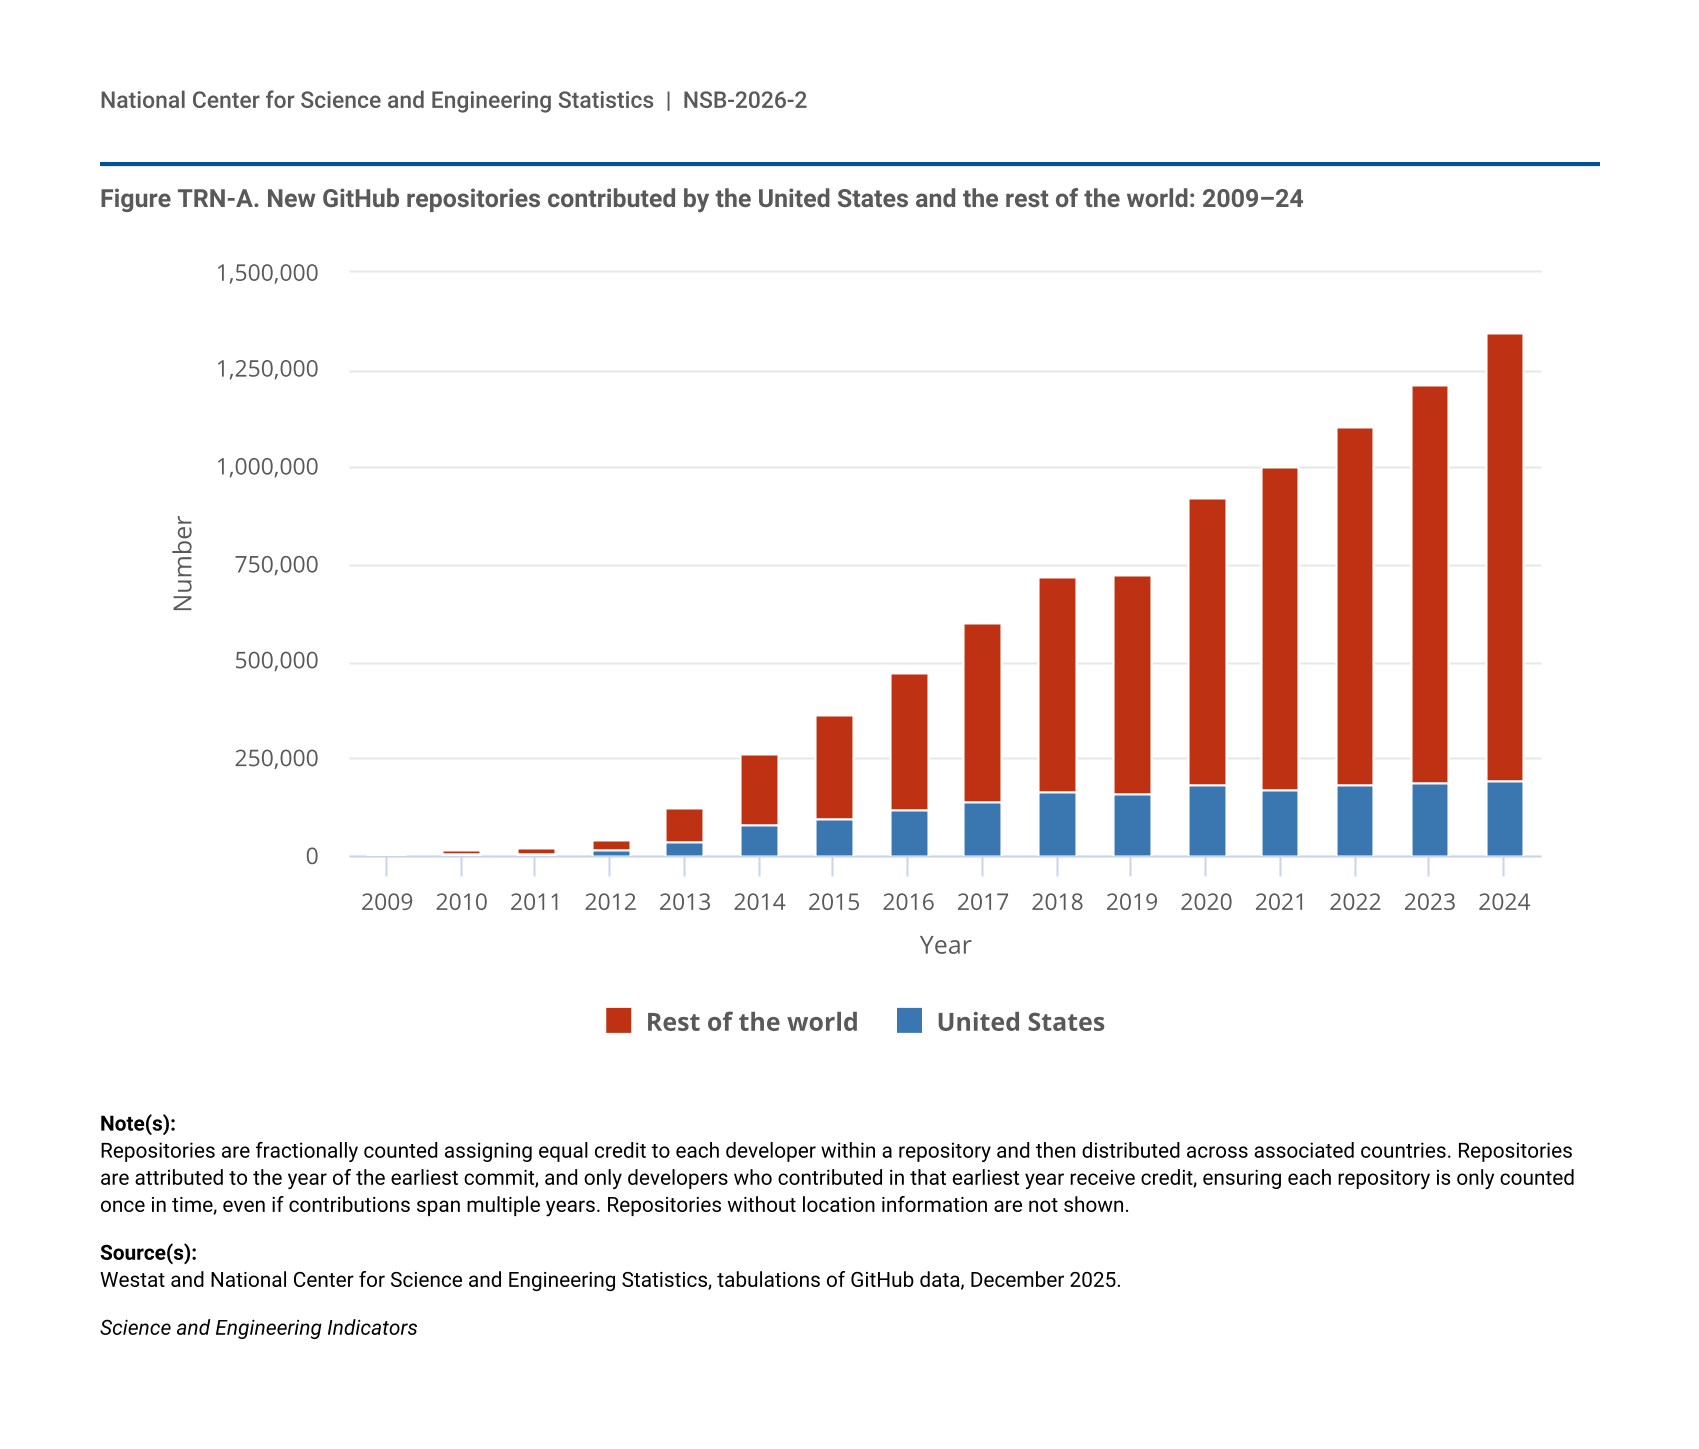
At the end of 2024, GitHub reported having almost 140 million developers contributing to open-source code in that year, increasing from 45.5 million developers at the beginning of 2020 (GitHub 2025). Although GitHub is the world’s largest remote source code–hosting platform, it is not the only one. GitCode is an open-source hosting platform developed by the Chinese Software Developer Network and the company Huawei, reporting over 50 million users (GitCode 2025).
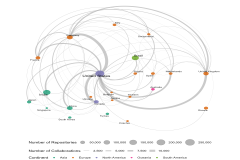
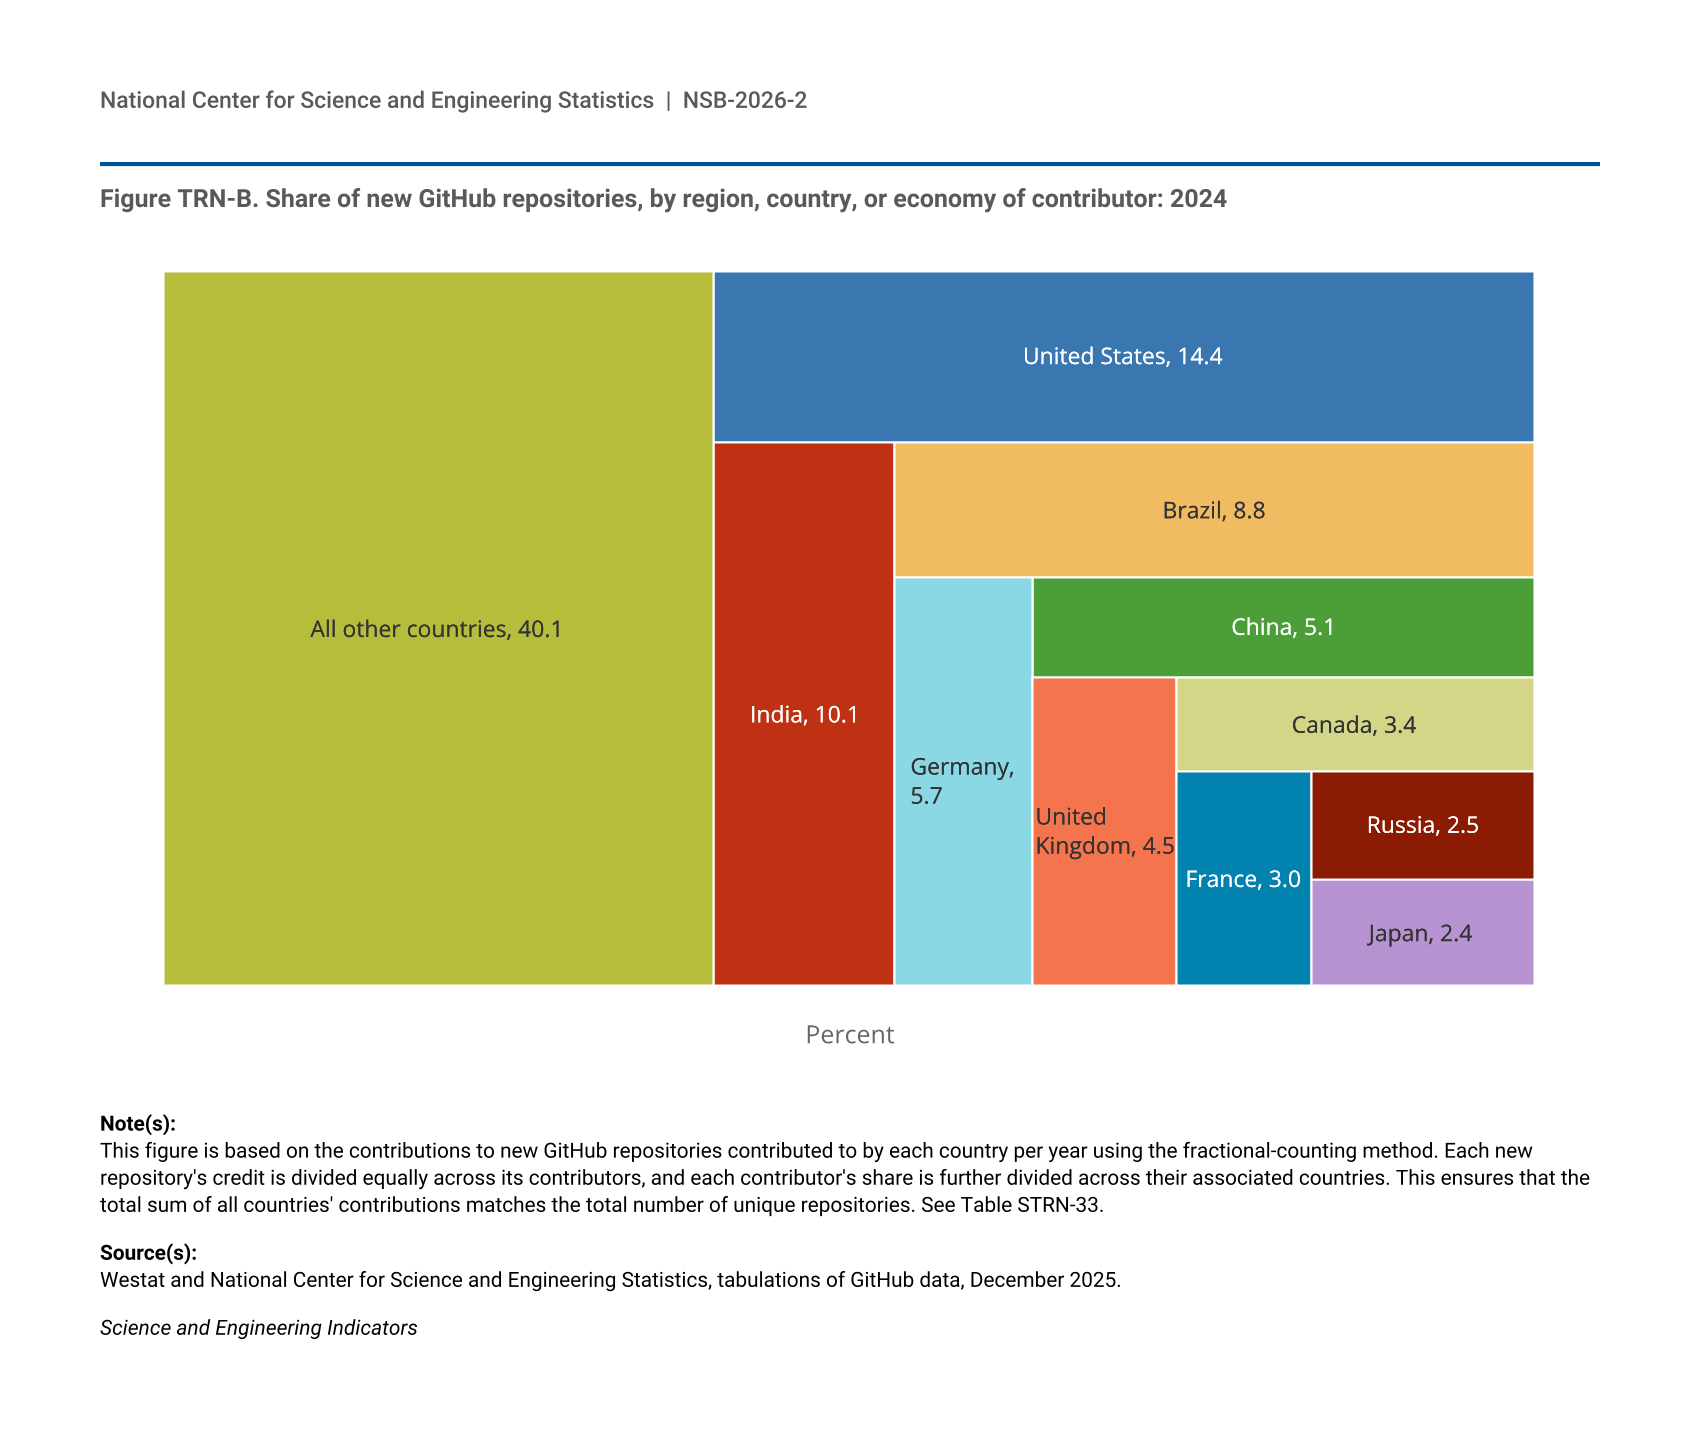
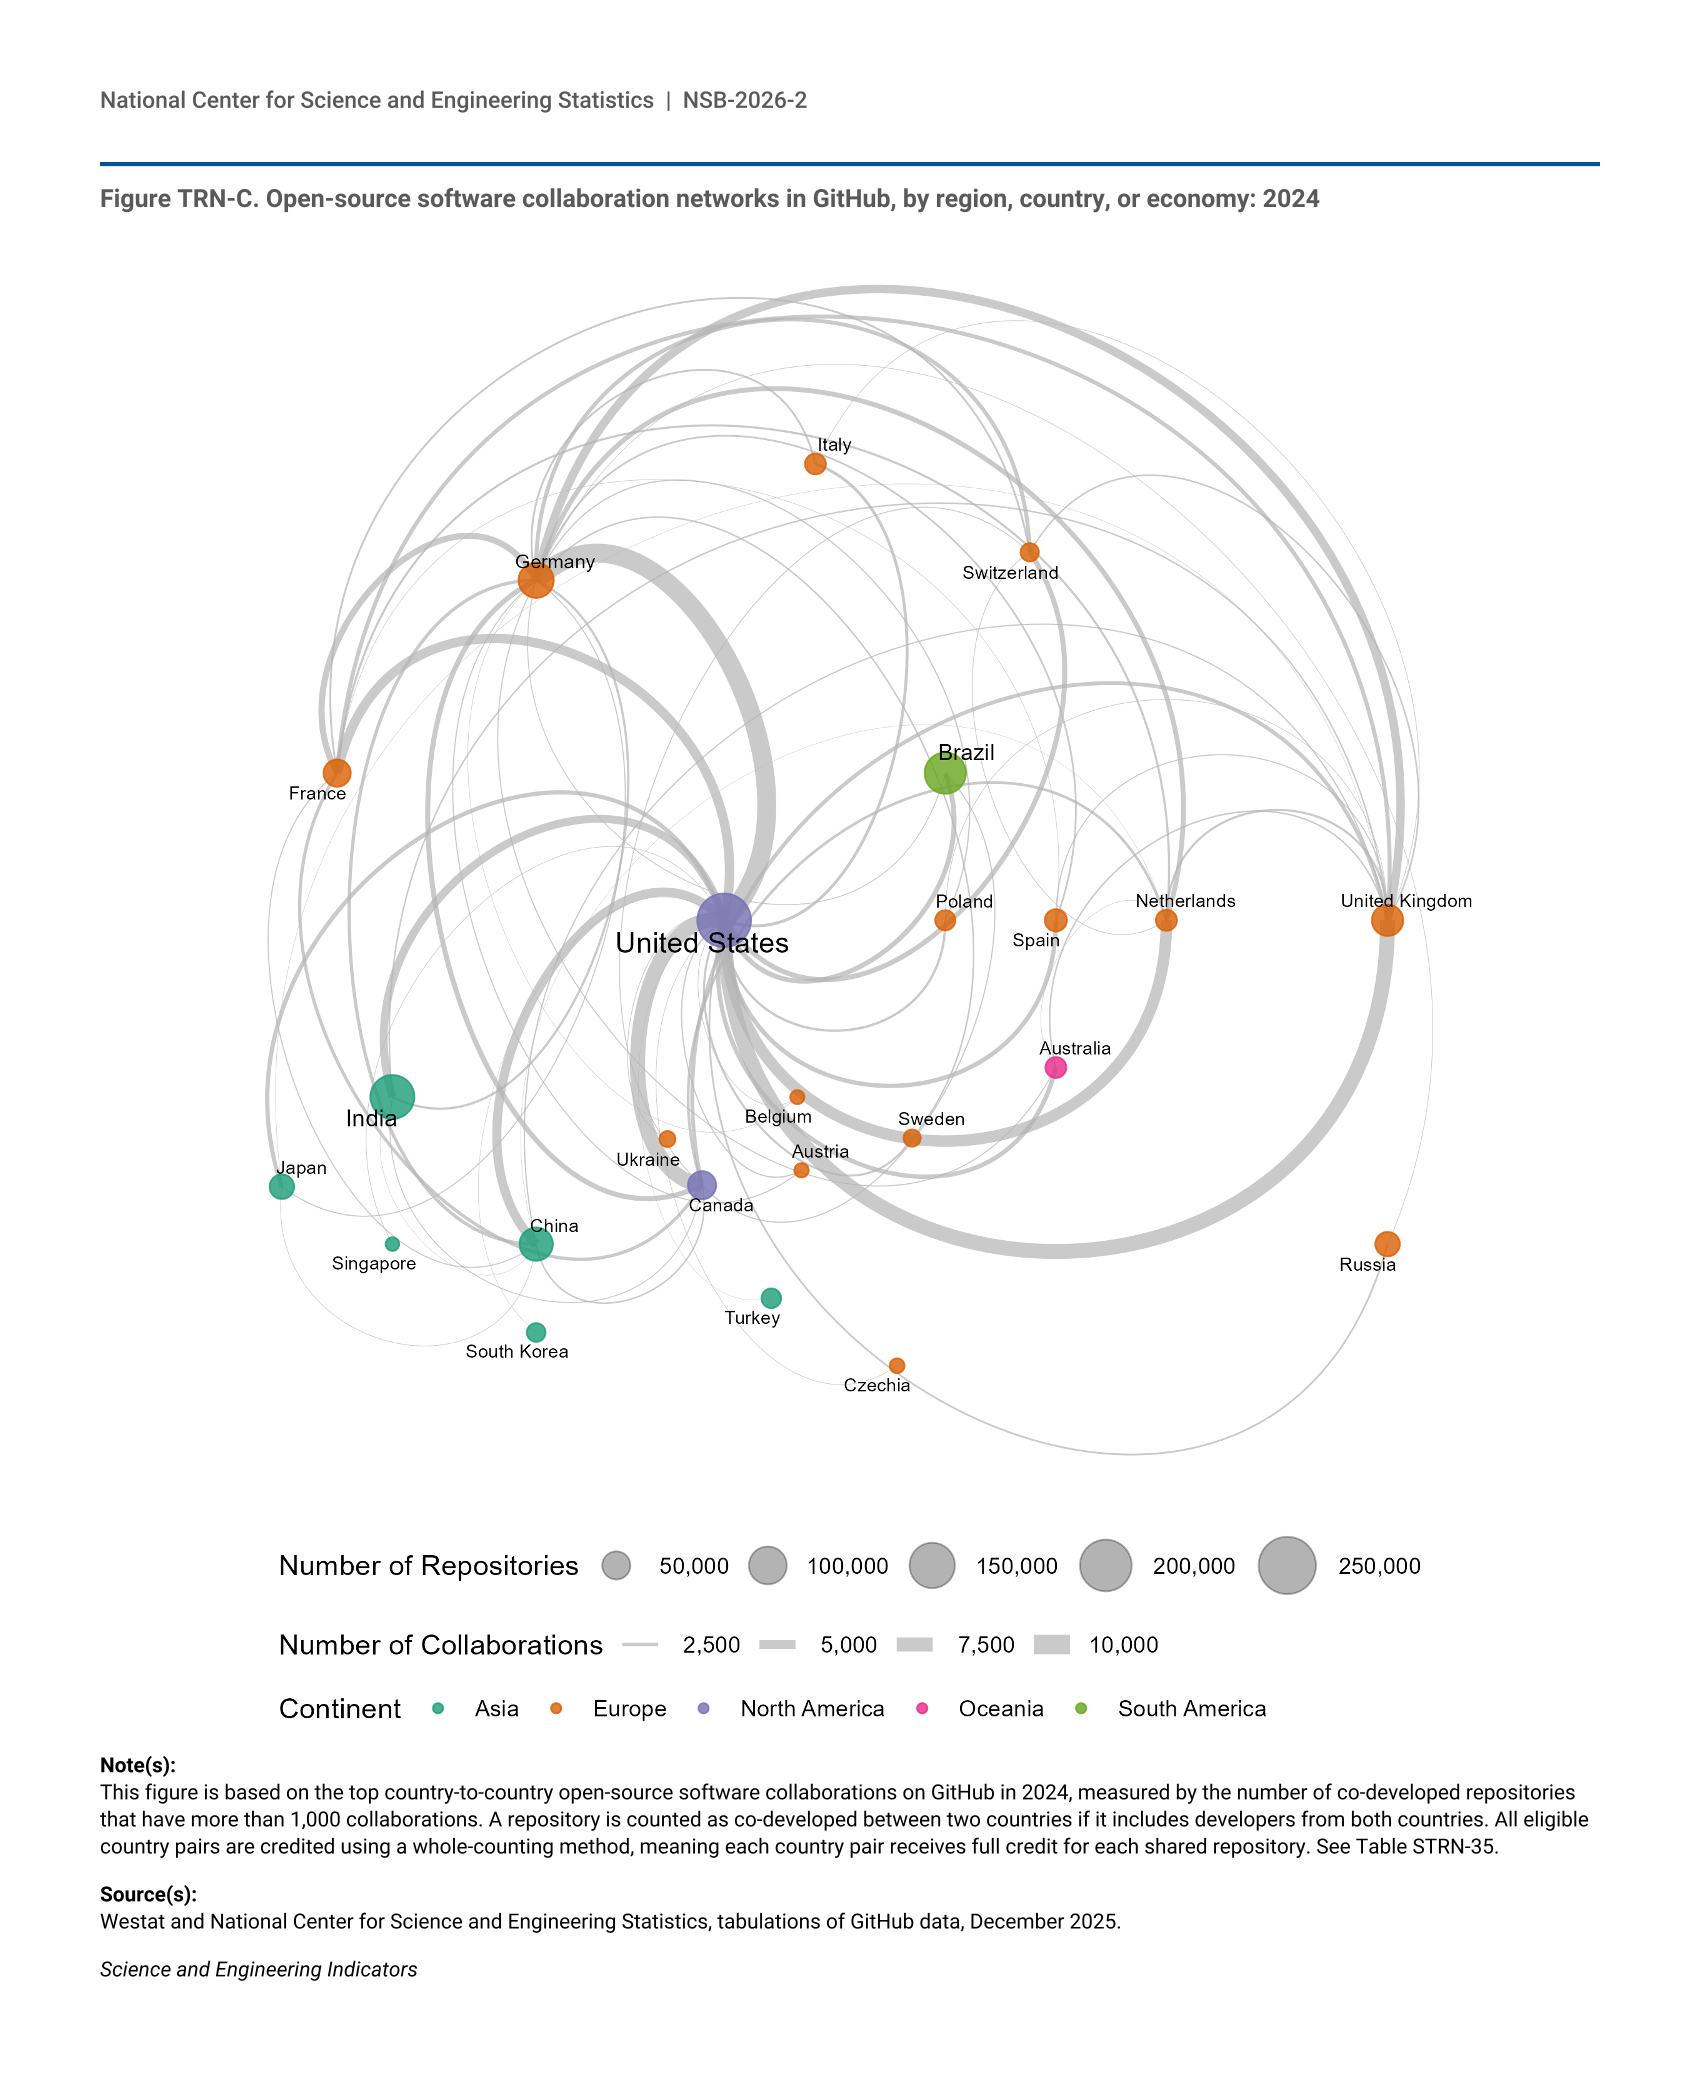
For the following analysis, data were collected for each GitHub repository with an open-source license. When available, information on the location and affiliation of each repository’s developers was also collected. The location and employment affiliation are voluntarily supplied by GitHub users in their profiles; as a result, the location and sector are not complete for a notable share of developers (see the Technical Appendix). Furthermore, because only repositories with contributor location information are used in the analysis, location information was available for between 32% and 52% of the repositories in each year, with location information available for 36% of repositories in 2024 (Table STRN-33). This incomplete coverage may affect the reliability of location and sector analyses, which should be regarded as experimental at this time. The sidebar Global Contributions and Collaborations in Open-Source Software discusses the contributions of developers with known locations and the network formed by international collaborations.
Business-Reported Innovation
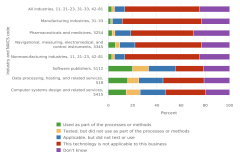
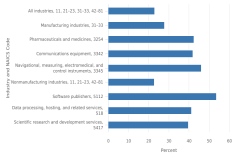
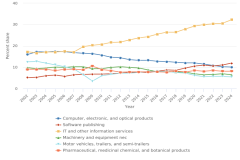
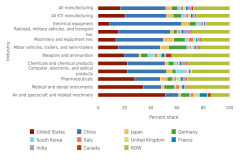
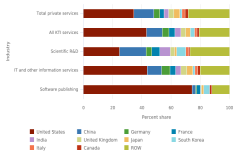
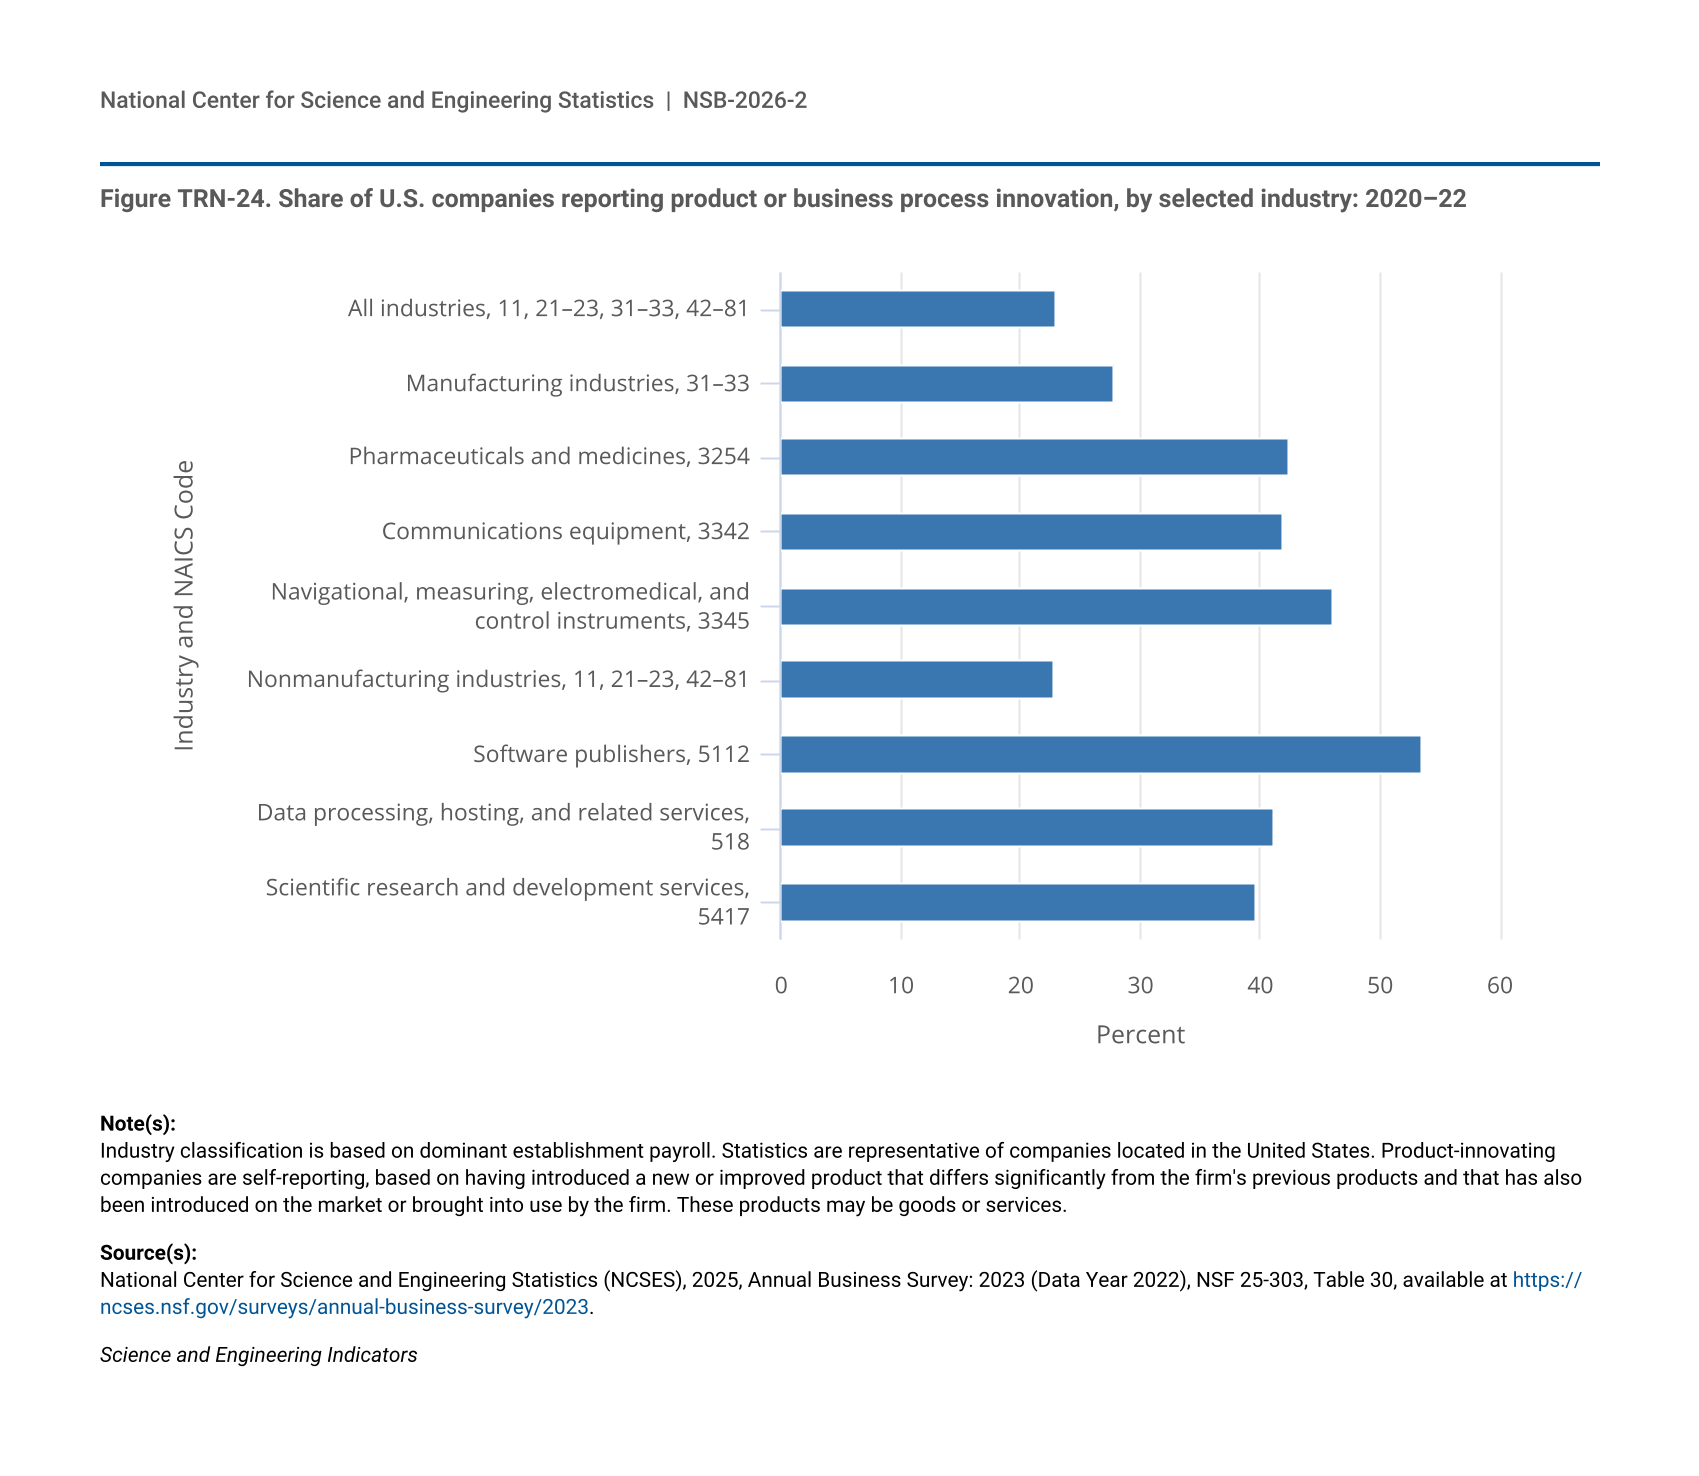
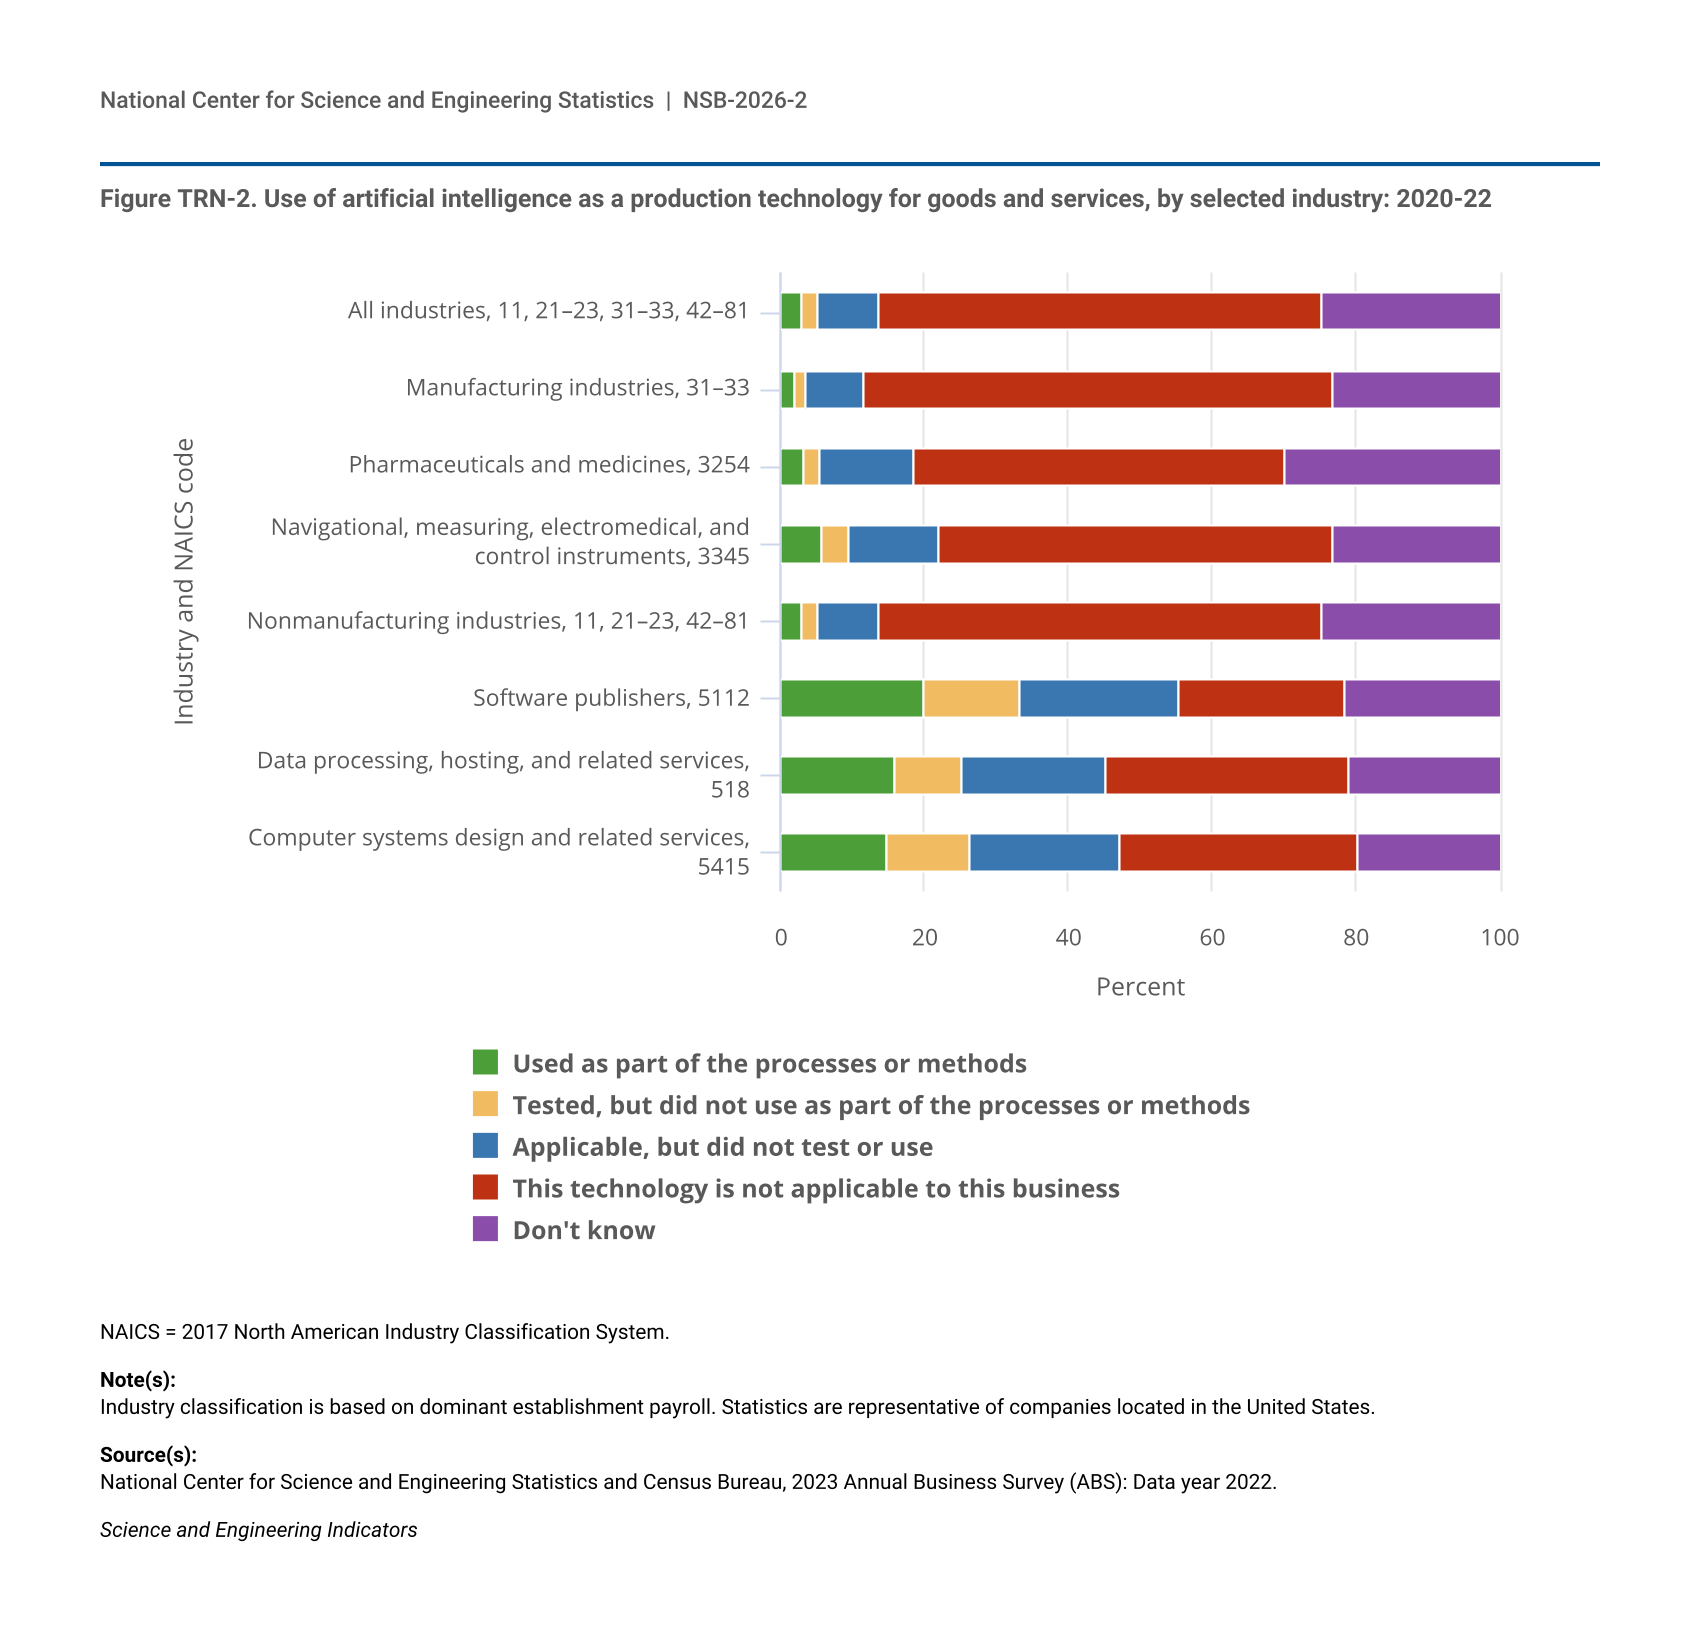
High rates of business-sector innovation are indicators of dynamic economic activity, whether at the local, regional, or national level (Hall and Jaffe 2018). A key indicator of business-sector innovation is the proportion of companies within an industry that introduce new or significantly improved products and processes. Business innovation activity, as an indicator provided in this report, is the proportion of companies within an industry in a given year that report introducing new or significantly improved products or processes within a 3-year period. In 2022, about 23% of U.S. companies reported introducing a product or process innovation in the 3-year period between 2020 and 2022. U.S. companies in the software publishing industry had the highest rates of reported innovation during this period; in 2022, 54% of companies reported introducing a product innovation (NCSES 2025a: Table 30). In the pharmaceutical and medicines industry, 42% of U.S. companies reported a product or process innovation over the same period (Figure TRN-24).
| Industry and NAICS Code | Percent |
|---|---|
| All industries, 11, 21–23, 31–33, 42–81 | 22.9 |
| Manufacturing industries, 31–33 | 27.8 |
| Pharmaceuticals and medicines, 3254 | 42.4 |
| Communications equipment, 3342 | 41.9 |
| Navigational, measuring, electromedical, and control instruments, 3345 | 46.1 |
| Nonmanufacturing industries, 11, 21–23, 42–81 | 22.7 |
| Software publishers, 5112 | 53.6 |
| Data processing, hosting, and related services, 518 | 41.2 |
| Scientific research and development services, 5417 | 39.6 |
Industry classification is based on dominant establishment payroll. Statistics are representative of companies located in the United States. Product-innovating companies are self-reporting, based on having introduced a new or improved product that differs significantly from the firm's previous products and that has also been introduced on the market or brought into use by the firm. These products may be goods or services.
National Center for Science and Engineering Statistics (NCSES), 2025, Annual Business Survey: 2023 (Data Year 2022), NSF 25-303, Table 30, available at https://ncses.nsf.gov/surveys/annual-business-survey/2023.
Science and Engineering Indicators
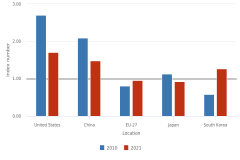
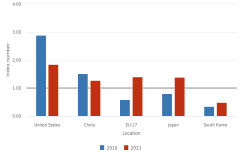
These innovation rates are reported based on business survey data of U.S. firms, allowing for robust comparisons across industries. Although innovation rates and activities can also be compared across countries, they are affected by the limitations of cross-country comparisons. The sidebar Comparing Innovation across Countries describes efforts to make valid cross-country comparisons.