 An official website of the United States government
 Technical Appendix
AUTM University Technology Transfer Data and Methodology
The Bayh-Dole Act of 1980 (Patent and Trademark Act Amendments of 1980, P.L. 96–517) is the foundation of the U.S. technology transfer system. It is a federal law that allows universities, nonprofit research institutions, and small businesses to retain ownership of inventions developed through federally funded research. Academic institutions often view technology transfer as part of their economic or social “third mission,” alongside research and teaching (Compagnucci and Spigarelli 2020; Leydesdorf 2010). Revenue generated through copyrights, trademarks, and technology licensing provides a financial incentive for universities, although most universities do not fully recapture the cost of operating a technology transfer office. Those university patents that do result in technology licenses to companies shed light on the commercialization pathways that university innovations take for broader applications.
University technology transfer offices (TTOs) provide a variety of support to faculty, researchers, and students that ranges from education about what constitutes intellectual property and when to file an invention disclosure to the filing of patents, contract negotiations, and assistance during the formation of a start-up company. AUTM is a membership-based organization for these technology transfer professionals with approximately 3,000 members (AUTM 2025). Each year, AUTM surveys member institutions to collect data on research expenditures, invention disclosures, patent applications, patents awarded, licenses and options executed by established firms and startups, licensing income, university startups created, number of TTO staff, and other related metrics. The survey data are available to AUTM members and subscribers through their Statistics Access for Technology Transfer (STATT) Database.
Indicators reports have reported AUTM survey data for several cycles to capture representative data on academic technology transfer. The primary federal survey for academic research and development (R&D) expenditures, the Higher Education Research and Development (HERD) Survey (https://www.nsf.gov/statistics/srvyherd/), does not include questions related to technology transfer. Patent and Trademark Office (USPTO) data capture patenting activities at the time of filing and of granting of a patent. AUTM provides insights into earlier stages of technology commercialization, such as invention disclosures, as well as later stages, such as the licensing and optioning of technologies and the creation of startups.
Data
AUTM is a large professional organization of technology transfer professionals in the United States and worldwide, with over 3,000 members from over 800 research institutions (AUTM 2025). AUTM’s annual member survey compiles technology transfer indicators that are not otherwise available from member institutions into a centralized source. AUTM is a unique source of information about post-patenting applications of university technology because the TTOs play a critical role in facilitating technology transfer activities at their institutions.
AUTM reports a response rate of 60.4% in 2024, with 204 responses out of 338 invited member institutions invited to participate in their 2024 survey (Table SATRN-1). Both the number of respondents and the invited institutions have increased a little from 2016 to 2024. However, the response rate has slightly decreased over that time. Data are subject to revision; data from more than 2 years prior are not updated and are considered part of the historical record (AUTM 2024).
NA = not available.
HERD = Higher Education Research and Development Survey.
Some AUTM survey responses were confidential. While the AUTM data include these confidential responses, the institutions that responded confidentially are not included in analyses of coverage. The number of institution responses were reported by AUTM in their technical documentation for their yearly reports from 2016 through 2024. Named universities included only universities that were designated "University" in AUTM and that were hand-validated and corrected.
AUTM, AUTM Licensing Survey (various years), accessed January 2026.
Science and Engineering Indicators
Institutions reporting to AUTM as university systems (or as other entities encompassing multiple university campuses) were matched to each corresponding institution in HERD, if available (Table SATRN-2). For example, the State University of New York university system reports as a single institution in AUTM but consists of 64 colleges and universities, 28 of which report to HERD. As a result, AUTM underreports the count of HERD universities because it does not break out all systems. See the count of “named institutions in AUTM” in Table SATRN-1 compared to the count of “HERD institutions matched in AUTM” in Table SATRN-2. By disaggregating university systems into their constituent colleges and universities, this approach accounts for shifts in reporting structure across years.
HERD = Higher Education Research and Development Survey.
Note that some institutions in AUTM responded confidentially, so a small number of AUTM respondents are not represented here and might have HERD matches. Institutions in AUTM that are specified as university systems were matched to all branch campuses in HERD; however, universities with multiple campuses that were not specified as university systems in AUTM were matched only to the flagship campus in HERD. For this reason, the Only university responses to AUTM (not including confidential responses) column takes responses from the HERD institutions count column and breaks out any university systems into the institutions in that system that respond to the HERD Survey.
AUTM, AUTM Licensing Survey (various years), accessed January 2026.
Science and Engineering Indicators
Institutions reporting to AUTM’s survey comprise between a quarter and a third of the institutions that report to HERD (Table SATRN-2). The slightly lower response rates to the AUTM survey in 2021 and 2024 may contribute to the lower coverage of HERD institutions in those same years. However, across all years, several factors explain the match rate remaining at or under 30%. College and universities that report to HERD span emerging research institutions, with from $150,000 to $100 million of total research expenditures, to much larger R1 and R2 research universities, with from $100 million to over $1 billion of total research expenditures. The majority of institutions that report to HERD is below the threshold of R&D activity that merits the institutional investment in TTOs or the employment of technology transfer professionals. Furthermore, membership in AUTM or reporting to the annual AUTM survey is not mandatory, and not all university TTOs report to AUTM surveys each year. In addition, a small number of institutions submitted their surveys to AUTM confidentially, and their names were not available for matching between HERD and AUTM.
Limitations
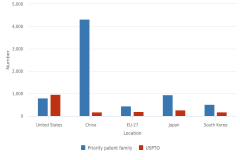
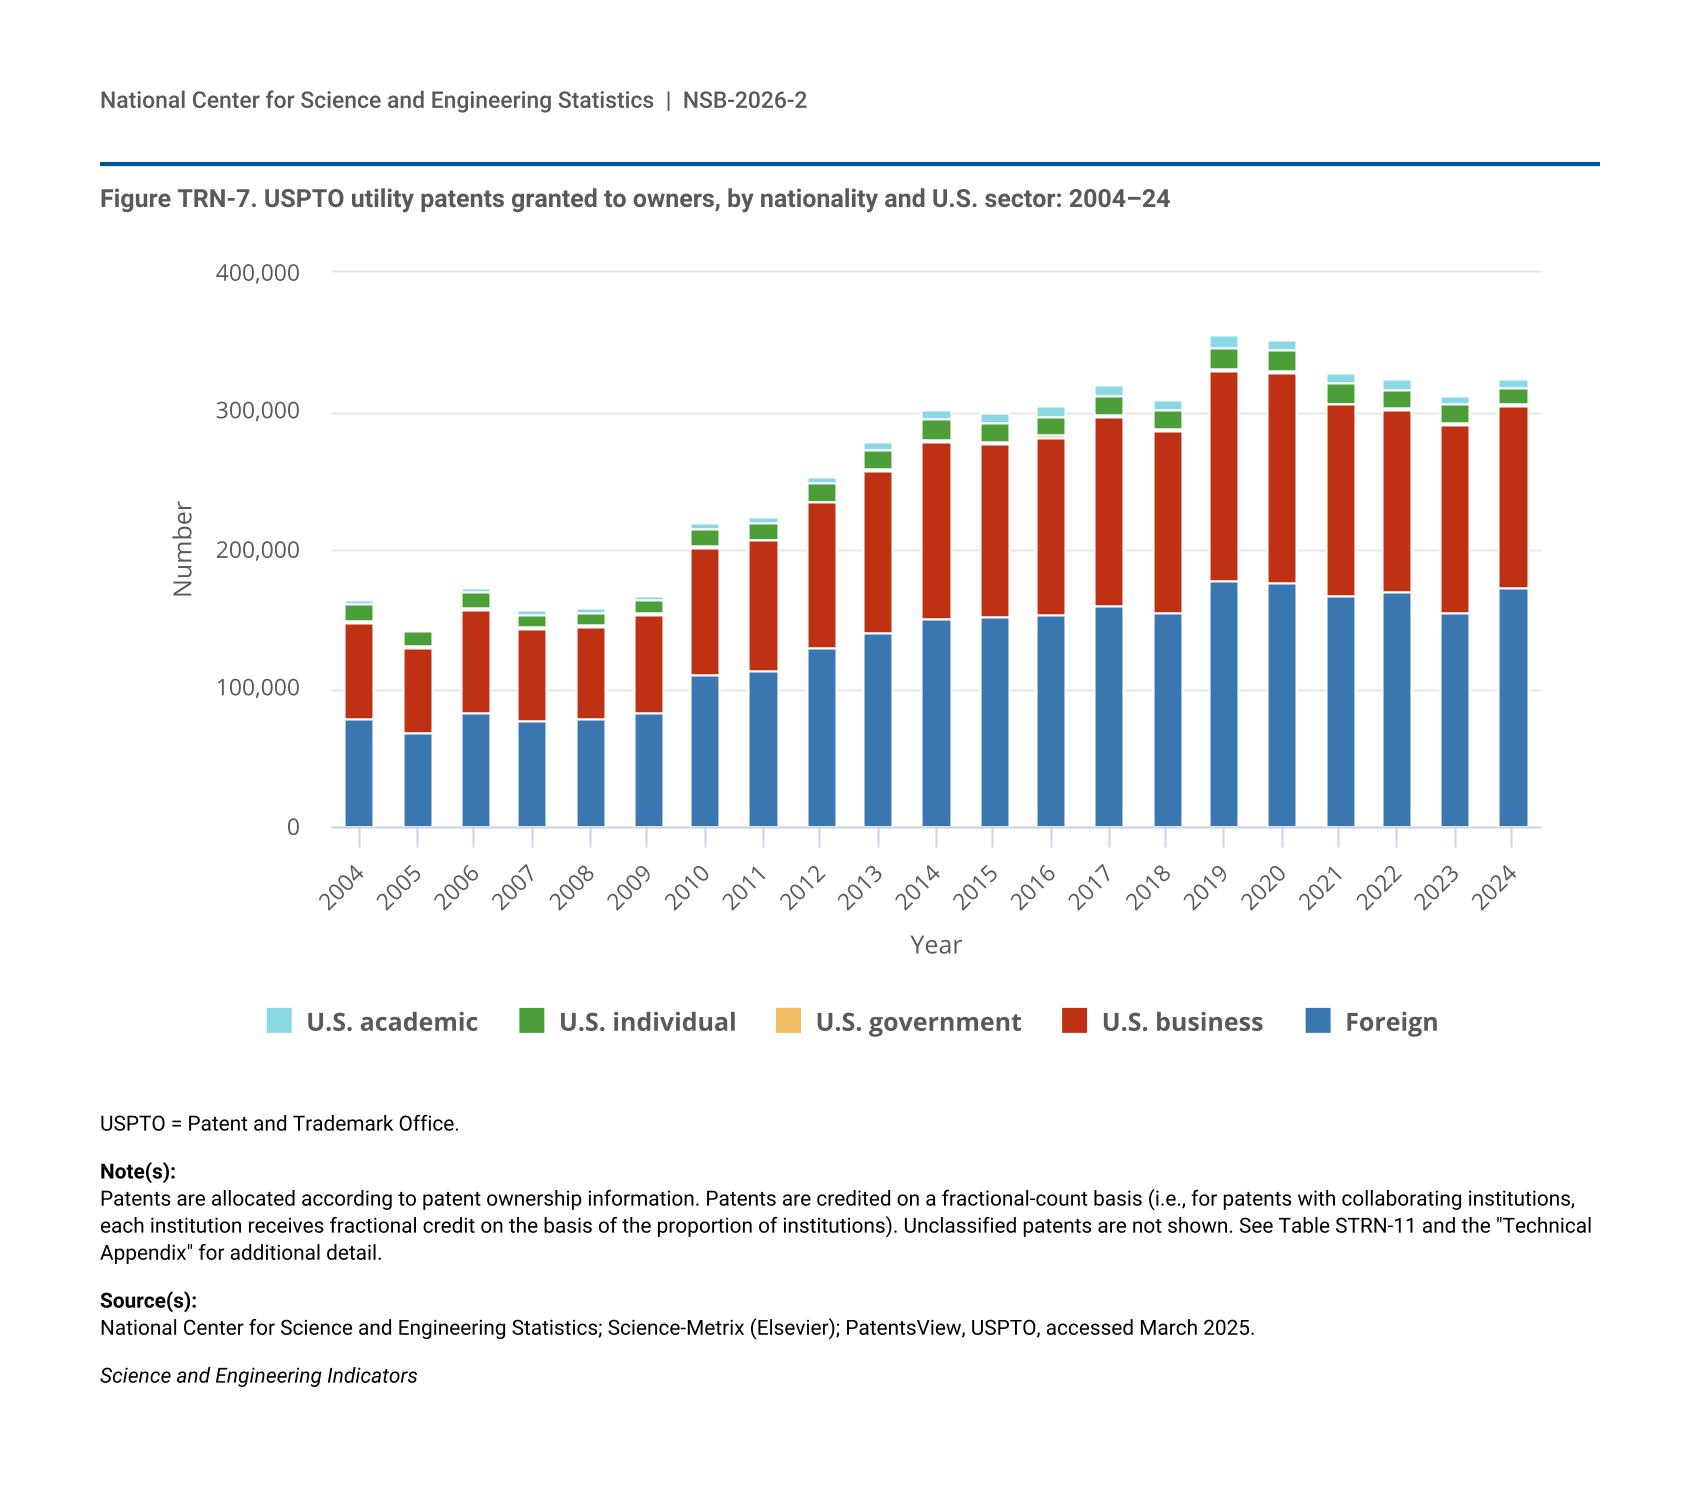
As a measure of all academic technology transfer, the AUTM data appear to undercount at least some aspects of technology transfer activity. The AUTM survey reports patents granted based on university technology, reporting 6,074 patents issued in 2023 and 6,437 in 2024. Based on the analysis of USPTO utility patents described in the Science and Engineering Indicators 2026 report "Translation to Impact: U.S. and Global Science, Technology, and Innovation Output," the count of academic patents was 6,612 in 2023 and 6,761 in 2024 (Figure TRN-7). The undercounting of patents issued to universities in AUTM data has been improved with successive data updates to AUTM’s STATT database since the prior Science and Engineering Indicators 2024 report "Invention, Knowledge Transfer and Innovation" (NSB 2024, Technical Appendix).
In addition, some technology transfer activities may not be captured by the university TTO. Technology transfer may also be defined more broadly as “academic engagement” or “informal technology transfer” encompassing consulting, collaborative research, or other forms of exchange with the private sector that would not be captured by measures counting formal licensing (Perkmann et al. 2013).
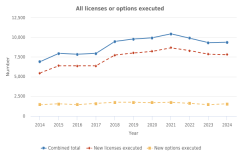
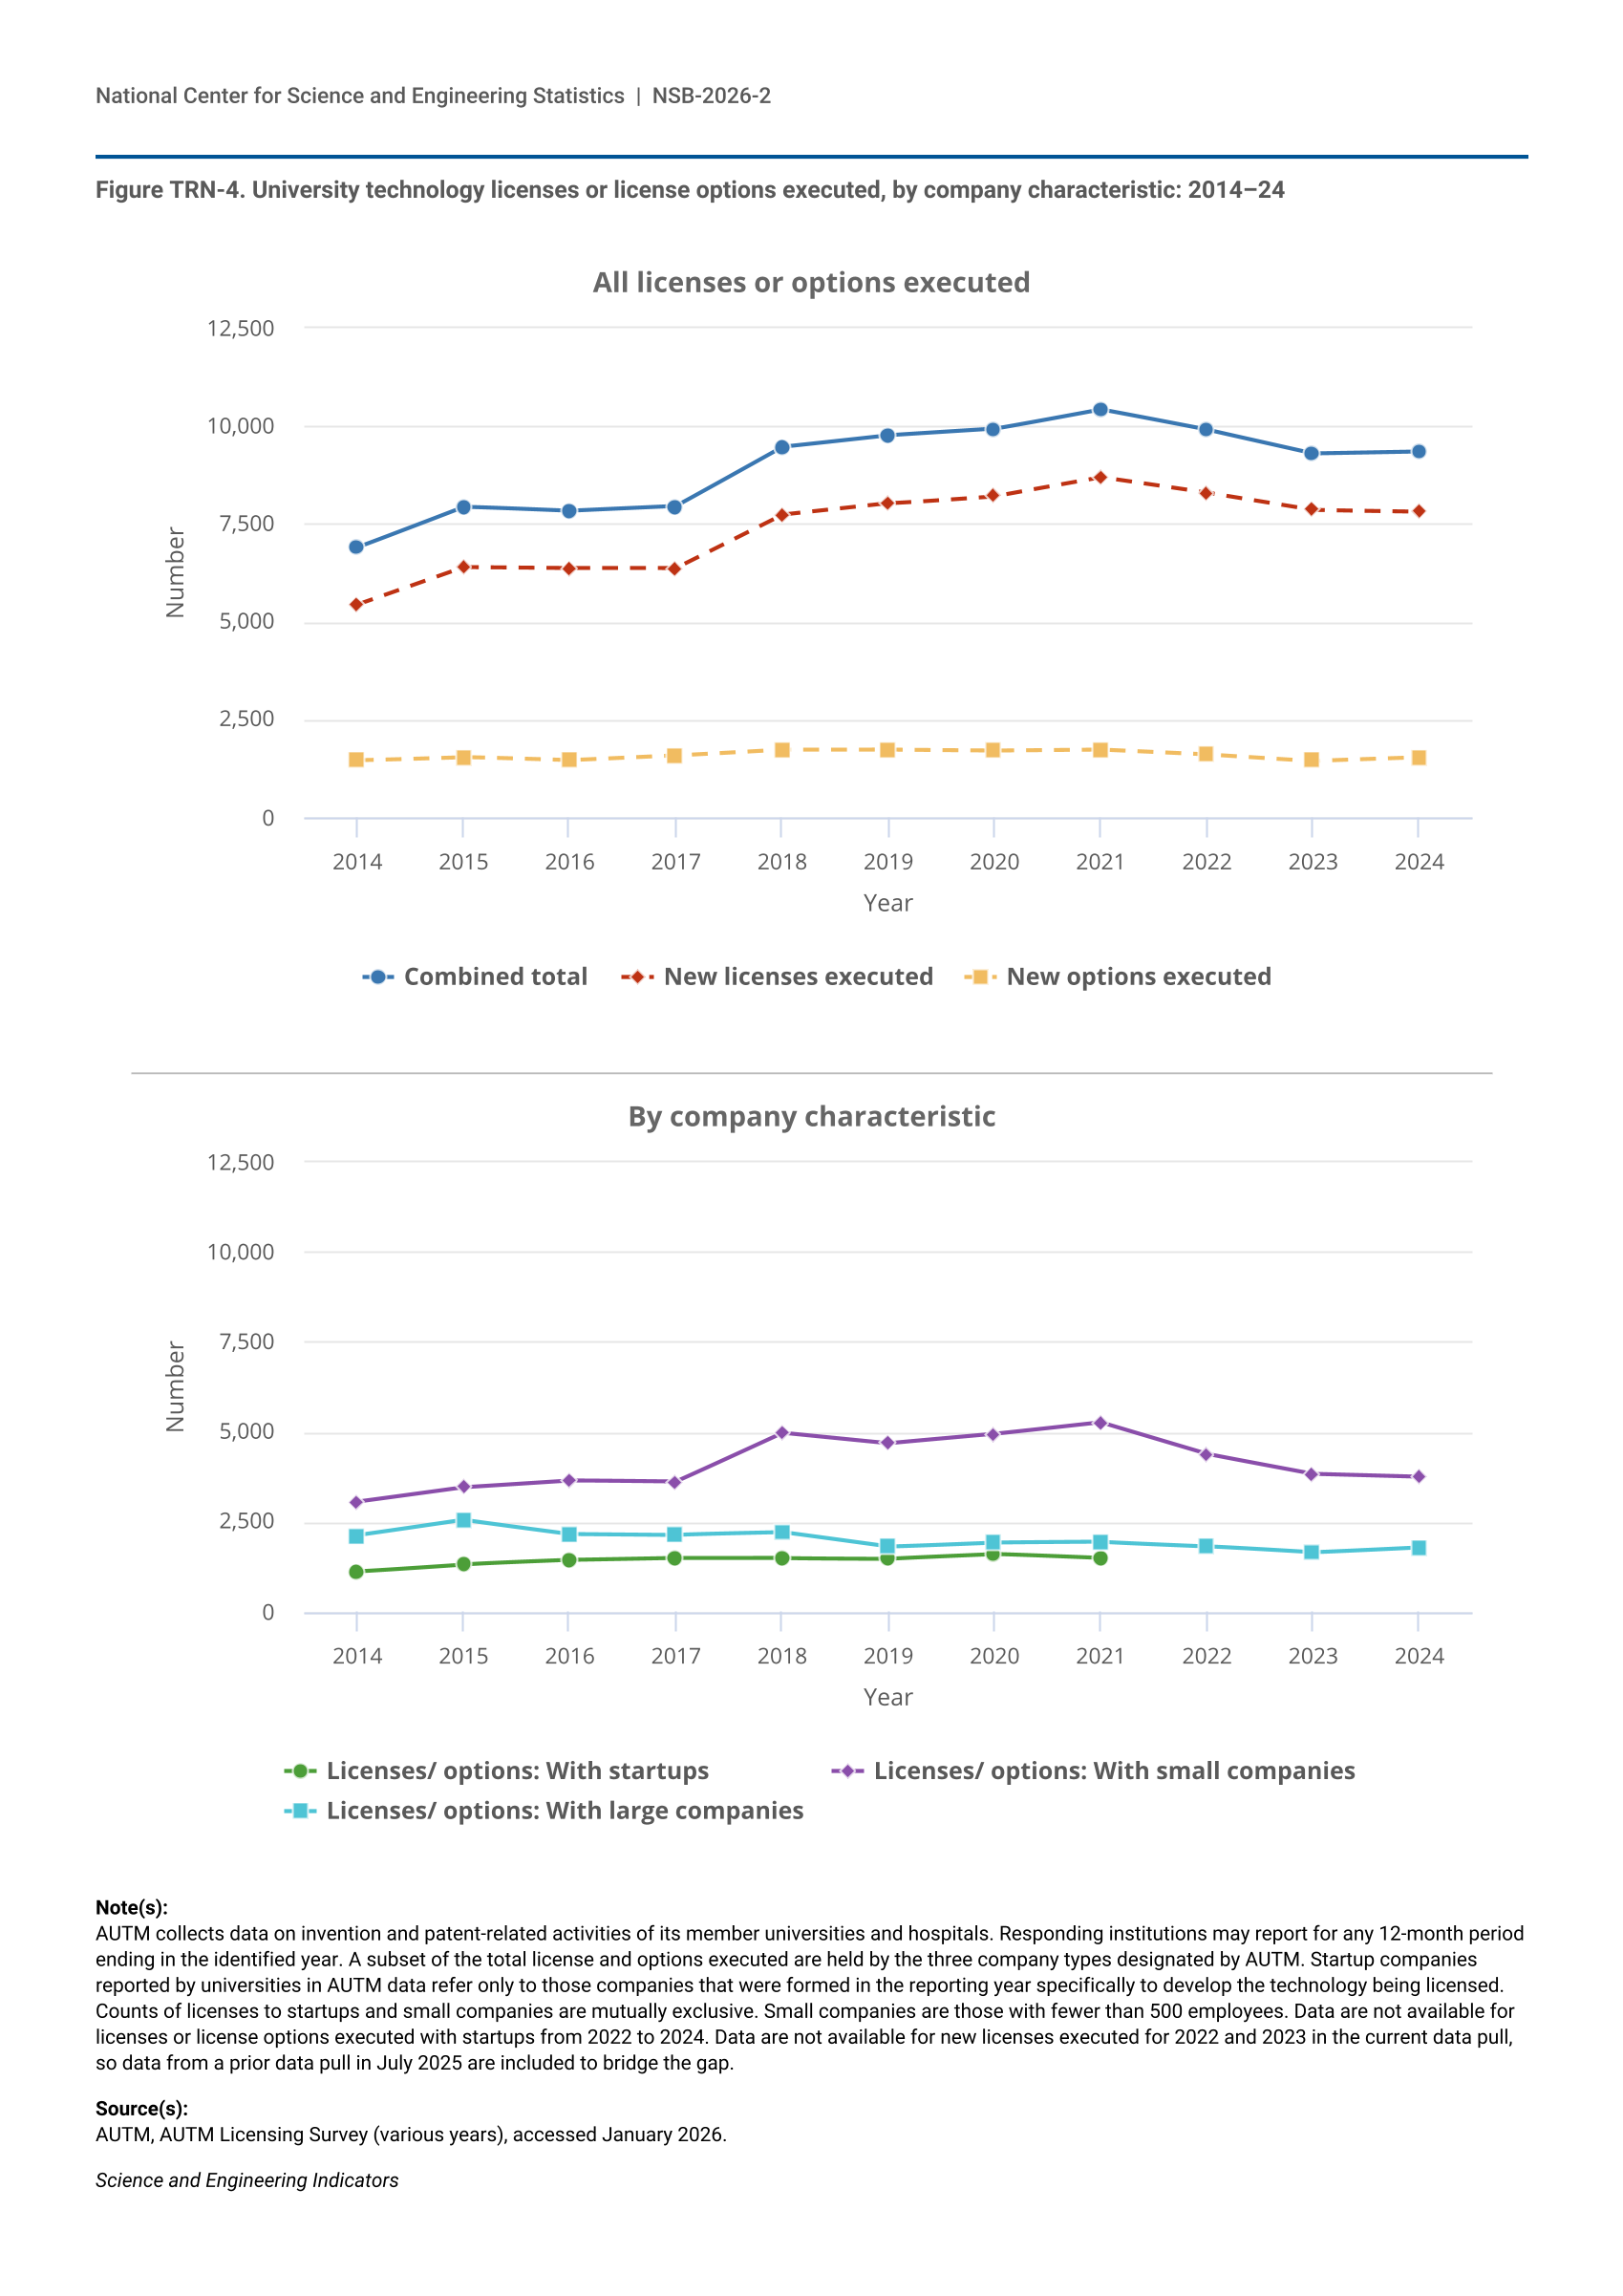
In the 2022 and 2023 editions of the AUTM licensing survey, one of our key variables, “total licenses executed,” was not included as a survey question (Figure TRN-4). In its prior data releases, AUTM constructed the 2022 and 2023 “total licenses executed” by aggregating other relevant responses. However, in the current data release (accessed January 2026), this variable remains blank for 2022 and 2023, so the “total licenses executed” that we report for these years are from the prior data release (accessed July 2025).
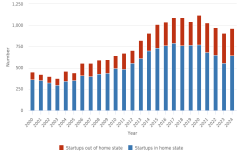
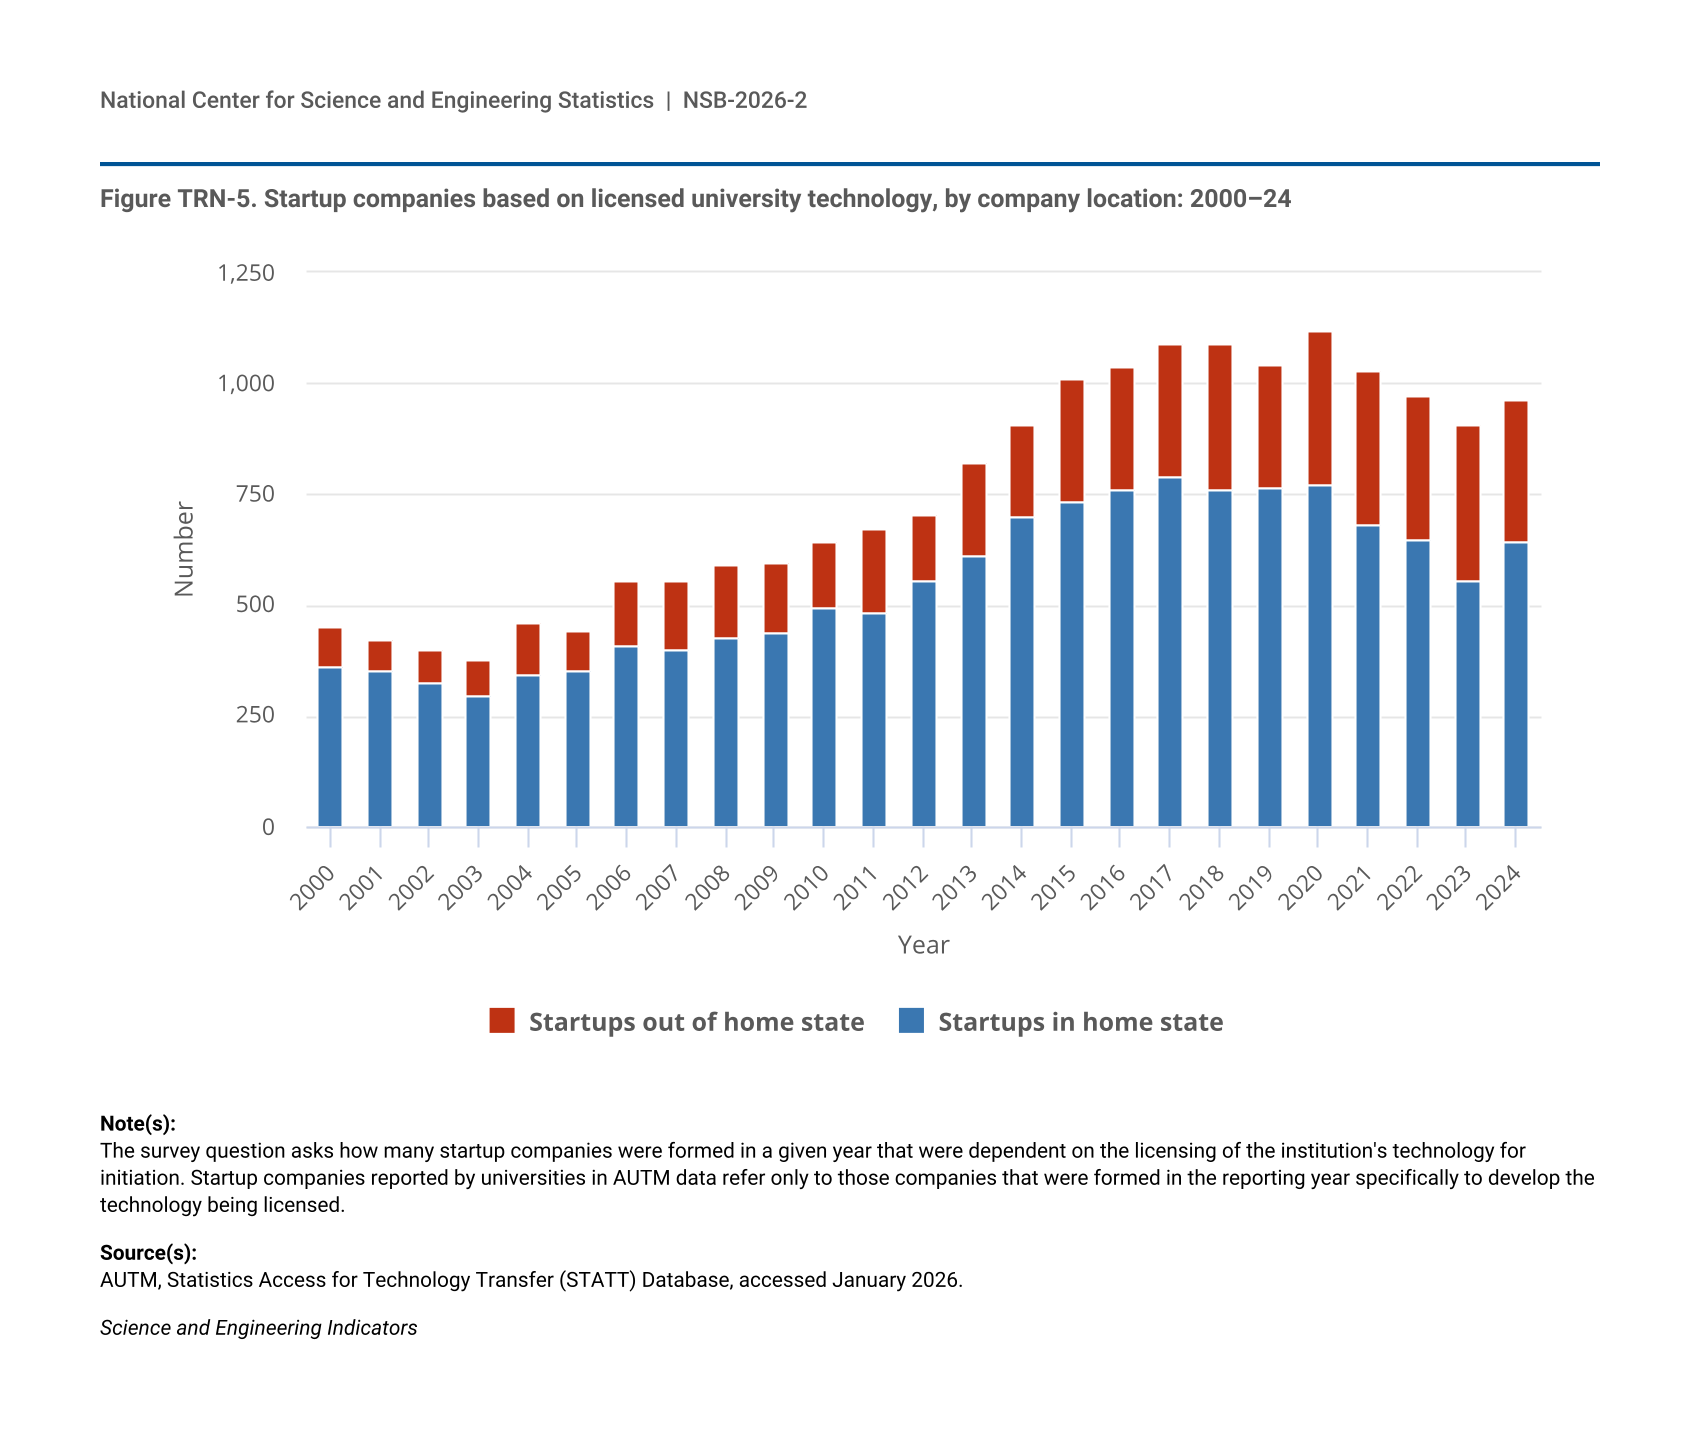
There is a difference between the “Licenses/options: With startups” variable (Figure TRN-4), which was discontinued as an AUTM survey question in 2021, and the “Start-up companies based on licensed university technology” variable (Figure TRN-5). The former includes any license or option granted to a startup, regardless of whether the startup was preexisting before licensing the technology. The latter includes only startups that were formed specifically for developing university technology.
Funding Acknowledgments Data and Methodology
Funding acknowledgments can shed light on the ability and priorities of federal funding to support discovery as measured by peer-reviewed journal articles and conference proceedings. However, some benefits and limitations of this emerging data source are important to highlight so as to accurately interpret these trends.
Data
The methodology used for federal funding acknowledgments in Table TRN-2 and Table STRN-1 was previously employed in the Indicators 2024 report Publications Output: U.S. Trends and International Comparisons (NSB 2023: Publication Output by Region, Country, or Economy and by Scientific Field). Each peer-reviewed journal article and conference proceeding in the Scopus database includes a field for funding acknowledgments that are extracted by algorithmic (software) means. In some cases where the acknowledgments field is incomplete, funding information from agencies is also used to identify funded publications in Scopus. Using this field, it is possible to observe the conversion of federal funds to published research outputs, but a direct linkage between funding inputs and published discoveries remains challenging.
Limitations
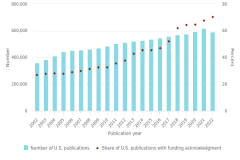
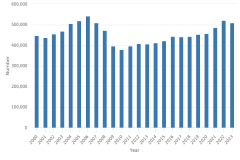
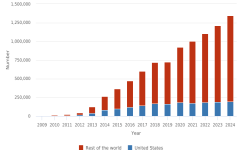
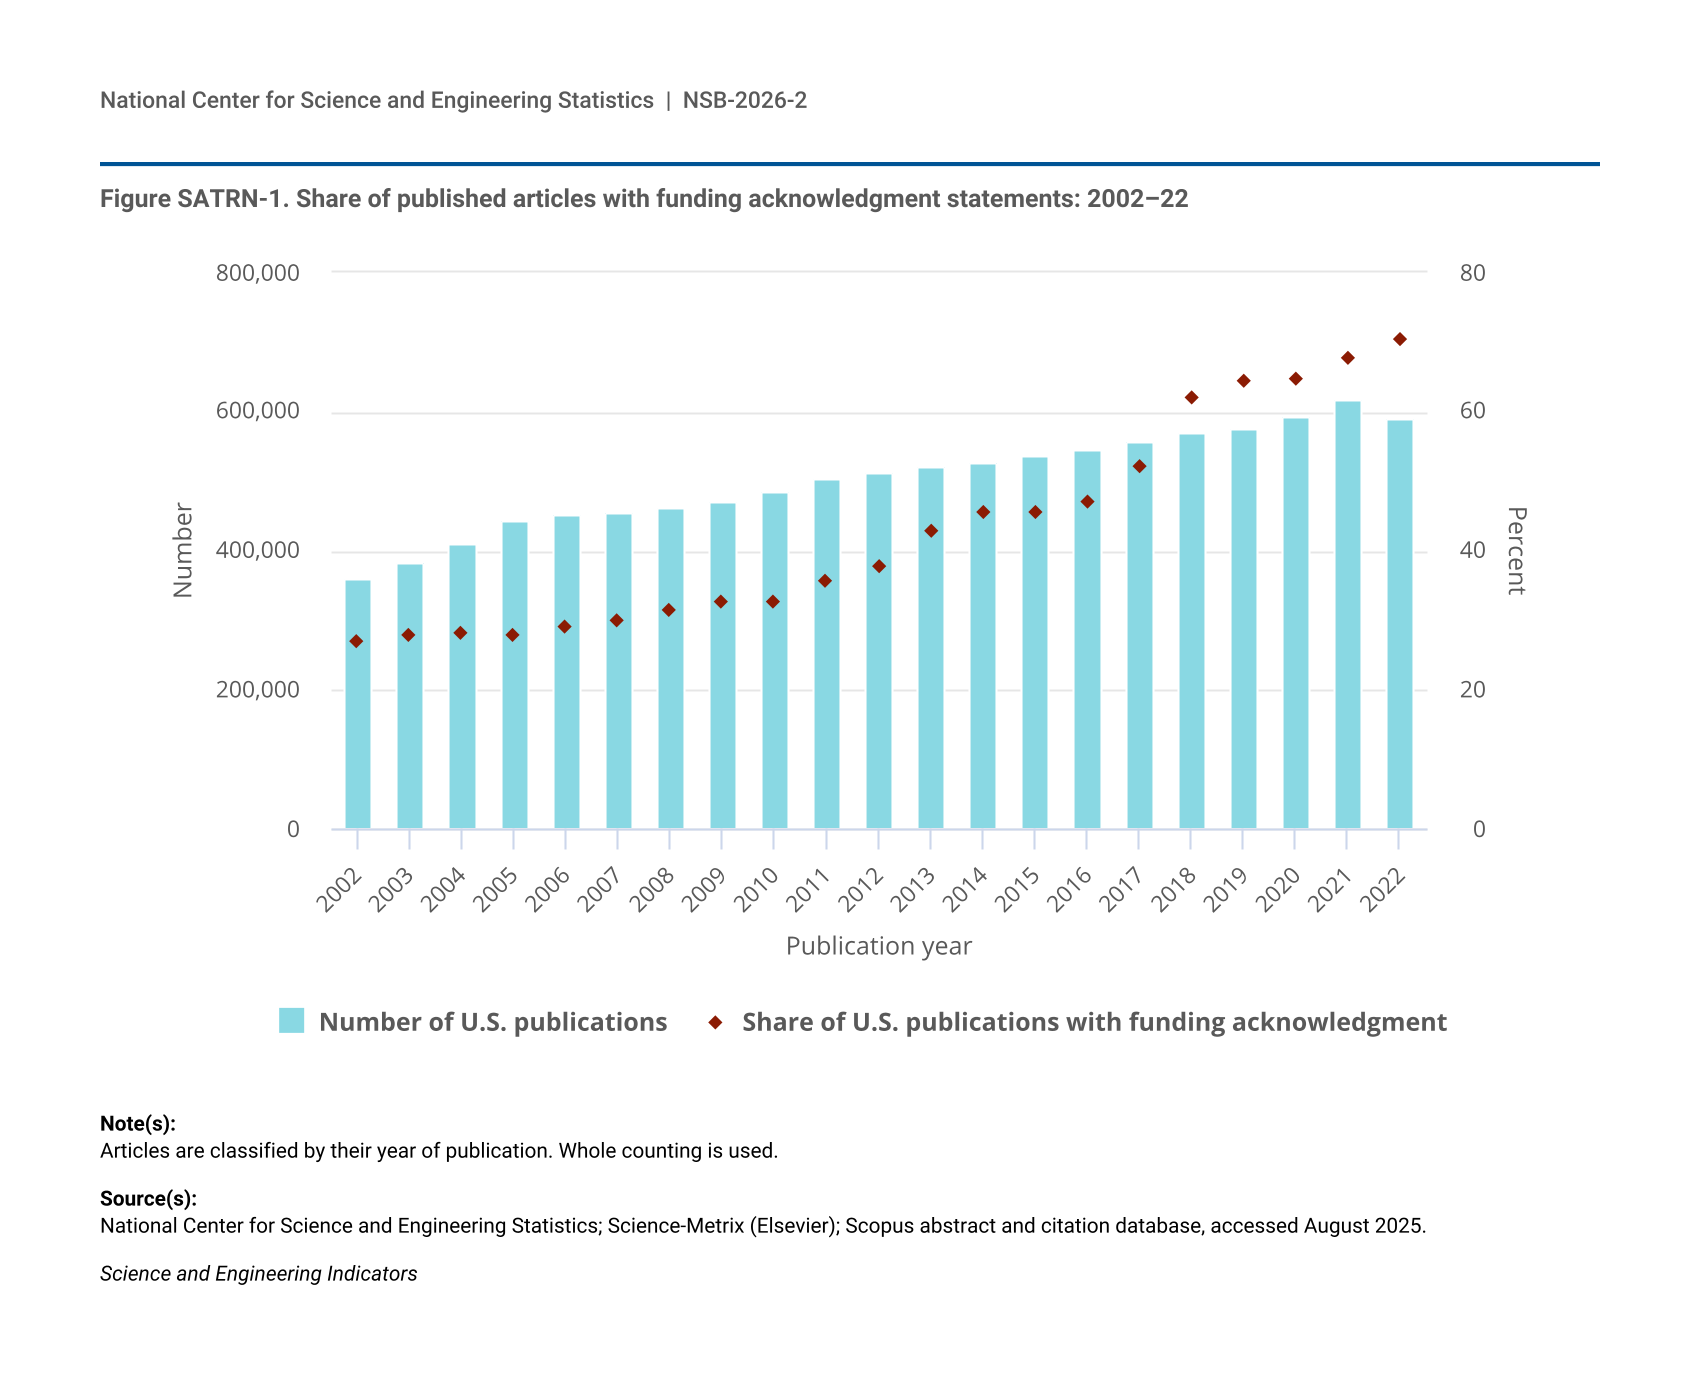
First, extraction of this information into a structured field is a relatively new effort and is most complete for the most recent 4 years. Figure SATRN-1 shows how funding acknowledgment sections have grown in coverage from 2002 (27.1% of publications with U.S. authors acknowledging a funding institution) to 2022 (70.5%). Missing data in funding fields in a Scopus entry may mean that the research did not receive funding, the authors did not cite any funding despite receiving it, or the algorithm was unable to extract the acknowledgment. In past analyses, the growth of coverage of funding was not clearly linked with federal funding acknowledgments that provided evidence that the data source has become more dependable over time (NSB 2023). In addition to improved extraction, many factors may have contributed to this growth, including increasing pressure and requirements from funders to include funding acknowledgments, standardization of acknowledgment language, and incentives to demonstrate high publication output—because future funding is tied to past conversion of funds into publications—while receiving funding. For further technical discussion, see Science-Metrix (2026).
| Publication year | Number of U.S. publications | Share of U.S. publications with funding acknowledgment |
|---|---|---|
| 2002 | 360,564 | 27.1 |
| 2003 | 382,532 | 27.8 |
| 2004 | 409,399 | 28.1 |
| 2005 | 444,123 | 27.8 |
| 2006 | 450,957 | 29.0 |
| 2007 | 456,640 | 29.9 |
| 2008 | 461,273 | 31.5 |
| 2009 | 470,290 | 32.8 |
| 2010 | 484,236 | 32.8 |
| 2011 | 502,548 | 35.7 |
| 2012 | 513,585 | 37.8 |
| 2013 | 522,164 | 42.7 |
| 2014 | 528,431 | 45.6 |
| 2015 | 536,401 | 45.6 |
| 2016 | 545,619 | 47.0 |
| 2017 | 556,030 | 52.0 |
| 2018 | 569,171 | 62.0 |
| 2019 | 575,659 | 64.4 |
| 2020 | 593,266 | 64.8 |
| 2021 | 617,153 | 67.7 |
| 2022 | 591,192 | 70.5 |
Articles are classified by their year of publication. Whole counting is used.
National Center for Science and Engineering Statistics; Science-Metrix (Elsevier); Scopus abstract and citation database, accessed August 2025.
Science and Engineering Indicators
Open-Source Software Data and Methodology
Science and engineering activity is increasingly embedded in and documented through software tools that are freely available to use, reuse, and modify. Open-source software (OSS) allows free access to modifiable digital tools that are used for work and leisure and constitutes an intangible investment in knowledge-based public goods. Indicators of its creation and use illustrate aspects of innovation and technology diffusion that enhance science and technology indicators.
These indicators were created using data collected from GitHub, a platform that allows software developers to create, store, modify, and share software. The GitHub data are used in this report for three reasons:
- GitHub’s focus on modification and sharing provides the opportunity to collect metadata about software repositories and its creators.
- GitHub is currently very broadly used with over 420 million repositories (GitHub 2026a).
- Alternative sources of data for federal contributions, such as code.gov, have been discontinued.
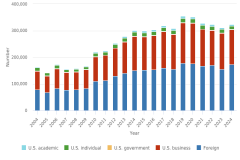
The Indicators 2026 report Translation to Impact: U.S. and Global Science, Technology, and Innovation Output provides indicators on GitHub repositories as the unit of observation. A software developer can contribute code to a project on GitHub by performing a “git commit” (GitHub 2026b), and these contributions to an open-source licensed project in a repository in a given year are a measure of innovation activity. For this analysis, OSS is computer software that (1) makes its source code available with a license; (2) provides, via the copyright holder, the rights to study, change, and distribute the software to anyone and for any purpose; and (3) is identified by the Open Source Initiative (OSI) (https://opensource.org/licenses). When available, data identifying the country or economic sector of the developer making the contribution are an indicator of the source of this innovation activity.
Data
While the sharing of computer software has been around since the 1950s, the launching of the GitHub platform in 2008 provided a collectable source of metadata that could be harvested and analyzed. Repositories with machine-detectable, OSI-approved licenses were identified, and public, active (non-archived) repositories that are not forks or mirrors of other repositories were collected using the GHOST.jl package (Santiago Calderon 2020). The information collected for each repository includes creation date, description of the repository, primary language, user-selected topics, and a list of all developers that appear in the commit data for the identified repositories were compiled and a set of user data was collected for each developer, including GitHub account creation date, email address, location, bio, company, and website, if provided by the user.
A likely country of residence was then identified for each user based on available self-identified metadata using the diverstidy and tidyorgs packages (Kramer 2021a, 2021b). The initial implementation relied on only two fields (location and email domain), and returned a single inferred country per contributor. This was subsequently expanded so that social accounts and the user bio can inform the country assignment, and that multiple countries can be identified for each user. An economic sector (academic, business, government, nonprofit) was also identified for developers based on the institution name in the user bio, affiliation, or email address.
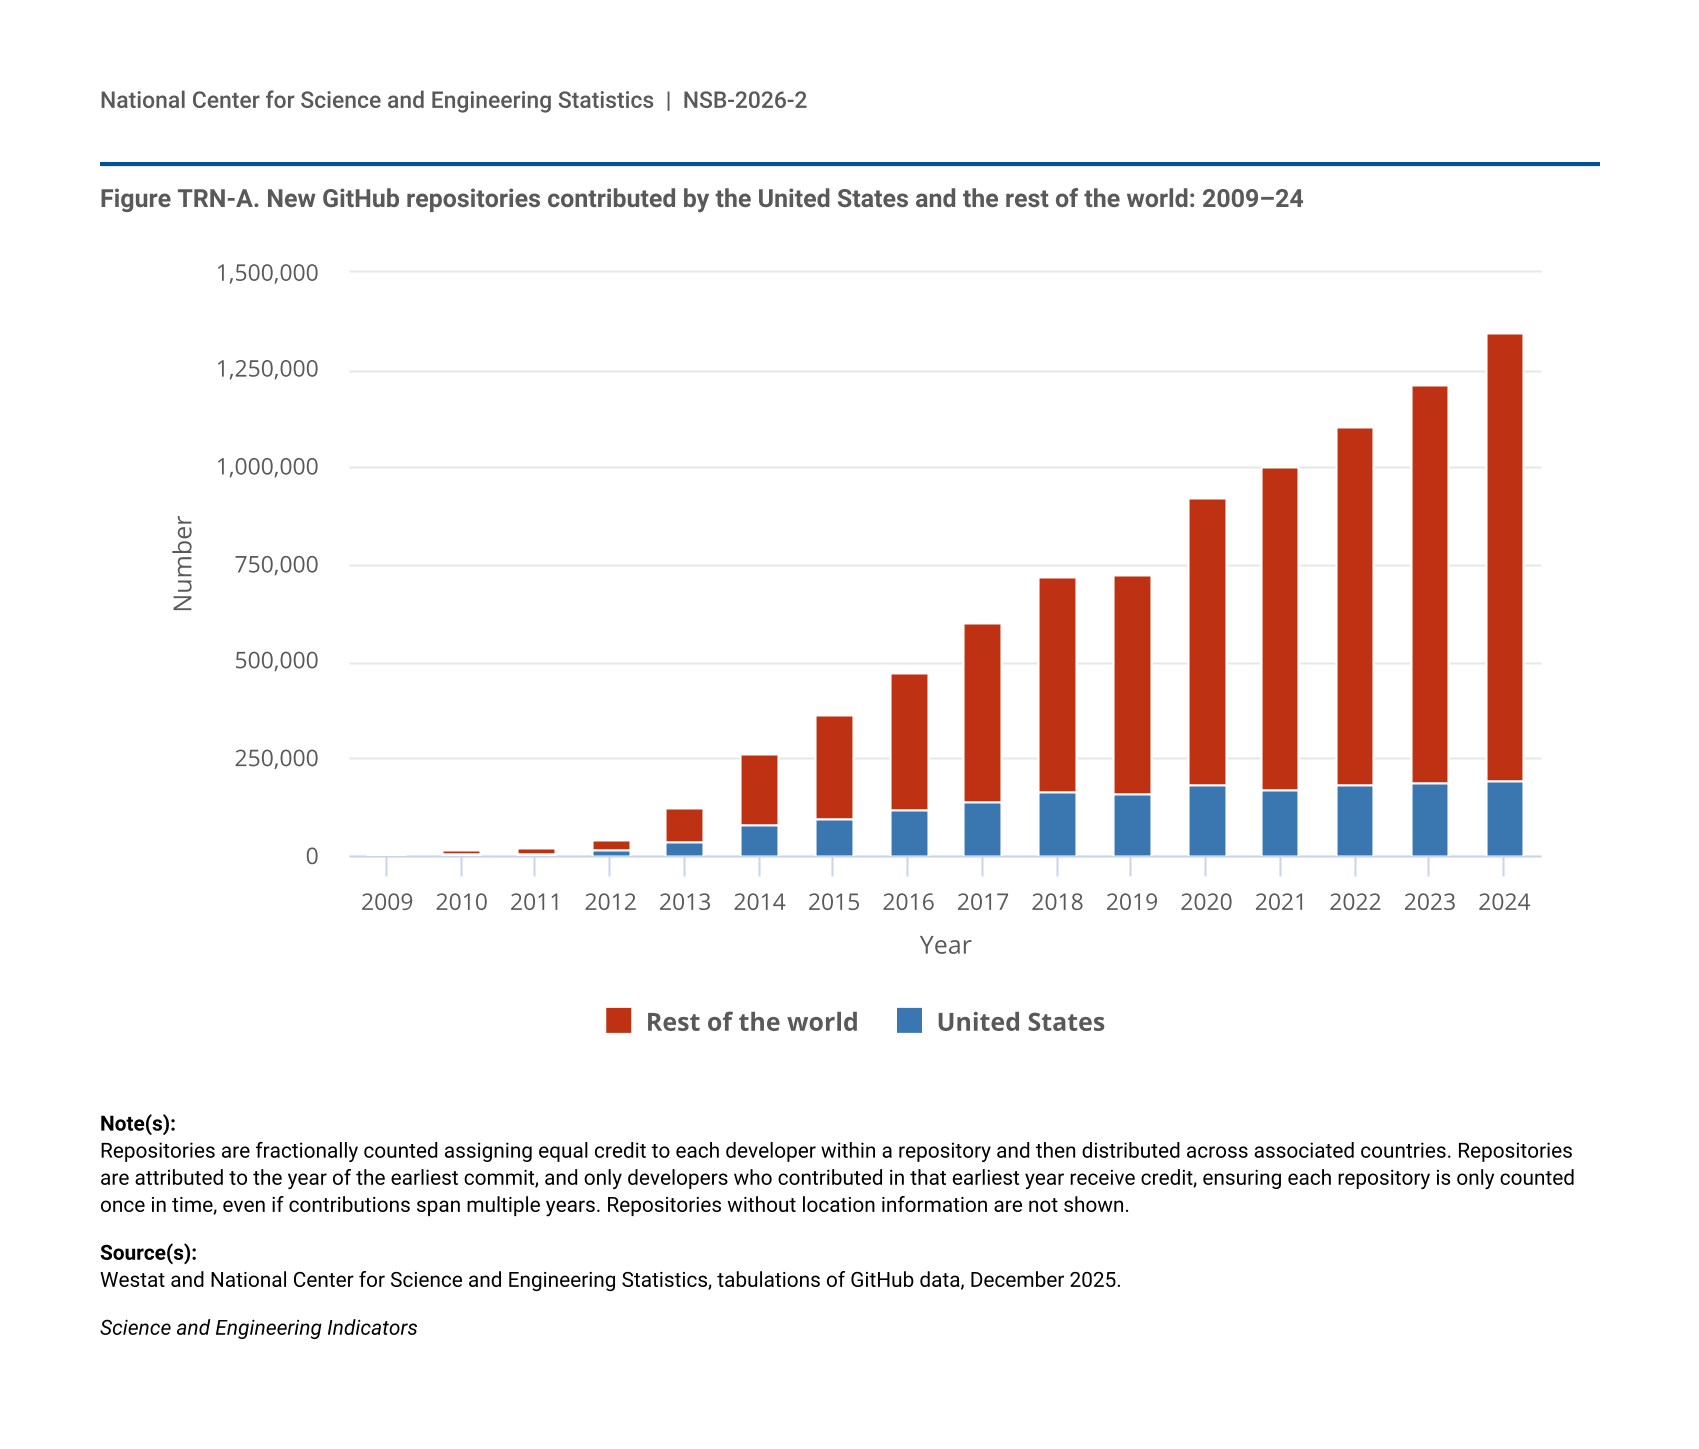
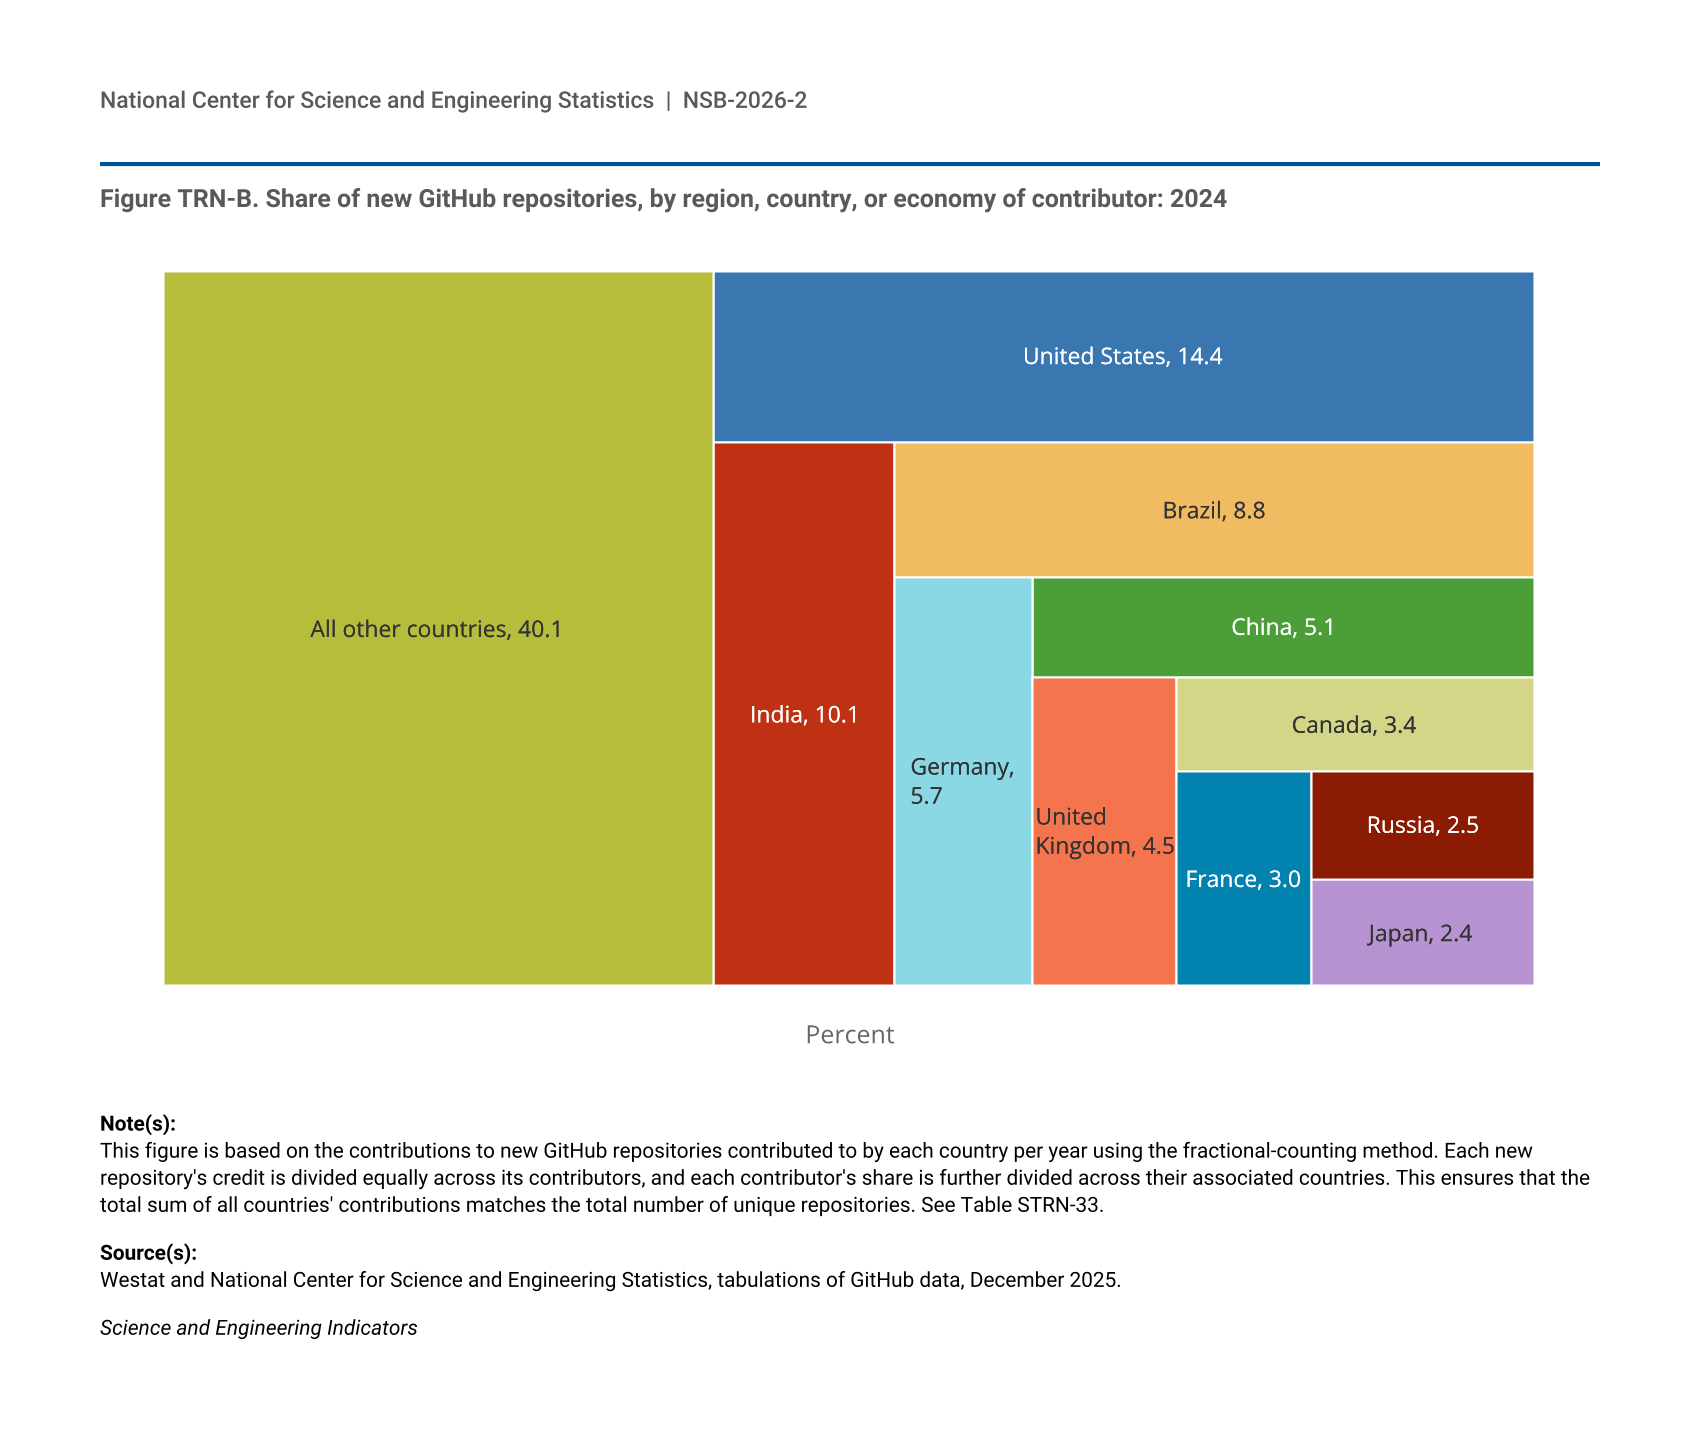
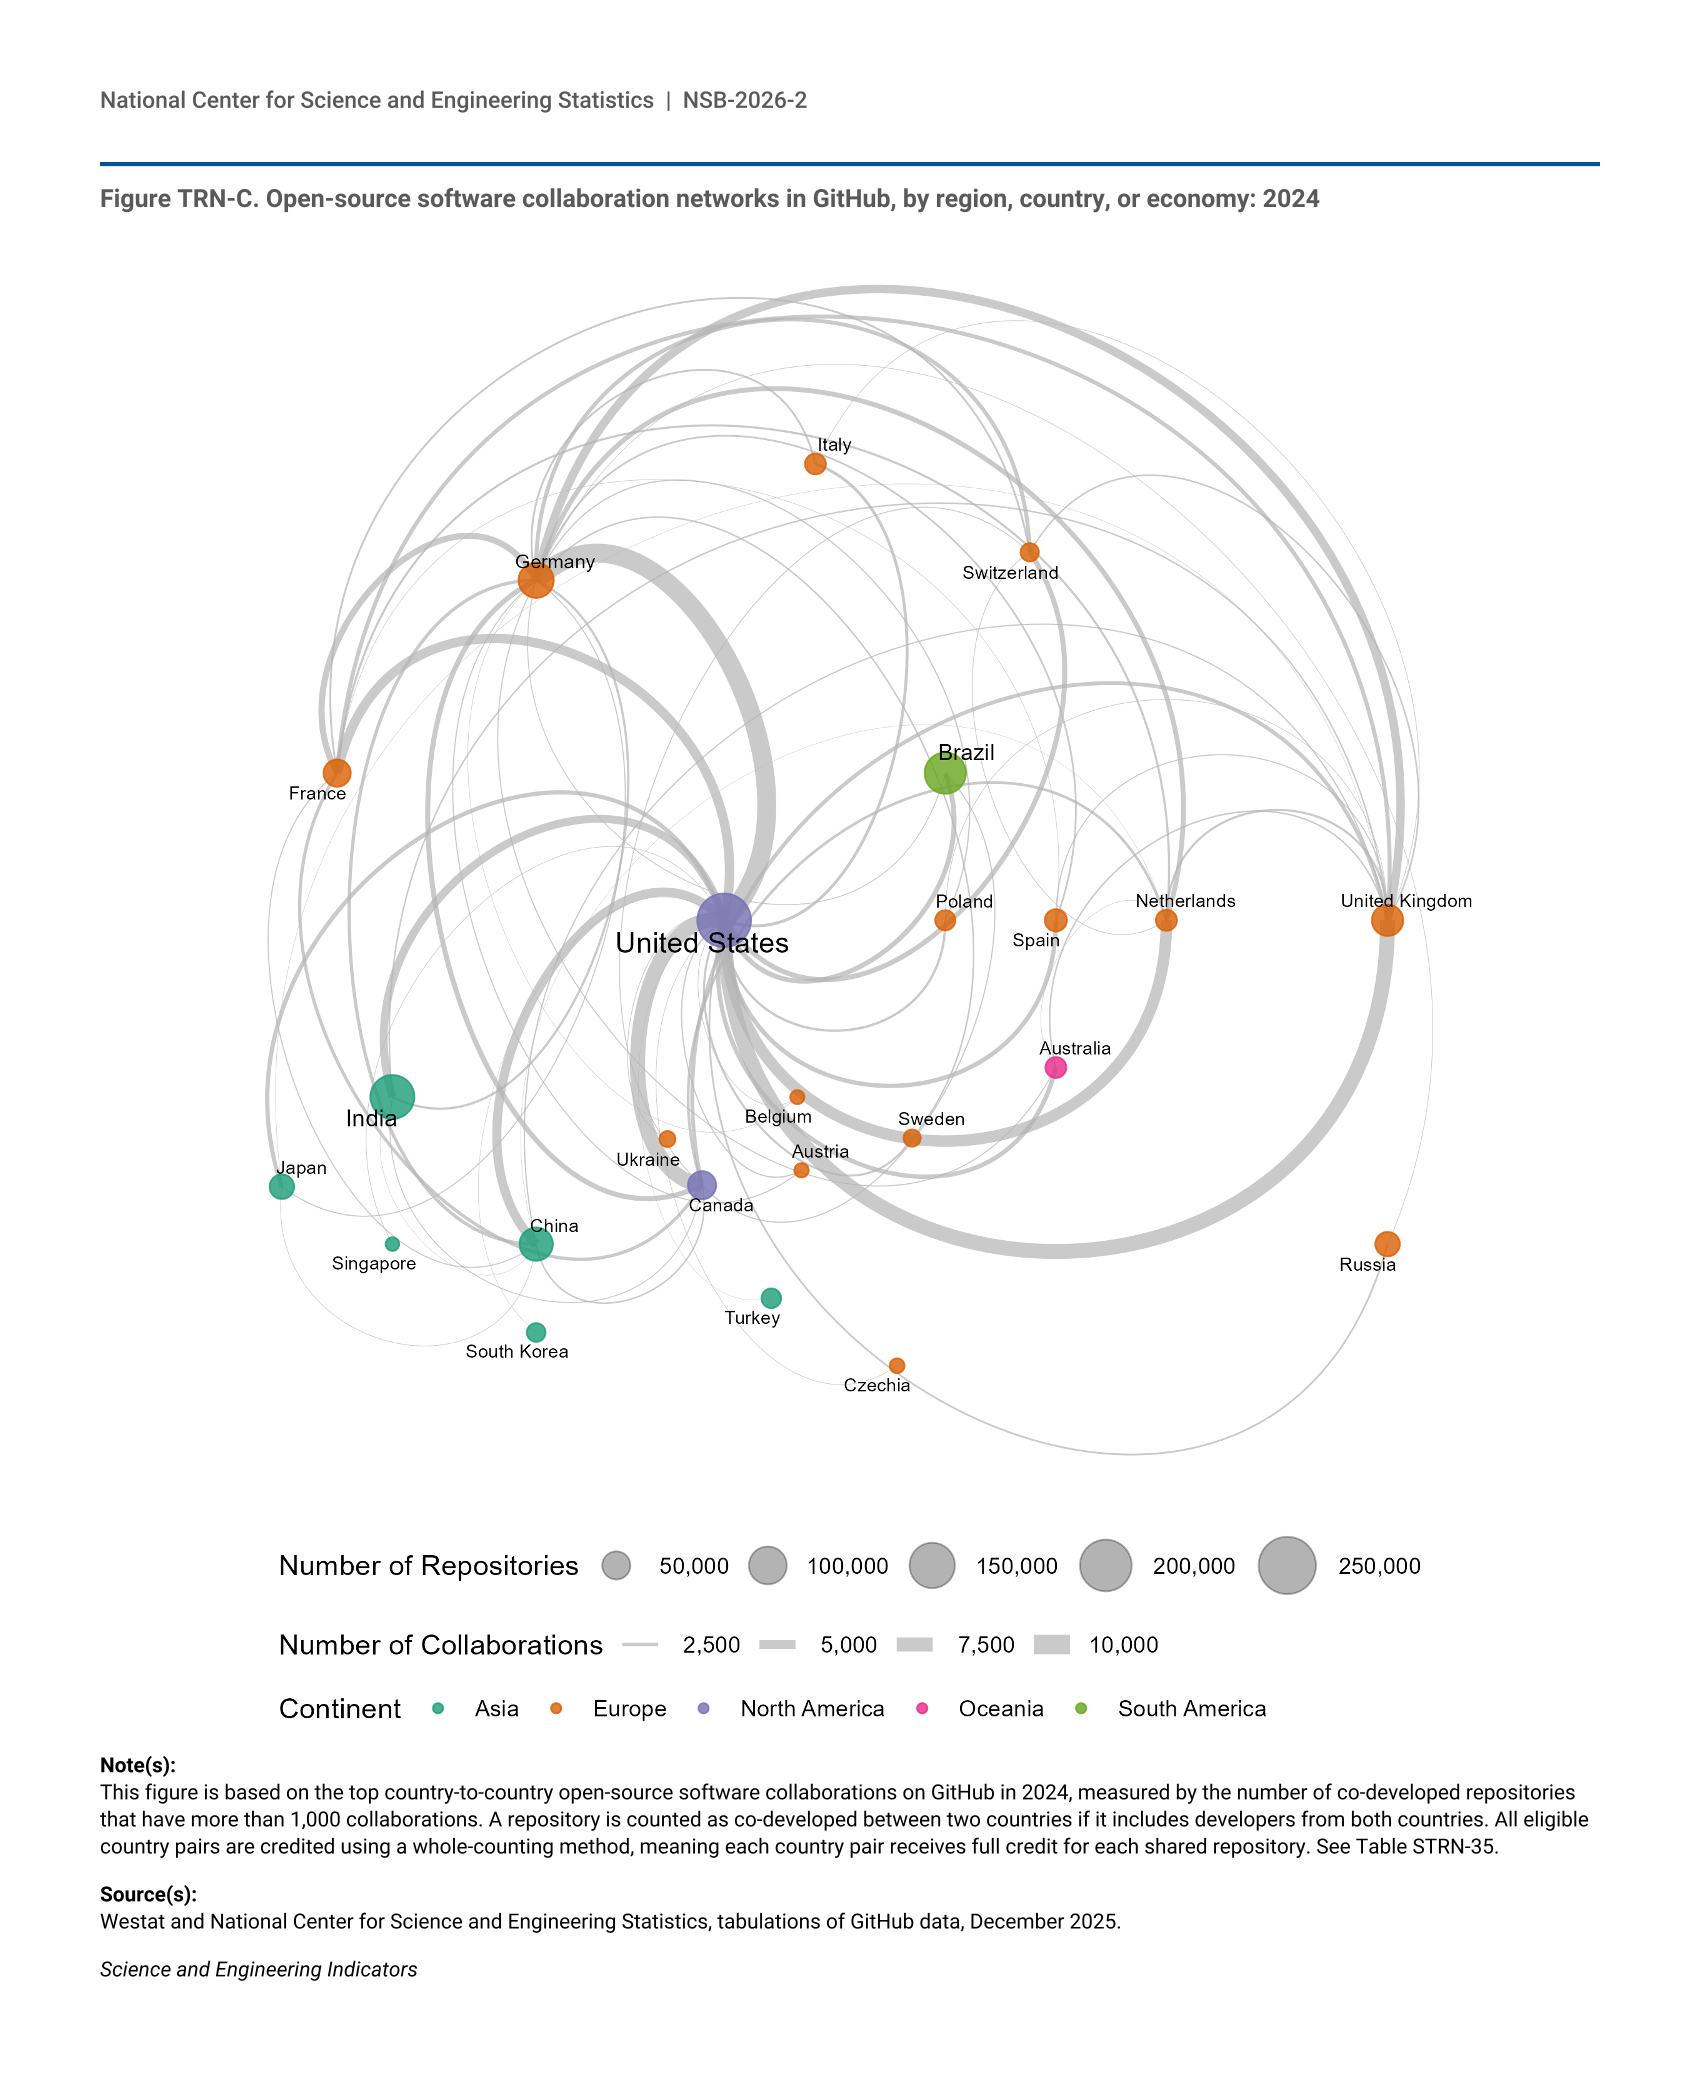
Contributions to new repositories are an indicator of innovation. Both fractional counting and whole counting methods were employed for different analytical purposes. In fractional counts, each repository’s credit is divided equally across the number of developers that contributed to it in the first year after its creation, and each developer’s share is further divided across that developer’s associated countries. If a developer is affiliated with two countries, each country receives half of that developer’s share. This ensures that the total sum of all countries’ contributions matches the total number of unique repositories. In whole counts, credit for each repository is counted one full time for each institution where at least one affiliate or employee contributed. Whole counting measures instances of collaboration and the contributions of particular institutions, but whole counts should not be aggregated because repositories codeveloped by multiple institutions would be double counted.
Limitations
The data collection aims to provide a census of all OSS projects on GitHub, but although GitHub is a large platform and is frequently used by developers for storing and distributing OSS, not all OSS projects are present on GitHub (Korkmaz et al. 2024). Furthermore, while there are many established OSS licenses, some valid OSS licenses may use nonstandard language that were not recognized by the GHOST.jl tool during data collection. Both of these issues may have resulted in an overall undercount of OSS projects.
A substantive caveat about the use of these data as indicators is that the GitHub platform does not maintain complete information about all developers. Location and sector analyses rely on location and affiliation data that GitHub users voluntarily supply, and the coverage of country and sector information is affected by the typical limitations of user-supplied data. Country could not be identified for 67% of GitHub user profiles; within the subset of U.S.-based GitHub users, sector could not be identified for 68% of profiles (Westat 2026). As a result, data tables’ geographic location and institutional affiliations are based only on the repositories with usable information. Data on the location of contributors is missing for more than half of the repositories (64%). Location information was available for between 32% and 52% of the repositories in each year from 2009 to 2024, with location information available for 36% of repositories in 2024 (Table STRN-33). In their Innovation Graph, which uses user Internet Protocol data, GitHub research finds a similar distribution of GitHub repositories to those presented in the Indicators 2026 report Translation to Impact: U.S. and Global Science, Technology, and Innovation Output, with a large share of developers from the United States and India (https://github.com/github/innovationgraph/blob/main/docs/datasheet.md). Data on the institutional affiliation of contributors is missing for 84% of the repositories. This incomplete coverage may affect the reliability of location and sector analyses, which should be regarded as experimental at this time.
PitchBook Venture Capital Data and Methodology
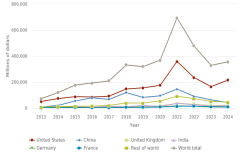
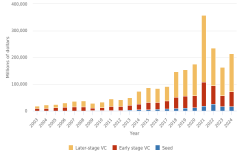
The venture capital (VC) data used in this report highlight trends in VC investment and venture-backed companies, which are indicators of innovation and entrepreneurship. VC investors invest in companies with products that are high risk but that they believe have a significant likelihood of generating large returns if successful. Although VC investment is a small share of overall investments, VC-funded companies often have outsized influence on the innovation market. Data on U.S. and global VC investment trends can be viewed as leading indicators of innovation activity. The VC data used in the Indicators 2026 report Translation to Impact: U.S. and Global Science, Technology, and Innovation Output were from the proprietary PitchBook Venture Capital and Private Equity Database (https://pitchbook.com/).
PitchBook data are gathered through a proprietary process compiling relevant information from news articles, regulatory filings, press releases, and websites. Some of the information gathering and verification include direct communication with firms, investors, and other relevant people.
Data
PitchBook is compiled and maintained for use by VC firms, private equity firms, investment banks, and limited partners to analyze, research, and source deals. It was not intended to be a statistical data source on trends in VC investment over time. Therefore, while the intent is to compile information and statistics on as many relevant firms and investment deals as possible, information about the overall representativeness is not available (PitchBook 2026a). PitchBook advertises itself as a comprehensive resource for investors, but the specific methodologies used to substantiate this claim are not publicly documented (Pitchbook 2026b).
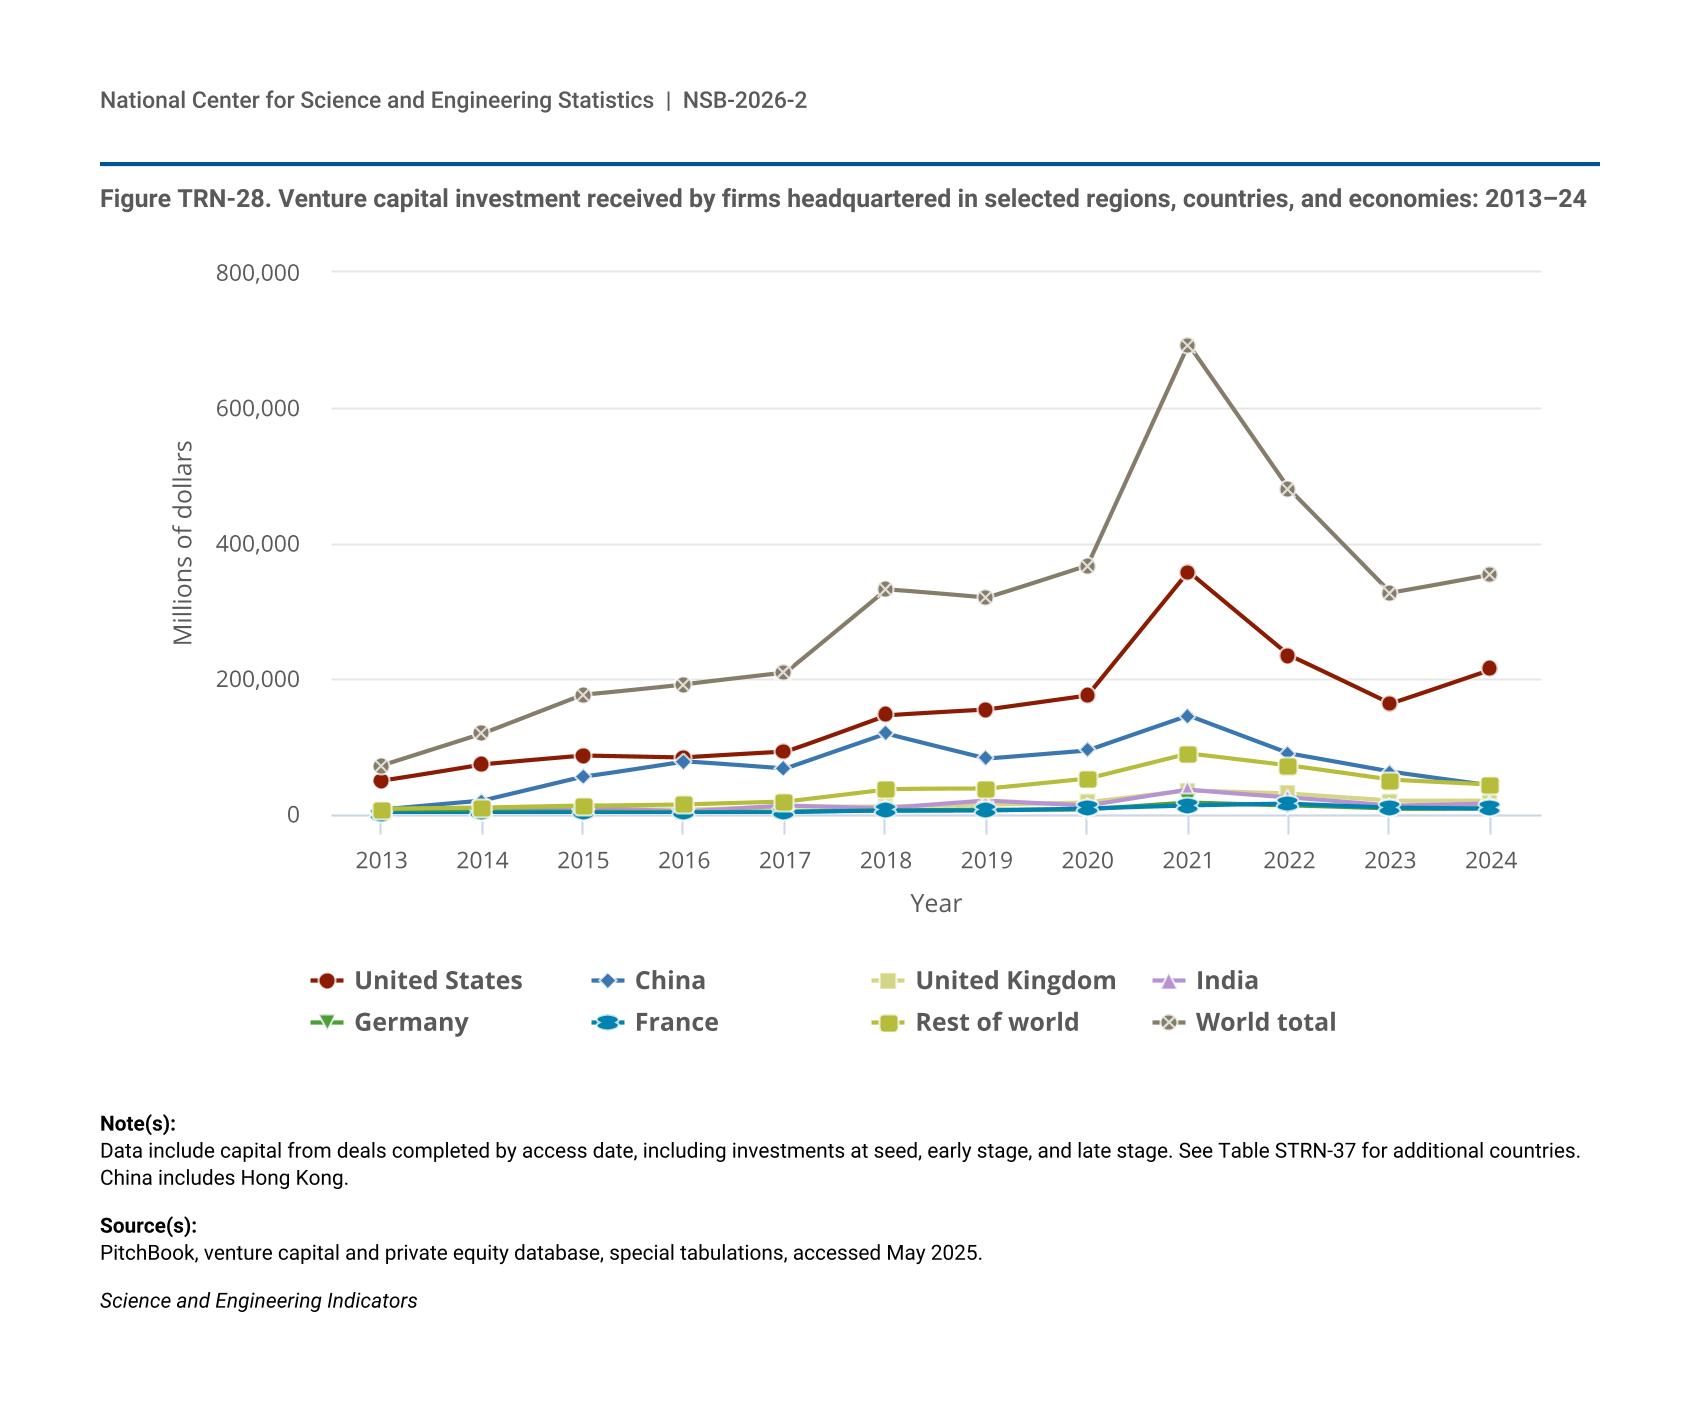
VC deals presented at the country level are classified based on the location of the company headquarters. The search terms used are Deal Type: All VC Stages, Ownership Status: All Ownership Statuses, Backing Status: VC-backed, and Business Status: All Business Statuses.
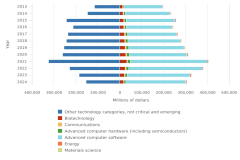
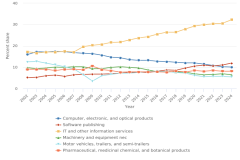
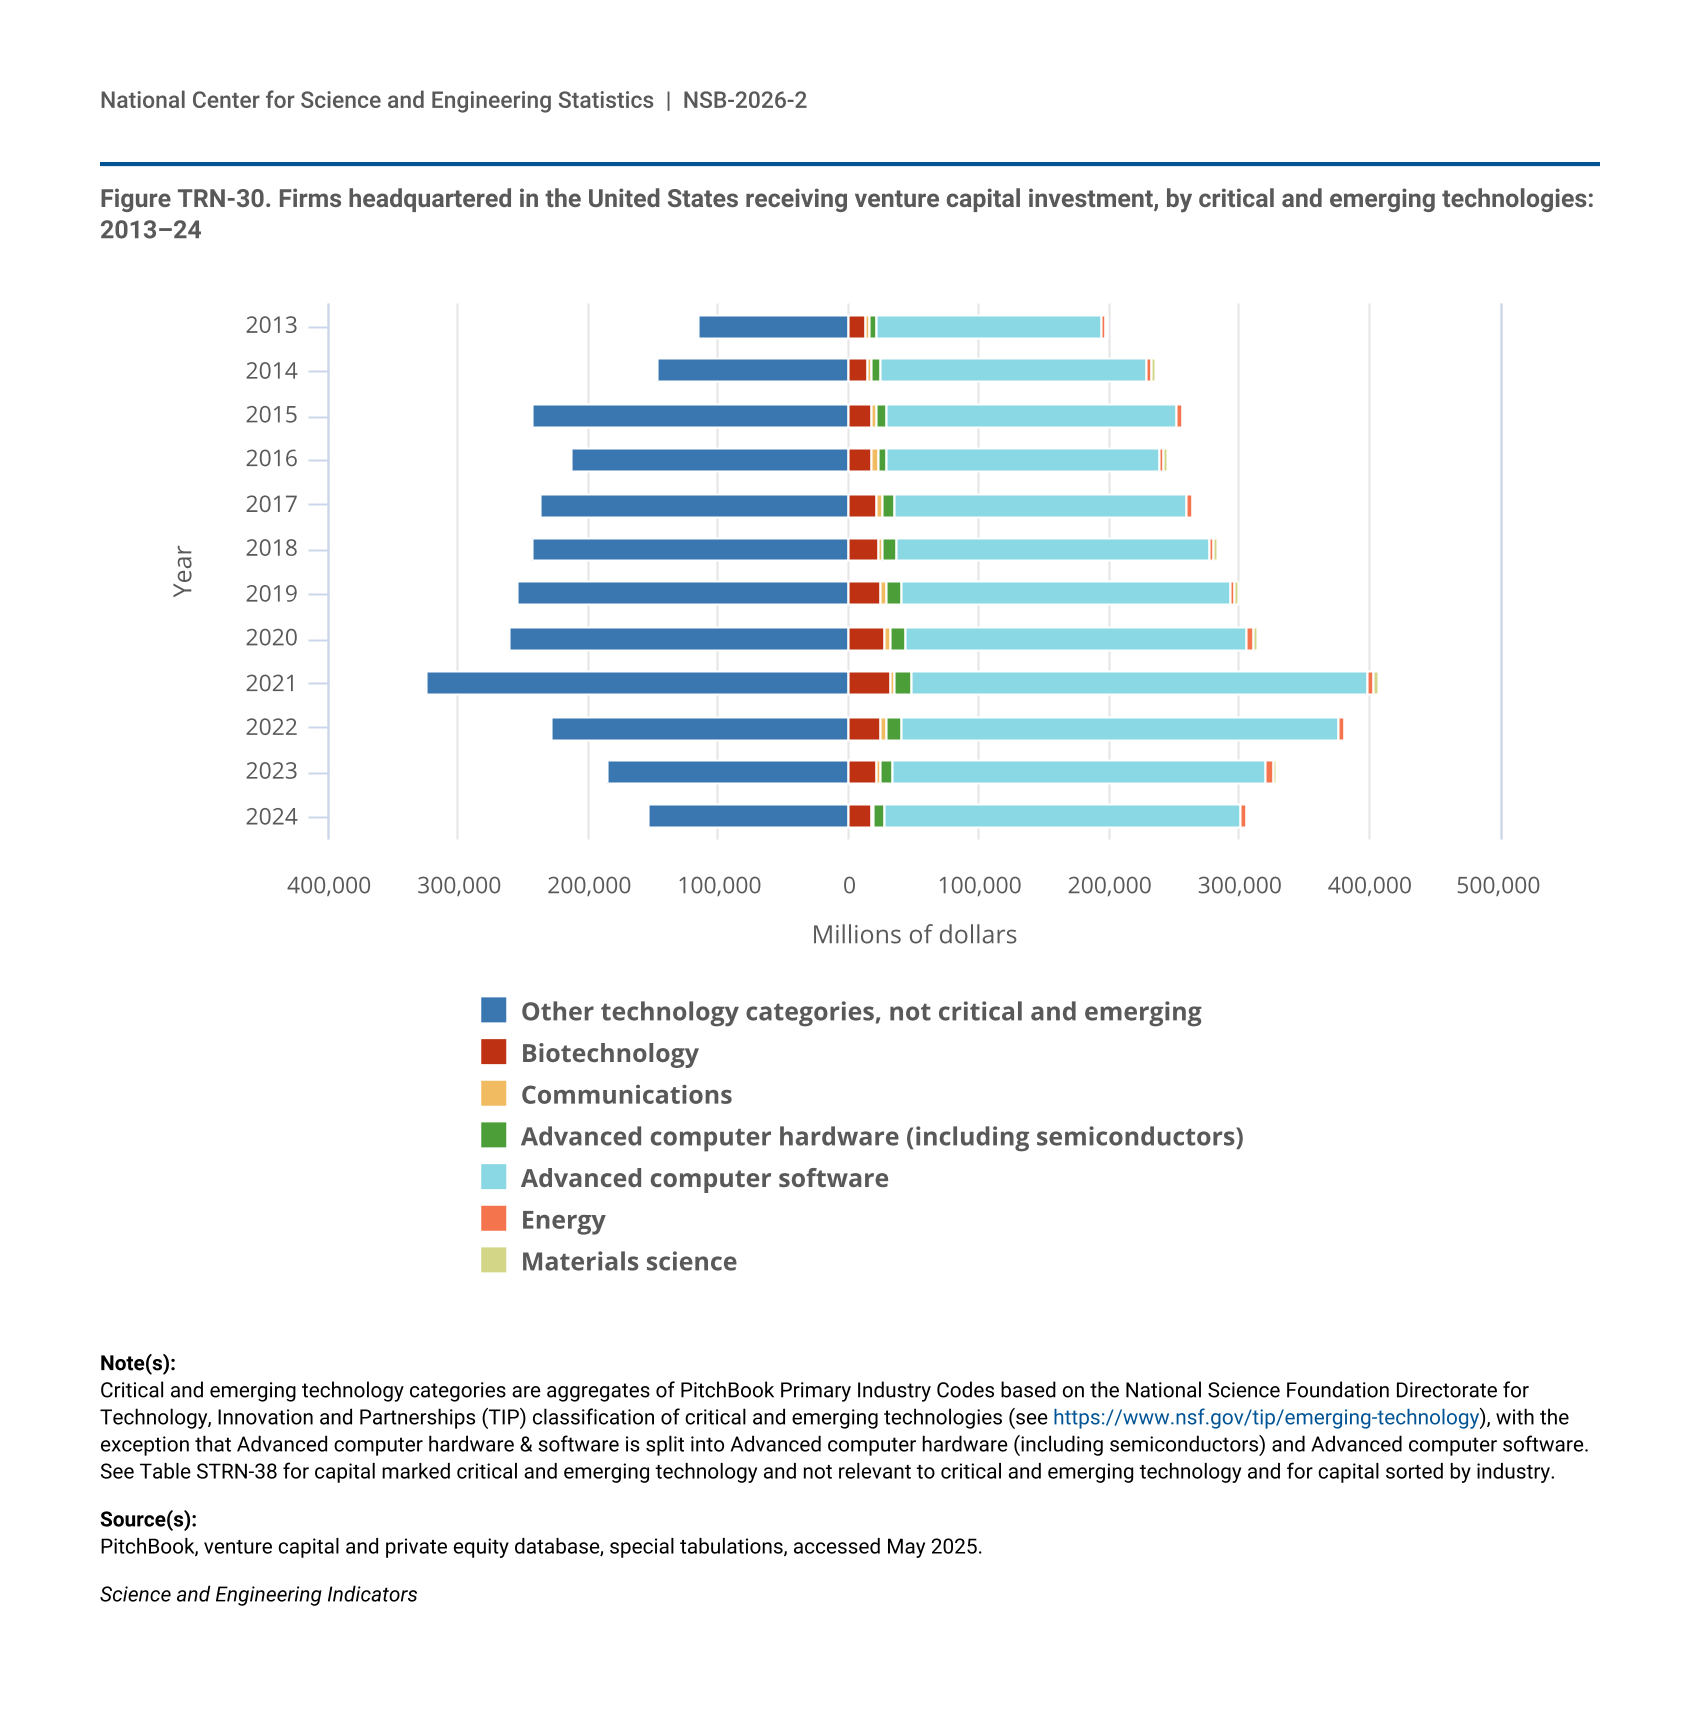
PitchBook uses multiple methods for classifying the industry or market served by a firm. The most granular classification is the Primary Industry Code (PIC), which is a customized adaptation by PitchBook of the Global Industrial Classification Standard and includes over 200 unique industries. The critical and emerging technology (CET) classifications shown in Figure TRN-33 are aggregates of multiple PICs, as shown in Table SATRN-3. For continuity, prior classifications presented in the Indicators 2024 report Invention, Knowledge Transfer, and Innovation are also shown in Table STRN-38, along with their classification crosswalk in Table SATRN-3.
B2B = business to business; B2C = business to consumer; CET = critical and emerging technology; IT = information technology.
PitchBook, venture capital and private equity database, special tabulations, accessed May 2025.
Science and Engineering Indicators
Limitations
PitchBook’s data are compiled and maintained as a resource for investors, whose priority is often accurate information on particular companies, deals, and other investors—rather than aggregate indicators on the entire data set. For this reason, some of the decisions or company policy behind their collection may be misaligned with standard practices for large-scale administrative data sets.
PitchBook prioritizes international coverage of firms located in the following regions: North America, Europe, Israel, Asia Pacific region, Middle East, North Africa, and Turkey (PitchBook 2025). PitchBook coverage by country may be incomplete in countries not included in a region on this list.
Key to Acronyms and Abbreviations
CET: critical and emerging technology
HERD: Higher Education Research and Development Survey
PIC: Primary Industry Code
R&D: research and development
STATT: Statistics Access for Technology Transfer Database
TTO: technology transfer office
USPTO: Patent and Trademark Office
VC: venture capital
References
AUTM. 2024. AUTM Licensing Activity Survey. Available at https://autm.net/AUTM/media/Surveys-Tools/Documents/AUTM-FY24-Licensing-Survey-Definitions-Instructions.pdf. Accessed 10 January 2026.
AUTM. 2025. Who We Are. Available at https://autm.net/about-autm/who-we-are/. Accessed 22 September 2025.
Castillo F, Gilless JK, Heiman A, Zilberman D. 2018. Time of Adoption and Intensity of Technology Transfer: An Institutional Analysis of Offices of Technology Transfer in the United States. Journal of Technology Transfer 43(1):120–38. Available at https://doi.org/10.1007/s10961-016-9468-5. Accessed 8 January 2026.
Compagnucci L, Spigarelli F. 2020. The Third Mission of the University: A Systematic Literature Review on Potentials and Constraints. Technological Forecasting and Social Change 161:120284. Available at https://doi.org/10.1016/j.techfore.2020.120284. Accessed 14 January 2026.
GitHub. 2026a. Let’s Build from Here. Available at https://github.com/about. Accessed 24 March 2026.
GitHub. 2026b. Git Commit. Available at https://github.com/git-guides/git-commit. Accessed 23 March 2026
Korkmaz G, Santiago Calderón JB, Kramer BL, Guci L, Robbins CA. 2024. From GitHub to GDP: A Framework for Measuring Open Source Software Innovation. Research Policy 53(3):104954. Available at https://doi.org/10.1016/j.respol.2024.104954. Accessed 23 March 2026.
Kramer BL. 2021a. diverstidy: A Tidy Package for Detection and Standardization of Geographic, Population, and Diversity-Related Terminology in Unstructured Text Data. Available at https://www.brandonleekramer.com/packages/. Accessed 23 March 2026.
Kramer BL. 2021b. tidyorgs: A Tidy Package That Standardizes Text Data for Organizational Analysis. Available at https://www.brandonleekramer.com/packages/. Accessed 23 March 2026.
Leydesdorff L. (2010), The Knowledge-Based Economy and the Triple Helix Model. Annual Review of Information Science and Technology 44:365–417. Available at https://doi.org/10.1002/aris.2010.1440440116. Accessed 15 January 2026.
National Science Board, National Science Foundation. 2023. Publications Output: U.S. Trends and International Comparisons. Science and Engineering Indicators 2024 (Indicators 2024). NSB-2023-33. Alexandria, VA. Available at https://ncses.nsf.gov/pubs/nsb202333/.
National Science Board (NSB), National Science Foundation. 2024. Invention, Knowledge Transfer, and Innovation. Science and Engineering Indicators 2024 (Indicators 2024). NSB-2024-1. Alexandria, VA. Available at https://ncses.nsf.gov/pubs/nsb20241/.
Perkmann M, Tartari V, McKelvey M, Autio E, Broström A, D’Este P, Fini R, Geuna A, Grimaldi R, Hughes A, Krabel S, Kitson M, Llerena P, Lissoni F, Salter A, Sobrero M. 2013. Academic Engagement and Commercialisation: A Review of the Literature on University–Industry Relations. Research Policy 42(2):423–42. Available at https://doi.org/10.1016/j.respol.2012.09.007. Accessed 28 January 2026.
PitchBook. 2025. Regional Tracking Scope. Available at https://pitchbook.com/. Accessed 29 January 2026.
PitchBook. 2026a. Discover Hard-to-Find Data and Expand Your Story. Available at https://pitchbook.com/research-process. Accessed 5 January 2026.
PitchBook. 2026b. PitchBook Key Differentiators. Available at https://pitchbook.com/pitchbook-key-differentiators#data. Accessed 5 January 2026.
Santiago Calderón JB. 2020. GHOST.jl. Available at https://github.com/team-oss/GHOST.jl. Accessed 23 March 2026.
Science-Metrix. 2026. Patent and Trademark Indicators for the Science and Engineering Indicators 2026: Technical Documentation. Available at https://www.science-metrix.com/reports/. Accessed May 2026.
Westat. 2026. Open-Source Software Indicators for the Science and Engineering Indicators 2026. Technical Documentation. Available at https://westat-oss.github.io/. Accessed May 2026