 An official website of the United States government
 International Collaboration and Citations
S&E research has become more global over the past decade—a trend evidenced cross-nationally (Glänzel and Schubert 2005; Luukkonen et al. 1993; Royal Society 2011). Researchers gather scientific expertise beyond their region, country, or economy’s borders through collaboration (coauthoring articles) and citation (referencing articles from other regions, countries, or economies). Measured at the region, country, or economy level, international collaboration and citation are strongly influenced by the size and the policies of the region, country, or economy. For example, some regions, countries, or economies provide preferential funding for cross-national research within a region through programs such as the European Commission’s Horizon Europe (European Commission 2021).
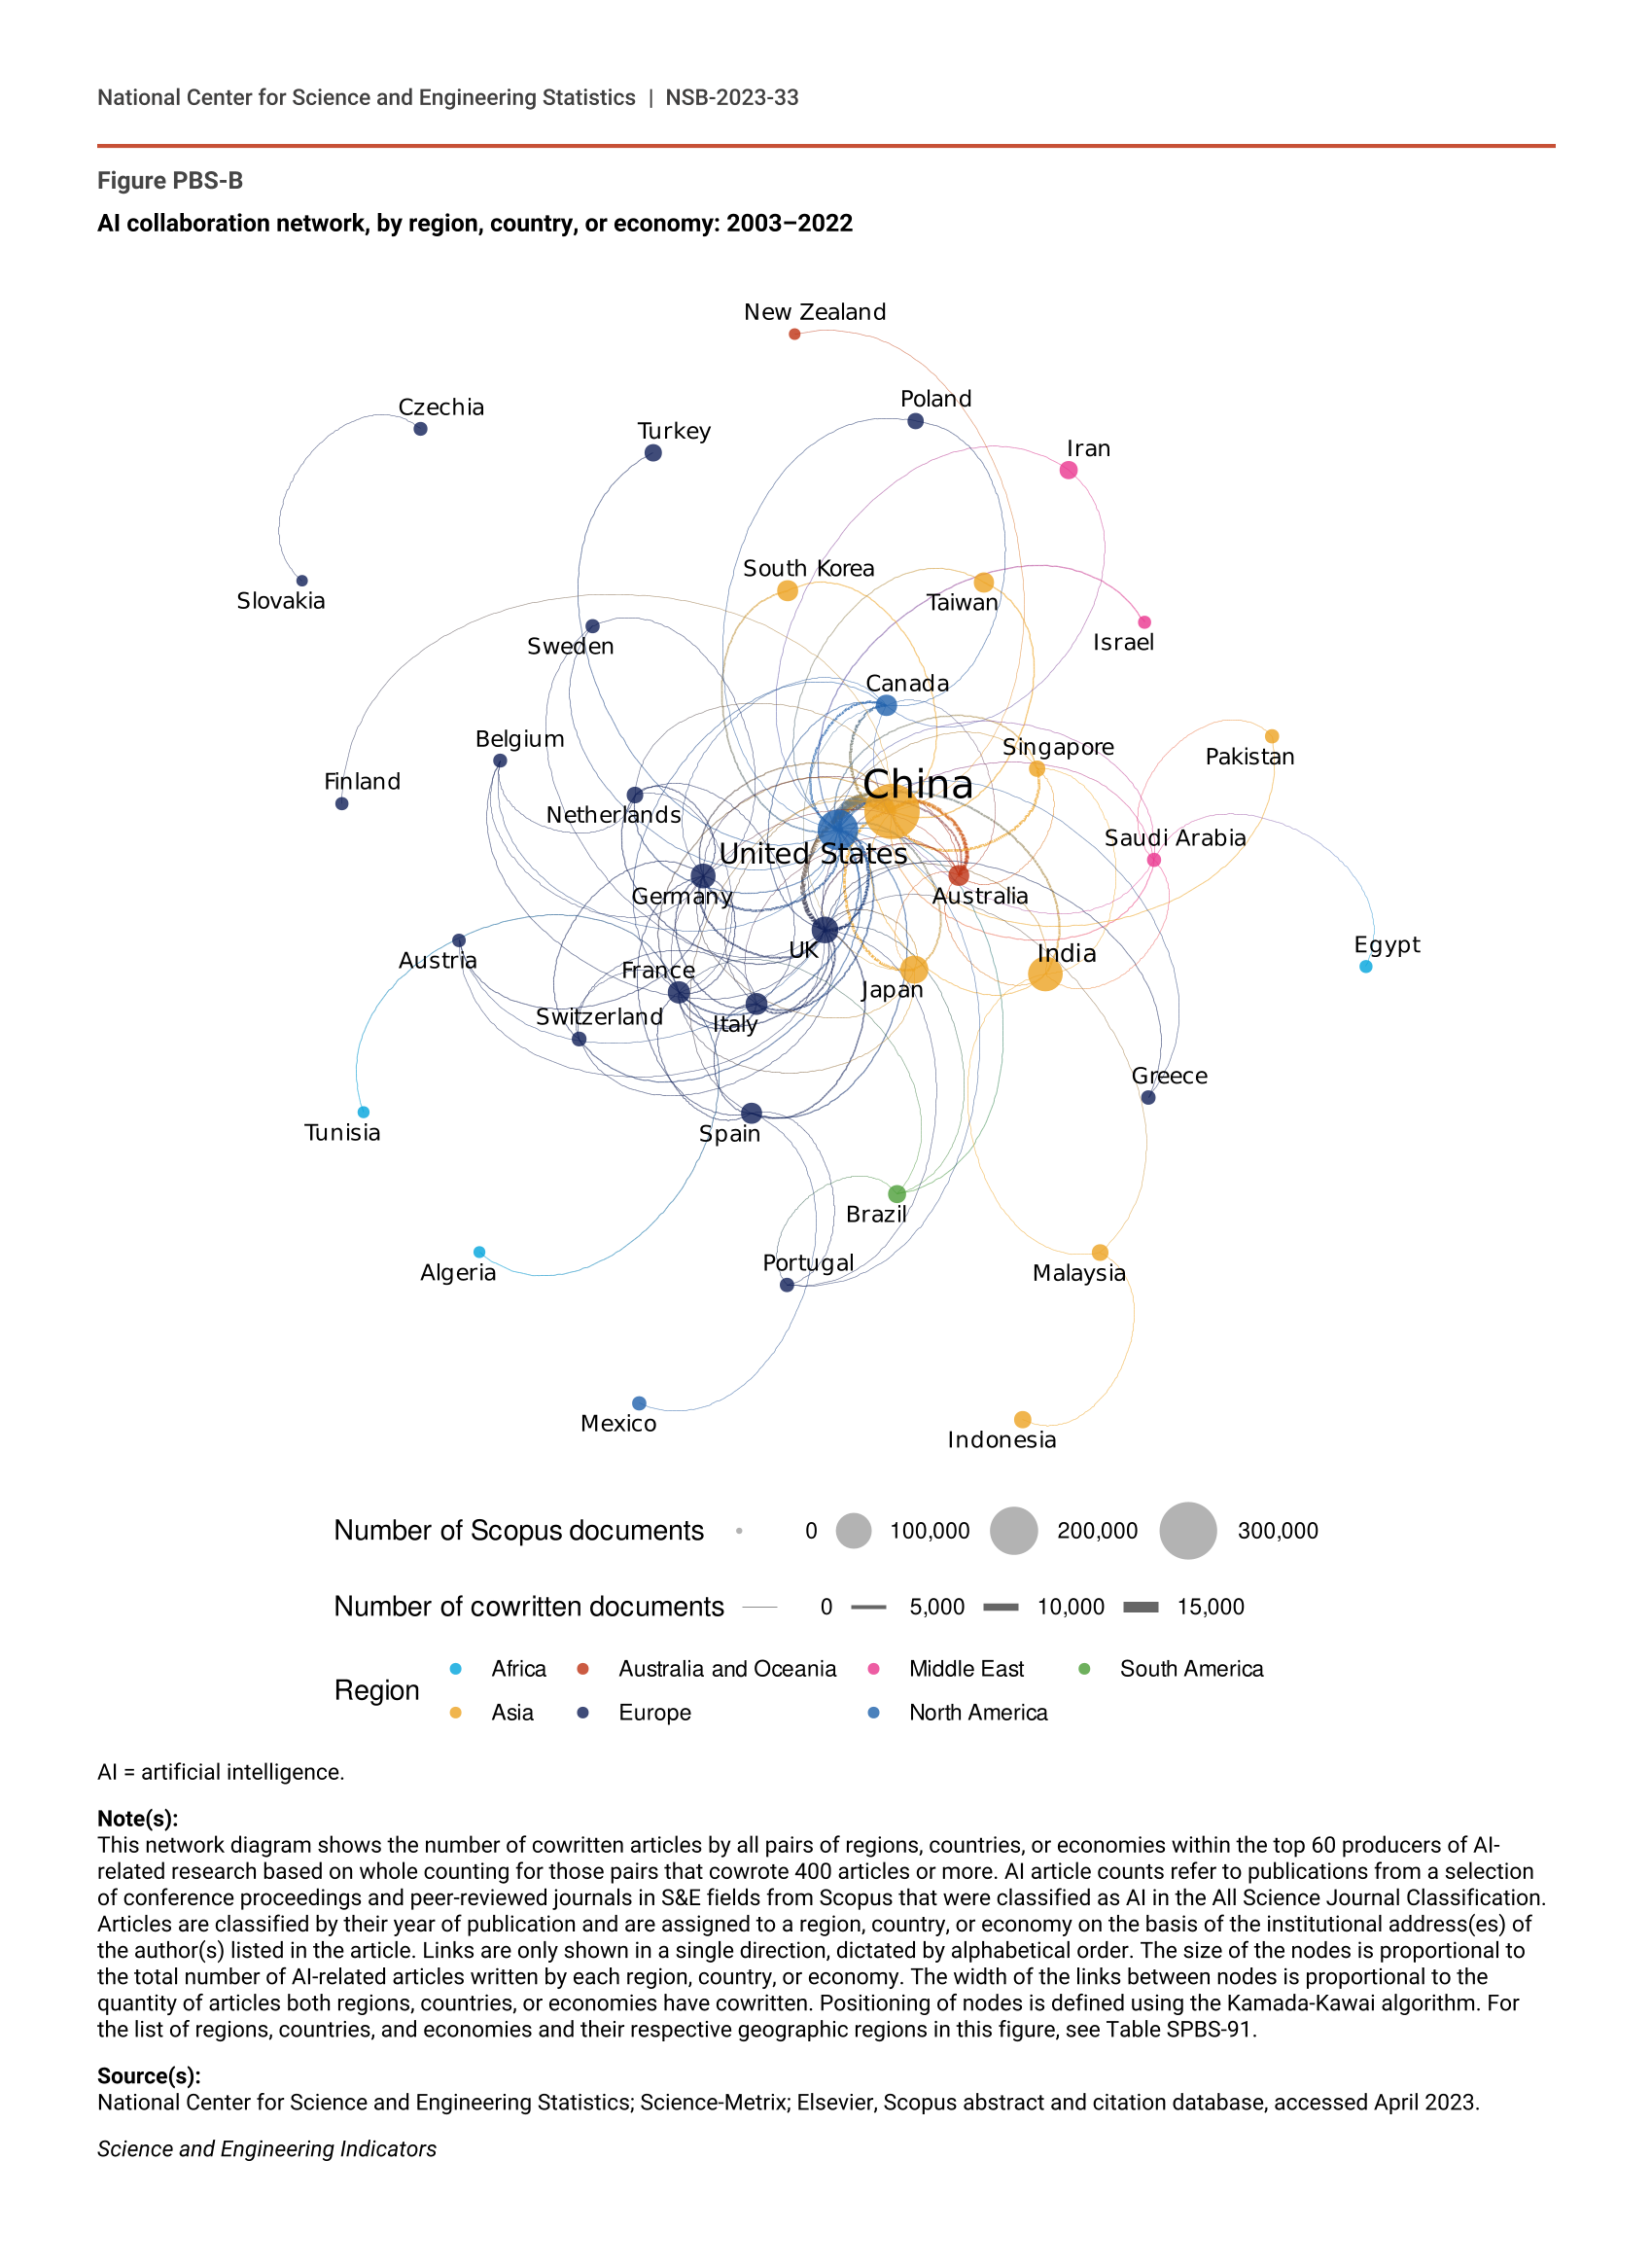
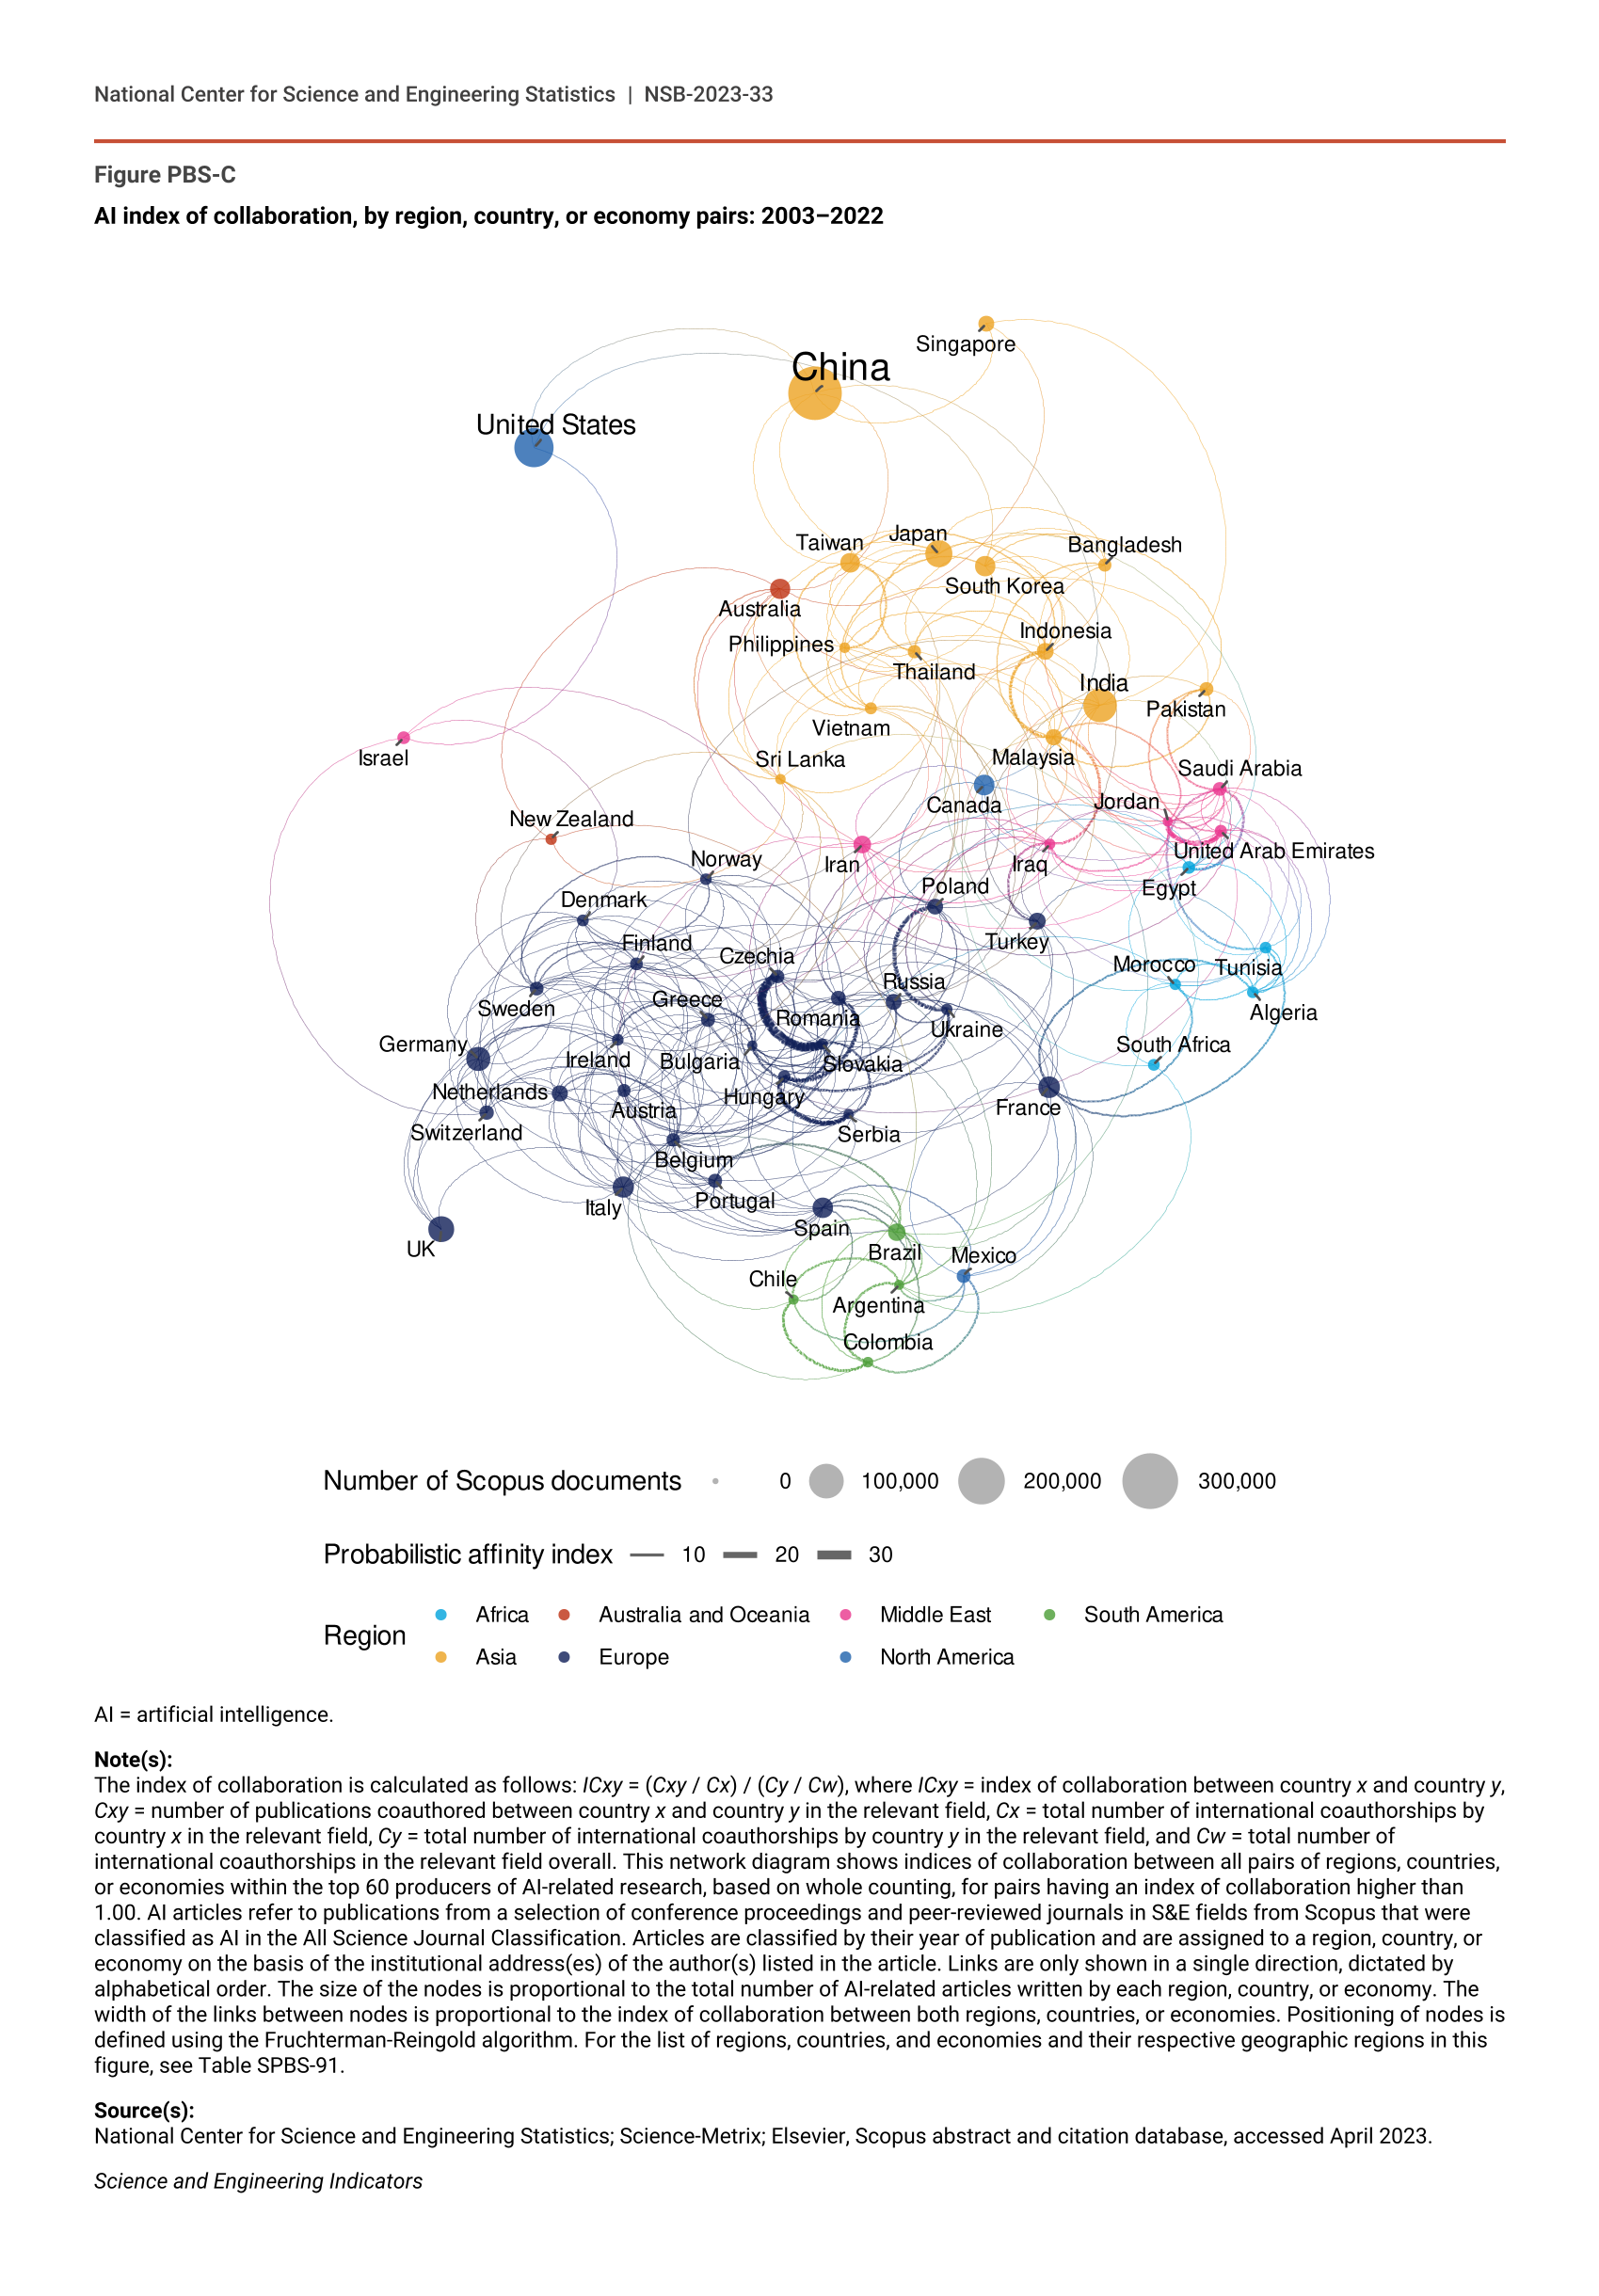
This section of the report examines trends in collaborations between researchers—as measured by coauthorships and citations—particularly among those involving international connections. In the sidebar Artificial Intelligence Publication Output and International Collaboration, this section also explores international collaboration in greater depth in the field of artificial intelligence using network analysis.
Researchers may collaborate for several reasons, including to develop a scientific relationship with another researcher or to gain access to costly or shared equipment. They may also work together to meet conditions attached to research funding that require international collaboration (Wagner 2018).
In general, national governments encourage international collaboration to achieve outcomes that exceed what they could achieve individually (although they may perceive risks in collaborating with regions, countries, or economies they regard as a potential threat). These positive outcomes include training a robust S&E workforce, partnering with researchers from developing countries, advancing domestic science excellence, increasing the impact of discoveries through better distribution of knowledge, strengthening scientific and diplomatic relations, and enhancing a sense of shared responsibility for future action (Lyons et al. 2016). Also, international collaborations increase the impact of research, as measured by citations (Chinchilla-Rodríguez, Sugimoto, and Larivière 2019; Narin, Stevens, and Whitlow 1991; Sugimoto et al. 2017). Domestic collaboration among researchers in the academic, government, and industry sectors also results in articles that receive higher citation rates when compared with articles from a single author or authors from only one sector (see the section Business Collaborations in Published Literature in Indicators 2022 report “Invention, Knowledge Transfer, and Innovation”).
International Collaboration Patterns
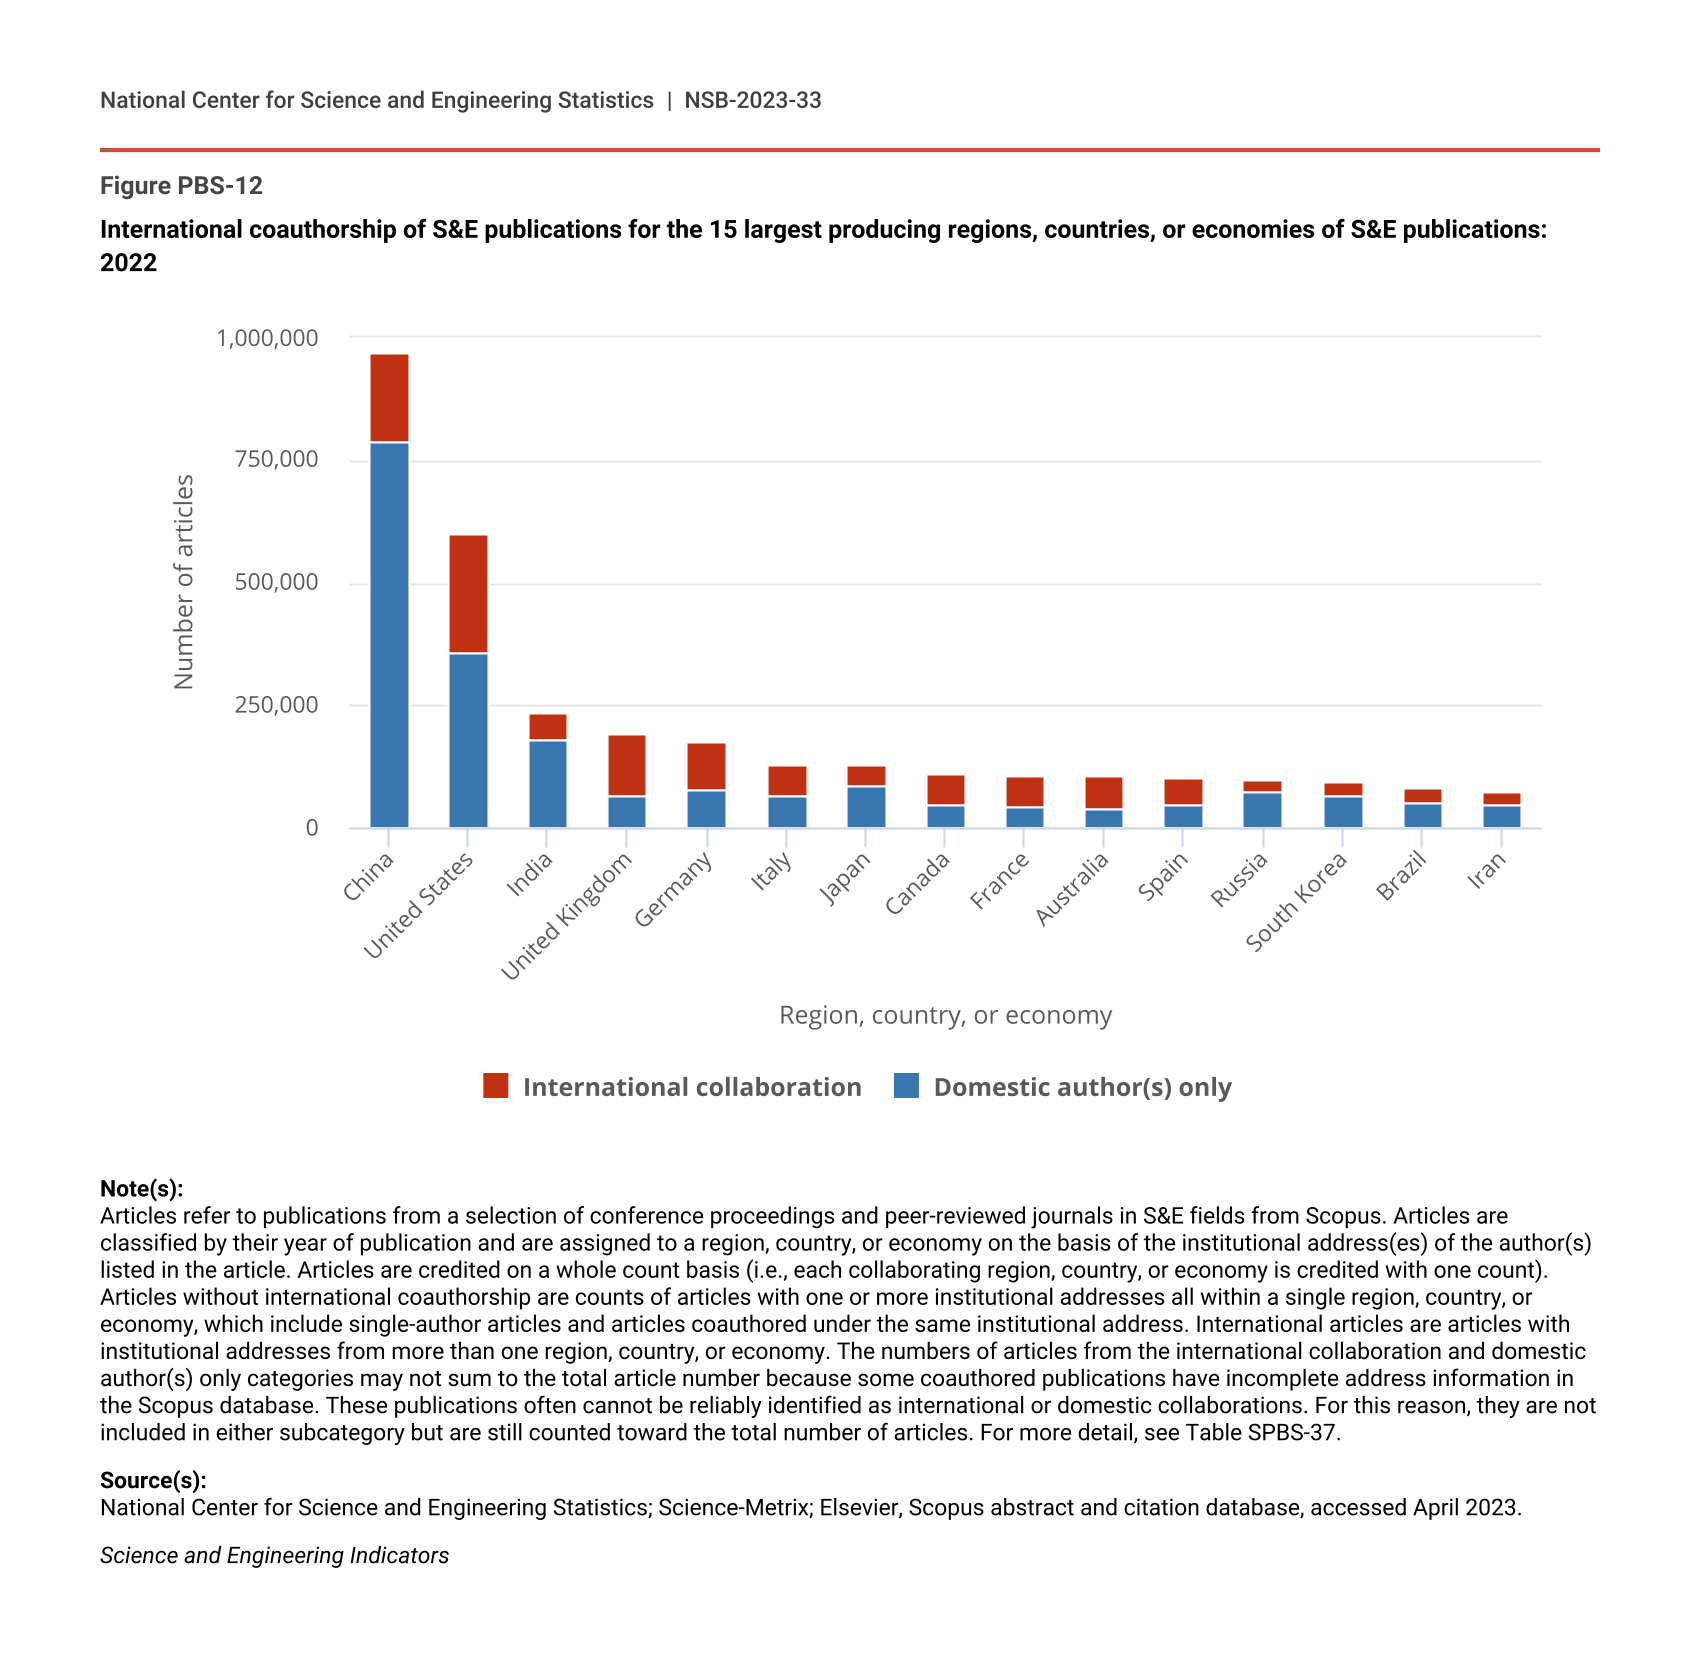
An article is classified as an international collaboration if at least two author organizations are located in different regions, countries, or economies, as determined by their addresses on the article. In 2022, the United States contributed to the largest number of articles involving international coauthorship (241,823 articles, representing 32% of all internationally coauthored articles) (Table SPBS-33). The most frequent coauthorship partners for the United States were China, the United Kingdom, Canada, and Germany (Table SPBS-35).
In 2022, the global rate of international collaboration was 23%, but these rates varied by region, country, or economy. Researchers in the United States collaborated with international partners on 40% of their articles in 2022 (Table SPBS-33). Of the top 15 largest producers, the regions, countries, or economies that had higher international collaboration rates than the United States included the United Kingdom (67%), Australia (63%), France (60%), and Canada (60%). Conversely, regions, countries, or economies with rates of international collaboration lower than the U.S. rate included China (19%), India (24%), and Russia (25%) (Figure PBS-12). Beyond the 15 largest producers of publications, the 2022 international collaboration rates varied—Saudi Arabia (80%), Switzerland (74%), and Belgium (73%) had higher collaboration rates than the United States, whereas Turkey (29%) and Brazil (38%) had lower collaboration rates, albeit still higher than those of China, India, and Russia (Table SPBS-33).
International coauthorship of S&E publications for the 15 largest producing regions, countries, or economies of S&E publications: 2022
| Region, country, or economy | Domestic author(s) only | International collaboration |
|---|---|---|
| China | 789,084 | 182,305 |
| United States | 358,011 | 241,823 |
| India | 178,750 | 57,227 |
| United Kingdom | 62,783 | 127,771 |
| Germany | 76,940 | 98,072 |
| Italy | 63,424 | 65,078 |
| Japan | 87,053 | 41,128 |
| Canada | 45,421 | 67,144 |
| France | 42,253 | 65,140 |
| Australia | 38,831 | 66,095 |
| Spain | 46,513 | 53,721 |
| Russia | 74,020 | 24,260 |
| South Korea | 63,762 | 31,523 |
| Brazil | 51,667 | 31,235 |
| Iran | 47,164 | 25,379 |
Note(s):
Articles refer to publications from a selection of conference proceedings and peer-reviewed journals in S&E fields from Scopus. Articles are classified by their year of publication and are assigned to a region, country, or economy on the basis of the institutional address(es) of the author(s) listed in the article. Articles are credited on a whole count basis (i.e., each collaborating region, country, or economy is credited with one count). Articles without international coauthorship are counts of articles with one or more institutional addresses all within a single region, country, or economy, which include single-author articles and articles coauthored under the same institutional address. International articles are articles with institutional addresses from more than one region, country, or economy. The numbers of articles from the international collaboration and domestic author(s) only categories may not sum to the total article number because some coauthored publications have incomplete address information in the Scopus database. These publications often cannot be reliably identified as international or domestic collaborations. For this reason, they are not included in either subcategory but are still counted toward the total number of articles. For more detail, see Table SPBS-37.
Source(s):
National Center for Science and Engineering Statistics; Science-Metrix; Elsevier, Scopus abstract and citation database, accessed April 2023.
Science and Engineering Indicators
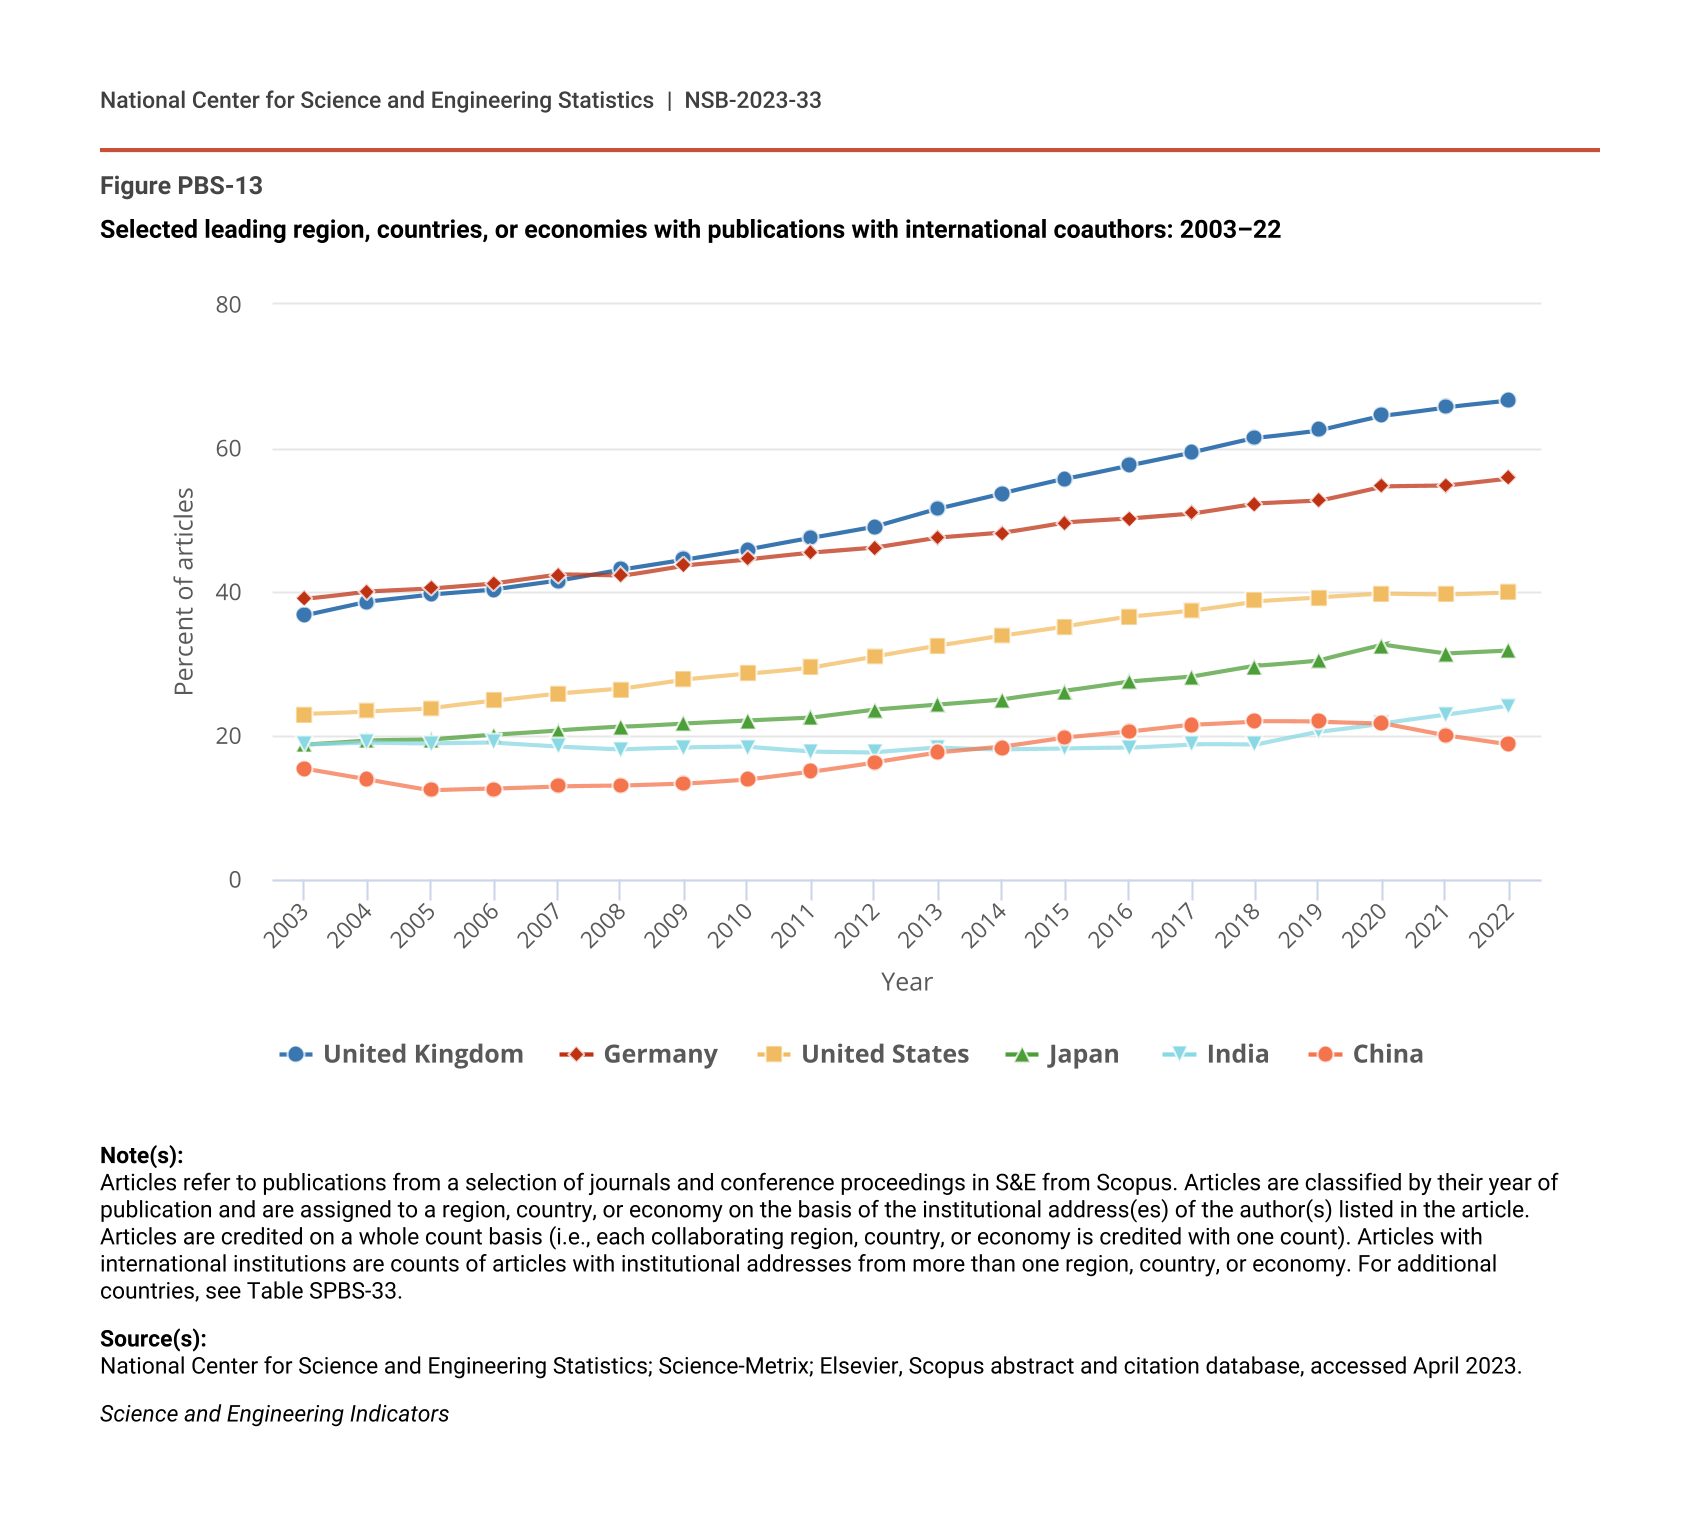
The percentage of worldwide S&E articles produced with international collaboration has grown over time, increasing from 19% in 2012 to 23% in 2022 (Table SPBS-33). Each region, country, or economy leading in publications showed increases in international collaboration rates (Figure PBS-13). United Kingdom researchers had international coauthors on 37% of their articles in 2003, a percentage that had increased to 67% by 2022. Similarly, Germany’s international collaboration rate increased from 39% to 56% over the same period. The United States and Japan both saw notable increases in international collaborations between 2003 and 2022 (from 23% to 40% and from 19% to 32%, respectively), whereas there was less change in the rates for China (from 15% to 19%) and India (from 19% to 24%).
Selected leading region, countries, or economies with publications with international coauthors: 2003–22
| Year | United Kingdom | Germany | United States | Japan | India | China |
|---|---|---|---|---|---|---|
| 2003 | 36.7 | 39.0 | 23.0 | 18.7 | 18.7 | 15.4 |
| 2004 | 38.6 | 40.1 | 23.4 | 19.3 | 19.0 | 13.9 |
| 2005 | 39.6 | 40.5 | 23.8 | 19.4 | 18.9 | 12.4 |
| 2006 | 40.3 | 41.2 | 24.8 | 20.1 | 19.0 | 12.6 |
| 2007 | 41.5 | 42.4 | 25.8 | 20.7 | 18.5 | 12.9 |
| 2008 | 43.1 | 42.2 | 26.5 | 21.2 | 18.1 | 13.0 |
| 2009 | 44.5 | 43.7 | 27.8 | 21.7 | 18.3 | 13.3 |
| 2010 | 45.9 | 44.5 | 28.6 | 22.1 | 18.4 | 13.9 |
| 2011 | 47.5 | 45.4 | 29.5 | 22.5 | 17.8 | 15.0 |
| 2012 | 49.1 | 46.1 | 31.0 | 23.6 | 17.7 | 16.3 |
| 2013 | 51.6 | 47.5 | 32.5 | 24.3 | 18.3 | 17.6 |
| 2014 | 53.7 | 48.2 | 33.9 | 25.0 | 18.1 | 18.4 |
| 2015 | 55.7 | 49.7 | 35.2 | 26.2 | 18.2 | 19.7 |
| 2016 | 57.6 | 50.2 | 36.5 | 27.5 | 18.3 | 20.5 |
| 2017 | 59.4 | 50.9 | 37.4 | 28.2 | 18.8 | 21.5 |
| 2018 | 61.4 | 52.3 | 38.7 | 29.7 | 18.7 | 22.0 |
| 2019 | 62.5 | 52.7 | 39.2 | 30.5 | 20.5 | 21.9 |
| 2020 | 64.5 | 54.7 | 39.7 | 32.6 | 21.7 | 21.7 |
| 2021 | 65.7 | 54.8 | 39.6 | 31.4 | 22.9 | 20.0 |
| 2022 | 66.6 | 55.8 | 39.9 | 31.8 | 24.2 | 18.7 |
Note(s):
Articles refer to publications from a selection of journals and conference proceedings in S&E from Scopus. Articles are classified by their year of publication and are assigned to a region, country, or economy on the basis of the institutional address(es) of the author(s) listed in the article. Articles are credited on a whole count basis (i.e., each collaborating region, country, or economy is credited with one count). Articles with international institutions are counts of articles with institutional addresses from more than one region, country, or economy. For additional countries, see Table SPBS-33.
Source(s):
National Center for Science and Engineering Statistics; Science-Metrix; Elsevier, Scopus abstract and citation database, accessed April 2023.
Science and Engineering Indicators
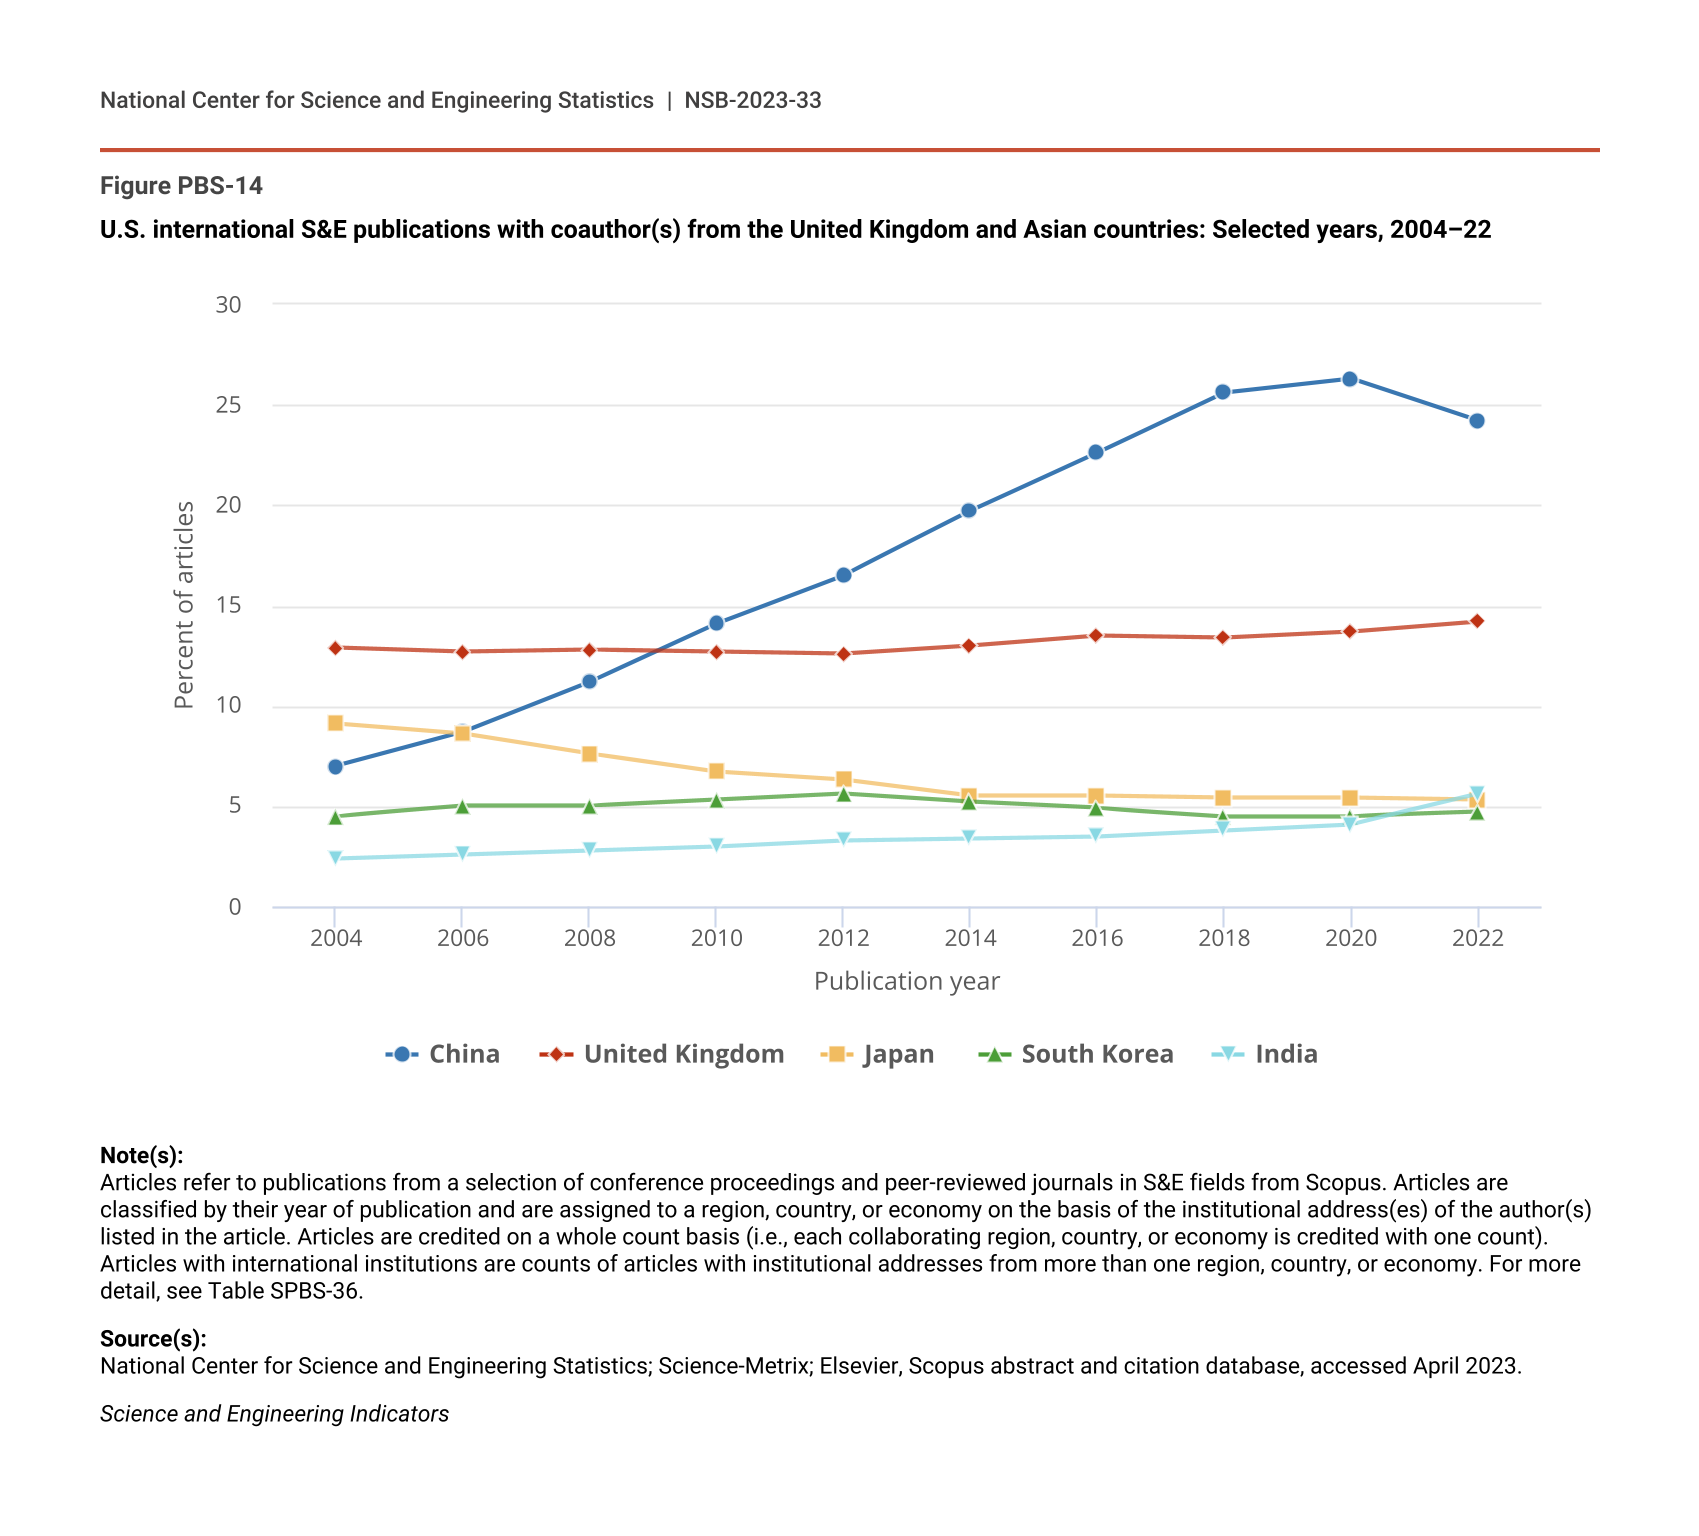
Over time, the top collaborators of the United States have changed. In 2004, the United Kingdom accounted for 13% of articles that the United States coauthored internationally—the highest percentage of any partner region, country, or economy (Figure PBS-14). By 2022, China had become the largest collaborator with the United States, with 24% of internationally coauthored U.S. articles having a Chinese coauthor, although this represents a slight decline from 26% in 2020. Meanwhile, the percentage of U.S. internationally coauthored articles with the United Kingdom increased slightly over this period to 14% in 2022.
U.S. international S&E publications with coauthor(s) from the United Kingdom and Asian countries: Selected years, 2004–22
| Publication year | China | United Kingdom | Japan | South Korea | India |
|---|---|---|---|---|---|
| 2004 | 7.0 | 12.9 | 9.1 | 4.5 | 2.4 |
| 2006 | 8.7 | 12.7 | 8.6 | 5.0 | 2.6 |
| 2008 | 11.2 | 12.8 | 7.6 | 5.0 | 2.8 |
| 2010 | 14.1 | 12.7 | 6.7 | 5.3 | 3.0 |
| 2012 | 16.5 | 12.6 | 6.3 | 5.6 | 3.3 |
| 2014 | 19.7 | 13.0 | 5.5 | 5.2 | 3.4 |
| 2016 | 22.6 | 13.5 | 5.5 | 4.9 | 3.5 |
| 2018 | 25.6 | 13.4 | 5.4 | 4.5 | 3.8 |
| 2020 | 26.3 | 13.7 | 5.4 | 4.5 | 4.1 |
| 2022 | 24.2 | 14.2 | 5.3 | 4.7 | 5.6 |
Note(s):
Articles refer to publications from a selection of conference proceedings and peer-reviewed journals in S&E fields from Scopus. Articles are classified by their year of publication and are assigned to a region, country, or economy on the basis of the institutional address(es) of the author(s) listed in the article. Articles are credited on a whole count basis (i.e., each collaborating region, country, or economy is credited with one count). Articles with international institutions are counts of articles with institutional addresses from more than one region, country, or economy. For more detail, see Table SPBS-36.
Source(s):
National Center for Science and Engineering Statistics; Science-Metrix; Elsevier, Scopus abstract and citation database, accessed April 2023.
Science and Engineering Indicators
The U.S.-China collaboration on publications has benefited not only both countries but also global science through the amount of published research collaborations, funding agency support from the United States and China, and roles of collaborators on publications (Lee and Haupt 2020). The rapid growth in U.S.-China collaborations coincided with China’s growing scientific and technological capabilities, such as rising R&D spending and university degree awards (see Indicators 2022 report “Higher Education in Science and Engineering”)—both of which may be contributing factors to the U.S.-China collaboration pattern.
Rates of U.S. collaboration with other Asian regions, countries, or economies have also changed over time. From 2004 to 2022, the percentage of U.S. internationally coauthored articles with Japan decreased (from 9.1% to 5.3%), whereas the share coauthored with India increased (from 2.4% to 5.6%). The share of U.S. international collaborations involving South Korea grew between 2004 and 2012 (from 4.5% to 5.6%), then declined through 2022 (from 5.6% to 4.7%) as South Korea increased its partnerships with other Asian regions, countries, or economies (Figure PBS-14; Table SPBS-35). Meanwhile, there was little change from 2003 to 2022 in the U.S. coauthorship percentages with Canada (12% in 2022) and with European regions, countries, or economies such as the United Kingdom (14% in 2022) and Germany (11% in 2022) (Table SPBS-35).
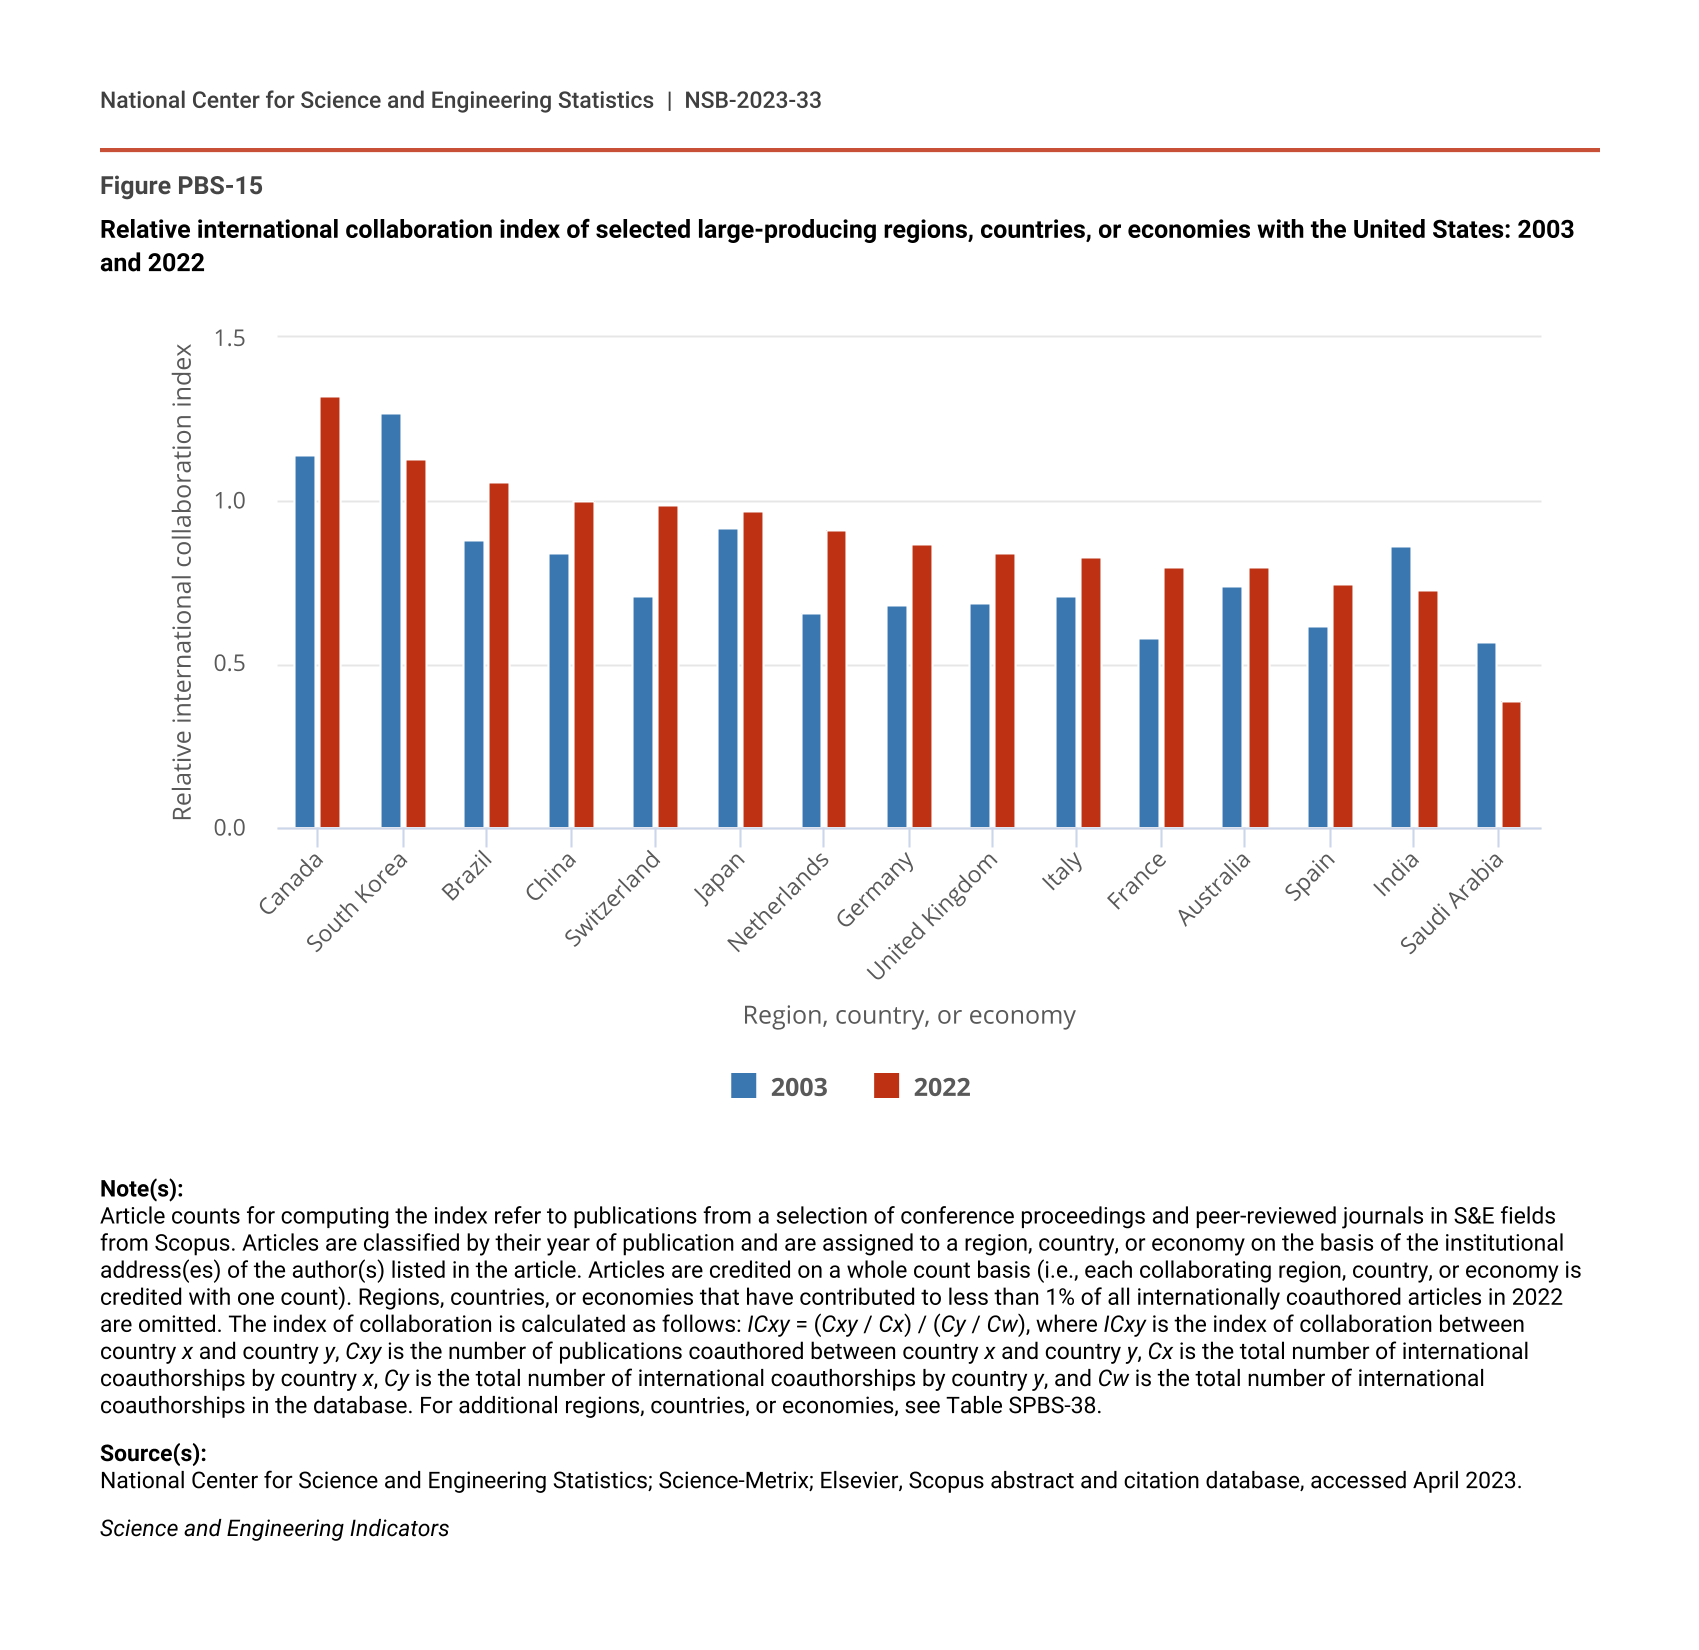
Normalizing international collaborations by a region, country, or economy’s publication output enables comparison independent of its size. For example, the international collaboration index (ICI), adapted from He (2009), is obtained by dividing a region’s, country’s, or economy’s share of collaboration with a partner by the partner’s overall share of international collaborations with all regions, countries, or economies. An ICI value of 1.0 shows that the level of coauthorship between two regions, countries, or economies is proportional to the partners’ overall rates of international coauthorship. ICI values above 1.0 indicate more extensive ties between two regions, countries, or economies, whereas values below 1.0 indicate weaker ties. In 2022, the United States had ICI values above 1.0 with Canada (1.3), South Korea (1.1), and Brazil (1.1). ICI values between the United States and most other major research-producing regions, countries, or economies increased between 2003 and 2022, except for South Korea (from 1.3 to 1.1), India (from 0.9 to 0.7), and Saudi Arabia (from 0.6 to 0.4) (Figure PBS-15).
Relative international collaboration index of selected large-producing regions, countries, or economies with the United States: 2003 and 2022
| Region, country, or economy | 2003 | 2022 |
|---|---|---|
| Canada | 1.14 | 1.32 |
| South Korea | 1.27 | 1.13 |
| Brazil | 0.88 | 1.06 |
| China | 0.84 | 1.00 |
| Switzerland | 0.71 | 0.99 |
| Japan | 0.92 | 0.97 |
| Netherlands | 0.66 | 0.91 |
| Germany | 0.68 | 0.87 |
| United Kingdom | 0.69 | 0.84 |
| Italy | 0.71 | 0.83 |
| France | 0.58 | 0.80 |
| Australia | 0.74 | 0.80 |
| Spain | 0.62 | 0.75 |
| India | 0.86 | 0.73 |
| Saudi Arabia | 0.57 | 0.39 |
Note(s):
Article counts for computing the index refer to publications from a selection of conference proceedings and peer-reviewed journals in S&E fields from Scopus. Articles are classified by their year of publication and are assigned to a region, country, or economy on the basis of the institutional address(es) of the author(s) listed in the article. Articles are credited on a whole count basis (i.e., each collaborating region, country, or economy is credited with one count). Regions, countries, or economies that have contributed to less than 1% of all internationally coauthored articles in 2022 are omitted. The index of collaboration is calculated as follows: ICxy = (Cxy / Cx) / (Cy / Cw), where ICxy is the index of collaboration between country x and country y, Cxy is the number of publications coauthored between country x and country y, Cx is the total number of international coauthorships by country x, Cy is the total number of international coauthorships by country y, and Cw is the total number of international coauthorships in the database. For additional regions, countries, or economies, see Table SPBS-38.
Source(s):
National Center for Science and Engineering Statistics; Science-Metrix; Elsevier, Scopus abstract and citation database, accessed April 2023.
Science and Engineering Indicators
International Citation Patterns
Another indicator of international collaboration is cross-national citations, which are citations to a region, country, or economy’s publications that come from publications authored outside that region, country, or economy. This section outlines an international citation measure called the relative citation index (RCI). The RCI is computed by dividing the share of the citing region’s, country’s, or economy’s outgoing citations going to the cited region, country, or economy, then dividing this number by the share of publications attributed to the cited region, country, or economy. The measure is normalized by the publication output of each region, country, or economy. Otherwise, regions, countries, or economies such as the United States, the United Kingdom, Germany, and China would be favored, simply because they produce so many articles and are therefore more likely to attract citations. Findings based on the RCI provide additional evidence of the globalization of S&E research.
An RCI value above 1.00 shows that the citation rate between two regions, countries, or economies is higher than the baseline (and a value below 1.00 shows a citation rate lower than the baseline), taking into account their relative publication outputs. U.S. authors tended to cite English-speaking regions, countries, or economies disproportionately, with RCI values above 1.00 for the United Kingdom (1.37), Canada (1.29), and Australia (1.07) (Table PBS-2). This finding may also be a function of the many scientific journals being published in English (Di Bitetti and Ferreras 2016). Some other notable European countries with high research activity had moderate RCI values based on citations from the United States, such as Germany (0.96), France (0.93), and Italy (0.87). U.S. authors cite China (0.48), Iran (0.32), and India (0.25) less frequently than the baseline, given the number of articles produced by those countries.
Relative citation index for 15 largest producing regions, countries, or economies: 2020
Note(s):
Citations refer to publications from a selection of journals, books, and conference proceedings in S&E from Scopus. Articles are classified by their year of publication and are assigned to a region, country, or economy on the basis of the institutional address(es) listed in the article. Articles are credited on a fractional count basis (i.e., for articles with collaborating institutions from multiple regions, countries, or economies, each region, country, or economy receives fractional credit on the basis of the proportion of its participating institutions). Citation counts are based on all citations made to articles in their publication year and in the following 2 years (i.e., 3-year citation window; scores in 2020 are based on citations to articles published in 2020 that were made in articles published in 2020–22). The relative citation index (RCI) normalizes cross-national citation data for variations in relative size of publication output. RCI is computed by dividing the share of the citing region, country, or economy's outgoing citations attributed to the cited region, country, or economy, then dividing that amount by the share of publications attributed to the cited region, country, or economy. An RCI of 1.00 means that the citing region, country, or economy cites publications from the cited region, country, or economy as much as would be expected to happen randomly, showing no particular affinity between the regions, countries, or economies. Scores higher than 1.00 mean that the citing region, country, or economy has a higher-than-expected tendency to cite the cited region, country, or economy’s S&E literature. For more detail, see Table SPBS-39. Cells in which the region, country, or economy collaborates at or above the world average for that year are shaded green.
Source(s):
National Center for Science and Engineering Statistics; Science-Metrix; Elsevier, Scopus abstract and citation database, accessed April 2023.
Science and Engineering Indicators
The RCI also provides a view into the international nature of the scientific research in each region, country, or economy by determining the number of other regions, countries, or economies from which the region, country, or economy draws its research (i.e., citations). For example, authors from China predominantly cited articles from China (2.43) and cite articles from only South Korea and Australia (among the leading publication producers) near the baseline rate (Table PBS-2). Iran (11.93) and Russia (10.15) tended to cite their own publications extensively. Conversely, France frequently cited research from numerous other regions, countries, or economies, such as the United Kingdom (1.63), Italy (1.47), Germany (1.37), and the United States (1.26). Many other European regions, countries, or economies displayed a similar pattern of extensive cross-national citations.
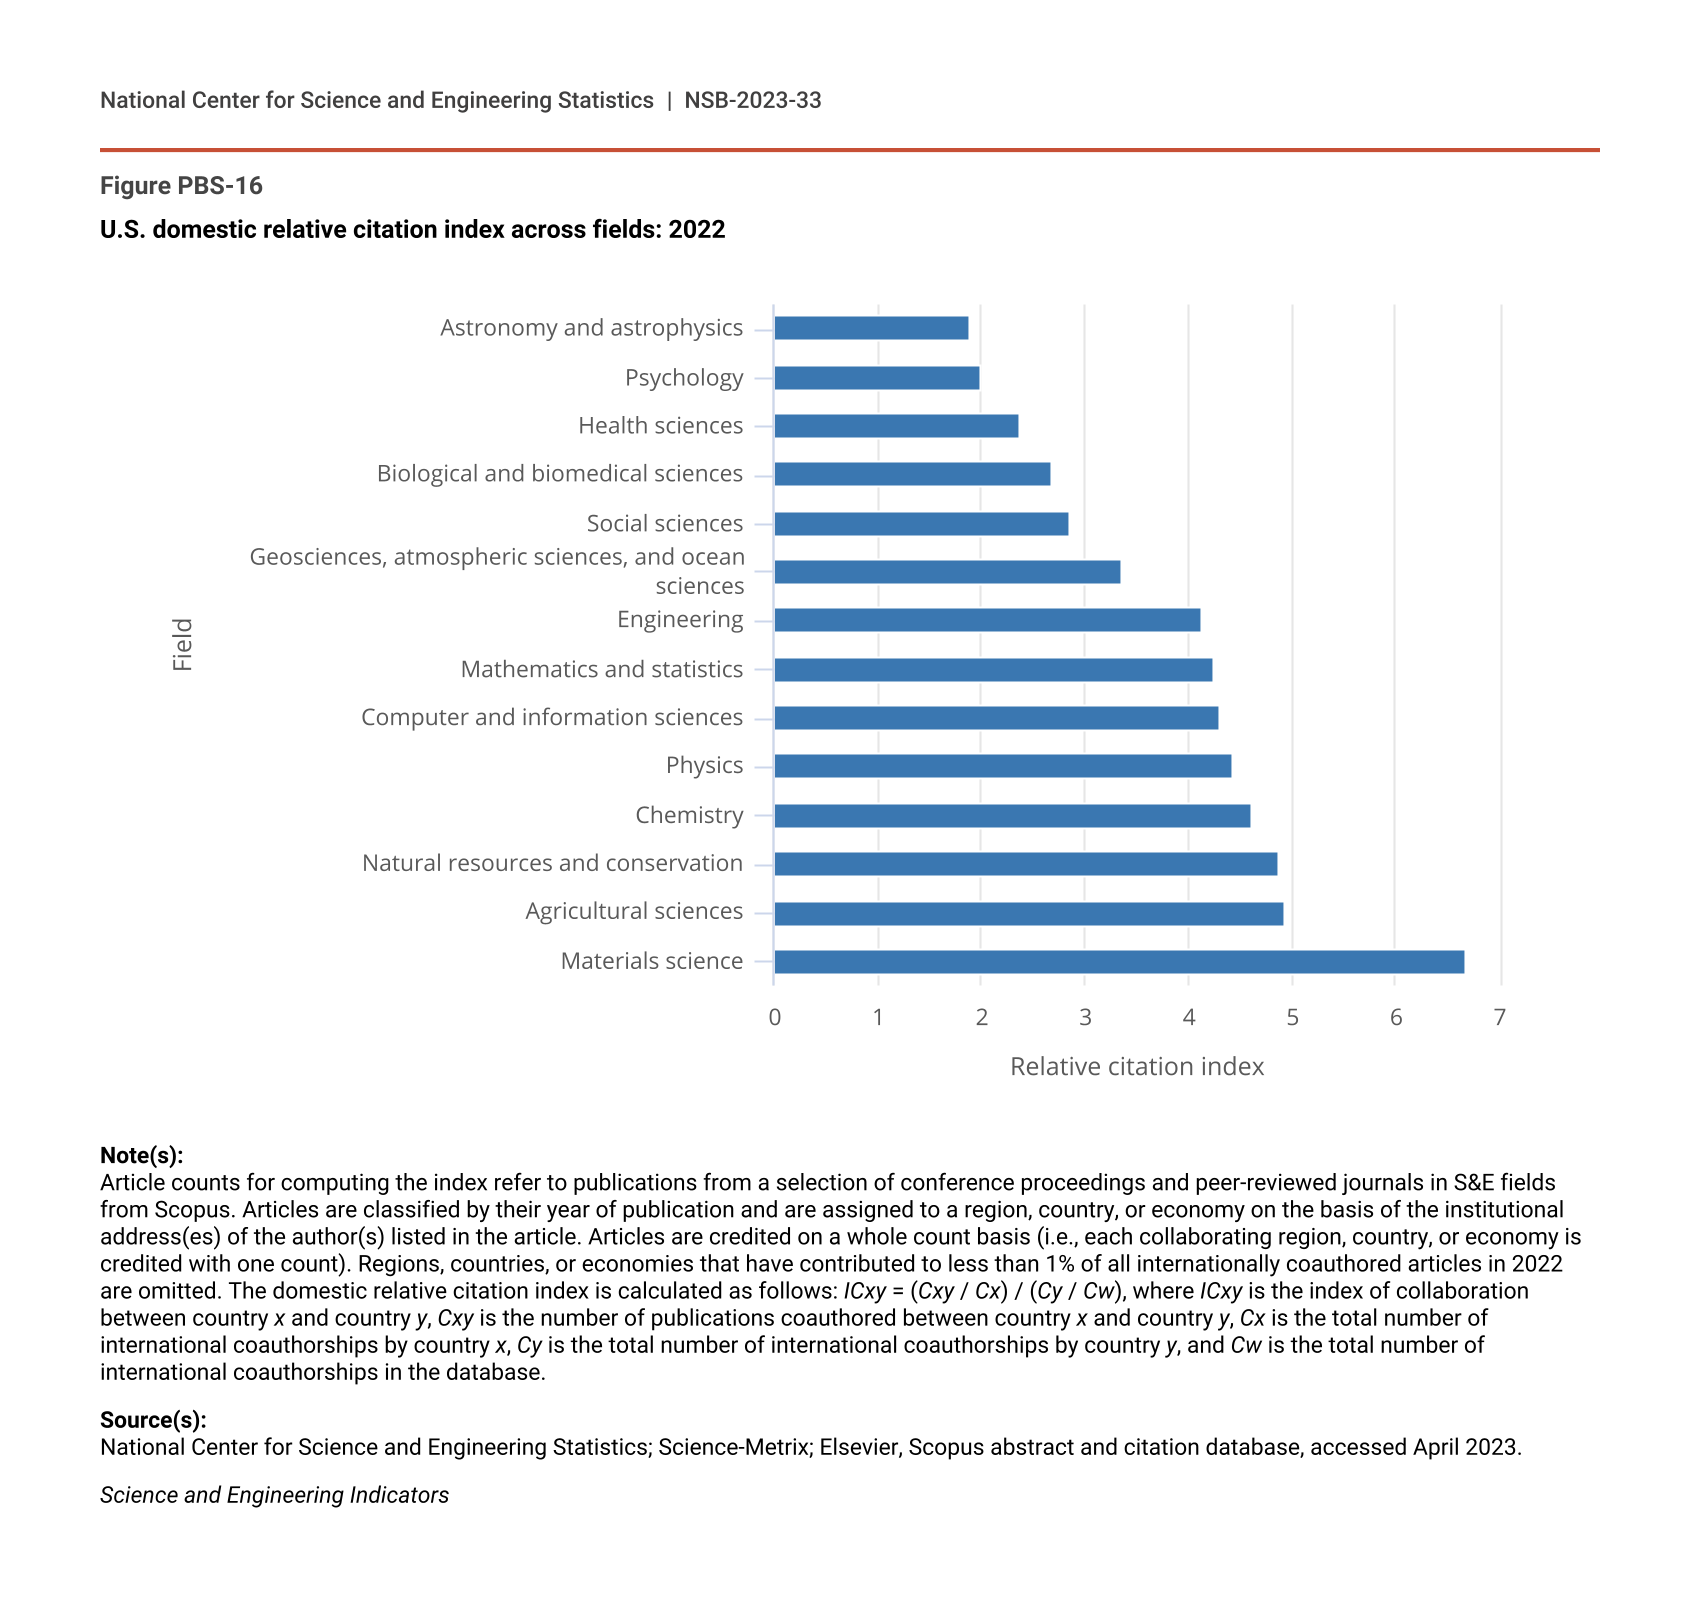
RCI results at the scientific field level provide insights into the extent to which regions, countries, or economies build on their own research within a given field rather than on research gleaned from elsewhere (Table SPBS-40 through Table SPBS-53). These results are thus a proxy measure for the degree to which researchers in a given field are insular or international in their citation behavior. For example, in 2022, the United States had an overall domestic RCI of 3.24 (Table PBS-2). This means that U.S. articles had more than three times as many citations to earlier U.S. publications than the baseline, given the number of these earlier U.S. publications. In materials science, the United States had a domestic RCI of 6.68 in 2022 (Figure PBS-16), which means that there are more than six times as many citations to U.S. articles as the baseline. This suggests that U.S. materials science researchers built particularly extensively on earlier U.S. research. The same holds true in agricultural sciences (4.92), natural resources and conservation (4.86), and chemistry (4.60). Meanwhile, the United States had a lower domestic RCI in astronomy and astrophysics (1.89), psychology (2.00), and health sciences (2.37), suggesting that U.S. researchers in these fields had a relatively stronger connection to international research. That said, these RCIs remain above 1.00 because researchers tend to cite domestic publications disproportionately.
U.S. domestic relative citation index across fields: 2022
| Field | Index |
|---|---|
| Astronomy and astrophysics | 1.89 |
| Psychology | 2.00 |
| Health sciences | 2.37 |
| Biological and biomedical sciences | 2.68 |
| Social sciences | 2.86 |
| Geosciences, atmospheric sciences, and ocean sciences | 3.36 |
| Engineering | 4.13 |
| Mathematics and statistics | 4.24 |
| Computer and information sciences | 4.31 |
| Physics | 4.43 |
| Chemistry | 4.60 |
| Natural resources and conservation | 4.86 |
| Agricultural sciences | 4.92 |
| Materials science | 6.68 |
Note(s):
Article counts for computing the index refer to publications from a selection of conference proceedings and peer-reviewed journals in S&E fields from Scopus. Articles are classified by their year of publication and are assigned to a region, country, or economy on the basis of the institutional address(es) of the author(s) listed in the article. Articles are credited on a whole count basis (i.e., each collaborating region, country, or economy is credited with one count). Regions, countries, or economies that have contributed to less than 1% of all internationally coauthored articles in 2022 are omitted. The domestic relative citation index is calculated as follows: ICxy = (Cxy / Cx) / (Cy / Cw), where ICxy is the index of collaboration between country x and country y, Cxy is the number of publications coauthored between country x and country y, Cx is the total number of international coauthorships by country x, Cy is the total number of international coauthorships by country y, and Cw is the total number of international coauthorships in the database.
Source(s):
National Center for Science and Engineering Statistics; Science-Metrix; Elsevier, Scopus abstract and citation database, accessed April 2023.
Science and Engineering Indicators
To conclude this section, the findings from the analysis of international collaborations and citations reveal that regions, countries, or economies had wide variations in their propensity to collaborate with international partners, although all major regions, countries, or economies increased their collaboration rate over time. Researchers in the United States collaborated increasingly with Asian partners—most notably from China. Meanwhile, international citation patterns reveal that the United States disproportionately cited publications from established research communities, including its own, with its international connections varying widely across scientific fields.