 An official website of the United States government
 Publication Output by Region, Country, or Economy and by Scientific Field
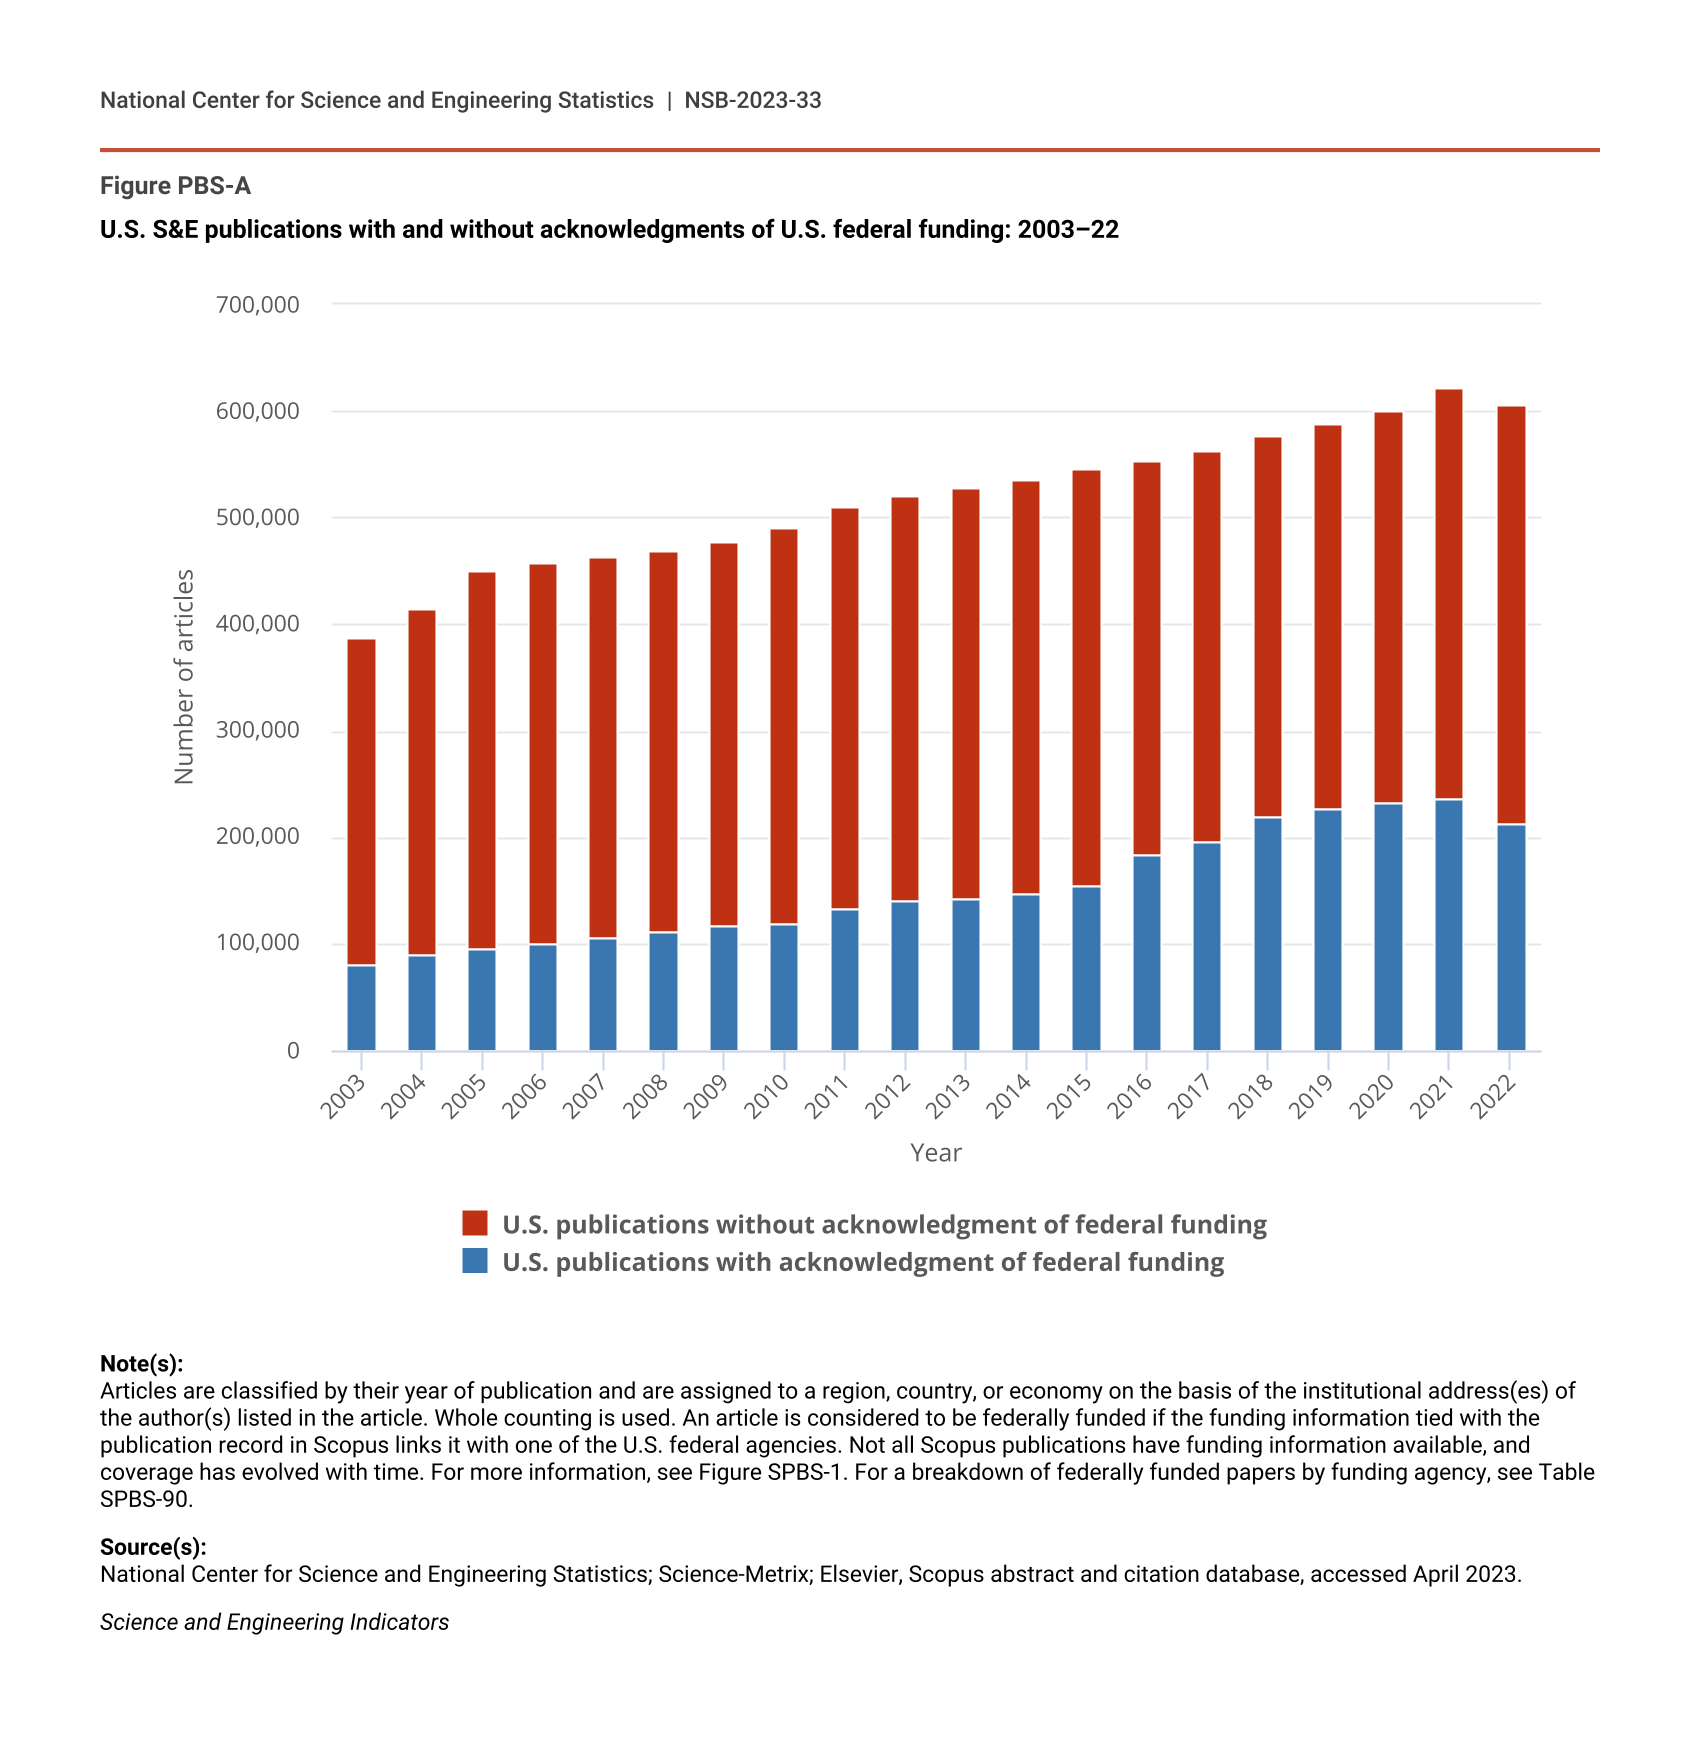
This section of the report outlines trends over time in publication output across regions, countries, or economies and by fields of science. This section also provides insights into the research contributions of different regions, countries, or economies and how the focus of their scientific publications has changed over time. In addition, the section highlights variations in the distribution of publications across scientific fields for different regions, countries, or economies and examines trends over time in closed-access and open-access (OA) publications. This section also summarizes federal funding acknowledgments as a source of data to shed light on published research that received federal funding. (See sidebar Using Funding Acknowledgments to Track Federally Funded Research Over Time.)
Output by Region, Country, or Economy
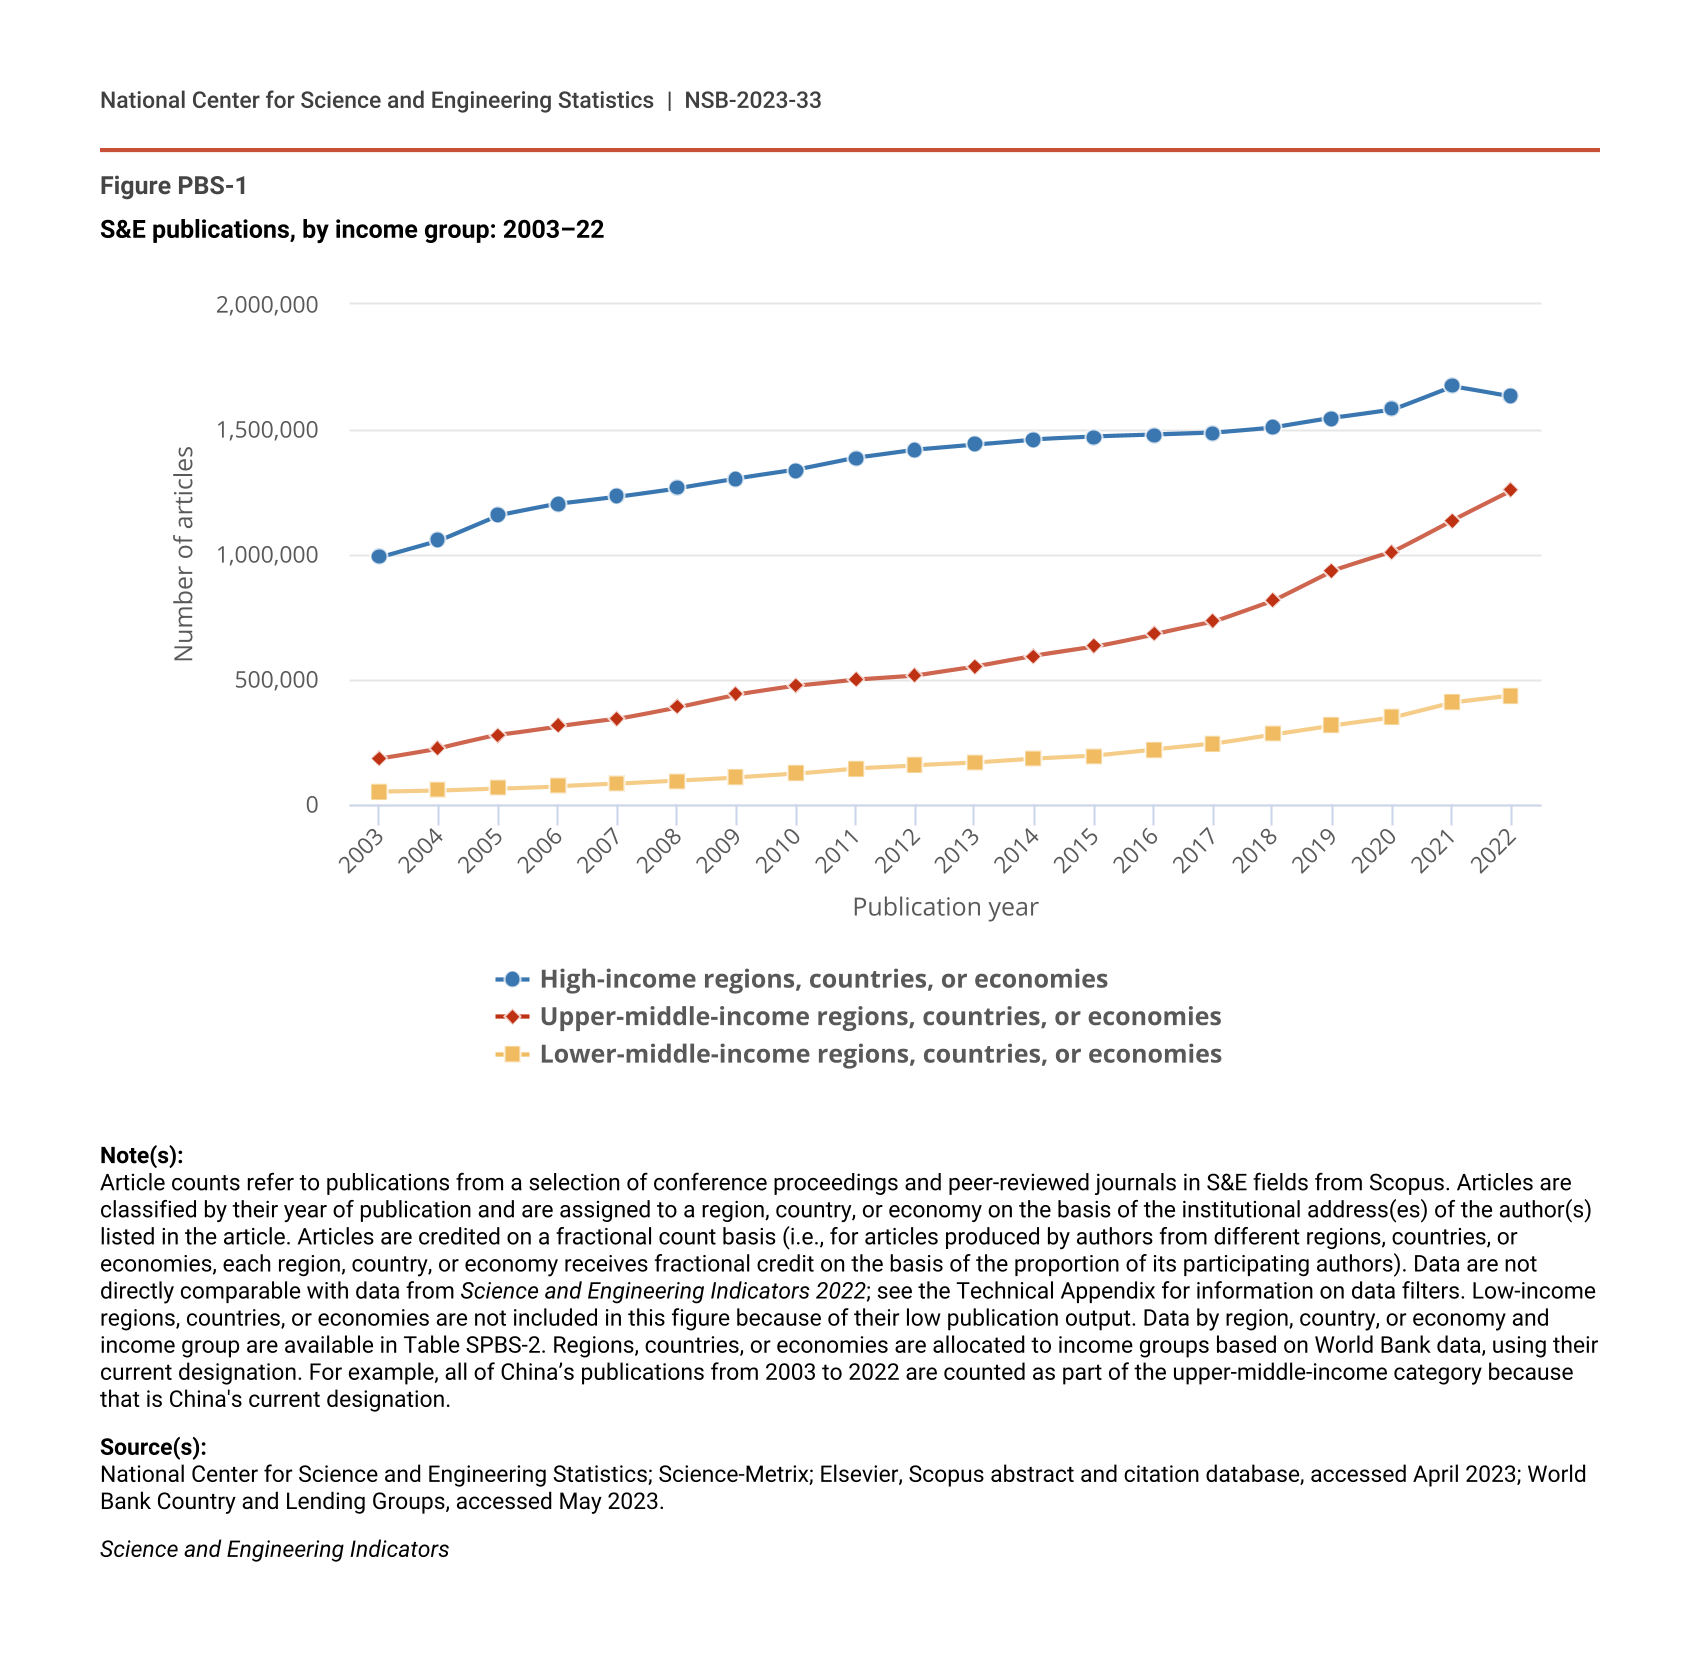
Total worldwide S&E publication output reached 3.3 million articles in 2022, based on entries in the Scopus database. Approximately 86% of publications in 2022 came from regions, countries, or economies with high-income and upper-middle-income economies (Figure PBS-1). The number of publications from all income-level groups grew between 2003 and 2022 (Table SPBS-2). Also, the number of publications from upper-middle-income economies grew more quickly than the number from high-income economies during the more recent period between 2010 and 2022.
S&E publications, by income group: 2003–22
| Publication year | High-income regions, countries, or economies | Upper-middle-income regions, countries, or economies | Lower-middle-income regions, countries, or economies |
|---|---|---|---|
| 2003 | 988,350 | 183,766 | 50,230 |
| 2004 | 1,055,000 | 224,923 | 54,803 |
| 2005 | 1,155,808 | 277,279 | 63,191 |
| 2006 | 1,201,338 | 312,720 | 72,698 |
| 2007 | 1,230,857 | 341,548 | 82,295 |
| 2008 | 1,264,921 | 388,391 | 95,432 |
| 2009 | 1,302,688 | 439,429 | 108,638 |
| 2010 | 1,337,497 | 474,610 | 123,537 |
| 2011 | 1,386,153 | 500,322 | 144,905 |
| 2012 | 1,419,298 | 516,484 | 155,762 |
| 2013 | 1,440,053 | 551,692 | 165,534 |
| 2014 | 1,460,943 | 594,695 | 181,313 |
| 2015 | 1,470,651 | 630,385 | 193,760 |
| 2016 | 1,477,780 | 680,857 | 218,627 |
| 2017 | 1,485,658 | 729,920 | 241,744 |
| 2018 | 1,507,004 | 815,662 | 279,283 |
| 2019 | 1,545,329 | 935,664 | 314,980 |
| 2020 | 1,579,578 | 1,010,023 | 345,874 |
| 2021 | 1,673,007 | 1,136,819 | 406,144 |
| 2022 | 1,629,873 | 1,255,995 | 433,645 |
Note(s):
Article counts refer to publications from a selection of conference proceedings and peer-reviewed journals in S&E fields from Scopus. Articles are classified by their year of publication and are assigned to a region, country, or economy on the basis of the institutional address(es) of the author(s) listed in the article. Articles are credited on a fractional count basis (i.e., for articles produced by authors from different regions, countries, or economies, each region, country, or economy receives fractional credit on the basis of the proportion of its participating authors). Data are not directly comparable with data from Science and Engineering Indicators 2022; see the Technical Appendix for information on data filters. Low-income regions, countries, or economies are not included in this figure because of their low publication output. Data by region, country, or economy and income group are available in Table SPBS-2. Regions, countries, or economies are allocated to income groups based on World Bank data, using their current designation. For example, all of China’s publications from 2003 to 2022 are counted as part of the upper-middle-income category because that is China's current designation.
Source(s):
National Center for Science and Engineering Statistics; Science-Metrix; Elsevier, Scopus abstract and citation database, accessed April 2023; World Bank Country and Lending Groups, accessed May 2023.
Science and Engineering Indicators
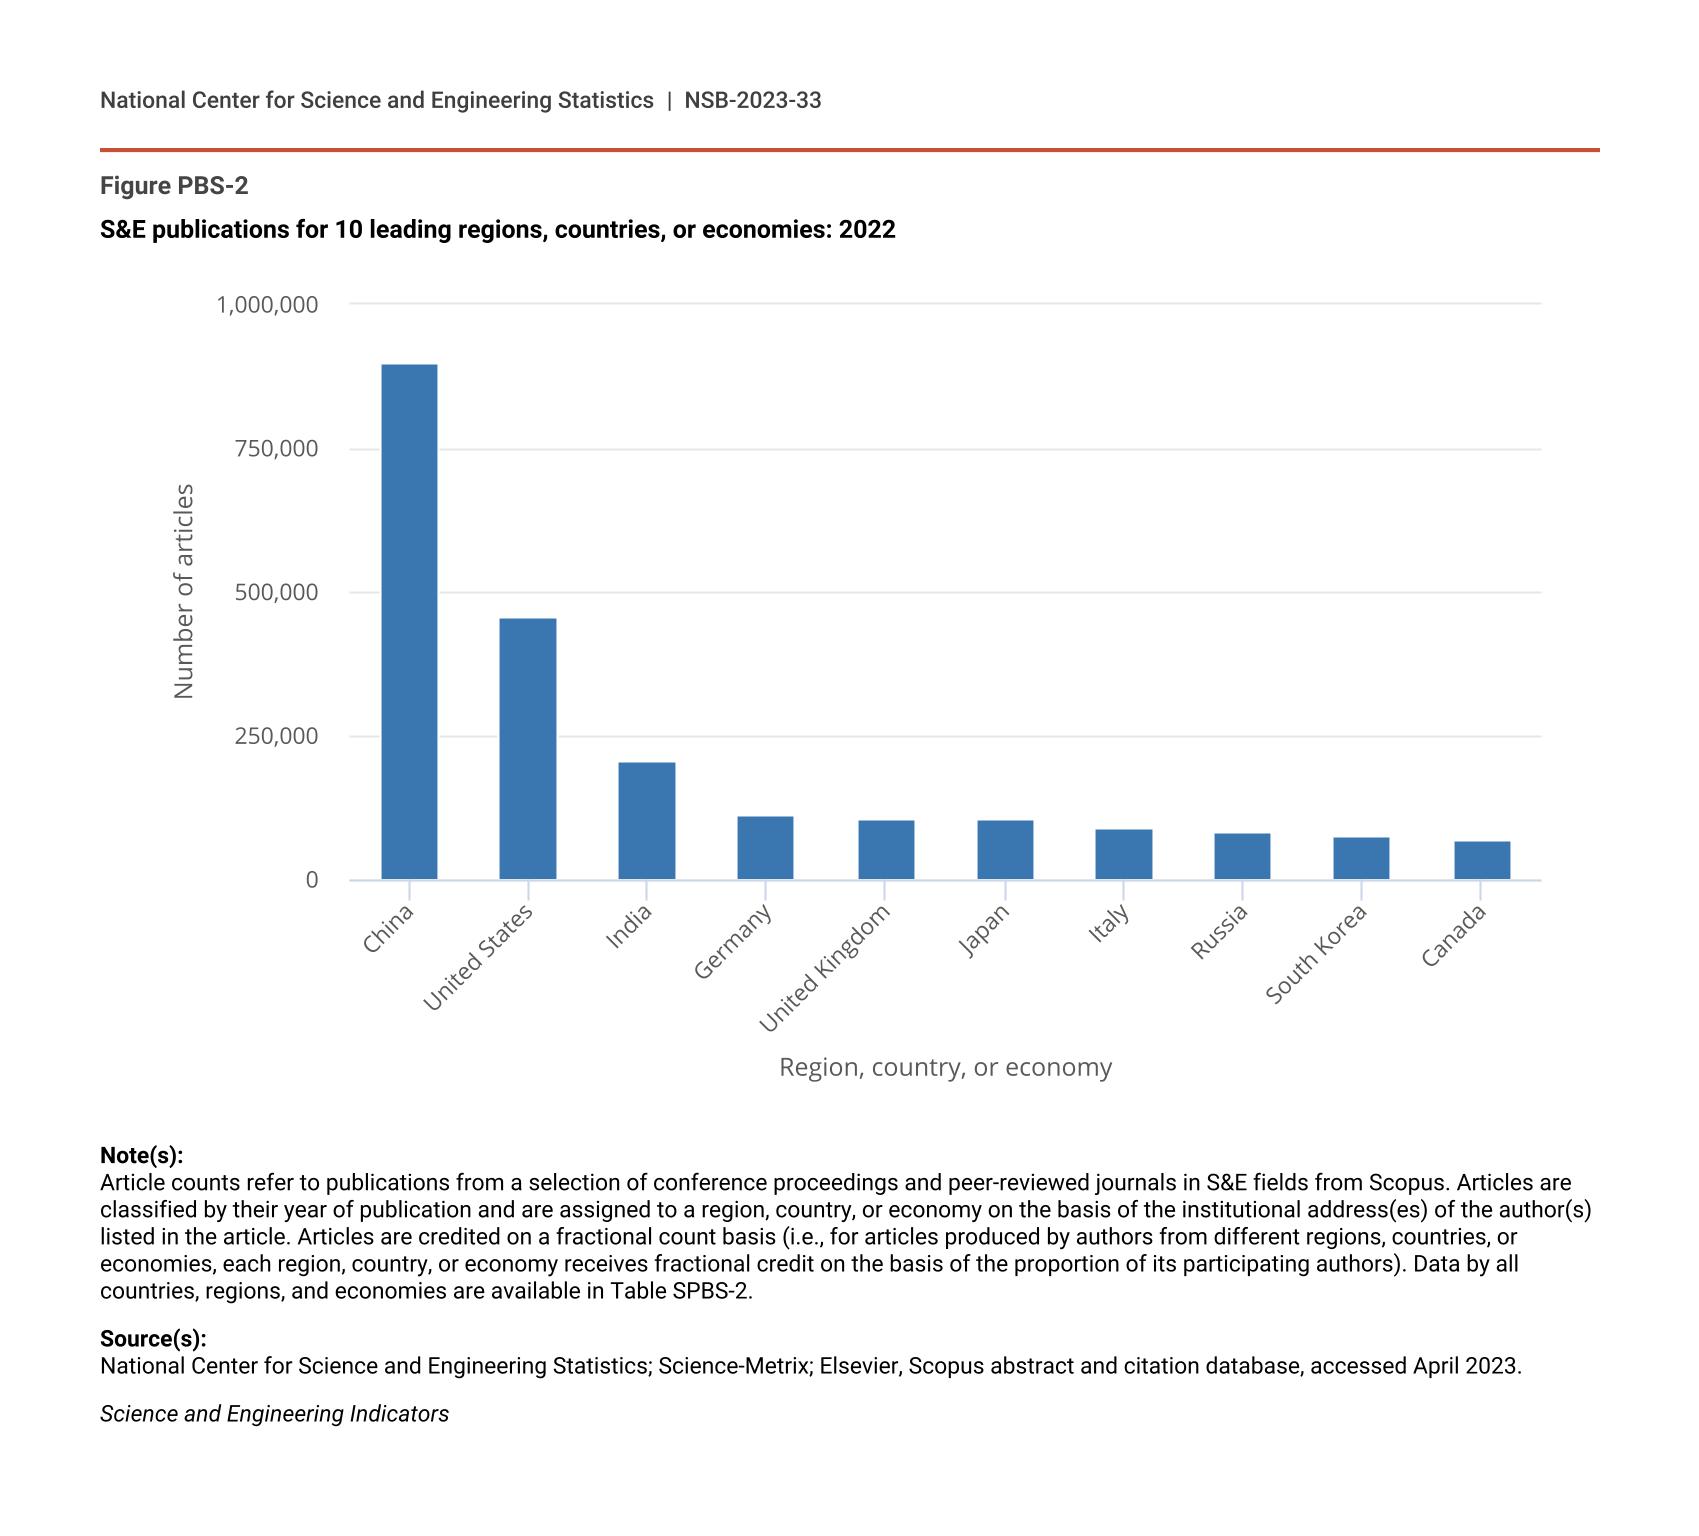
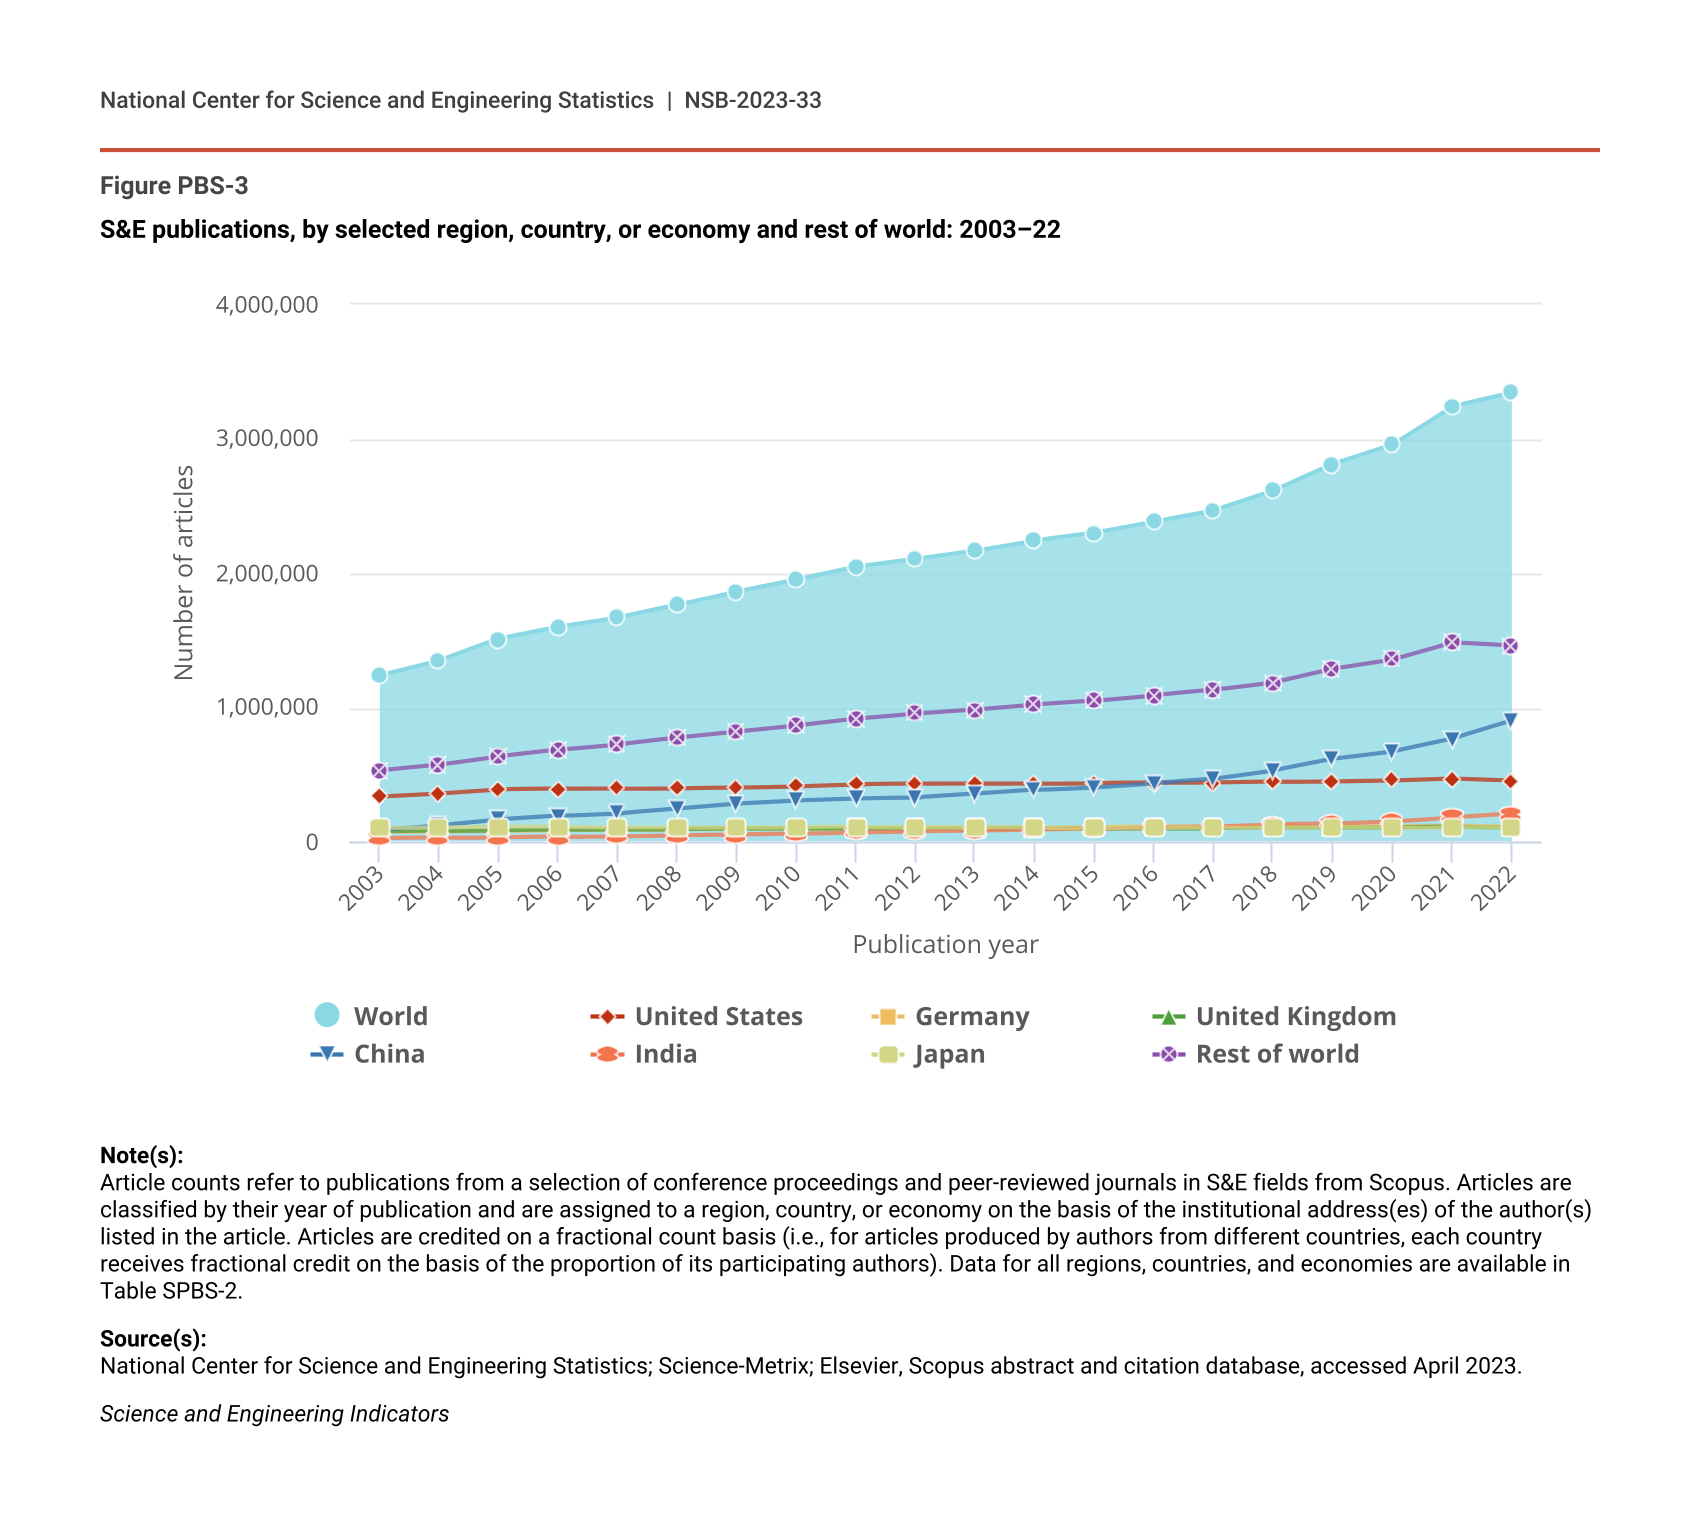
In 2022, six regions, countries, or economies each produced more than 100,000 articles: China, the United States, India, Germany, the United Kingdom, and Japan. Together, these leading regions, countries, or economies accounted for over 50% of the worldwide total in 2022 (Figure PBS-2; Table PBS-1). In absolute numbers, the growth in worldwide annual publication output (from 2.0 million in 2010 to 3.3 million in 2022) was driven in particular by two countries: China (42% of additional publications during that period) and India (11%) together accounted for more than half of that increase in publications (Figure PBS-3). Russia, South Korea, Iran, and Brazil made notable contributions to the growth in the number of publications from the rest of the world from 2010 to 2022 (Figure PBS-3; Table SPBS-2). Generally, the set of the top 15 producers of S&E articles was the same each year between 2010 and 2022, with the exception of Iran replacing Taiwan in the top 15 beginning in 2014 (Table PBS-1; Table SPBS-2).
S&E publications for 10 leading regions, countries, or economies: 2022
| Region, country, or economy | Number of publications |
|---|---|
| China | 898,949 |
| United States | 457,335 |
| India | 207,390 |
| Germany | 113,976 |
| United Kingdom | 105,584 |
| Japan | 103,723 |
| Italy | 90,586 |
| Russia | 84,252 |
| South Korea | 76,936 |
| Canada | 69,052 |
Note(s):
Article counts refer to publications from a selection of conference proceedings and peer-reviewed journals in S&E fields from Scopus. Articles are classified by their year of publication and are assigned to a region, country, or economy on the basis of the institutional address(es) of the author(s) listed in the article. Articles are credited on a fractional count basis (i.e., for articles produced by authors from different regions, countries, or economies, each region, country, or economy receives fractional credit on the basis of the proportion of its participating authors). Data by all countries, regions, and economies are available in Table SPBS-2.
Source(s):
National Center for Science and Engineering Statistics; Science-Metrix; Elsevier, Scopus abstract and citation database, accessed April 2023.
Science and Engineering Indicators
S&E publications in all fields for 15 largest producing regions, countries, or economies: 2012 and 2022
na = not applicable.
Note(s):
The regions, countries, or economies are ranked based on the 2022 total. Article counts refer to publications from conference proceedings and peer-reviewed journal articles in S&E and indexed in Scopus (see Technical Appendix for more details). Articles are classified by their year of publication and are assigned to a region, country, or economy on the basis of the institutional address(es) of the author(s) listed in the article. Articles are credited on a fractional count basis (i.e., for articles from multiple regions, countries, or economies, each region, country, or economy receives fractional credit on the basis of the proportion of its participating authors). Detail may not add to total because of regions, countries, or economies that are not shown. Proportions are based on the world total excluding unclassified addresses (data not presented). Details and other regions, countries, or economies are available in Table SPBS-2.
Source(s):
National Center for Science and Engineering Statistics; Science-Metrix; Elsevier, Scopus abstract and citation database, accessed April 2023.
Science and Engineering Indicators
S&E publications, by selected region, country, or economy and rest of world: 2003–22
| Publication year | World | United States | Germany | United Kingdom | China | India | Japan | Rest of world |
|---|---|---|---|---|---|---|---|---|
| 2003 | 1,236,106 | 336,491 | 74,320 | 77,151 | 88,585 | 26,638 | 101,382 | 531,539 |
| 2004 | 1,345,967 | 360,329 | 77,210 | 80,816 | 121,751 | 28,557 | 103,830 | 573,474 |
| 2005 | 1,508,837 | 390,403 | 85,128 | 86,341 | 165,867 | 32,734 | 112,257 | 636,107 |
| 2006 | 1,599,532 | 394,240 | 87,145 | 89,912 | 192,882 | 37,740 | 113,533 | 684,080 |
| 2007 | 1,668,894 | 396,306 | 90,199 | 92,537 | 213,648 | 42,045 | 109,140 | 725,018 |
| 2008 | 1,762,986 | 399,273 | 93,344 | 92,751 | 248,120 | 47,758 | 107,614 | 774,125 |
| 2009 | 1,862,709 | 404,008 | 96,400 | 95,007 | 285,756 | 53,200 | 109,027 | 819,312 |
| 2010 | 1,950,178 | 413,705 | 98,512 | 95,150 | 309,193 | 60,266 | 108,733 | 864,619 |
| 2011 | 2,045,351 | 426,832 | 101,238 | 96,414 | 323,332 | 71,375 | 110,457 | 915,703 |
| 2012 | 2,105,157 | 430,164 | 105,639 | 98,685 | 329,067 | 78,135 | 109,040 | 954,426 |
| 2013 | 2,168,061 | 432,033 | 106,118 | 99,859 | 355,651 | 82,849 | 108,551 | 983,000 |
| 2014 | 2,245,240 | 434,412 | 108,118 | 99,811 | 385,101 | 91,832 | 105,287 | 1,020,679 |
| 2015 | 2,302,230 | 436,908 | 108,479 | 101,175 | 406,734 | 98,301 | 102,019 | 1,048,614 |
| 2016 | 2,386,418 | 437,546 | 110,726 | 101,572 | 436,614 | 107,484 | 102,449 | 1,090,028 |
| 2017 | 2,467,960 | 440,418 | 111,427 | 102,027 | 468,713 | 113,509 | 102,425 | 1,129,442 |
| 2018 | 2,613,116 | 447,164 | 111,308 | 102,782 | 532,295 | 130,235 | 103,957 | 1,185,374 |
| 2019 | 2,811,110 | 451,480 | 113,492 | 103,938 | 617,494 | 132,820 | 104,006 | 1,287,880 |
| 2020 | 2,955,562 | 457,587 | 112,179 | 104,648 | 672,735 | 148,410 | 102,788 | 1,357,215 |
| 2021 | 3,240,279 | 472,448 | 119,604 | 109,939 | 766,200 | 179,806 | 109,075 | 1,483,206 |
| 2022 | 3,344,037 | 457,335 | 113,976 | 105,584 | 898,949 | 207,390 | 103,723 | 1,457,079 |
Note(s):
Article counts refer to publications from a selection of conference proceedings and peer-reviewed journals in S&E fields from Scopus. Articles are classified by their year of publication and are assigned to a region, country, or economy on the basis of the institutional address(es) of the author(s) listed in the article. Articles are credited on a fractional count basis (i.e., for articles produced by authors from different countries, each country receives fractional credit on the basis of the proportion of its participating authors). Data for all regions, countries, and economies are available in Table SPBS-2.
Source(s):
National Center for Science and Engineering Statistics; Science-Metrix; Elsevier, Scopus abstract and citation database, accessed April 2023.
Science and Engineering Indicators
The U.S. trend of moderate but increasing publication output varied by state. The National Science Board’s (NSB’s) State Data Tool (https://ncses.nsf.gov/indicators/states/) provides state-level data based on each state’s doctorate population and research and development (R&D) funding. Indicators include academic S&E article output per 1,000 science, engineering, and health doctorate holders in academia (NSB 2021a) and academic S&E article output per $1 million in academic S&E R&D funding (NSB 2021b).
Output by Scientific Field
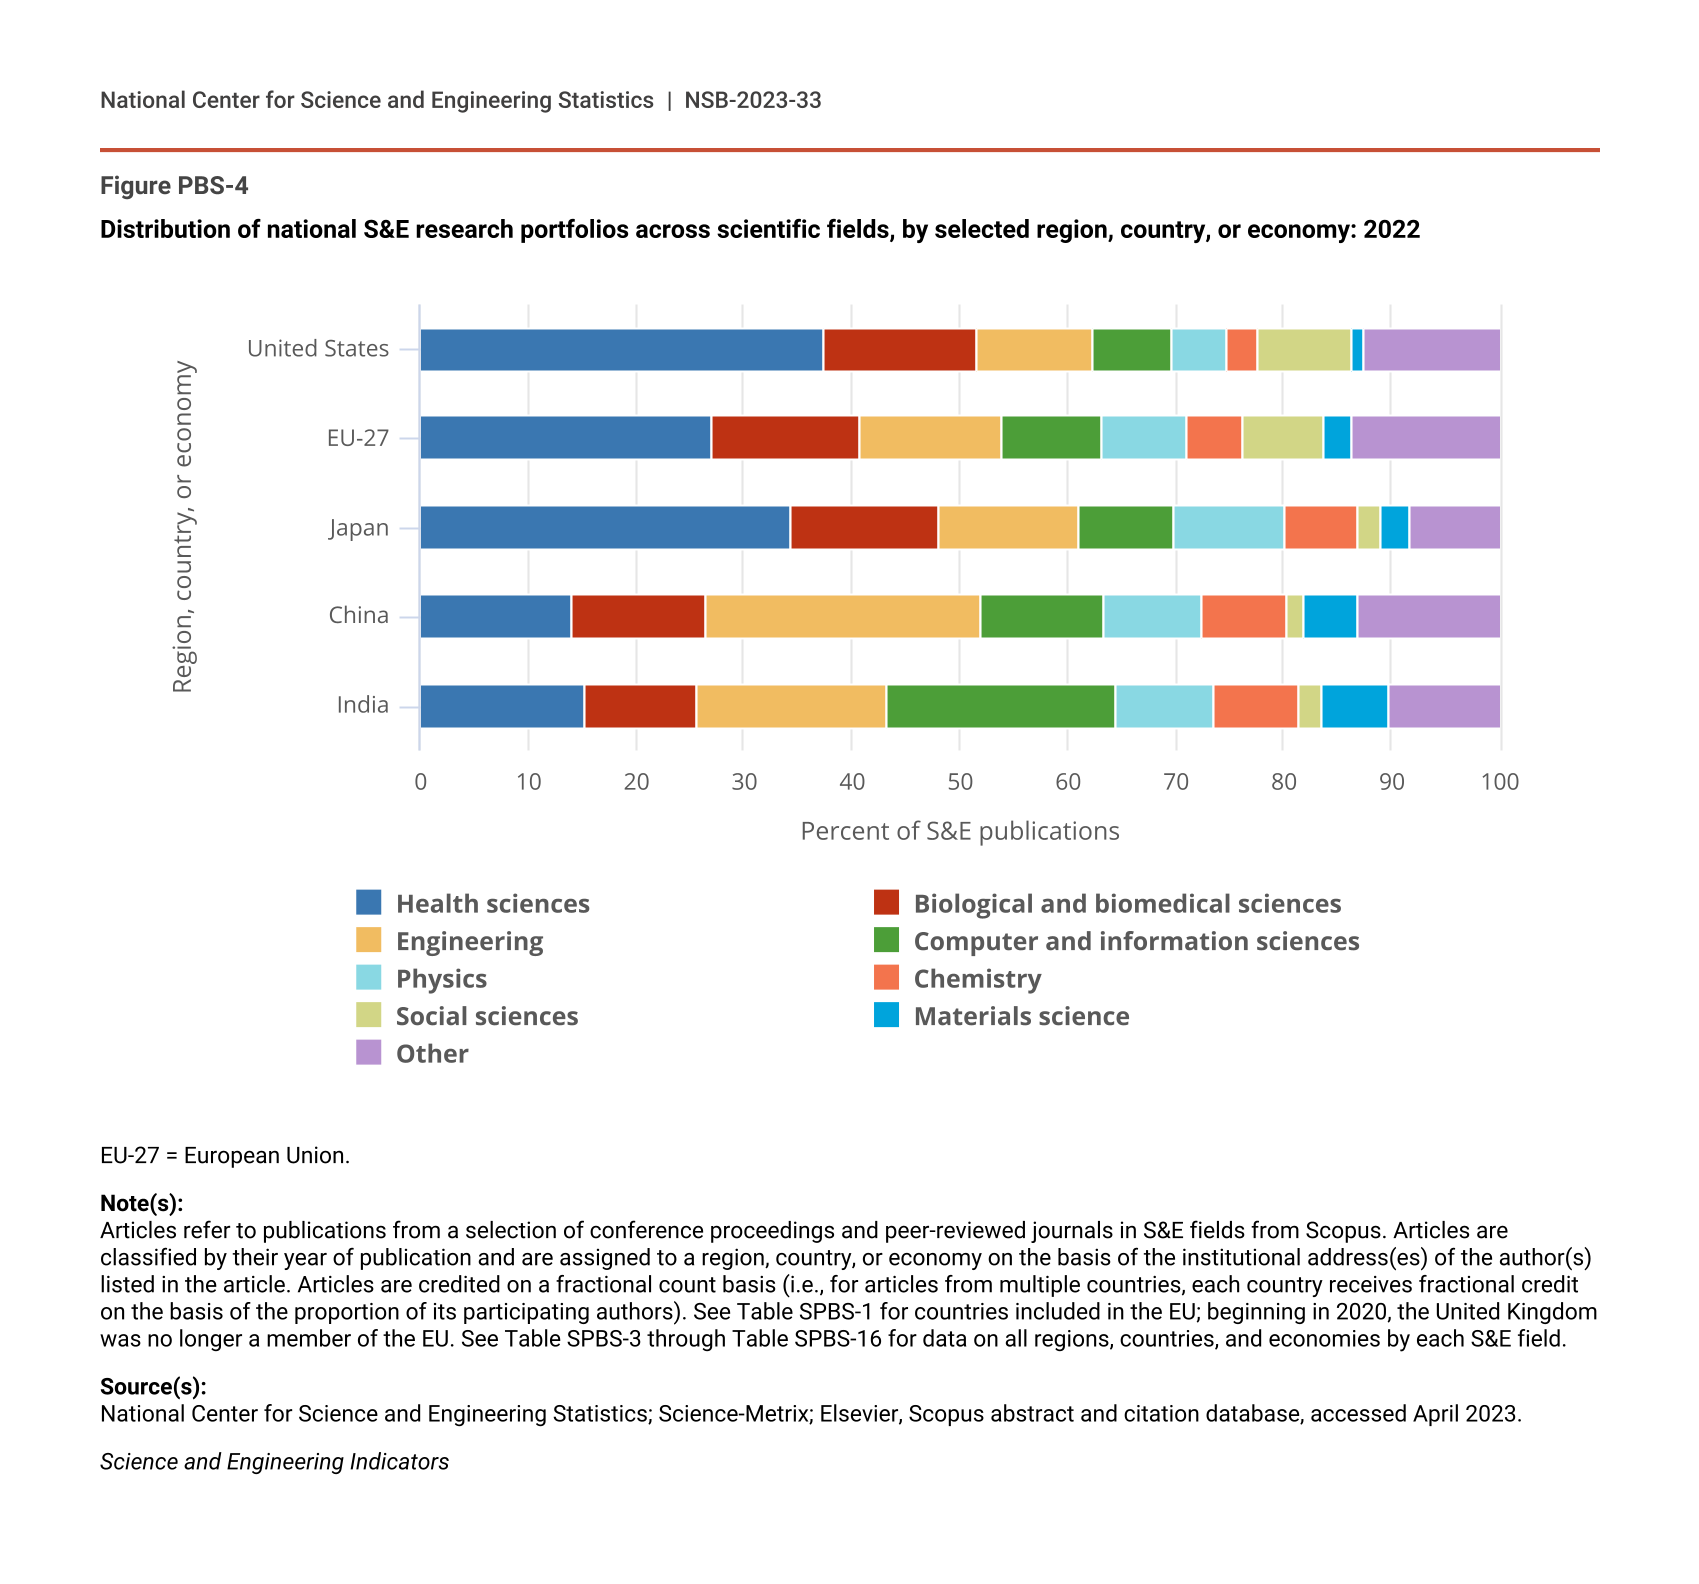
The distribution of publications by field of science across region, country, or economy may indicate research priorities and capabilities. Health sciences was the field of science in which most articles were published in 2022, representing almost a quarter of all publications (Table SPBS-2 and Table SPBS-10). Other fields with large numbers of publications included engineering (17% of publications in 2022), biological and biomedical sciences (13%), and social sciences (5%) (Table SPBS-2, Table SPBS-5, Table SPBS-8, and Table SPBS-16). In the United States, the European Union (EU-27), and Japan, health sciences publication output in 2022 far exceeded that of any other field. Meanwhile, of the other top producers, publications from China were most highly concentrated in engineering (25%), and publications from India were published predominantly in computer and information sciences (21%) (Figure PBS-4).
Distribution of national S&E research portfolios across scientific fields, by selected region, country, or economy: 2022
| Region, country, or economy | Health sciences | Biological and biomedical sciences | Engineering | Computer and information sciences | Physics | Chemistry | Social sciences | Materials science | Other |
|---|---|---|---|---|---|---|---|---|---|
| United States | 37.4 | 14.1 | 10.8 | 7.3 | 5.1 | 3.0 | 8.5 | 1.2 | 12.6 |
| EU-27 | 27.1 | 13.6 | 13.2 | 9.3 | 7.9 | 5.1 | 7.6 | 2.4 | 13.8 |
| Japan | 34.3 | 13.8 | 12.9 | 8.8 | 10.4 | 6.7 | 2.1 | 2.7 | 8.3 |
| China | 14.1 | 12.4 | 25.4 | 11.4 | 9.0 | 8.0 | 1.5 | 5.0 | 13.2 |
| India | 15.2 | 10.6 | 17.6 | 21.2 | 9.1 | 7.9 | 2.1 | 6.3 | 10.2 |
EU-27 = European Union.
Note(s):
Articles refer to publications from a selection of conference proceedings and peer-reviewed journals in S&E fields from Scopus. Articles are classified by their year of publication and are assigned to a region, country, or economy on the basis of the institutional address(es) of the author(s) listed in the article. Articles are credited on a fractional count basis (i.e., for articles from multiple countries, each country receives fractional credit on the basis of the proportion of its participating authors). See Table SPBS-1 for countries included in the EU; beginning in 2020, the United Kingdom was no longer a member of the EU. See Table SPBS-3 through Table SPBS-16 for data on all regions, countries, and economies by each S&E field.
Source(s):
National Center for Science and Engineering Statistics; Science-Metrix; Elsevier, Scopus abstract and citation database, accessed April 2023.
Science and Engineering Indicators
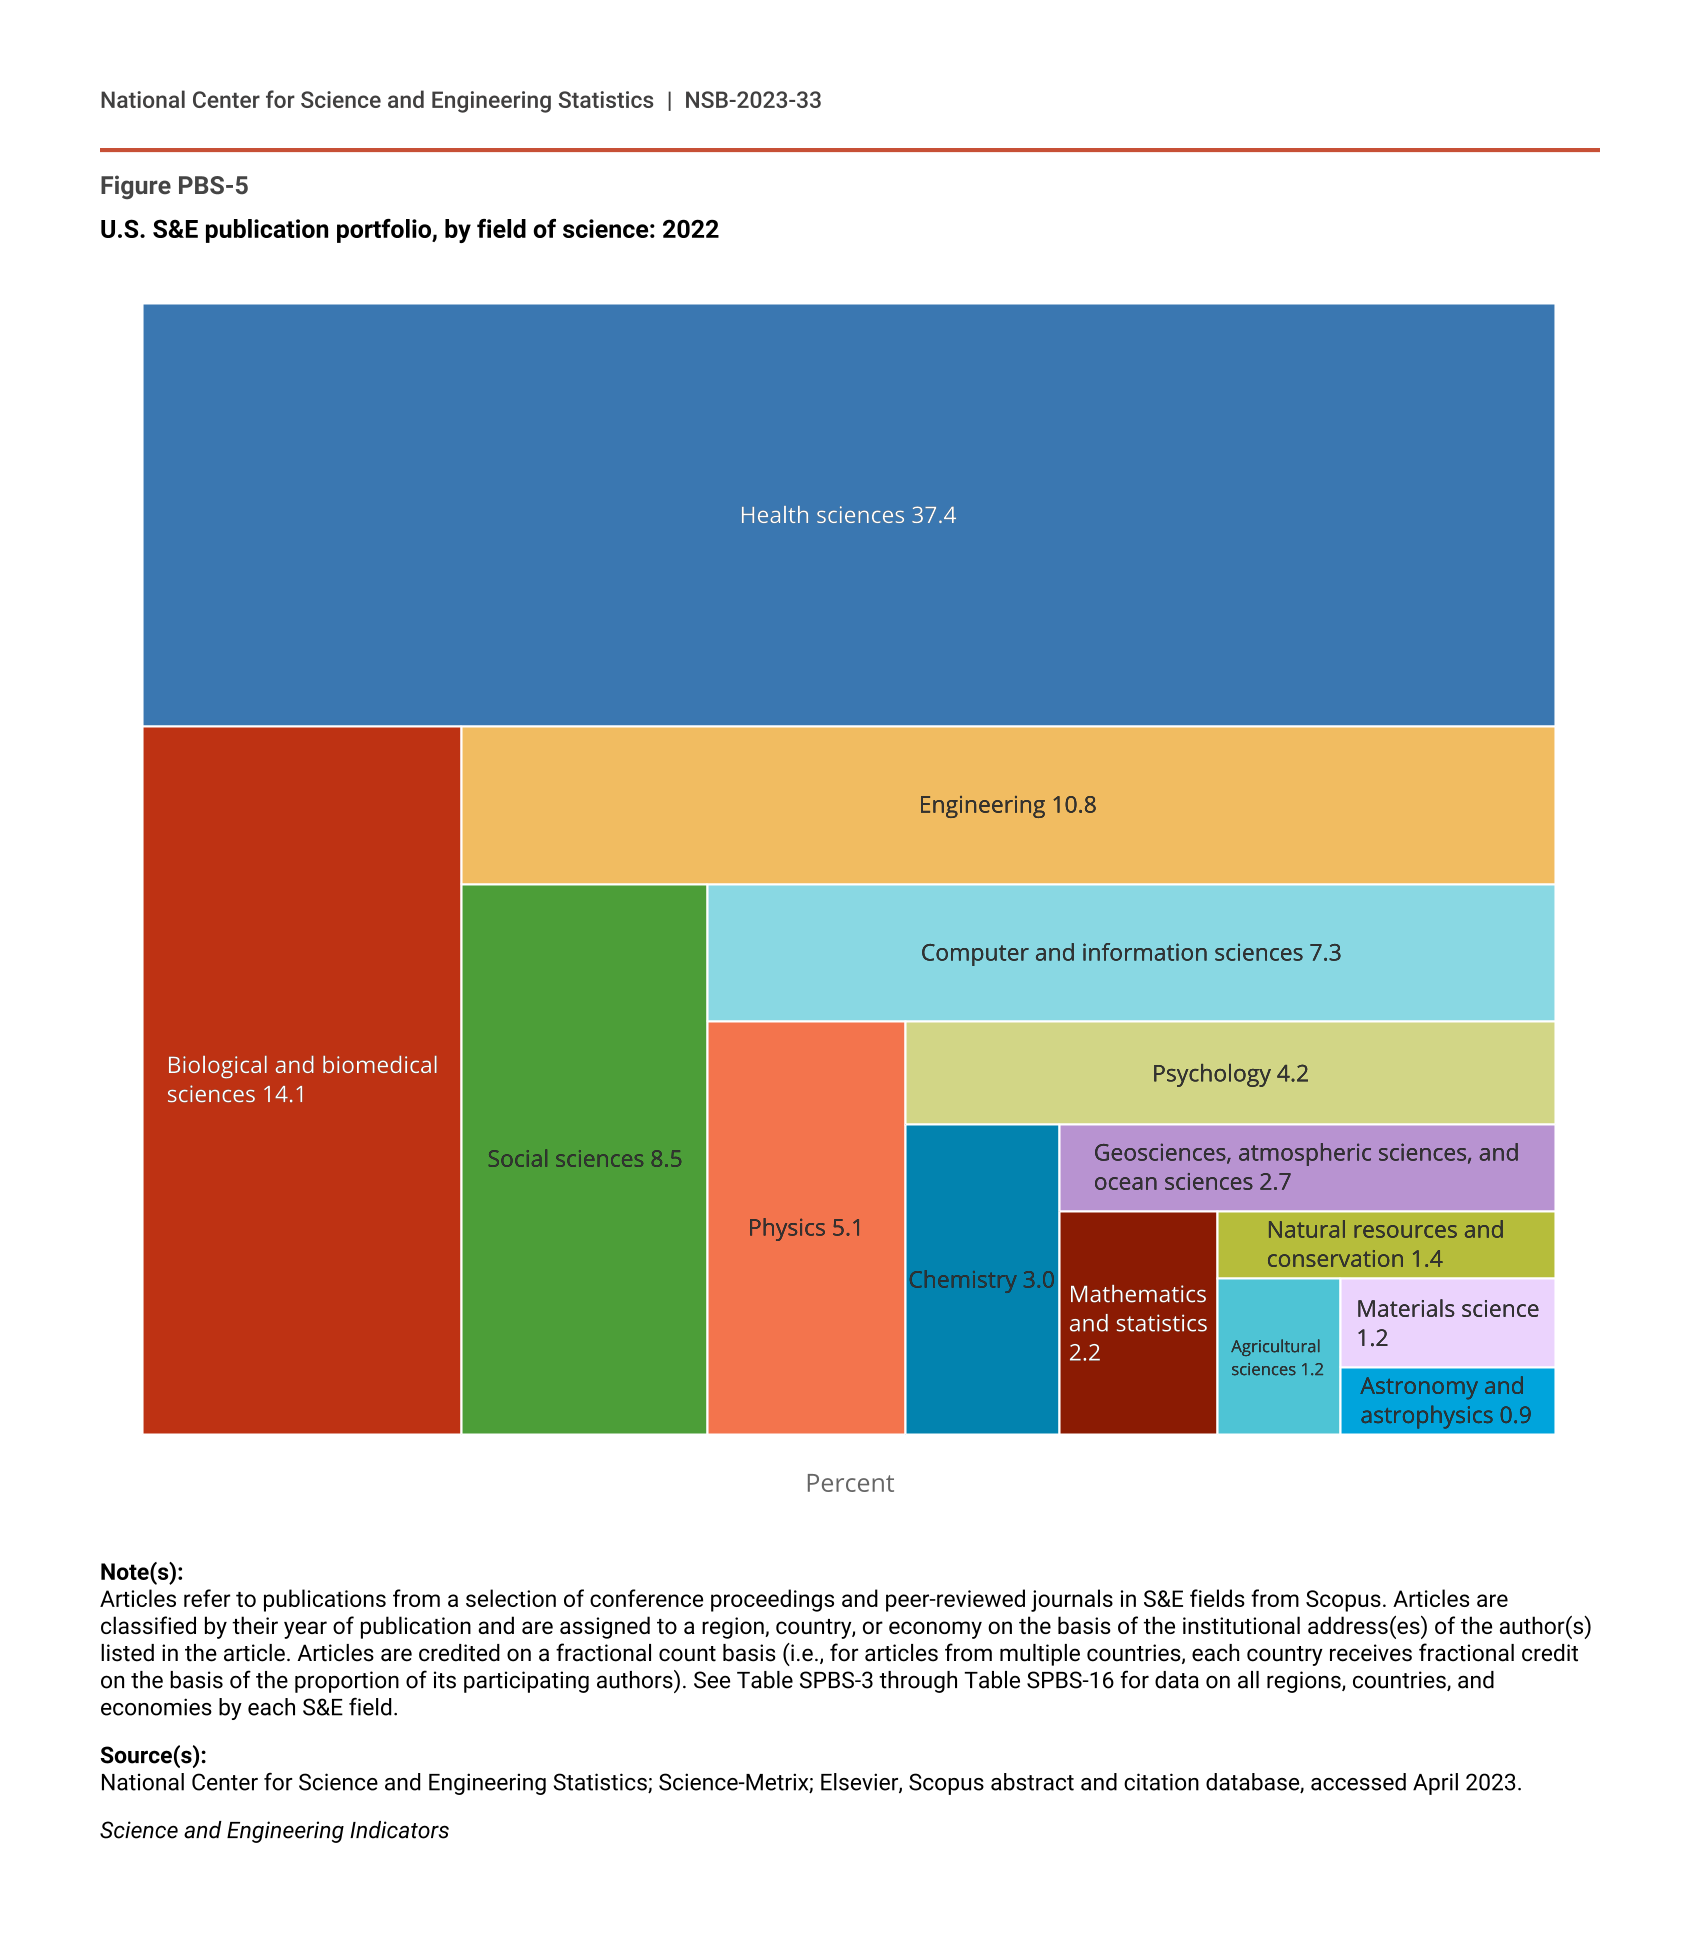
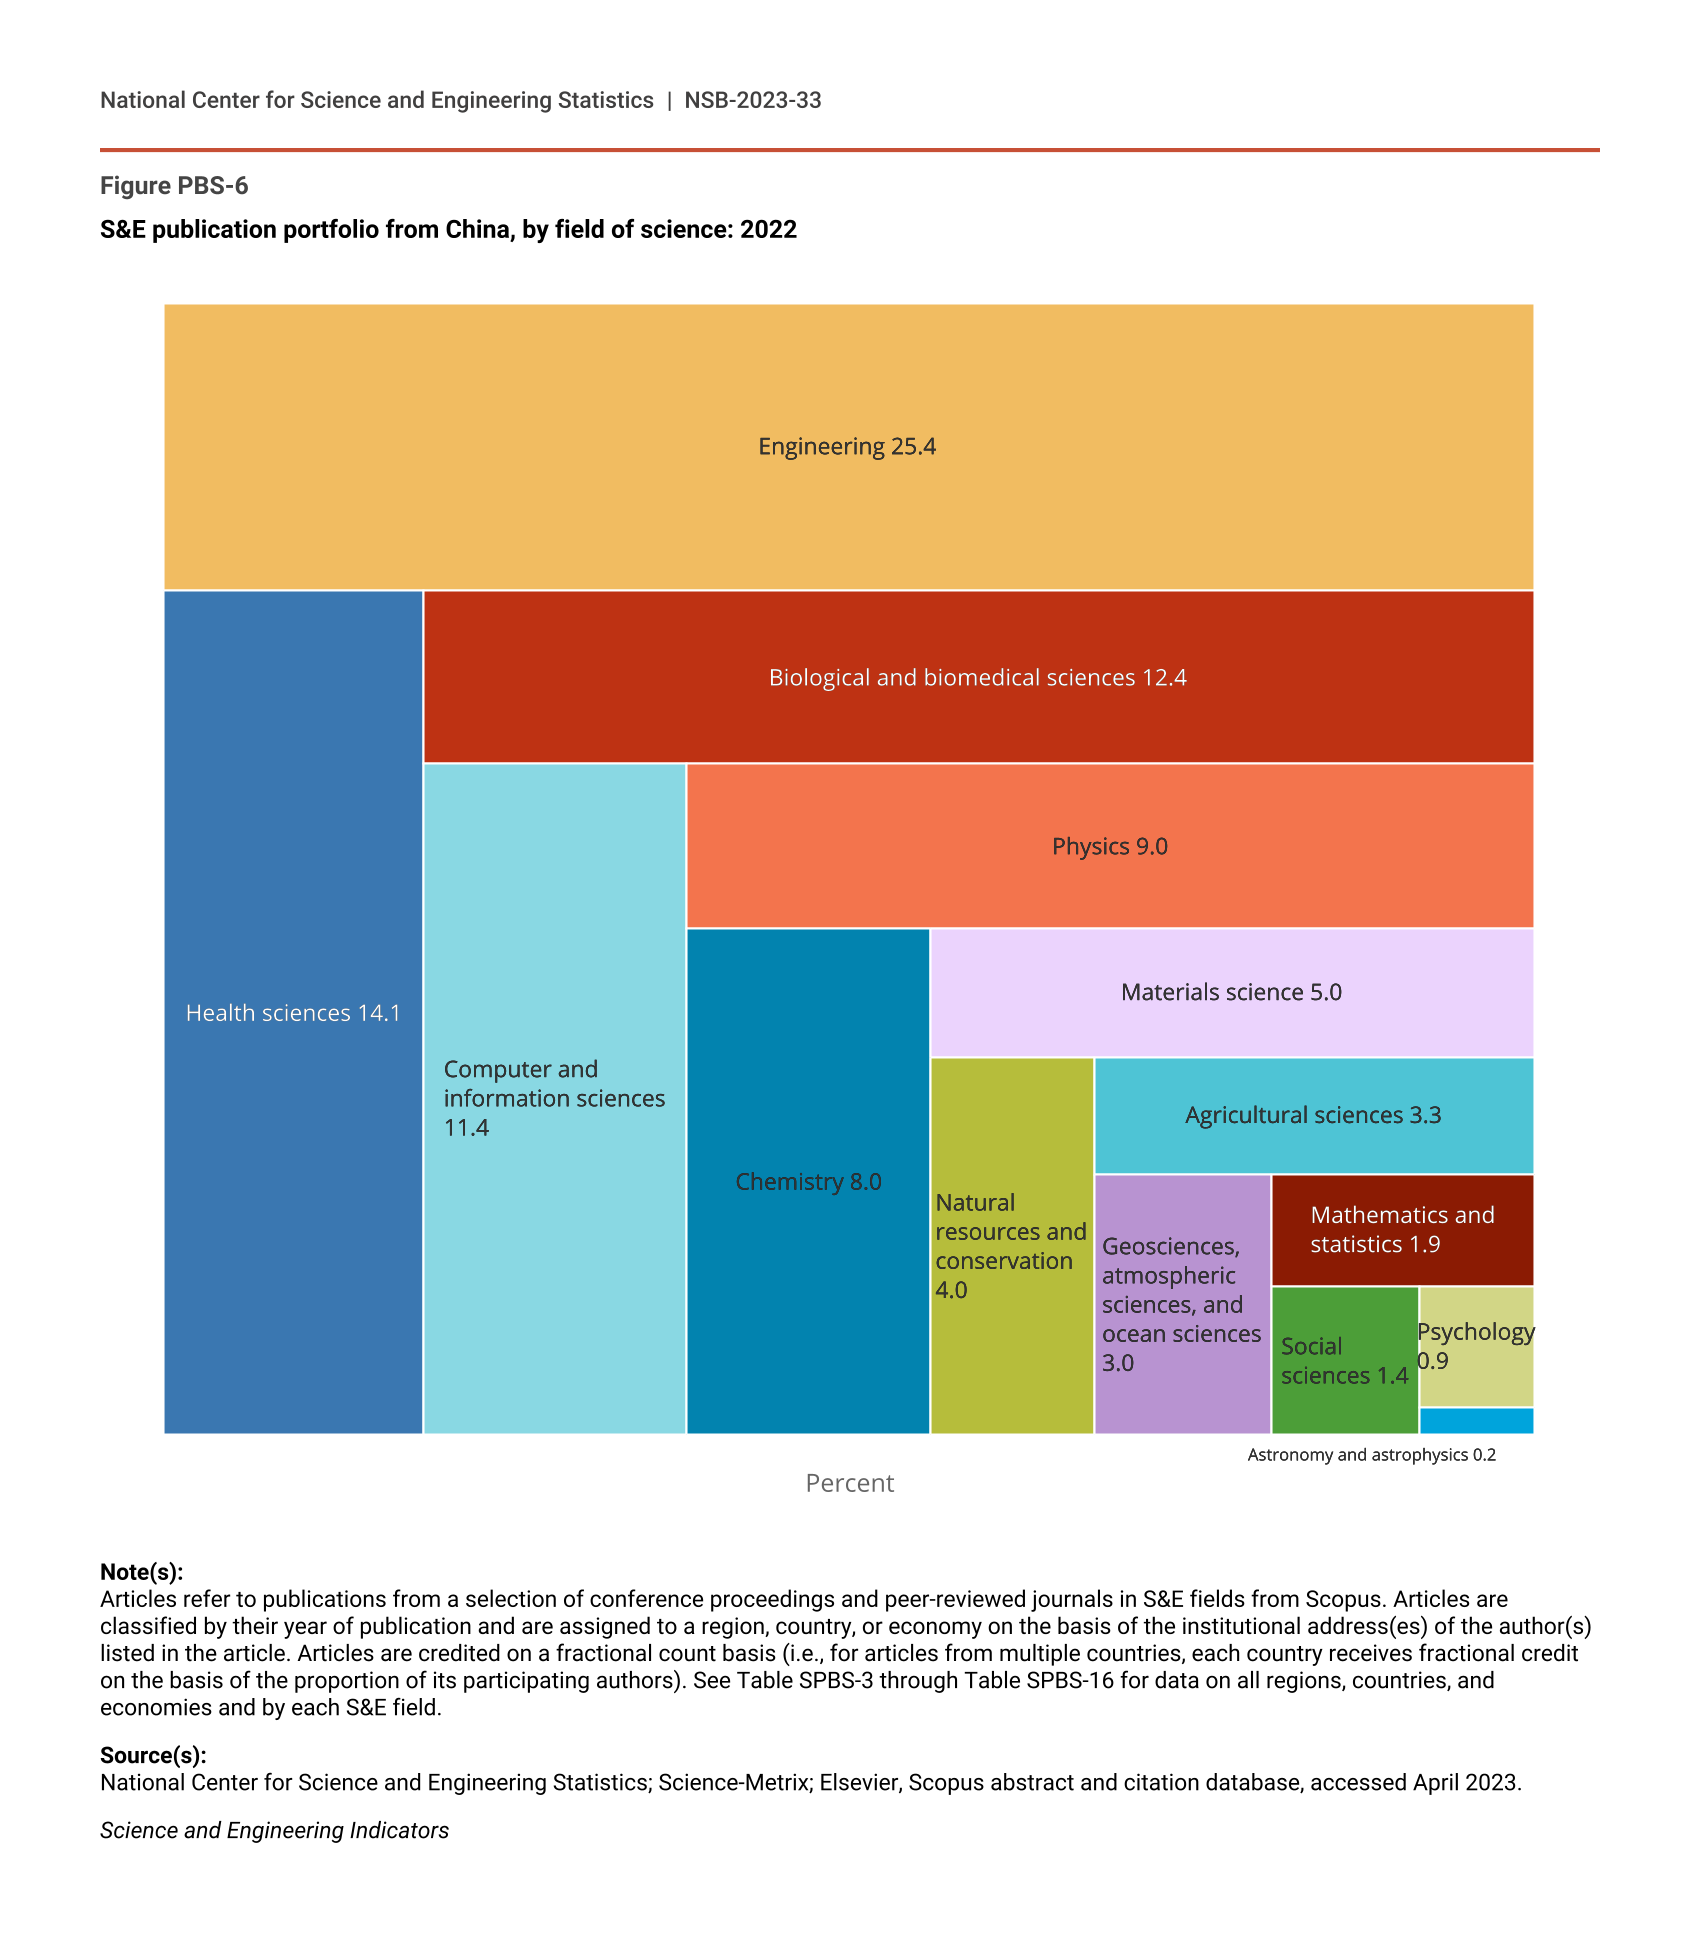
Fields within life sciences were dominant in the United States in 2022, with more than half of all U.S. publications in health sciences (37%) or biological and biomedical sciences (14%) (Figure PBS-5). There were fewer U.S. publications in engineering (11%), computer and information sciences (7%), and physics (5%). In comparison with the United States, China had a stronger focus on publications in engineering and in the physical sciences and information sciences. In 2022, 25% of China’s publications were in engineering, 11% were in computer and information sciences, and 9% were in physics (Figure PBS-6). Compared with the United States, China had a lower percentage of its publications in health sciences (14%) and biological and biomedical sciences (12%). In 2022, China also had a much lower percentage of its publications in social sciences (1%) when compared with the United States (8%).
U.S. S&E publication portfolio, by field of science: 2022
| Field | Percent |
|---|---|
| Health sciences | 37.4 |
| Biological and biomedical sciences | 14.1 |
| Engineering | 10.8 |
| Social sciences | 8.5 |
| Computer and information sciences | 7.3 |
| Physics | 5.1 |
| Psychology | 4.2 |
| Chemistry | 3.0 |
| Geosciences, atmospheric sciences, and ocean sciences | 2.7 |
| Mathematics and statistics | 2.2 |
| Natural resources and conservation | 1.4 |
| Agricultural sciences | 1.2 |
| Materials science | 1.2 |
| Astronomy and astrophysics | 0.9 |
Note(s):
Articles refer to publications from a selection of conference proceedings and peer-reviewed journals in S&E fields from Scopus. Articles are classified by their year of publication and are assigned to a region, country, or economy on the basis of the institutional address(es) of the author(s) listed in the article. Articles are credited on a fractional count basis (i.e., for articles from multiple countries, each country receives fractional credit on the basis of the proportion of its participating authors). See Table SPBS-3 through Table SPBS-16 for data on all regions, countries, and economies by each S&E field.
Source(s):
National Center for Science and Engineering Statistics; Science-Metrix; Elsevier, Scopus abstract and citation database, accessed April 2023.
Science and Engineering Indicators
S&E publication portfolio from China, by field of science: 2022
| Field | Percent |
|---|---|
| Engineering | 25.4 |
| Health sciences | 14.1 |
| Biological and biomedical sciences | 12.4 |
| Computer and information sciences | 11.4 |
| Physics | 9.0 |
| Chemistry | 8.0 |
| Materials science | 5.0 |
| Natural resources and conservation | 4.0 |
| Agricultural sciences | 3.3 |
| Geosciences, atmospheric sciences, and ocean sciences | 3.0 |
| Mathematics and statistics | 1.9 |
| Social sciences | 1.4 |
| Psychology | 0.9 |
| Astronomy and astrophysics | 0.2 |
Note(s):
Articles refer to publications from a selection of conference proceedings and peer-reviewed journals in S&E fields from Scopus. Articles are classified by their year of publication and are assigned to a region, country, or economy on the basis of the institutional address(es) of the author(s) listed in the article. Articles are credited on a fractional count basis (i.e., for articles from multiple countries, each country receives fractional credit on the basis of the proportion of its participating authors). See Table SPBS-3 through Table SPBS-16 for data on all regions, countries, and economies and by each S&E field.
Source(s):
National Center for Science and Engineering Statistics; Science-Metrix; Elsevier, Scopus abstract and citation database, accessed April 2023.
Science and Engineering Indicators
All the leading regions, countries, or economies saw an increase in their output of health sciences publications between 2010 and 2022. This increase is to be expected, given the context of increasing publication rates in general over that period, with overall number of publications increasing by 71% (Table SPBS-2), while publications in health sciences increased by 66% (Table SPBS-10). Russia had the highest relative growth rate among the 20 leading regions, countries, or economies in health sciences, increasing its publication output by almost 450% between 2010 and 2022 (Table SPBS-10). China and Iran each increased their output of health sciences publications by more than 250% over this period, while India’s health sciences publication output increased by more than 180%. The United States increased its output of health sciences publications by 32% over this period, while Germany, France, the United Kingdom, and Japan had the smallest increases, each with less than 20%.
Leading regions, countries, or economies also saw increases in engineering publications. The fastest growing between 2010 and 2022 were India (up 378%) and Russia (up 230%) (Table SPBS-8). China increased its output of engineering publications by 176% from 2010 to 2022, while France, the United States, and Japan all saw declines in newly published engineering articles per year over this period (3%, 13%, and 26%, respectively).
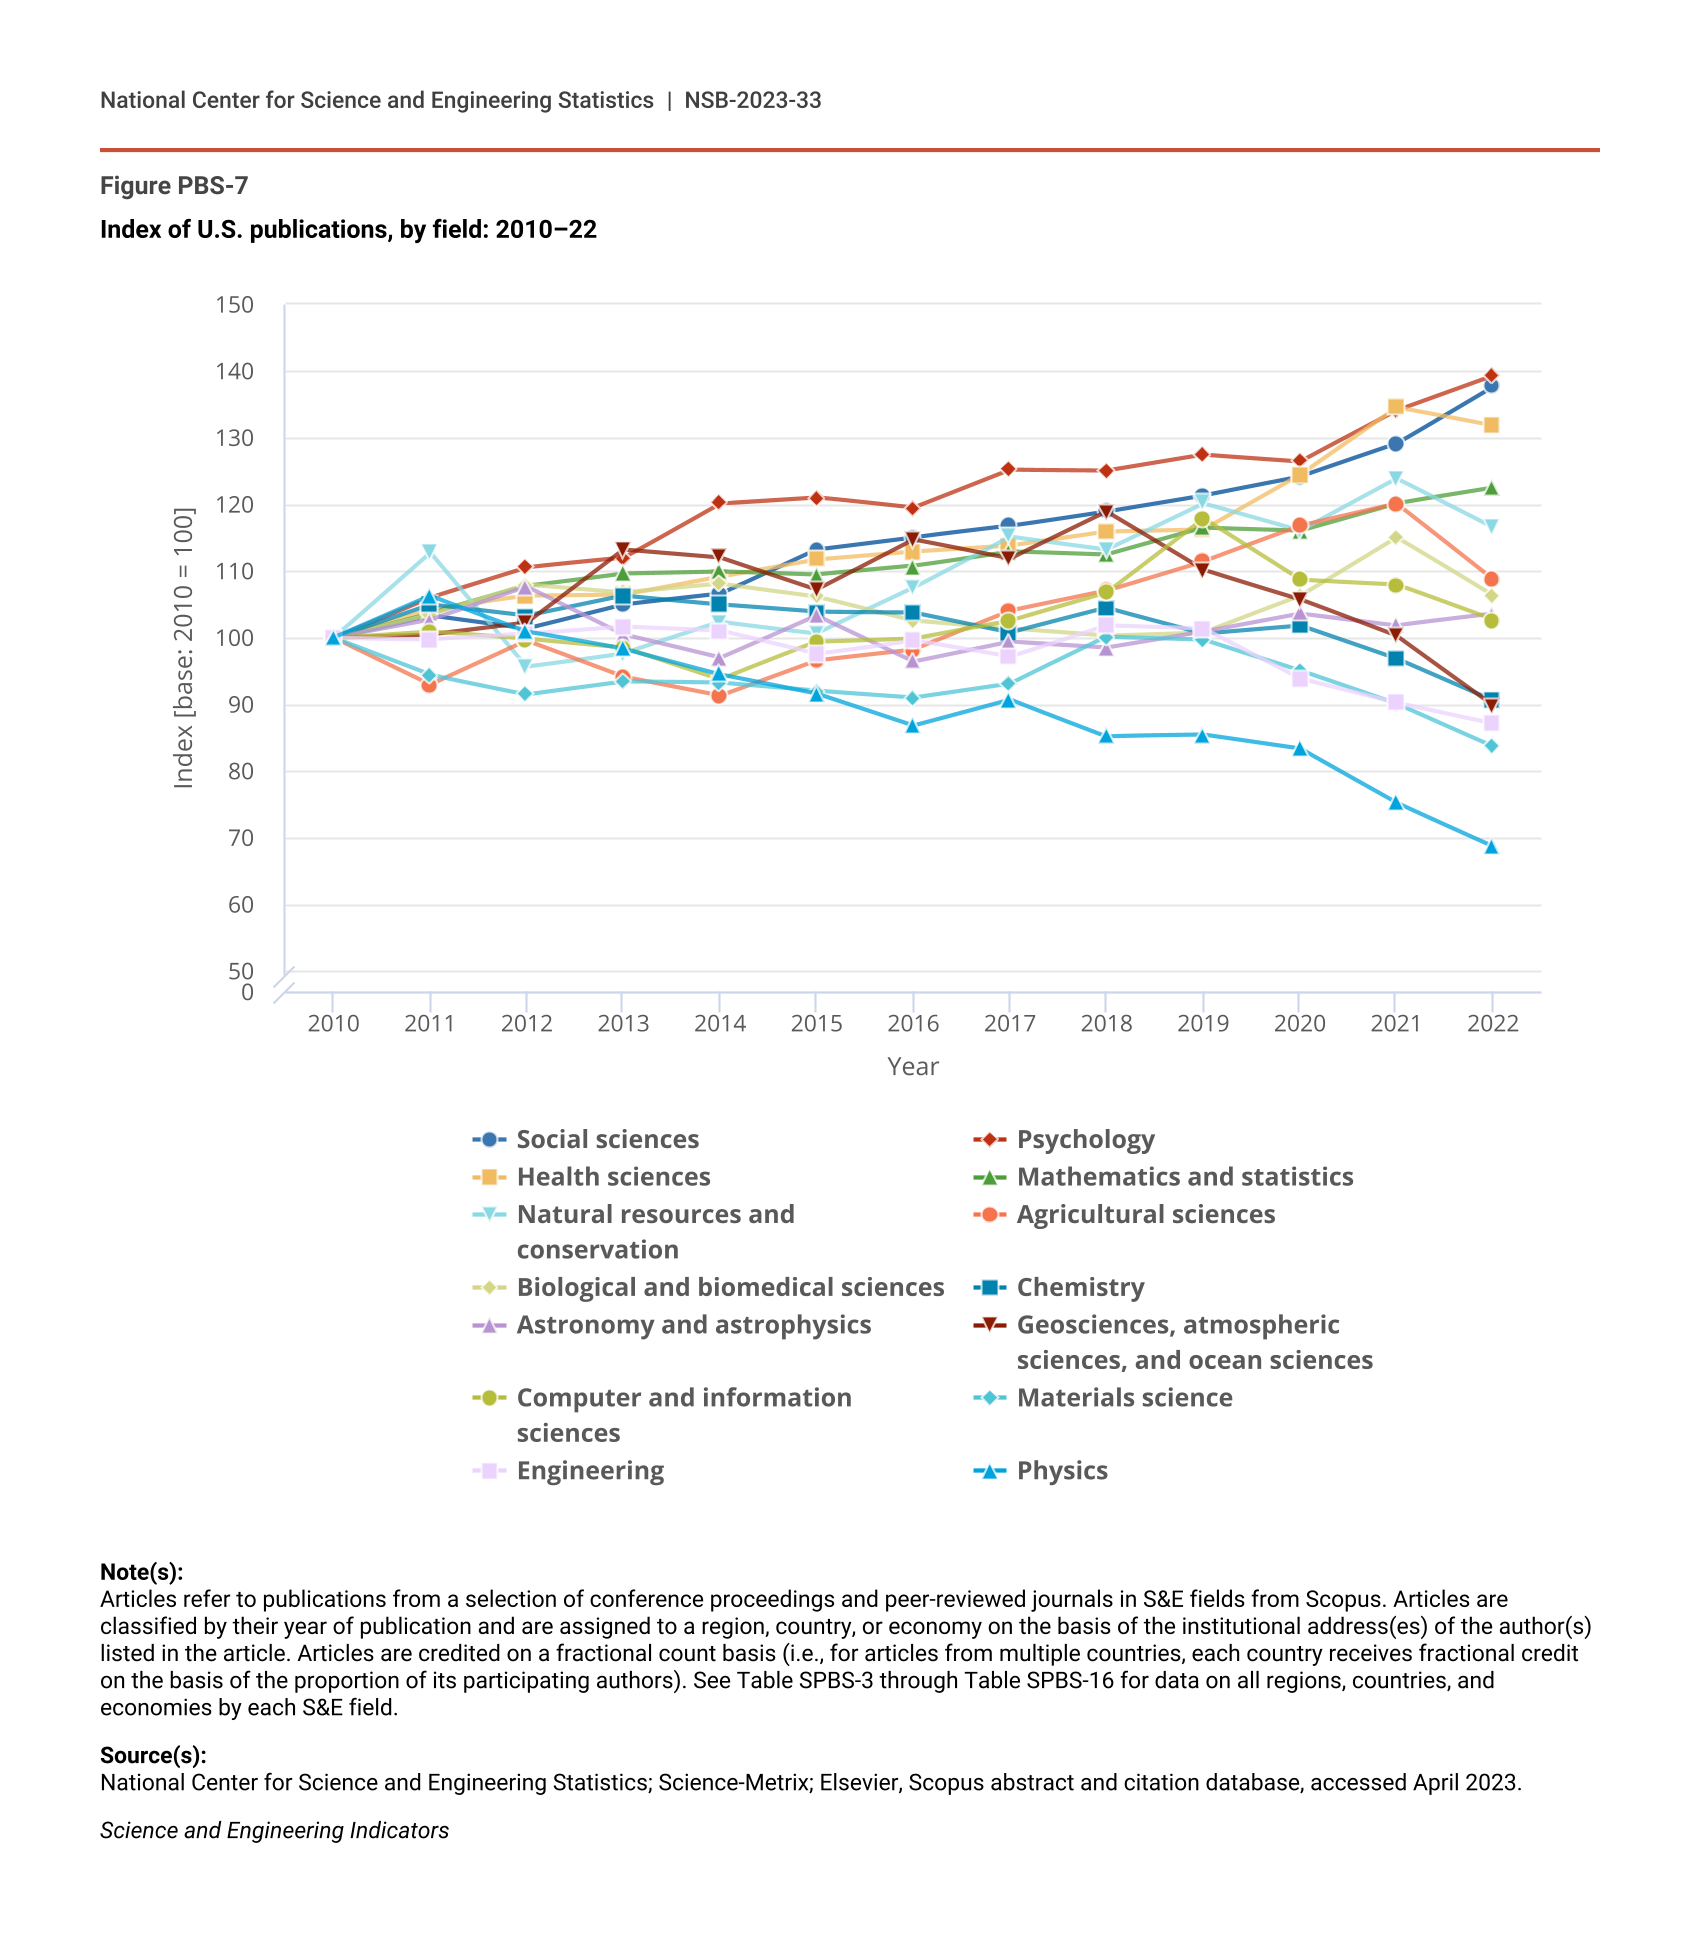
In the United States, publication output varied from that of other regions, countries, or economies with respect to scientific fields. Of the fields not already mentioned, the fastest growing from 2010 to 2022 were psychology (up 39% from 2010 to 2022) and the social sciences (up 38%) (Figure PBS-7). Meanwhile, fields with the largest decreases in U.S. publications included physics (down 31% from 2010 to 2022) and materials science (down 16%).
Index of U.S. publications, by field: 2010–22
| Year | Social sciences | Psychology | Health sciences | Mathematics and statistics | Natural resources and conservation | Agricultural sciences | Biological and biomedical sciences | Chemistry | Astronomy and astrophysics | Geosciences, atmospheric sciences, and ocean sciences | Computer and information sciences | Materials science | Engineering | Physics |
|---|---|---|---|---|---|---|---|---|---|---|---|---|---|---|
| 2010 | 100.0 | 100.0 | 100.0 | 100.0 | 100.0 | 100.0 | 100.0 | 100.0 | 100.0 | 100.0 | 100.0 | 100.0 | 100.0 | 100.0 |
| 2011 | 103.4 | 106.1 | 104.3 | 103.7 | 112.8 | 93.0 | 103.5 | 105.0 | 102.7 | 100.5 | 101.0 | 94.5 | 99.8 | 106.3 |
| 2012 | 101.4 | 110.6 | 106.3 | 107.8 | 95.7 | 99.6 | 108.0 | 103.3 | 107.7 | 102.3 | 99.9 | 91.6 | 100.6 | 101.0 |
| 2013 | 105.0 | 112.0 | 106.5 | 109.7 | 97.7 | 94.2 | 106.8 | 106.3 | 100.5 | 113.3 | 98.6 | 93.5 | 101.7 | 98.4 |
| 2014 | 106.6 | 120.2 | 109.2 | 110.0 | 102.4 | 91.4 | 108.1 | 105.0 | 97.0 | 112.1 | 93.8 | 93.3 | 101.1 | 94.6 |
| 2015 | 113.3 | 121.1 | 111.8 | 109.5 | 100.7 | 96.7 | 106.2 | 103.9 | 103.4 | 107.3 | 99.4 | 92.1 | 97.6 | 91.7 |
| 2016 | 115.1 | 119.5 | 113.0 | 110.8 | 107.5 | 98.3 | 102.6 | 103.8 | 96.5 | 114.8 | 99.9 | 91.1 | 99.7 | 86.9 |
| 2017 | 116.8 | 125.2 | 113.9 | 113.0 | 115.2 | 104.1 | 101.4 | 100.8 | 99.5 | 111.9 | 102.6 | 93.2 | 97.2 | 90.8 |
| 2018 | 119.0 | 125.1 | 116.0 | 112.5 | 113.3 | 107.1 | 100.3 | 104.5 | 98.6 | 118.9 | 106.8 | 100.2 | 101.9 | 85.3 |
| 2019 | 121.4 | 127.5 | 116.3 | 116.5 | 120.2 | 111.5 | 100.8 | 100.7 | 101.0 | 110.2 | 117.9 | 99.8 | 101.4 | 85.5 |
| 2020 | 124.2 | 126.5 | 124.5 | 116.1 | 116.1 | 116.8 | 106.3 | 101.9 | 103.7 | 105.8 | 108.7 | 95.2 | 93.9 | 83.4 |
| 2021 | 129.1 | 134.1 | 134.6 | 120.2 | 123.9 | 120.1 | 115.1 | 96.9 | 101.9 | 100.3 | 108.0 | 90.2 | 90.3 | 75.3 |
| 2022 | 137.7 | 139.3 | 131.8 | 122.5 | 116.5 | 108.7 | 106.3 | 90.6 | 103.6 | 89.9 | 102.7 | 83.8 | 87.2 | 68.8 |
Note(s):
Articles refer to publications from a selection of conference proceedings and peer-reviewed journals in S&E fields from Scopus. Articles are classified by their year of publication and are assigned to a region, country, or economy on the basis of the institutional address(es) of the author(s) listed in the article. Articles are credited on a fractional count basis (i.e., for articles from multiple countries, each country receives fractional credit on the basis of the proportion of its participating authors). See Table SPBS-3 through Table SPBS-16 for data on all regions, countries, and economies by each S&E field.
Source(s):
National Center for Science and Engineering Statistics; Science-Metrix; Elsevier, Scopus abstract and citation database, accessed April 2023.
Science and Engineering Indicators
Output and Open Access
There is growing support for the availability of S&E publications through OA sources among government and private funders, institutions, and scientists themselves. Some of these funders have imposed requirements on their grantees to publish their research results in OA journals. In the United States, the Office of Science and Technology Policy announced that all federal agencies should update their public access policies as soon as possible to ensure that results of their funded research are publicly available, with full implementation of these policies by the end of 2025 (Brainard and Kaiser 2022). Meanwhile, restricted access to scientific literature may impede researchers’ ability to stay informed (Larivière and Sugimoto 2018; Piwowar et al. 2018). As alternatives to traditional closed-access journals (where readers must subscribe to gain access or pay per article), articles may be made OA through several avenues, with different levels of availability and durability.
There are four commonly defined types of OA: Gold, Hybrid, Bronze, and Green. Gold OA denotes articles published in journals that are entirely OA as a matter of journal policy. Hybrid OA denotes articles for which the authors have elected to pay a fee for publication as OA rather than as closed access. Bronze OA denotes articles that appear as OA after an embargo period of closed access or articles that appear available as OA despite lacking license information to guarantee OA in the long term. Green OA denotes articles that are self-archived by authors in OA repositories, which are often maintained, curated, and administered by universities or other institutions. The Hybrid and Bronze categories have been combined as Other Journal-Based OA in this report because of their similar structure as journal-hosted types of OA that allow only conditional—and potentially revocable—OA.
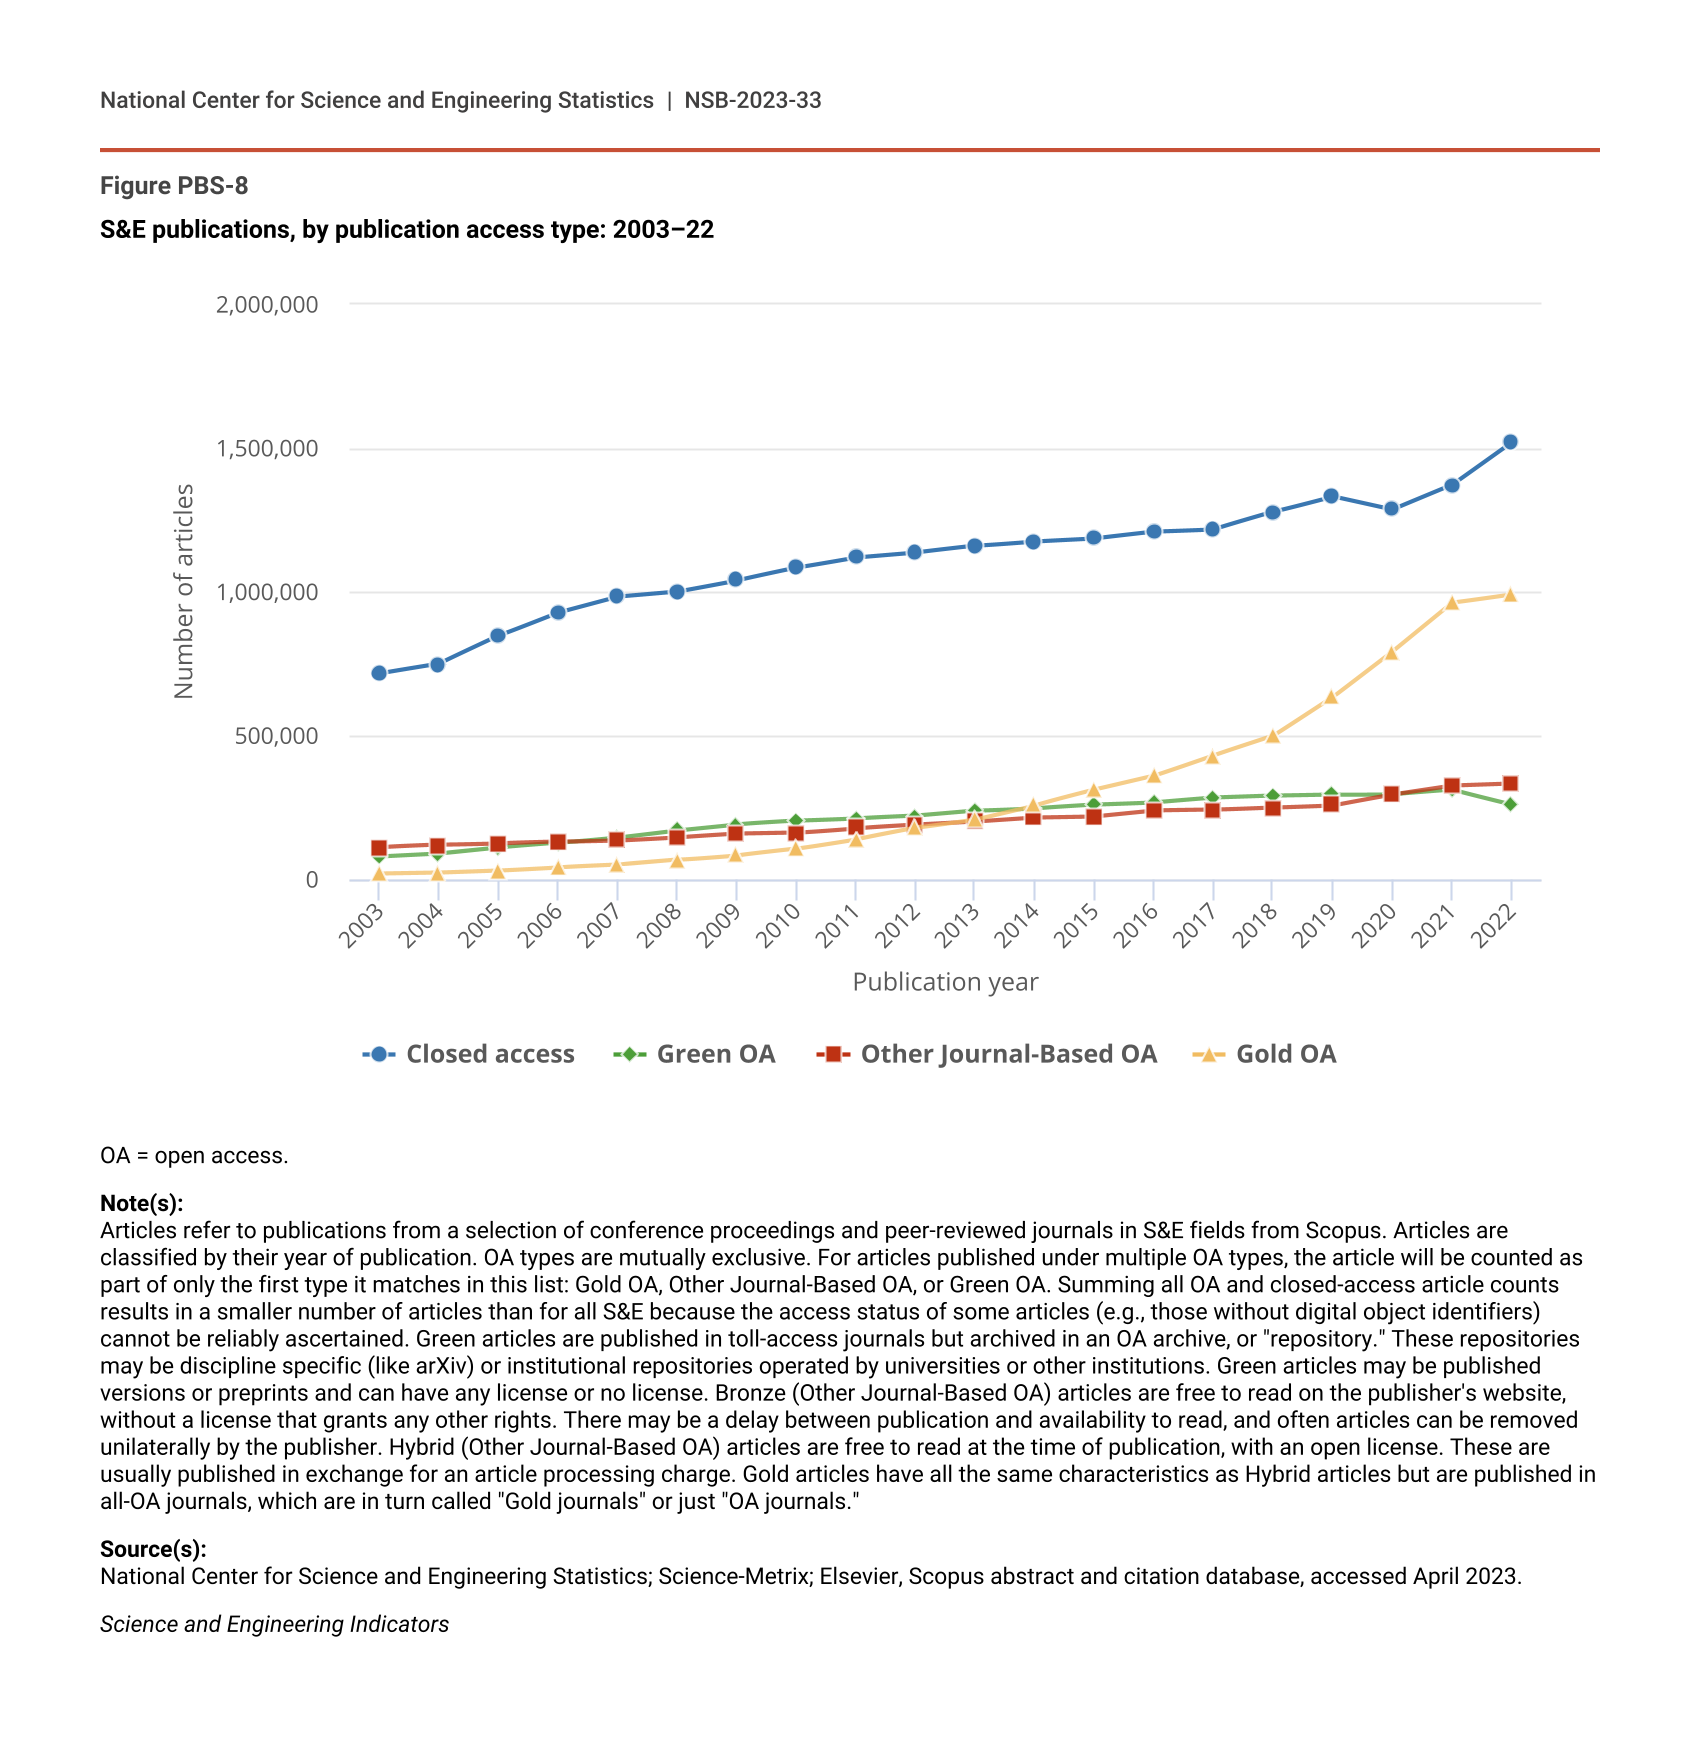
The number of articles published annually in closed-access journals increased by 112% between 2003 and 2022 (Figure PBS-8). Over the same period, annual publishing of Green OA articles increased by 228%, while Other Journal-Based OA articles (Hybrid and Bronze OA) increased by 198%. Gold OA articles (which are published in OA journals with no restrictions) had the largest percentage growth, from 19,089 articles in 2003 to 991,805 articles in 2022, an increase of over 5,000%. Hence, although the majority (77%) of S&E articles in 2003 whose access status is known were published in closed-access journals, fewer than half (49%) were in closed-access journals in 2022.
S&E publications, by publication access type: 2003–22
| Publication year | Closed access | Green OA | Other Journal-Based OA | Gold OA |
|---|---|---|---|---|
| 2003 | 716,290 | 79,136 | 111,900 | 19,089 |
| 2004 | 749,747 | 89,408 | 119,386 | 22,584 |
| 2005 | 846,261 | 110,069 | 124,548 | 30,095 |
| 2006 | 927,801 | 126,067 | 129,641 | 41,497 |
| 2007 | 983,096 | 145,872 | 134,450 | 49,937 |
| 2008 | 1,001,082 | 170,936 | 145,627 | 67,063 |
| 2009 | 1,040,201 | 191,714 | 158,239 | 83,949 |
| 2010 | 1,083,721 | 203,325 | 162,058 | 106,460 |
| 2011 | 1,119,780 | 211,503 | 178,121 | 139,931 |
| 2012 | 1,137,037 | 220,373 | 189,811 | 178,889 |
| 2013 | 1,160,217 | 238,154 | 200,600 | 208,857 |
| 2014 | 1,176,541 | 246,834 | 214,518 | 257,864 |
| 2015 | 1,186,666 | 259,016 | 218,231 | 310,487 |
| 2016 | 1,209,852 | 266,903 | 238,672 | 359,083 |
| 2017 | 1,217,879 | 283,349 | 241,314 | 430,867 |
| 2018 | 1,277,758 | 290,252 | 249,655 | 498,502 |
| 2019 | 1,332,273 | 294,347 | 257,418 | 634,366 |
| 2020 | 1,286,235 | 295,769 | 294,709 | 793,327 |
| 2021 | 1,372,042 | 310,619 | 325,757 | 962,403 |
| 2022 | 1,520,454 | 259,813 | 332,915 | 991,805 |
OA = open access.
Note(s):
Articles refer to publications from a selection of conference proceedings and peer-reviewed journals in S&E fields from Scopus. Articles are classified by their year of publication. OA types are mutually exclusive. For articles published under multiple OA types, the article will be counted as part of only the first type it matches in this list: Gold OA, Other Journal-Based OA, or Green OA. Summing all OA and closed-access article counts results in a smaller number of articles than for all S&E because the access status of some articles (e.g., those without digital object identifiers) cannot be reliably ascertained. Green articles are published in toll-access journals but archived in an OA archive, or "repository." These repositories may be discipline specific (like arXiv) or institutional repositories operated by universities or other institutions. Green articles may be published versions or preprints and can have any license or no license. Bronze (Other Journal-Based OA) articles are free to read on the publisher's website, without a license that grants any other rights. There may be a delay between publication and availability to read, and often articles can be removed unilaterally by the publisher. Hybrid (Other Journal-Based OA) articles are free to read at the time of publication, with an open license. These are usually published in exchange for an article processing charge. Gold articles have all the same characteristics as Hybrid articles but are published in all-OA journals, which are in turn called "Gold journals" or just "OA journals."
Source(s):
National Center for Science and Engineering Statistics; Science-Metrix; Elsevier, Scopus abstract and citation database, accessed April 2023.
Science and Engineering Indicators
To conclude this section, the findings of the output analysis reveal the growth in scientific publications over time, with upper-middle-income economies exhibiting particularly large percentage increases. Meanwhile, the distribution of publications across scientific fields shows that life sciences dominated in the United States, Europe, and Japan, whereas publications in engineering and computer sciences dominated in China and India. In OA, the dramatic growth of Gold OA publications and the steady growth of publications in other OA categories show an increased shift toward open science. However, OA can impede the dissemination of some scientific research. Publishing research as OA often requires authors to pay article processing fees, which may be prohibitive for scientists in less-developed nations or whose funders do not subsidize those fees. The fees can be seen as shifting the costs of accessing research from readers and libraries to authors (Larivière and Sugimoto 2018).