 An official website of the United States government
 Impact of Published Research
As a complement to measures of the total production of articles published by U.S.-based researchers, indicators gauging the scientific significance of those articles aid in assessing the vitality and competitiveness of the U.S. S&E enterprise. A key assertion in the study of scientific communication is that the author of a scientific journal article cites the previously published articles that influenced or informed the author’s research (Merton 1973; Tahamtan and Bornmann 2018). Thus, when an article is referenced by many other articles, it is deemed to have exceptional scientific impact (Garfield 1973). Alternate explanations for citation patterns exist, such as the belief that they are a mechanism for the citing author to bestow credit on an earlier author (Small 2004). These interpretations of citation patterns suggest that authors who produce highly cited articles have greater scientific influence than those who do not. By extension, nations whose authors produce a disproportionate share of the most highly cited articles in a given field are regarded as generating research results with greater impact.
In general, most of the scientific articles published garner few or no citations, whereas for a small share, each article ends up with hundreds or thousands of citations (Van Noorden, Maher, and Nuzzo 2014). Recently published articles tend to have fewer citations than those published many years ago because articles are referenced only after they have been disseminated and read throughout the research community. Counting the cumulative citations earned by an article at least 2 years after publication provides the means to normalize the measure of impact for a given year. This 2-year lag provides sufficient time for high-impact articles to attract attention and therefore receive a distinguishing number of citations (Wang 2012). Those in the top 1% of the articles based on this measurement of citations are designated as highly cited articles (HCAs). Therefore, this report provides impact measures for articles up to those published in 2020, calculated using the citation counts for those articles at the end of 2022. Note that some articles may receive a much higher share of their citations many years after publication (Ke et al. 2015).
A method of representing scientific impact at the national level calculates the share of a specific nation’s scientific output among the HCAs in a given year. To identify the HCAs for each year, publications in each scientific field are ranked based on their accumulated citations, generating a list of the top 1% of that distribution. A separate list is generated for each field to account for differences in citation practices and patterns among the various disciplines (Science-Metrix 2021b). Aggregating the lists for all fields produces the HCA list; that list is the compilation of the top 1% of articles in each field by citations rather than the top 1% overall. Each article on the list is attributed to a nation if at least one author on the publication is affiliated with an institution located in that region, country, or economy (meaning that one article will be attributed to every nation represented among its coauthors).
The estimate of scientific impact is based on the share of a specific region, country, or economy’s articles designated as HCAs. For a region, country, or economy with impact on par with that of the entire global scientific community, 1% of that region, country, or economy’s scientific articles would be found in the top 1%. An HCA share above 1.0 means that more than 1% of the nation’s articles achieved HCA status, indicating that the nation’s published research has disproportionately more impact relative to the volume of articles its researchers produce. A consistent increase in a region, country, or economy’s HCA ratio over time suggests that its S&E enterprise is rising in stature as a producer of notable research findings.
Impact by Region, Country, or Economy
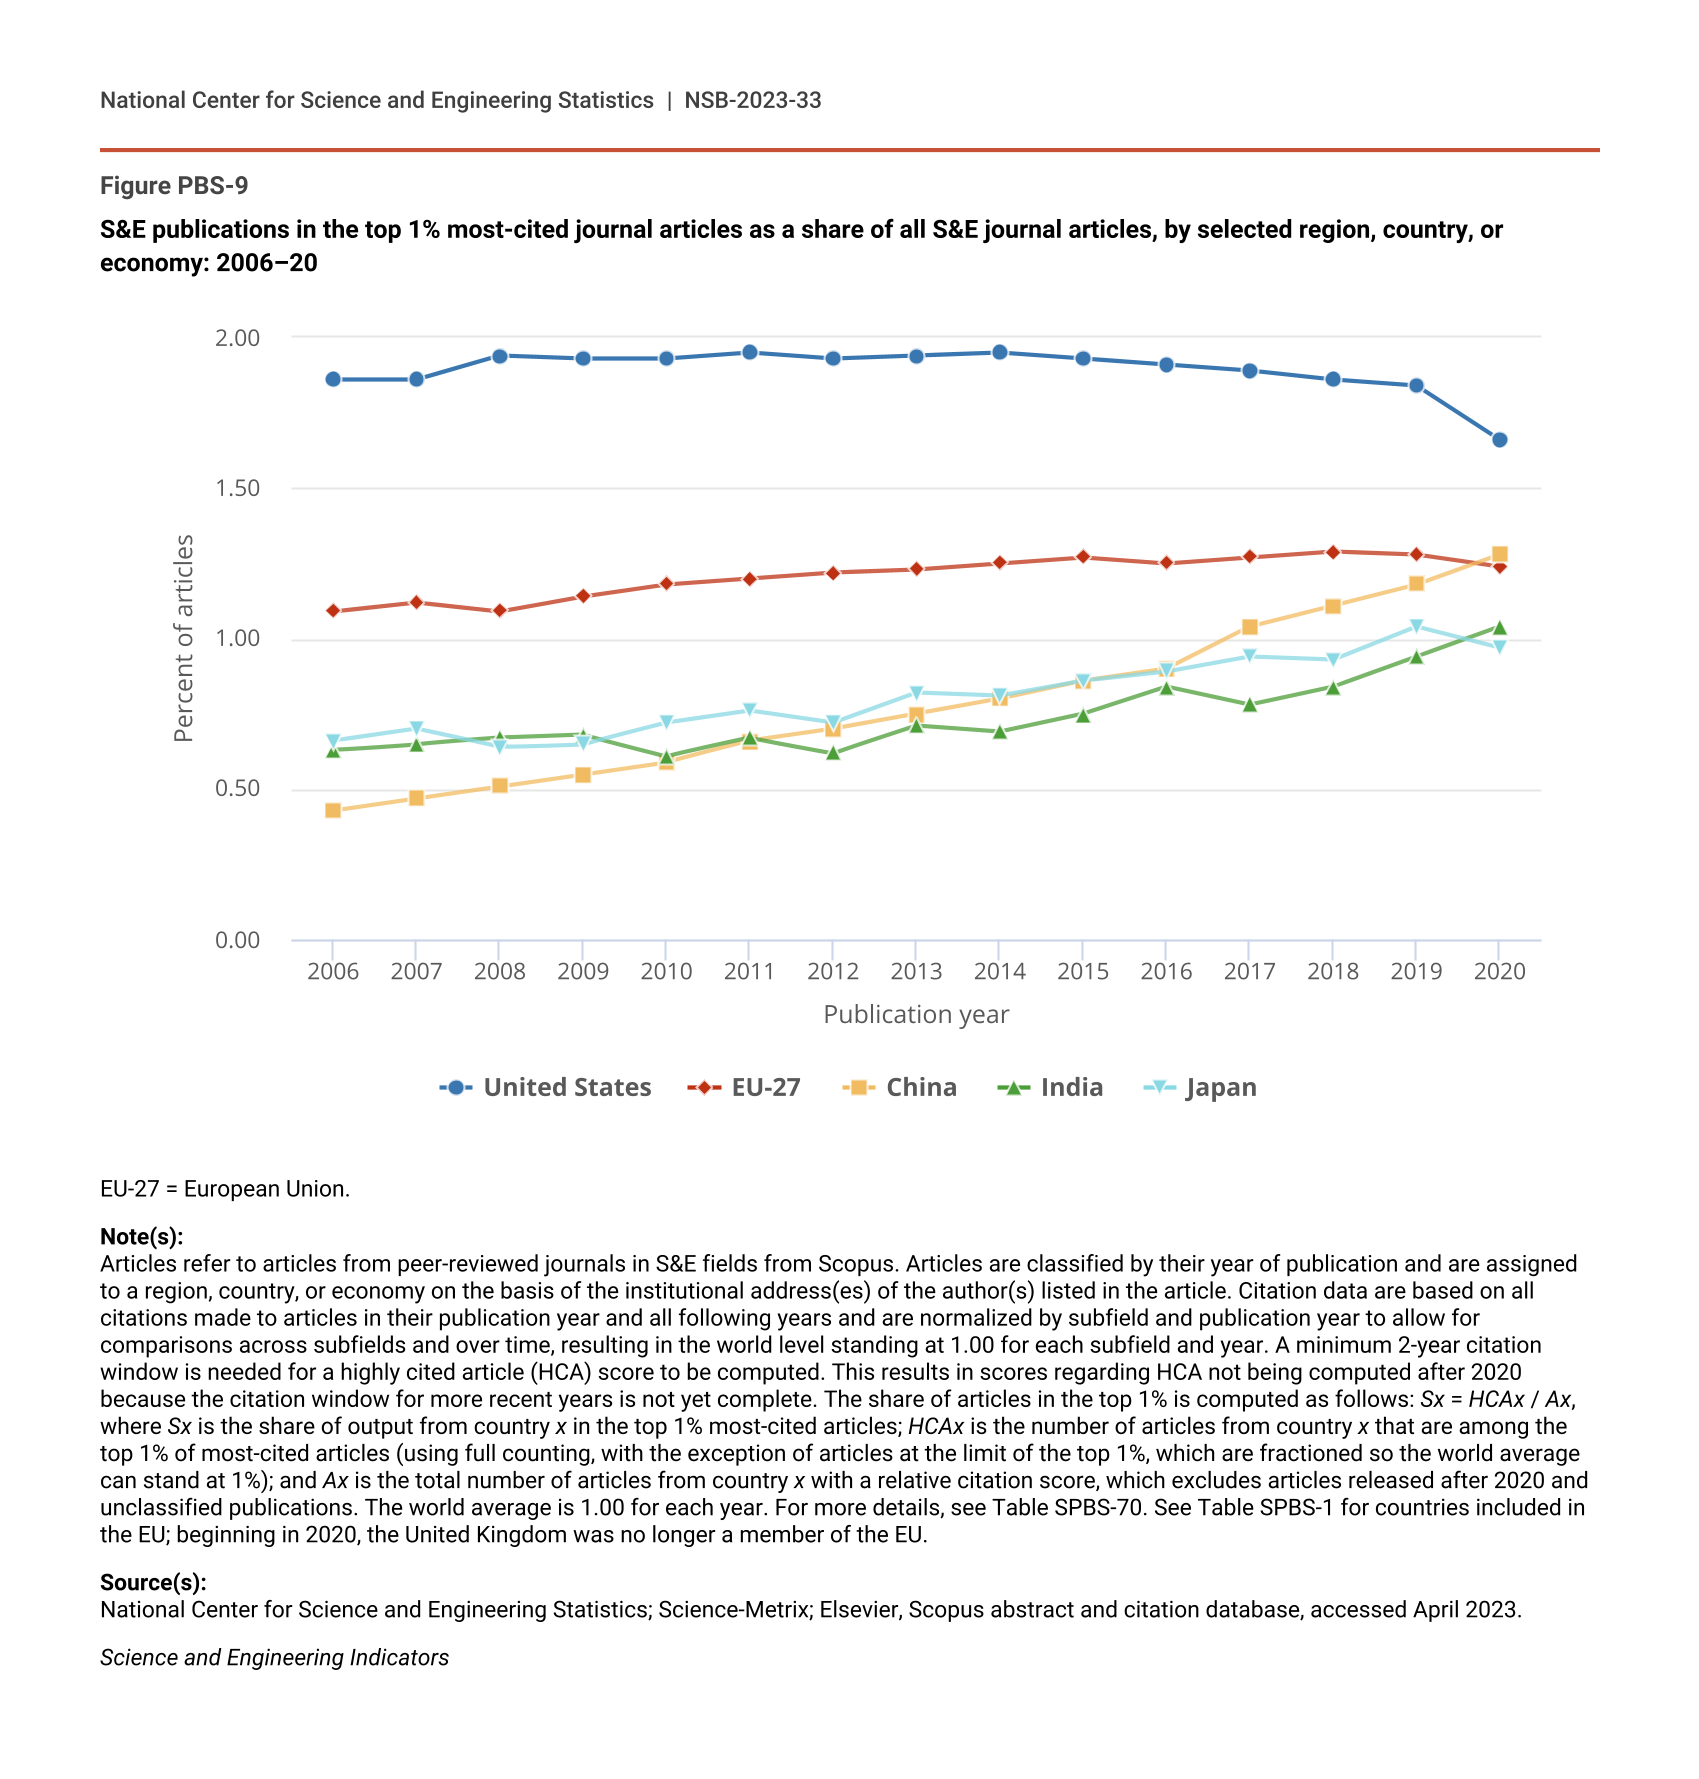
For 2020, 1.7% of U.S. scholarly publications with U.S. authors were on the HCA list, showing that the United States generates a disproportionate share of those articles (Figure PBS-9). The HCA share for the United States had stayed above 1.9% in each year from 2008 through 2016. The nation’s HCA share has declined each year since 2014 and stands at its lowest level since 2006.
S&E publications in the top 1% most-cited journal articles as a share of all S&E journal articles, by selected region, country, or economy: 2006–20
| Publication year | United States | EU-27 | China | India | Japan |
|---|---|---|---|---|---|
| 2006 | 1.86 | 1.09 | 0.43 | 0.63 | 0.66 |
| 2007 | 1.86 | 1.12 | 0.47 | 0.65 | 0.70 |
| 2008 | 1.94 | 1.09 | 0.51 | 0.67 | 0.64 |
| 2009 | 1.93 | 1.14 | 0.55 | 0.68 | 0.65 |
| 2010 | 1.93 | 1.18 | 0.59 | 0.61 | 0.72 |
| 2011 | 1.95 | 1.20 | 0.66 | 0.67 | 0.76 |
| 2012 | 1.93 | 1.22 | 0.70 | 0.62 | 0.72 |
| 2013 | 1.94 | 1.23 | 0.75 | 0.71 | 0.82 |
| 2014 | 1.95 | 1.25 | 0.80 | 0.69 | 0.81 |
| 2015 | 1.93 | 1.27 | 0.86 | 0.75 | 0.86 |
| 2016 | 1.91 | 1.25 | 0.90 | 0.84 | 0.89 |
| 2017 | 1.89 | 1.27 | 1.04 | 0.78 | 0.94 |
| 2018 | 1.86 | 1.29 | 1.11 | 0.84 | 0.93 |
| 2019 | 1.84 | 1.28 | 1.18 | 0.94 | 1.04 |
| 2020 | 1.66 | 1.24 | 1.28 | 1.04 | 0.97 |
EU-27 = European Union.
Note(s):
Articles refer to articles from peer-reviewed journals in S&E fields from Scopus. Articles are classified by their year of publication and are assigned to a region, country, or economy on the basis of the institutional address(es) of the author(s) listed in the article. Citation data are based on all citations made to articles in their publication year and all following years and are normalized by subfield and publication year to allow for comparisons across subfields and over time, resulting in the world level standing at 1.00 for each subfield and year. A minimum 2-year citation window is needed for a highly cited article (HCA) score to be computed. This results in scores regarding HCA not being computed after 2020 because the citation window for more recent years is not yet complete. The share of articles in the top 1% is computed as follows: Sx = HCAx / Ax, where Sx is the share of output from country x in the top 1% most-cited articles; HCAx is the number of articles from country x that are among the top 1% of most-cited articles (using full counting, with the exception of articles at the limit of the top 1%, which are fractioned so the world average can stand at 1%); and Ax is the total number of articles from country x with a relative citation score, which excludes articles released after 2020 and unclassified publications. The world average is 1.00 for each year. For more details, see Table SPBS-70. See Table SPBS-1 for countries included in the EU; beginning in 2020, the United Kingdom was no longer a member of the EU.
Source(s):
National Center for Science and Engineering Statistics; Science-Metrix; Elsevier, Scopus abstract and citation database, accessed April 2023.
Science and Engineering Indicators
In contrast, China’s HCA share has increased in each of the past 15 years, rising from 0.4% in 2006 to 1.3% in 2020 (Figure PBS-9). The disparity in HCA shares between the United States and China has decreased steadily since 2008. One factor that may affect this trend is the increase in the number of publications with U.S. and Chinese coauthors, discussed in the section International Collaboration Patterns. Any such articles in the 1% of the most highly cited publications in a given year would be credited toward the HCA shares of both countries. Given that on a whole-count basis, China produced more scientific articles than the United States in 2020, this convergence appears to represent a consistent increase in the scientific impact of publications with Chinese authors (Table SPBS-17).
China’s HCA share in 2020 exceeded that of the EU-27 region for the first time (Figure PBS-9). The collective HCA share for the EU-27 has stayed at or above 1.2% since 2010. The HCA share of Japan, another major contributor to the world’s scientific literature, has tended to lag behind the overall global HCA share. Japan’s HCA share reached 1.0% in 2019 for the first time since at least 2006 and maintained that level in 2020. India’s HCA share matched the global HCA share in 2020 for the first time, reaching 1.0%. Note that scientists who publish predominantly in non-English-language journals may receive lower citations in general because the language barrier could limit the readership of their articles in the international community (Di Bitetti and Ferreras 2016).
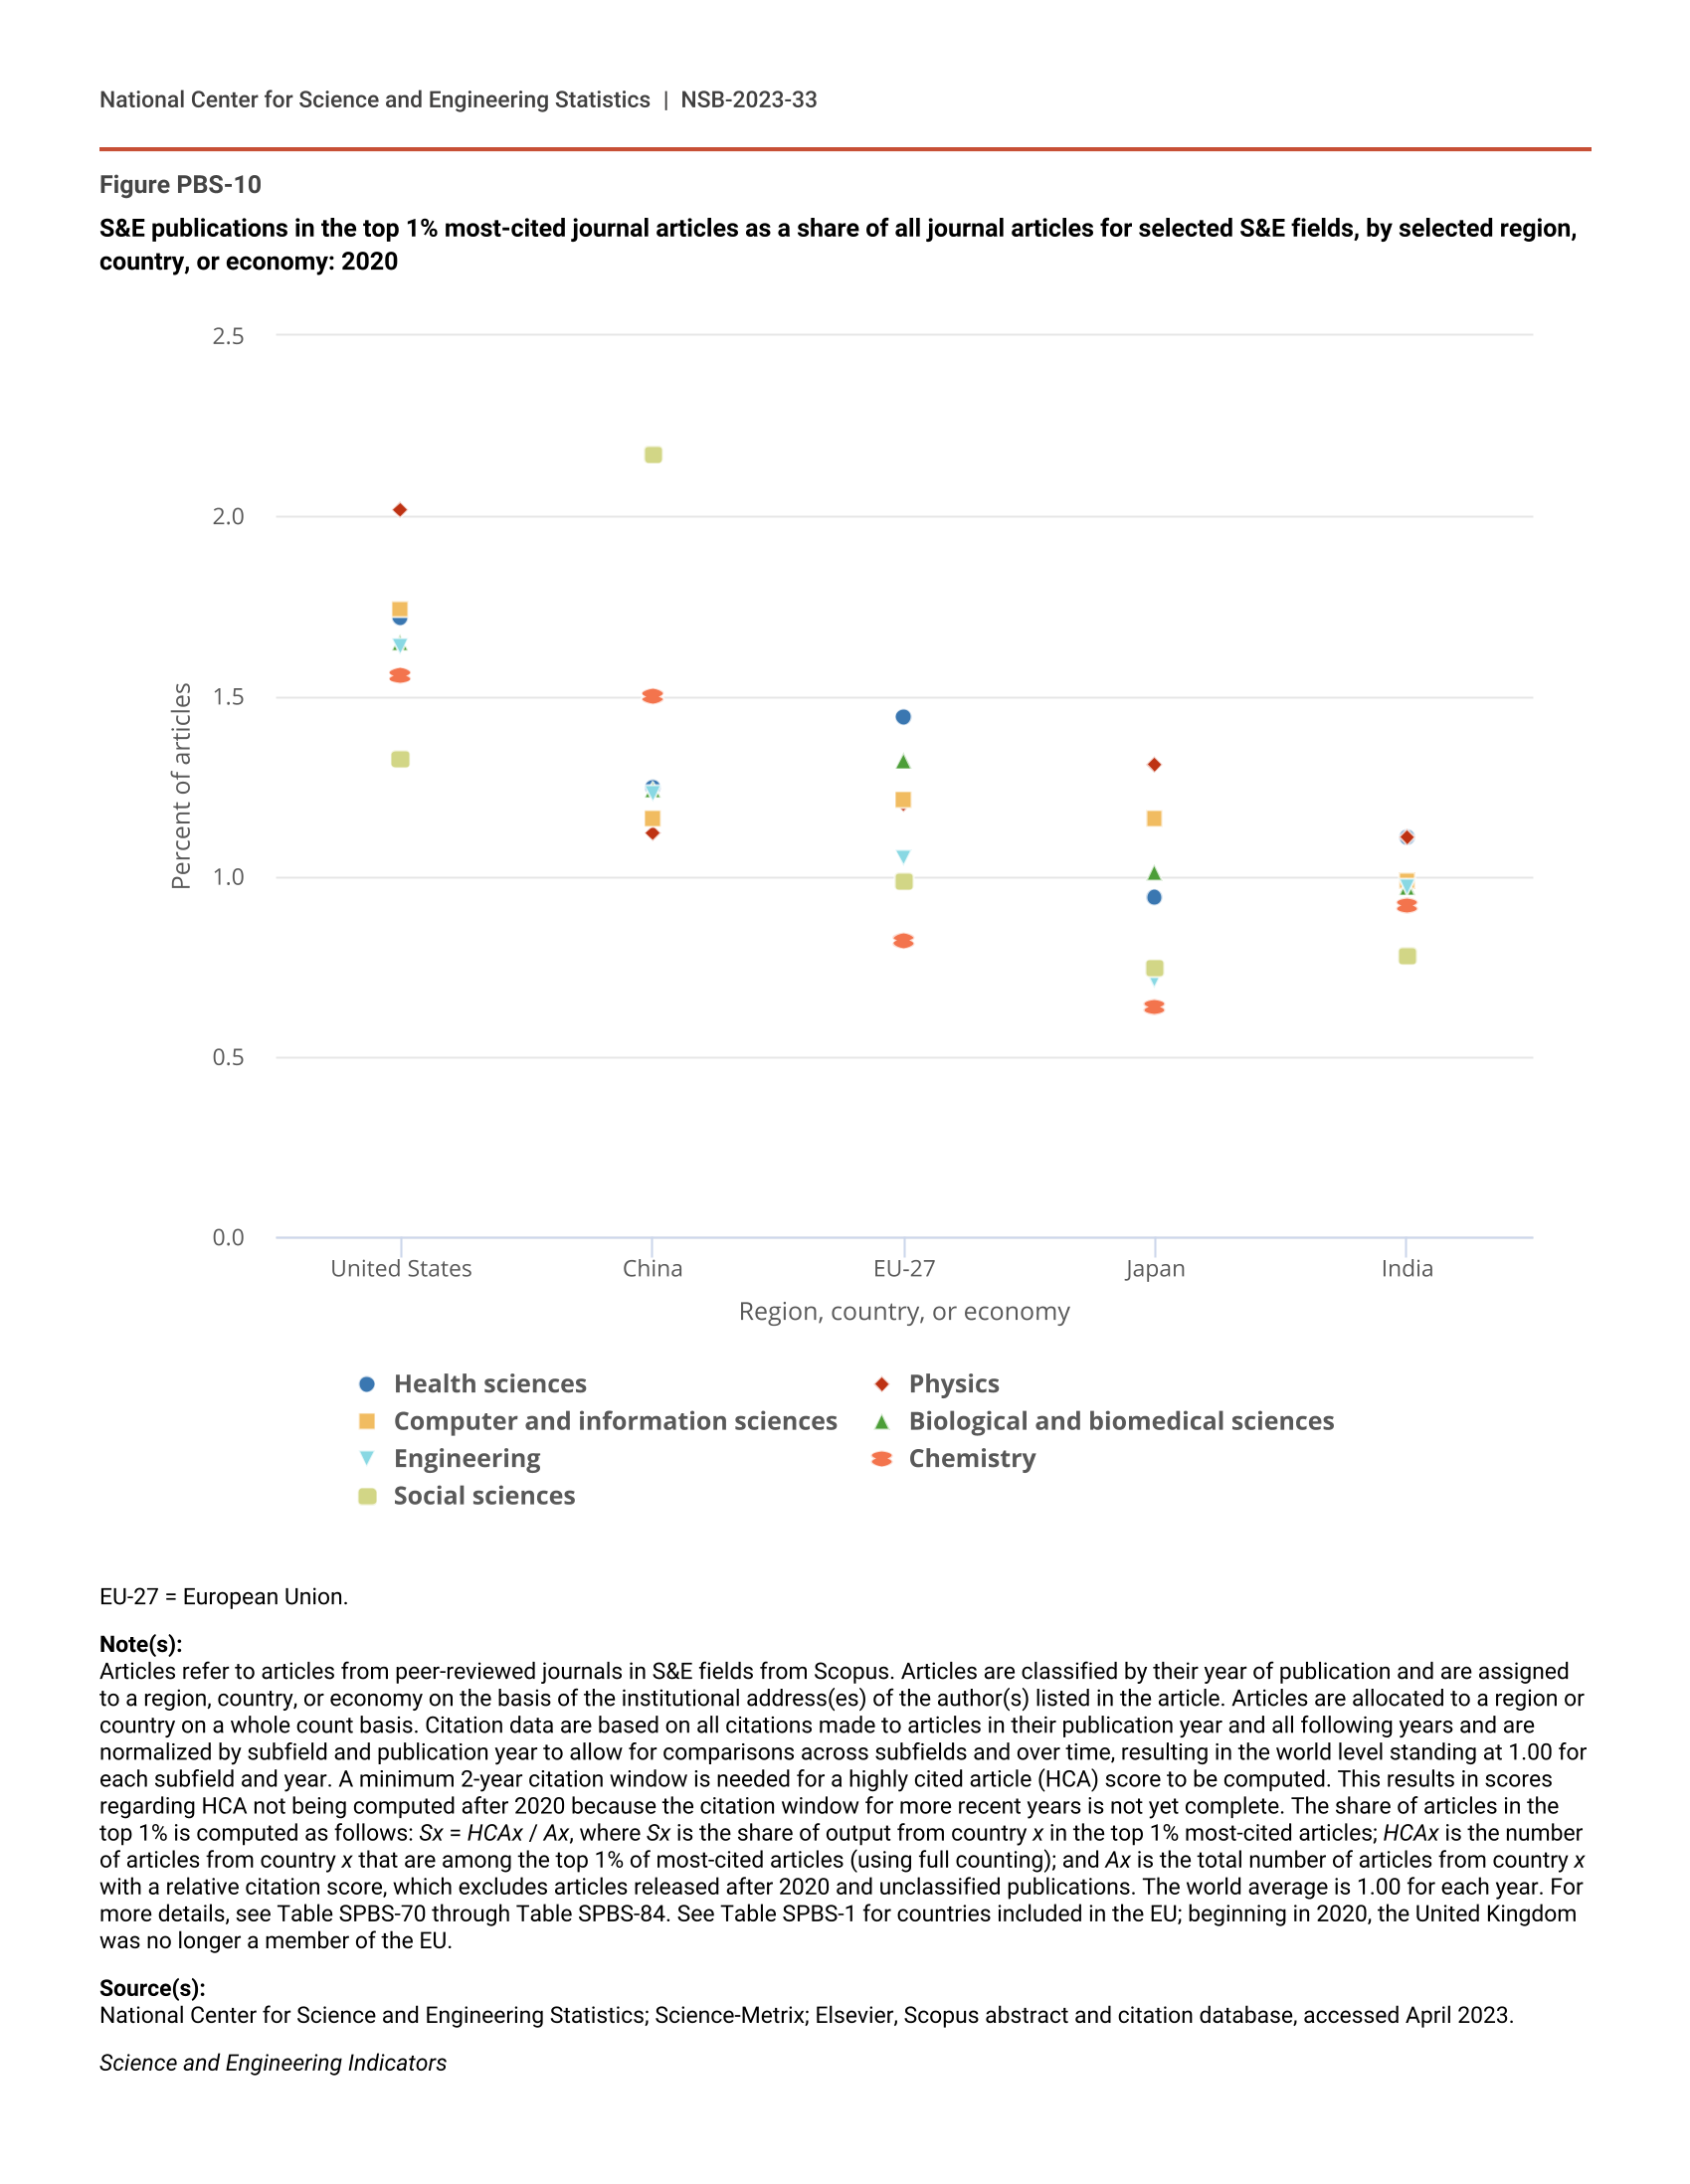
Figure PBS-10 shows the field-specific HCA shares of the five regions, countries, or economies with the largest number of scientific publications in 2022, focusing on the fields representing the largest share of scientific articles in 2020 (Table SPBS-3 through Table SPBS-16). This figure illustrates how national scientific impact varies by discipline. HCA shares by whole count for all regions, countries, and economies across all fields are provided in Table SPBS-72 through Table SPBS-85.
S&E publications in the top 1% most-cited journal articles as a share of all journal articles for selected S&E fields, by selected region, country, or economy: 2020
| Region, country, or economy | Health sciences | Physics | Computer and information sciences | Biological and biomedical sciences | Engineering | Chemistry | Social sciences |
|---|---|---|---|---|---|---|---|
| United States | 1.72 | 2.02 | 1.74 | 1.65 | 1.64 | 1.56 | 1.33 |
| China | 1.25 | 1.12 | 1.16 | 1.24 | 1.23 | 1.50 | 2.17 |
| EU-27 | 1.44 | 1.20 | 1.21 | 1.32 | 1.05 | 0.82 | 0.99 |
| Japan | 0.94 | 1.31 | 1.16 | 1.01 | 0.71 | 0.64 | 0.75 |
| India | 1.11 | 1.11 | 0.99 | 0.97 | 0.97 | 0.92 | 0.78 |
EU-27 = European Union.
Note(s):
Articles refer to articles from peer-reviewed journals in S&E fields from Scopus. Articles are classified by their year of publication and are assigned to a region, country, or economy on the basis of the institutional address(es) of the author(s) listed in the article. Articles are allocated to a region or country on a whole count basis. Citation data are based on all citations made to articles in their publication year and all following years and are normalized by subfield and publication year to allow for comparisons across subfields and over time, resulting in the world level standing at 1.00 for each subfield and year. A minimum 2-year citation window is needed for a highly cited article (HCA) score to be computed. This results in scores regarding HCA not being computed after 2020 because the citation window for more recent years is not yet complete. The share of articles in the top 1% is computed as follows: Sx = HCAx / Ax, where Sx is the share of output from country x in the top 1% most-cited articles; HCAx is the number of articles from country x that are among the top 1% of most-cited articles (using full counting); and Ax is the total number of articles from country x with a relative citation score, which excludes articles released after 2020 and unclassified publications. The world average is 1.00 for each year. For more details, see Table SPBS-70 through Table SPBS-84. See Table SPBS-1 for countries included in the EU; beginning in 2020, the United Kingdom was no longer a member of the EU.
Source(s):
National Center for Science and Engineering Statistics; Science-Metrix; Elsevier, Scopus abstract and citation database, accessed April 2023.
Science and Engineering Indicators
In the United States, physics had the highest share of publications in 2020 designated as HCAs (Figure PBS-10). Other fields in which the United States had a high HCA share were geosciences, atmospheric sciences, and ocean sciences and materials science (Table SPBS-77 and Table SPBS-79). Note that physics is not a dominant field in the United States in terms of number of publications (Figure PBS-5). For China, the social sciences had the highest share of articles designated as HCAs in 2020 (Figure PBS-10), although that field accounts for a relatively small share of China’s total publications (see Figure PBS-6). The EU-27 region demonstrated higher relative impact in articles in health sciences, as well as geosciences (Figure PBS-10; Table SPBS-77). In Japan, publications in the fields of astronomy and astrophysics, geosciences, and physics showed high HCA shares (Figure PBS-10; Table SPBS-72 and Table SPBS-77). India showed relatively higher impact in physics than in other fields and had particularly notable impact in astronomy and astrophysics (Figure PBS-10; Table SPBS-72).
Impact and Open Access
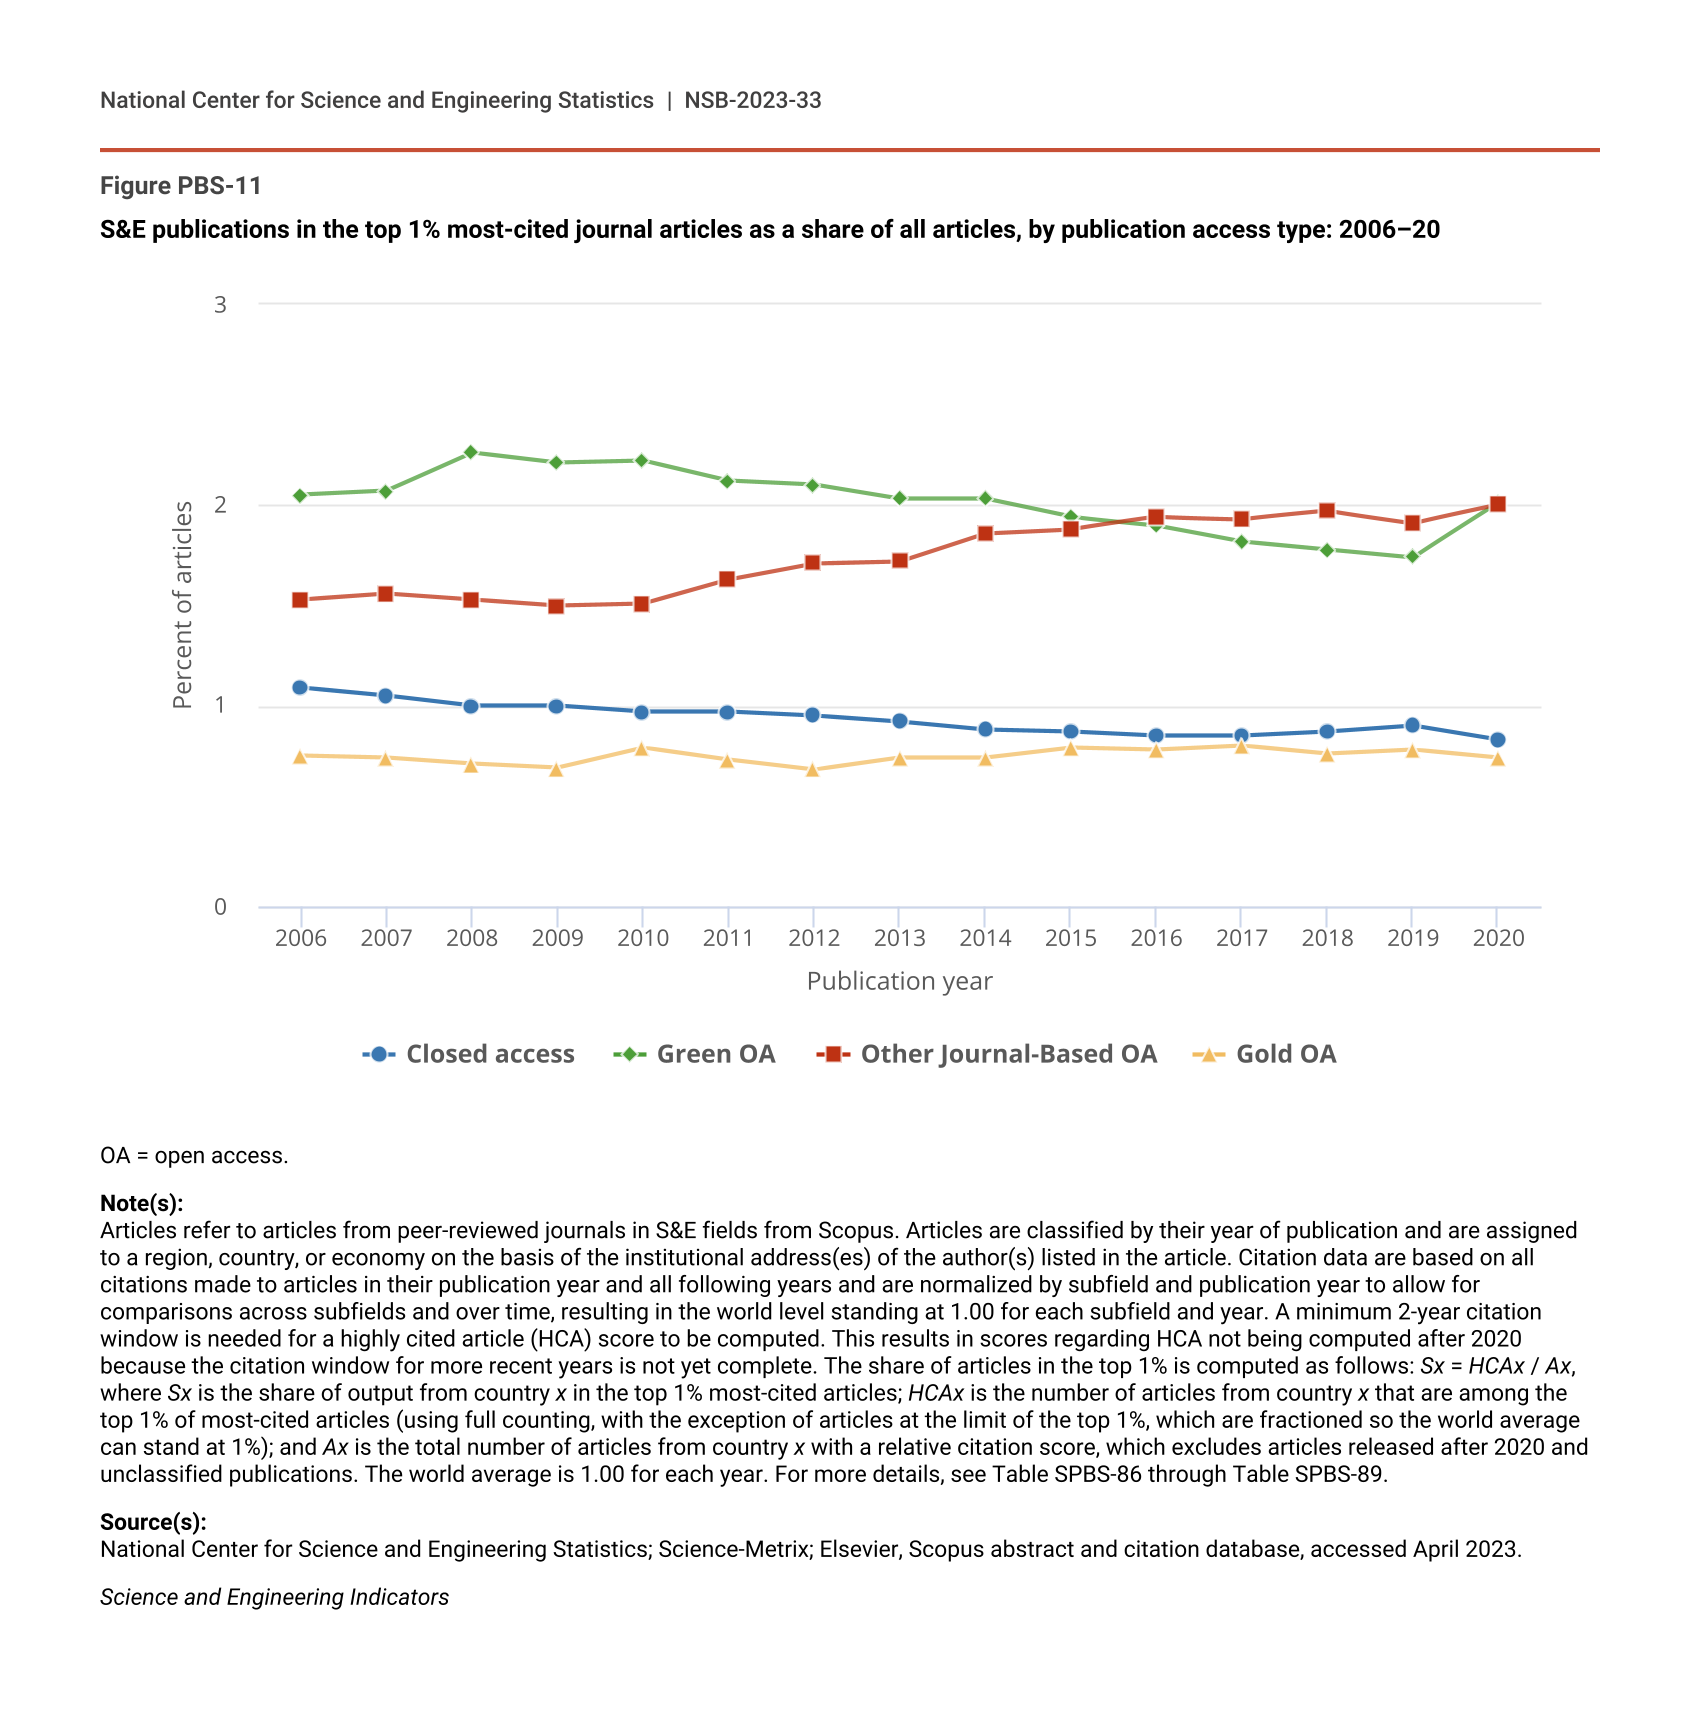
As discussed earlier, the share of scientific articles published as OA has increased dramatically since 2012 (Figure PBS-8). Researchers have suggested that OA articles have a greater potential readership than articles published in closed-access journals and therefore are more likely to have higher citation rates. A recent review of such studies showed mixed evidence for that claim (Langham-Putrow et al. 2021). Worldwide analysis of highly cited articles by publication access type also shows mixed results (Figure PBS-11). The share of articles published under closed access in the 1% of most highly cited articles per year fell from 1.1% in 2006 to 0.8% in 2020. The HCA share for Green OA journals stayed at or above 2% for most years since 2006. In contrast, the HCA share for combined Hybrid and Bronze OA journals (“Other Journal-Based OA”) rose from 1.5% in 2009 to 2% in 2020. As noted earlier, Gold OA journals now have the largest share of scientific publications by access type (Figure PBS-8). However, the HCA share for those journals has lagged behind that of the other categories for the past 15 years, staying in the 0.7%–0.8% range for most of that period. Significant publishers of Gold OA journals, such as the Multidisciplinary Digital Publishing Institute (MDPI), are increasing the number of articles published per year at a high rate, meaning that the number of articles required to meet the 1% HCA threshold is also growing rapidly.
S&E publications in the top 1% most-cited journal articles as a share of all articles, by publication access type: 2006–20
| Publication year | Closed access | Green OA | Other Journal-Based OA | Gold OA |
|---|---|---|---|---|
| 2006 | 1.09 | 2.05 | 1.53 | 0.75 |
| 2007 | 1.05 | 2.07 | 1.56 | 0.74 |
| 2008 | 1.00 | 2.26 | 1.53 | 0.71 |
| 2009 | 1.00 | 2.21 | 1.50 | 0.69 |
| 2010 | 0.97 | 2.22 | 1.51 | 0.79 |
| 2011 | 0.97 | 2.12 | 1.63 | 0.73 |
| 2012 | 0.95 | 2.10 | 1.71 | 0.68 |
| 2013 | 0.92 | 2.03 | 1.72 | 0.74 |
| 2014 | 0.88 | 2.03 | 1.86 | 0.74 |
| 2015 | 0.87 | 1.94 | 1.88 | 0.79 |
| 2016 | 0.85 | 1.90 | 1.94 | 0.78 |
| 2017 | 0.85 | 1.82 | 1.93 | 0.80 |
| 2018 | 0.87 | 1.78 | 1.97 | 0.76 |
| 2019 | 0.90 | 1.74 | 1.91 | 0.78 |
| 2020 | 0.83 | 2.01 | 2.00 | 0.74 |
OA = open access.
Note(s):
Articles refer to articles from peer-reviewed journals in S&E fields from Scopus. Articles are classified by their year of publication and are assigned to a region, country, or economy on the basis of the institutional address(es) of the author(s) listed in the article. Citation data are based on all citations made to articles in their publication year and all following years and are normalized by subfield and publication year to allow for comparisons across subfields and over time, resulting in the world level standing at 1.00 for each subfield and year. A minimum 2-year citation window is needed for a highly cited article (HCA) score to be computed. This results in scores regarding HCA not being computed after 2020 because the citation window for more recent years is not yet complete. The share of articles in the top 1% is computed as follows: Sx = HCAx / Ax, where Sx is the share of output from country x in the top 1% most-cited articles; HCAx is the number of articles from country x that are among the top 1% of most-cited articles (using full counting, with the exception of articles at the limit of the top 1%, which are fractioned so the world average can stand at 1%); and Ax is the total number of articles from country x with a relative citation score, which excludes articles released after 2020 and unclassified publications. The world average is 1.00 for each year. For more details, see Table SPBS-86 through Table SPBS-89.
Source(s):
National Center for Science and Engineering Statistics; Science-Metrix; Elsevier, Scopus abstract and citation database, accessed April 2023.
Science and Engineering Indicators
To conclude this section, when looking at trends in the articles with the highest citation rates per year, the United States produces articles that gain significant recognition after publishing at a disproportionate rate compared with global publications each year. In contrast, although China’s annual article output exceeds that of the United States, China’s articles are not as well represented among the most highly cited articles. However, the impact of articles published by Chinese authors has seen significant annual increases since 2006; as of 2020, China’s presence among the most highly cited articles exceeds that of the EU-27 and Japan.