 An official website of the United States government
 Trends in S&E Degree Awards
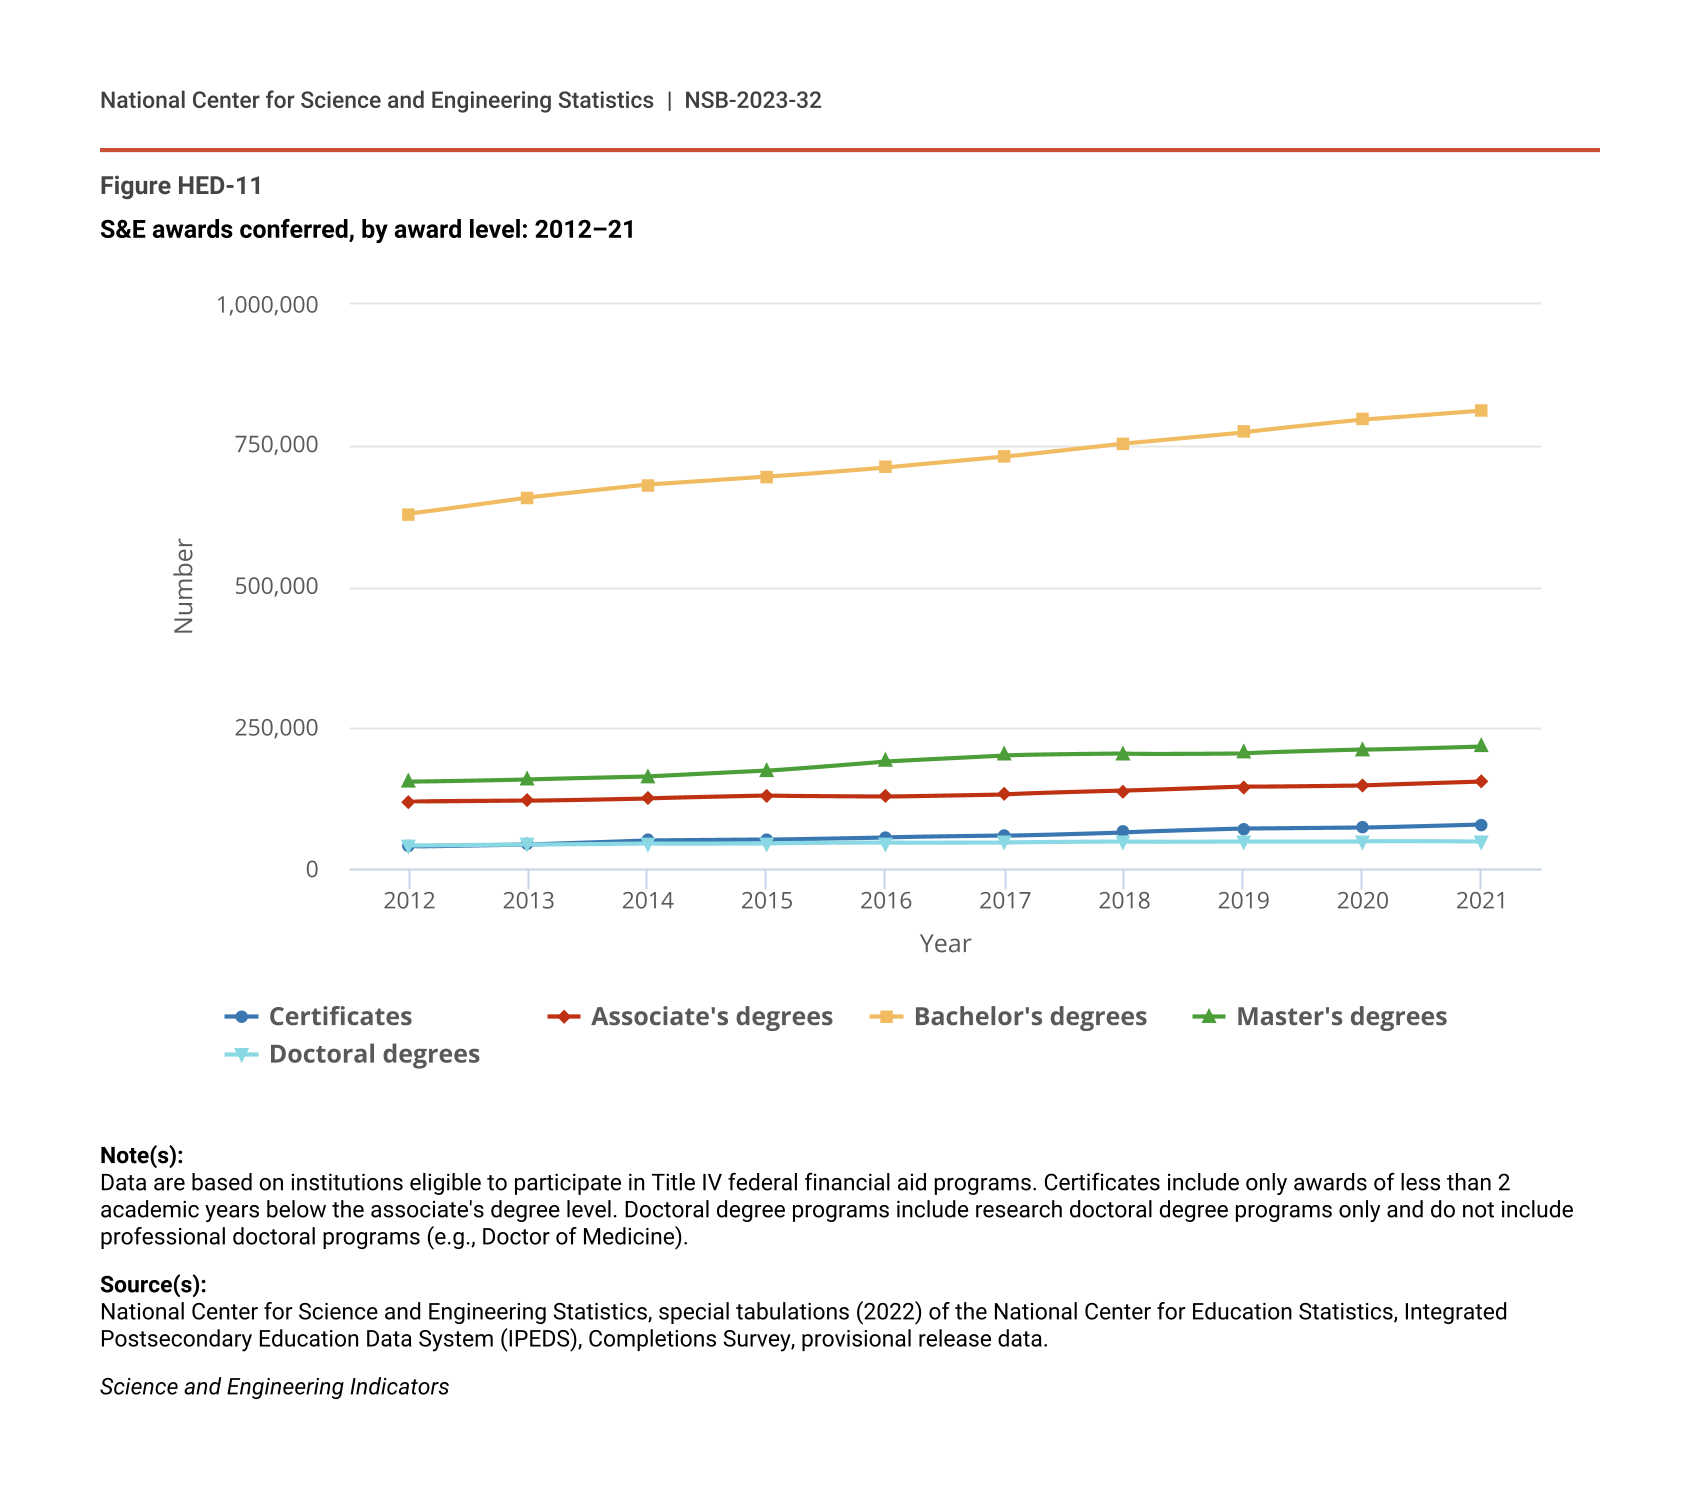
Between 2012 and 2021, the number of S&E awards conferred by U.S. postsecondary institutions increased at all levels (Figure HED-11). Proportionally, the greatest increase occurred at the certificate level: the number of S&E certificates awarded doubled from 39,000 in 2012 to 79,000 in 2021. The number of S&E associate’s degrees awarded increased by 31%, S&E bachelor’s degrees increased by 29%, S&E master’s degrees increased by 41%, and S&E doctoral degrees increased the least, by 17%. As discussed below, growth in engineering and computer and information sciences degrees accounted for much of the increase in total S&E degrees awarded at most levels.
S&E awards conferred, by award level: 2012–21
| Year | Certificates | Associate's degrees | Bachelor's degrees | Master's degrees | Doctoral degrees |
|---|---|---|---|---|---|
| 2012 | 39,476 | 118,662 | 628,836 | 154,402 | 40,878 |
| 2013 | 43,014 | 120,346 | 657,959 | 158,787 | 42,513 |
| 2014 | 50,188 | 124,916 | 680,302 | 163,584 | 44,830 |
| 2015 | 51,781 | 129,468 | 694,701 | 173,854 | 45,343 |
| 2016 | 55,929 | 128,526 | 711,624 | 191,012 | 45,936 |
| 2017 | 58,569 | 132,433 | 730,573 | 201,311 | 46,596 |
| 2018 | 64,991 | 137,984 | 754,094 | 203,441 | 47,782 |
| 2019 | 70,959 | 145,685 | 773,662 | 205,067 | 48,712 |
| 2020 | 72,881 | 148,449 | 795,235 | 210,637 | 48,984 |
| 2021 | 78,775 | 155,029 | 811,706 | 217,146 | 47,763 |
Note(s):
Data are based on institutions eligible to participate in Title IV federal financial aid programs. Certificates include only awards of less than 2 academic years below the associate's degree level. Doctoral degree programs include research doctoral degree programs only and do not include professional doctoral programs (e.g., Doctor of Medicine).
Source(s):
National Center for Science and Engineering Statistics, special tabulations (2022) of the National Center for Education Statistics, Integrated Postsecondary Education Data System (IPEDS), Completions Survey, provisional release data.
Science and Engineering Indicators
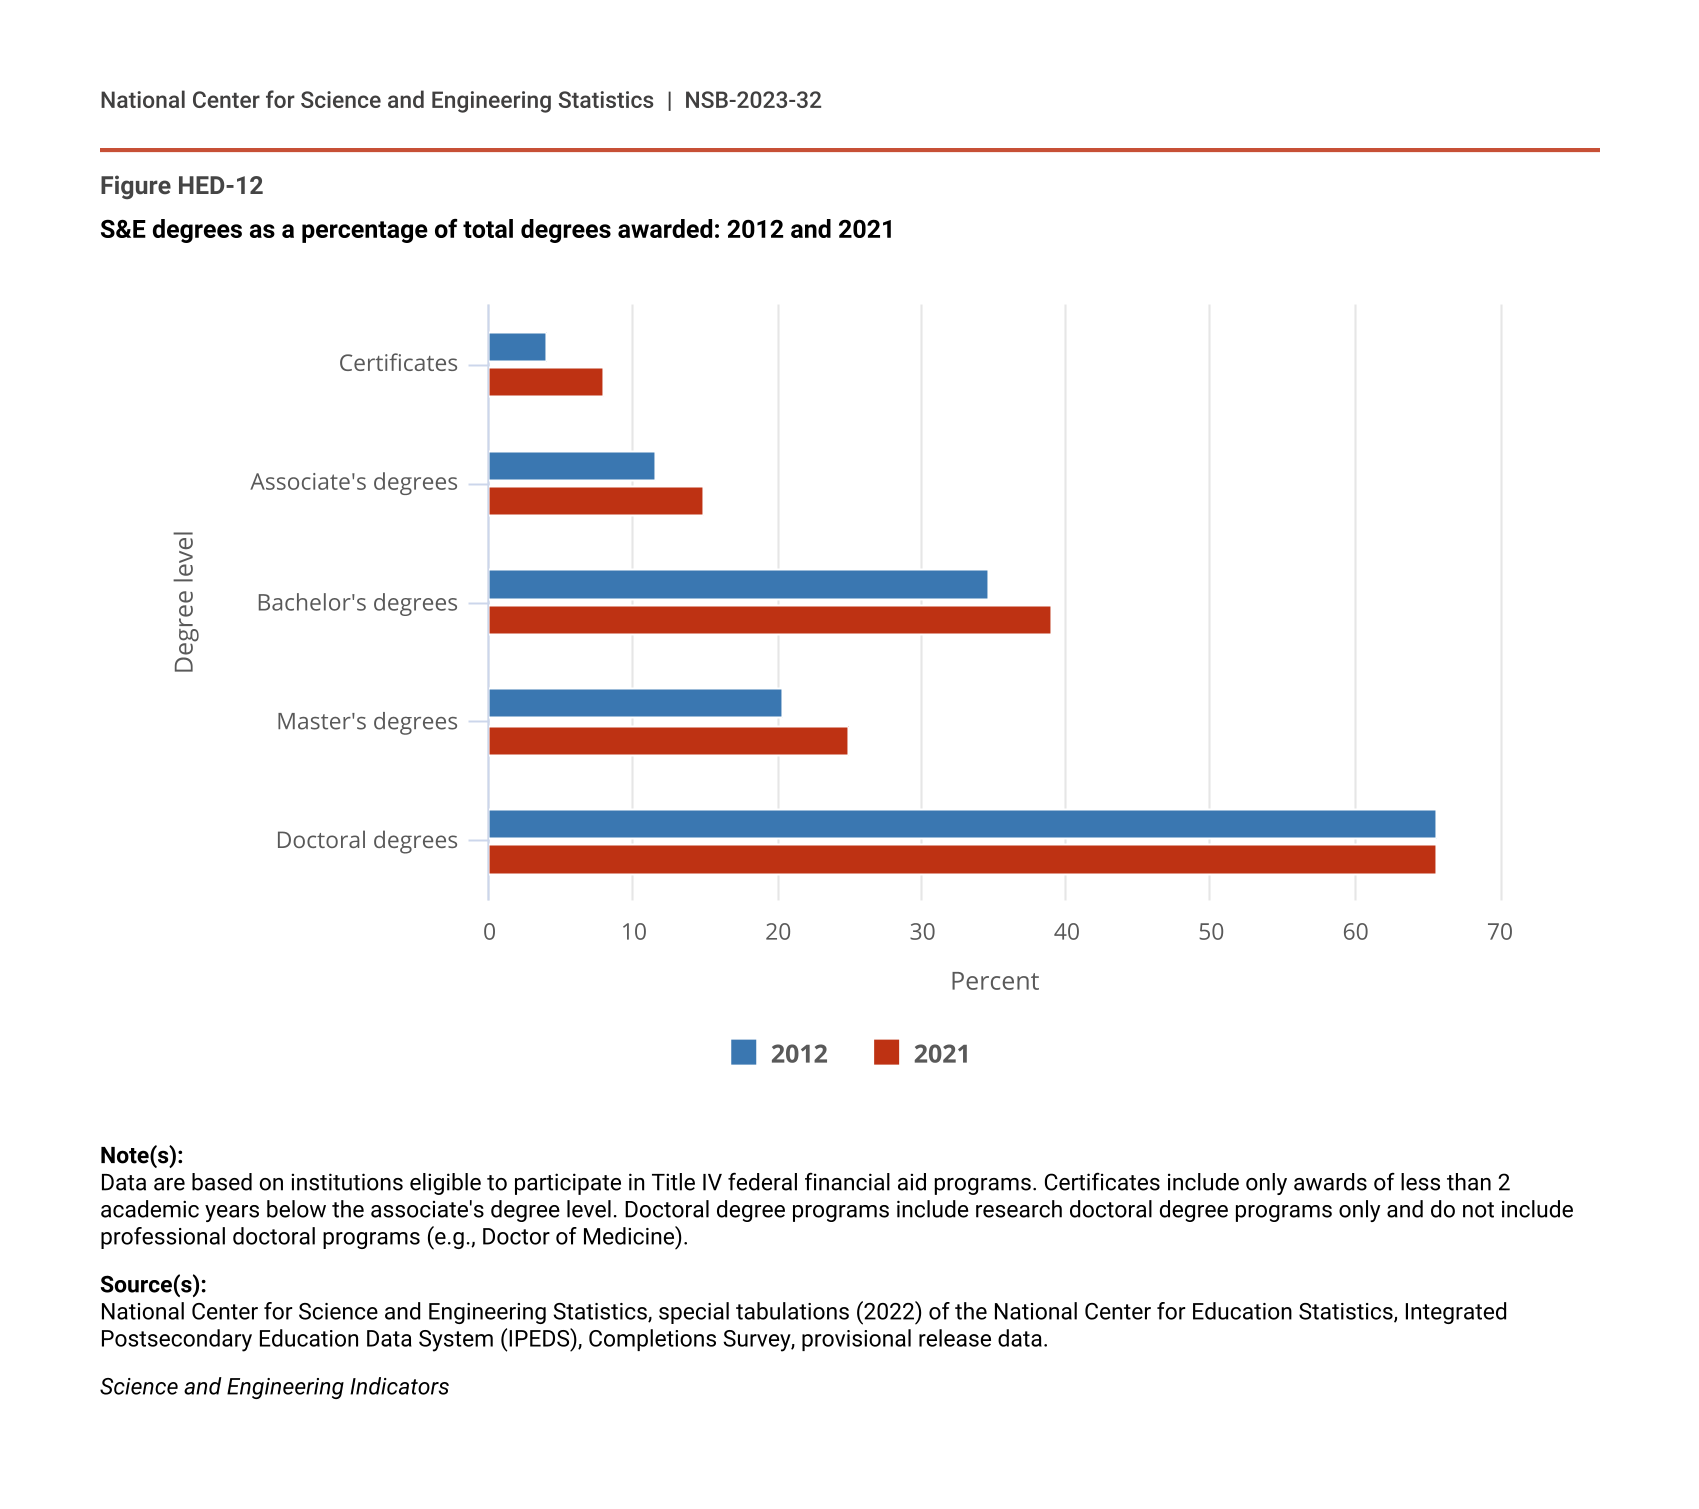
The increase in the number of S&E certificate and degree awards reflects not only a growing population of postsecondary students but also an increasing share of postsecondary awards in S&E fields of study. The share of certificates awarded in S&E fields increased at the highest rate among all award levels, doubling from 4% of all certificates awarded in 2012 to 8% in 2021 (Figure HED-12). The share of awards in S&E fields at the associate’s, bachelor’s, and master’s degree levels also increased but to a much lesser degree. Although the percentage of S&E doctorates did not increase, it remained the highest at 66%.
S&E degrees as a percentage of total degrees awarded: 2012 and 2021
| Degree level | 2012 | 2021 |
|---|---|---|
| Certificates | 4.1 | 8.0 |
| Associate's degrees | 11.6 | 14.9 |
| Bachelor's degrees | 34.7 | 38.9 |
| Master's degrees | 20.3 | 24.9 |
| Doctoral degrees | 65.7 | 65.6 |
Note(s):
Data are based on institutions eligible to participate in Title IV federal financial aid programs. Certificates include only awards of less than 2 academic years below the associate's degree level. Doctoral degree programs include research doctoral degree programs only and do not include professional doctoral programs (e.g., Doctor of Medicine).
Source(s):
National Center for Science and Engineering Statistics, special tabulations (2022) of the National Center for Education Statistics, Integrated Postsecondary Education Data System (IPEDS), Completions Survey, provisional release data.
Science and Engineering Indicators
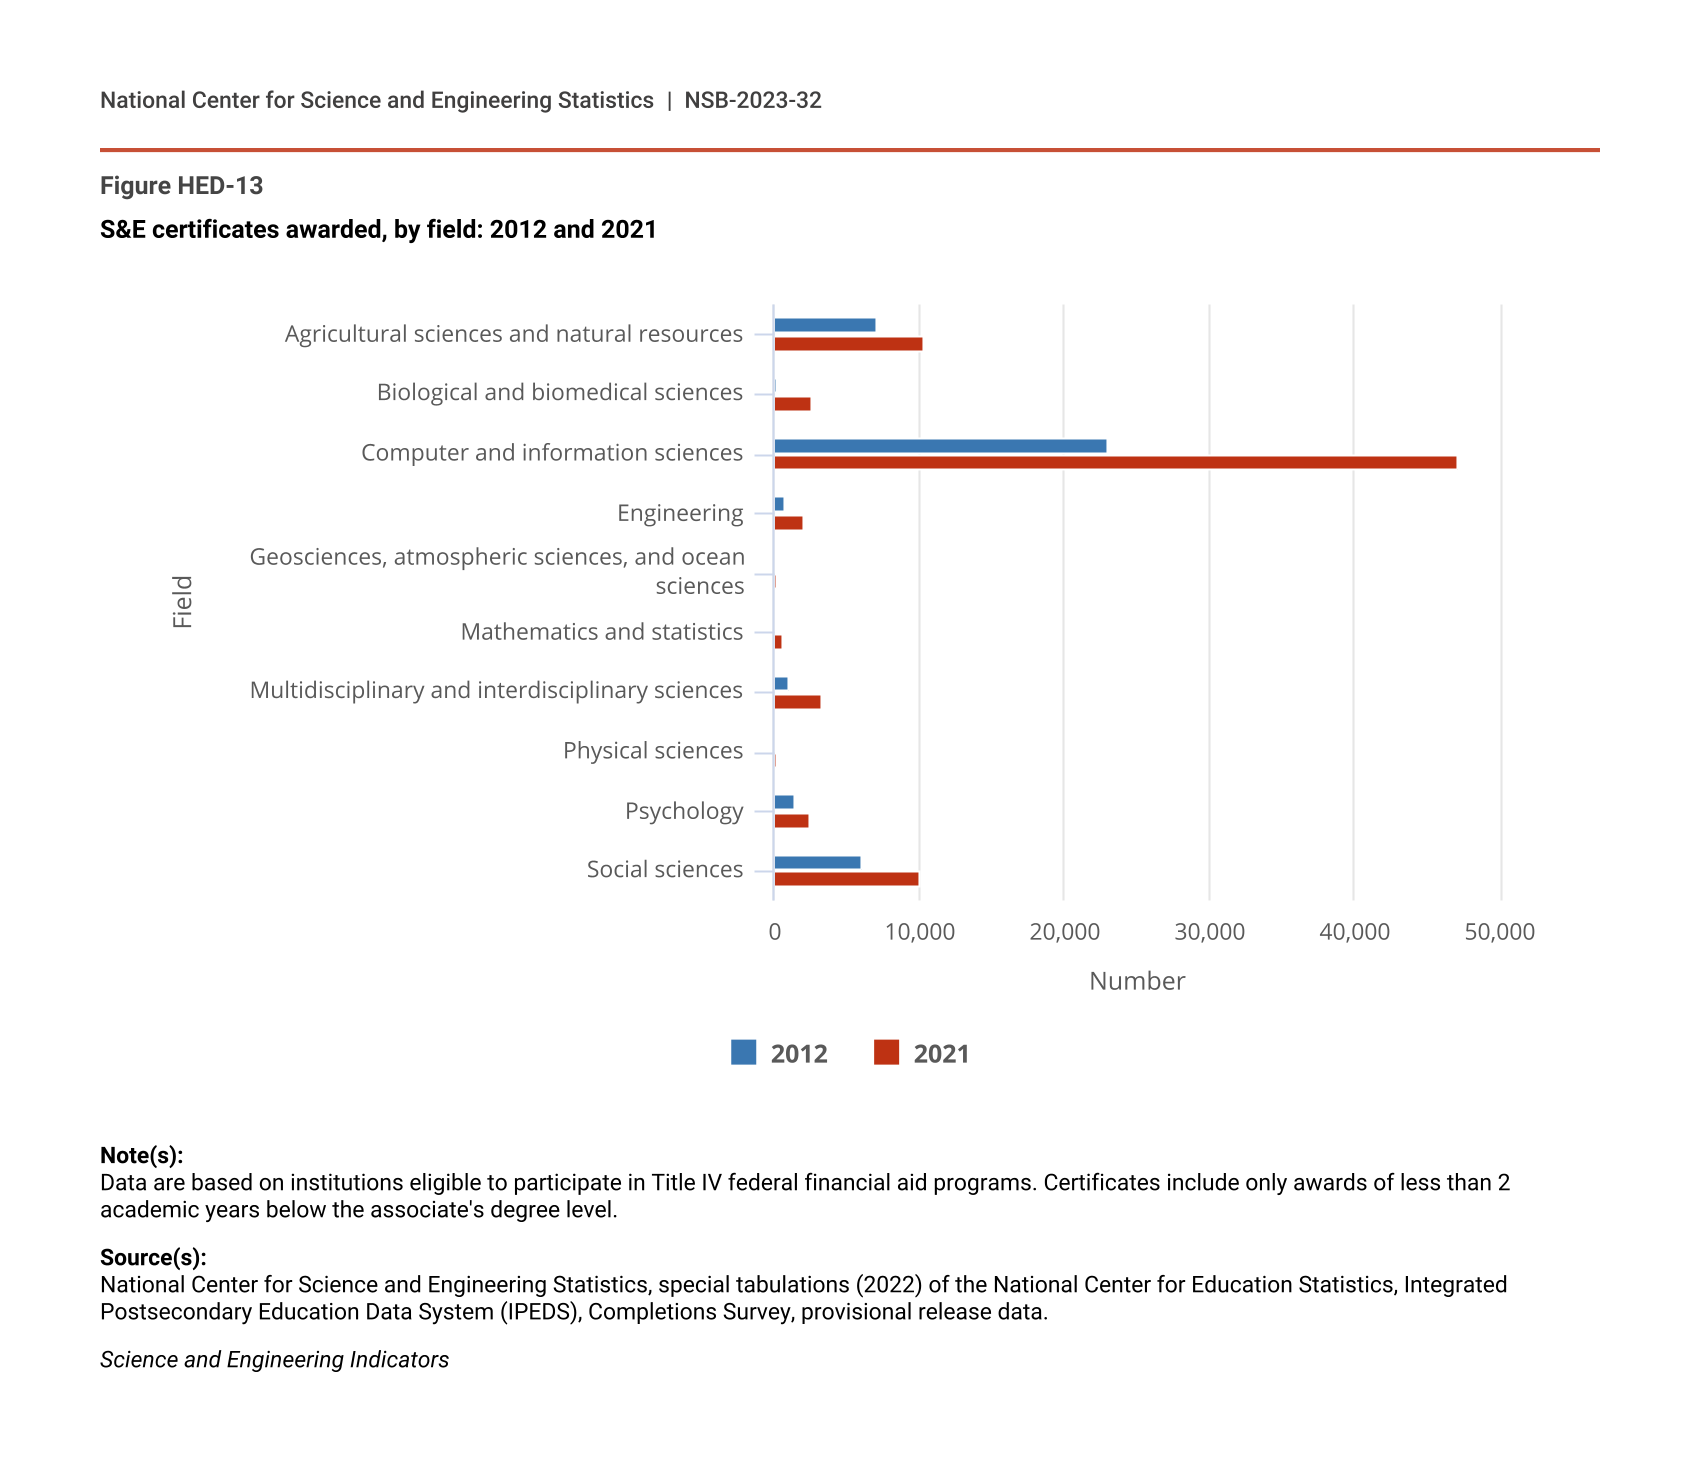
At the certificate level, the most popular S&E field among award recipients in both 2012 and 2021 was computer and information sciences. In 2012, students earned 23,000 certificates in computer and information sciences, followed by agricultural sciences and natural sciences (7,000 certificates) and social sciences (6,100 certificates) (Figure HED-13). By 2021, the number of certificates in these fields had grown but did so at different rates; the number of certificates in computer and information sciences more than doubled to 47,000 certificates, whereas agricultural sciences and natural resources certificates increased by 48%, and social sciences certificates increased by 65%.
S&E certificates awarded, by field: 2012 and 2021
| Field | 2012 | 2021 |
|---|---|---|
| Agricultural sciences and natural resources | 7,013 | 10,350 |
| Biological and biomedical sciences | 209 | 2,602 |
| Computer and information sciences | 22,952 | 47,138 |
| Engineering | 659 | 1,968 |
| Geosciences, atmospheric sciences, and ocean sciences | 26 | 136 |
| Mathematics and statistics | 56 | 525 |
| Multidisciplinary and interdisciplinary sciences | 1,047 | 3,376 |
| Physical sciences | 43 | 142 |
| Psychology | 1,391 | 2,512 |
| Social sciences | 6,080 | 10,026 |
Note(s):
Data are based on institutions eligible to participate in Title IV federal financial aid programs. Certificates include only awards of less than 2 academic years below the associate's degree level.
Source(s):
National Center for Science and Engineering Statistics, special tabulations (2022) of the National Center for Education Statistics, Integrated Postsecondary Education Data System (IPEDS), Completions Survey, provisional release data.
Science and Engineering Indicators
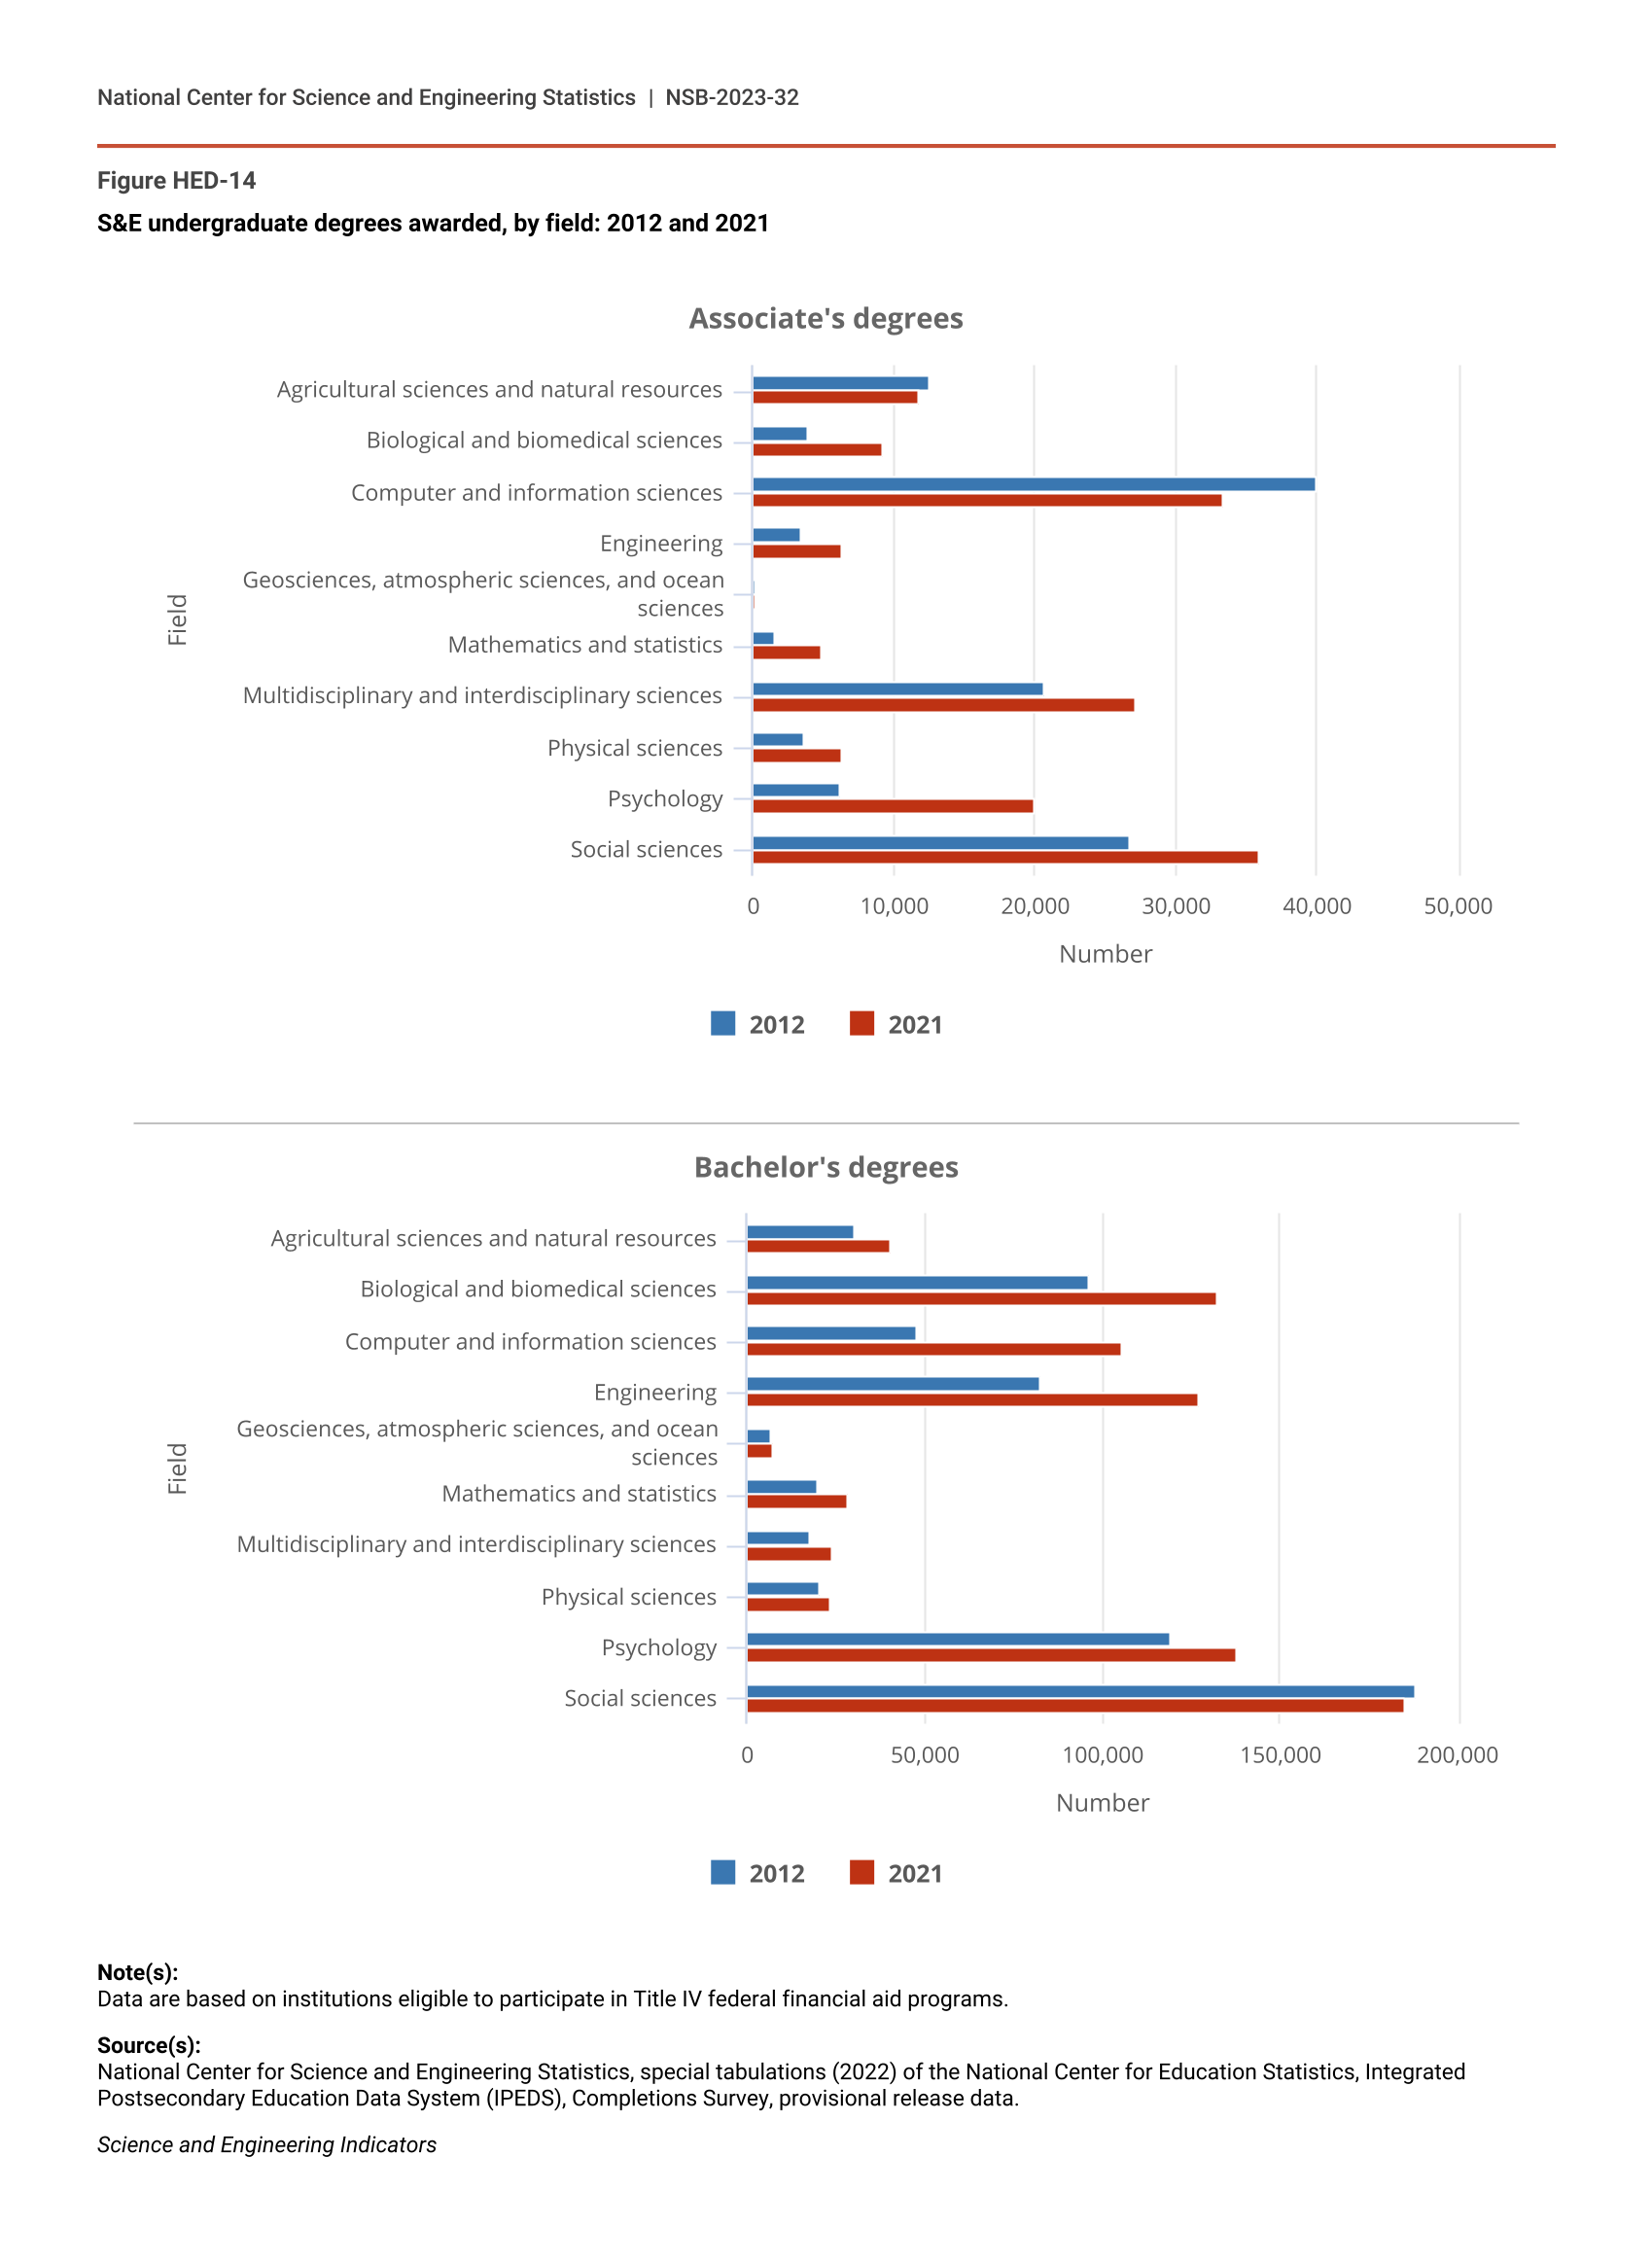
Computer and information sciences and the social sciences were also the most common S&E fields for associate’s degree awards in both 2012 and 2021, although the number of associate’s degrees awarded in computer and information sciences declined during this period (Figure HED-14). Similarly, in 2021, the most popular S&E field at the bachelor’s degree level remained the social sciences, although the number of awards had decreased since 2012. The decline in social sciences bachelor’s degrees stands out because the number of bachelor’s degrees increased in all other S&E fields during this time. The number of computer and information sciences bachelor’s degrees more than doubled over the decade, from 48,000 to 105,000.
S&E undergraduate degrees awarded, by field: 2012 and 2021
| Field | 2012 | 2021 |
|---|---|---|
| Agricultural sciences and natural resources | 12,498 | 11,821 |
| Biological and biomedical sciences | 3,870 | 9,178 |
| Computer and information sciences | 39,989 | 33,350 |
| Engineering | 3,450 | 6,330 |
| Geosciences, atmospheric sciences, and ocean sciences | 136 | 208 |
| Mathematics and statistics | 1,529 | 4,842 |
| Multidisciplinary and interdisciplinary sciences | 20,735 | 27,184 |
| Physical sciences | 3,574 | 6,298 |
| Psychology | 6,133 | 19,920 |
| Social sciences | 26,748 | 35,898 |
| Field | 2012 | 2021 |
|---|---|---|
| Agricultural sciences and natural resources | 29,984 | 40,408 |
| Biological and biomedical sciences | 96,141 | 132,392 |
| Computer and information sciences | 47,930 | 105,389 |
| Engineering | 82,520 | 127,200 |
| Geosciences, atmospheric sciences, and ocean sciences | 7,013 | 7,379 |
| Mathematics and statistics | 19,783 | 28,668 |
| Multidisciplinary and interdisciplinary sciences | 17,880 | 23,671 |
| Physical sciences | 20,517 | 23,329 |
| Psychology | 118,998 | 138,039 |
| Social sciences | 188,070 | 185,231 |
Note(s):
Data are based on institutions eligible to participate in Title IV federal financial aid programs.
Source(s):
National Center for Science and Engineering Statistics, special tabulations (2022) of the National Center for Education Statistics, Integrated Postsecondary Education Data System (IPEDS), Completions Survey, provisional release data.
Science and Engineering Indicators
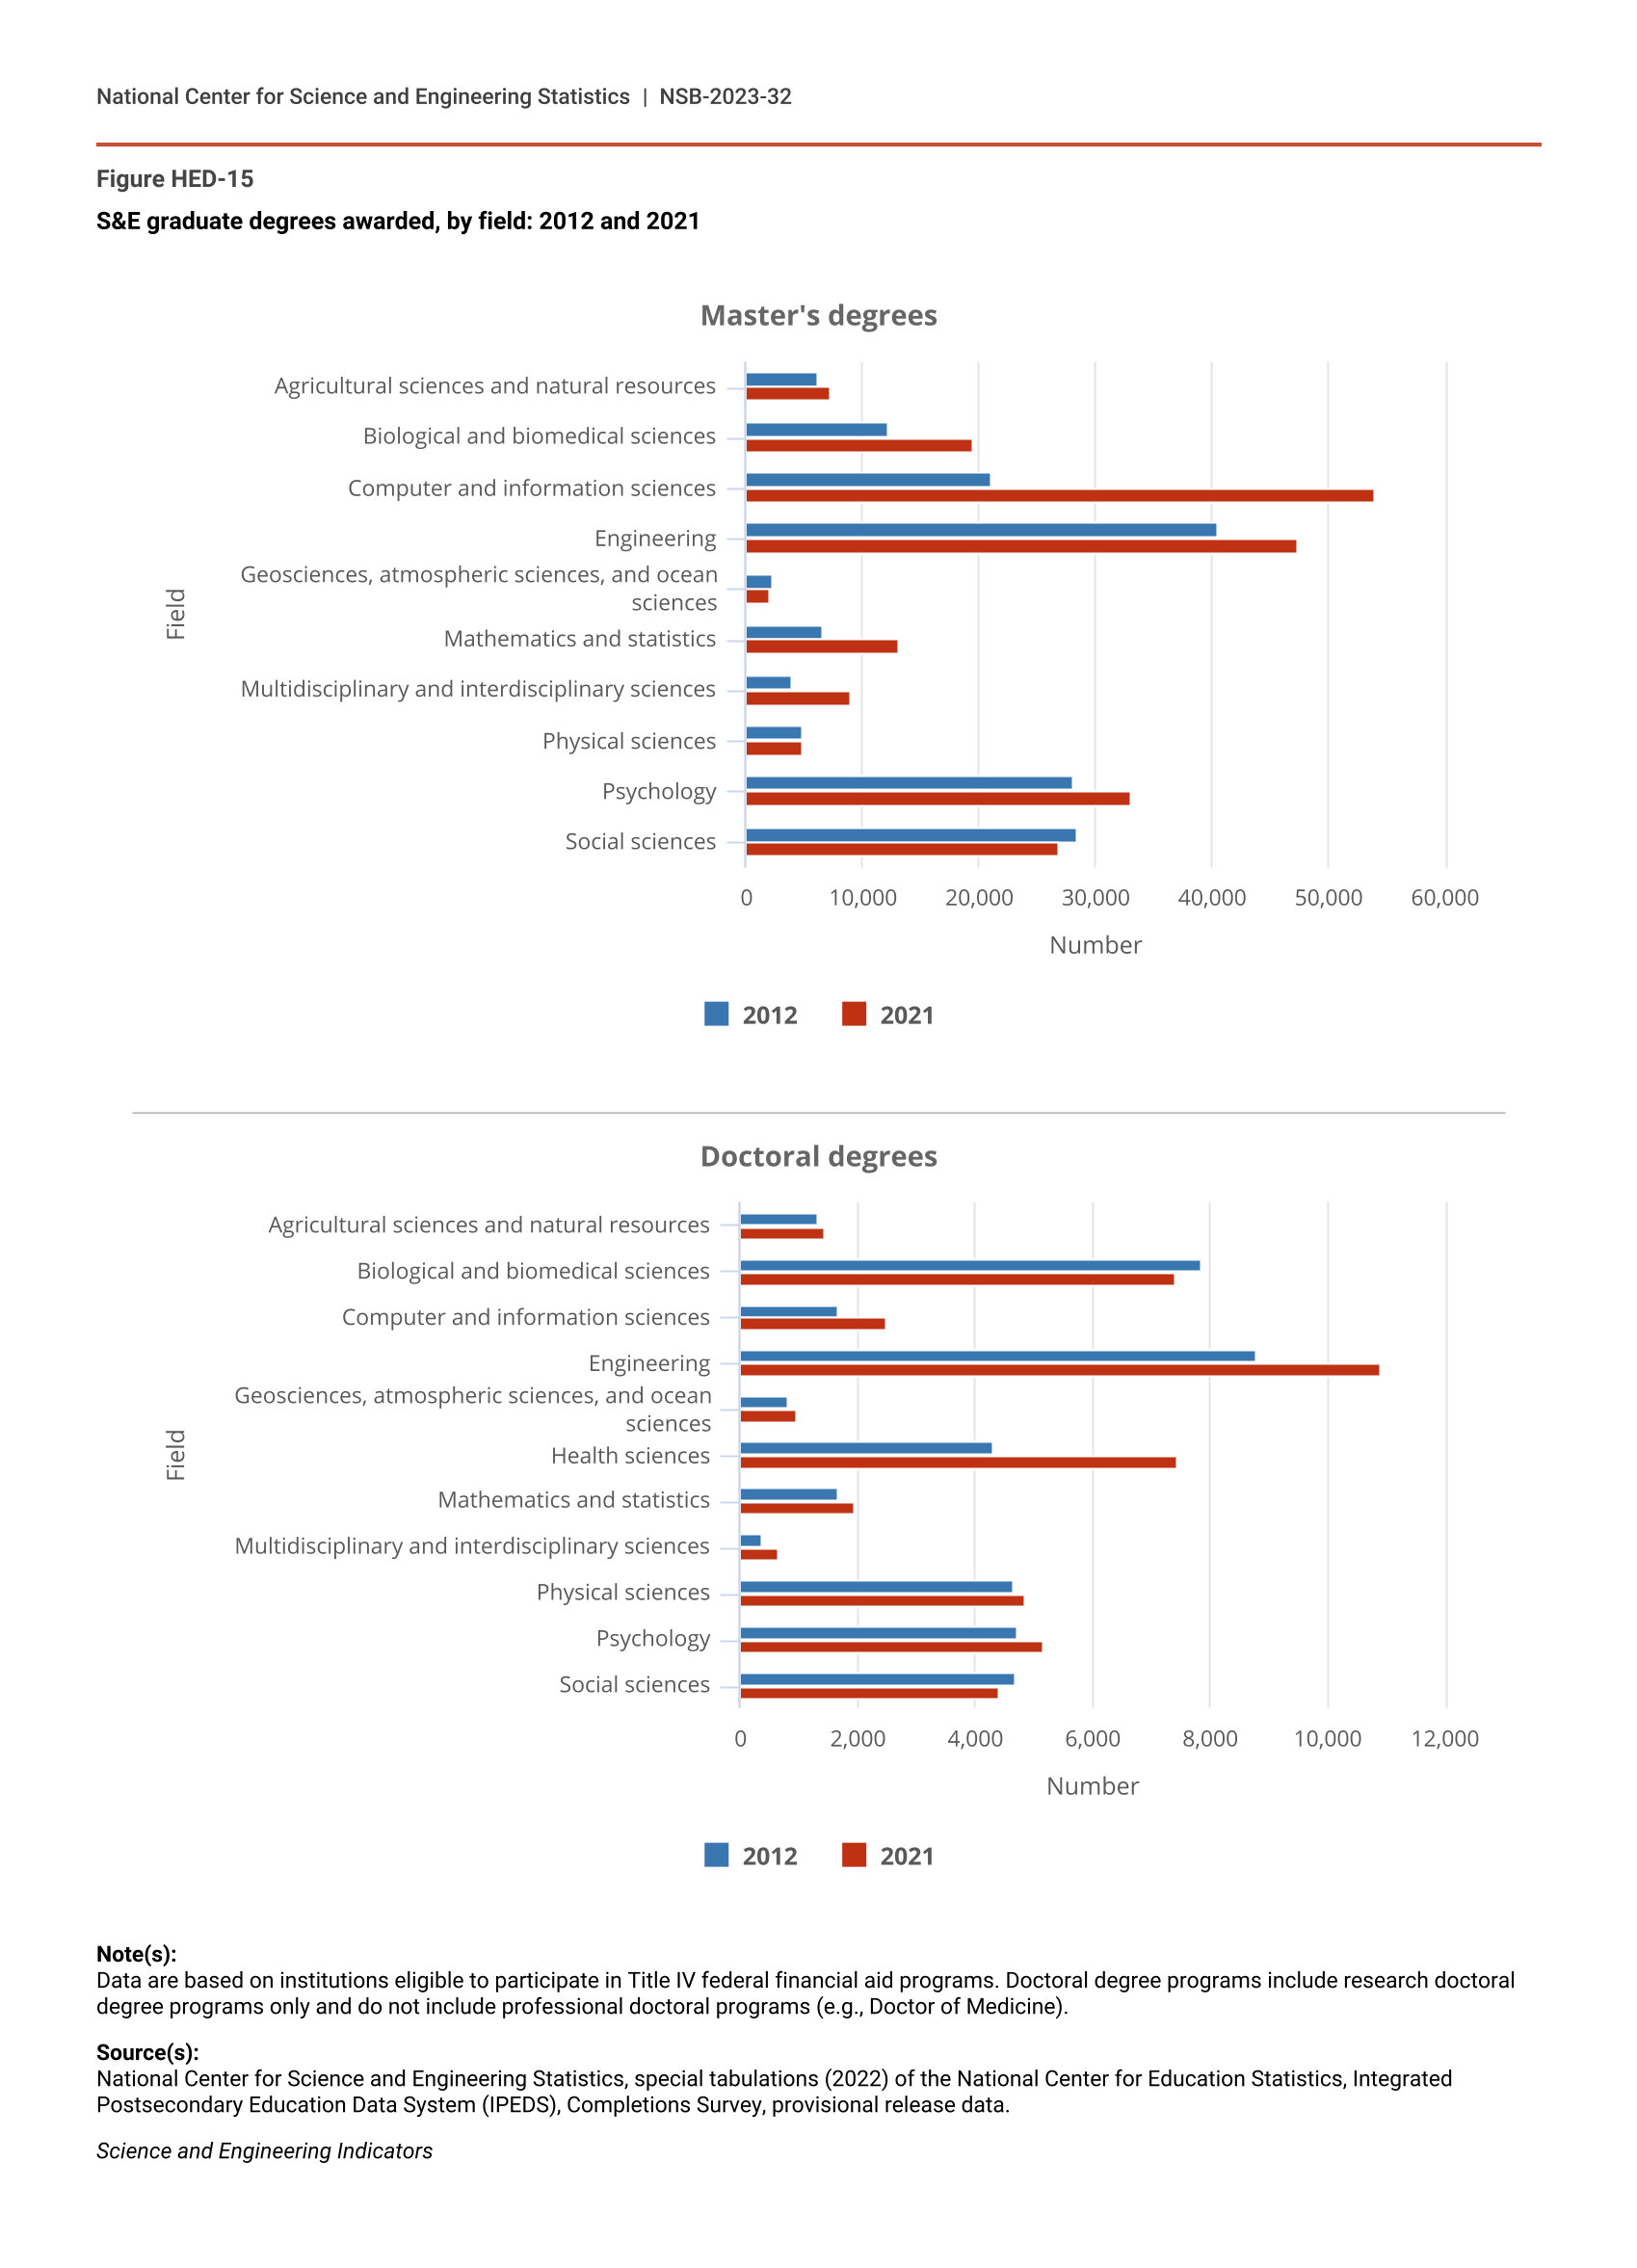
Engineering is among the most popular S&E fields for advanced degree recipients. The most popular S&E field among 2012 master’s degree recipients was engineering, but greater growth in computer and information sciences master’s degrees meant that this field had become the most prevalent S&E field among master’s degree recipients by 2021 (Figure HED-15). In contrast, relatively few doctoral degree recipients had studied computer and information sciences. Instead, the largest number of doctoral degree recipients in 2021 had studied engineering, followed by health sciences and then biological and biomedical sciences.
S&E graduate degrees awarded, by field: 2012 and 2021
| Field | 2012 | 2021 |
|---|---|---|
| Agricultural sciences and natural resources | 6,274 | 7,219 |
| Biological and biomedical sciences | 12,316 | 19,405 |
| Computer and information sciences | 21,015 | 54,026 |
| Engineering | 40,510 | 47,442 |
| Geosciences, atmospheric sciences, and ocean sciences | 2,270 | 2,145 |
| Mathematics and statistics | 6,625 | 13,019 |
| Multidisciplinary and interdisciplinary sciences | 3,922 | 8,924 |
| Physical sciences | 4,833 | 4,866 |
| Psychology | 28,117 | 33,127 |
| Social sciences | 28,520 | 26,973 |
| Field | 2012 | 2021 |
|---|---|---|
| Agricultural sciences and natural resources | 1,319 | 1,452 |
| Biological and biomedical sciences | 7,879 | 7,419 |
| Computer and information sciences | 1,690 | 2,502 |
| Engineering | 8,773 | 10,916 |
| Geosciences, atmospheric sciences, and ocean sciences | 815 | 973 |
| Health sciences | 4,313 | 7,457 |
| Mathematics and statistics | 1,670 | 1,959 |
| Multidisciplinary and interdisciplinary sciences | 370 | 656 |
| Physical sciences | 4,657 | 4,865 |
| Psychology | 4,717 | 5,160 |
| Social sciences | 4,675 | 4,404 |
Note(s):
Data are based on institutions eligible to participate in Title IV federal financial aid programs. Doctoral degree programs include research doctoral degree programs only and do not include professional doctoral programs (e.g., Doctor of Medicine).
Source(s):
National Center for Science and Engineering Statistics, special tabulations (2022) of the National Center for Education Statistics, Integrated Postsecondary Education Data System (IPEDS), Completions Survey, provisional release data.
Science and Engineering Indicators
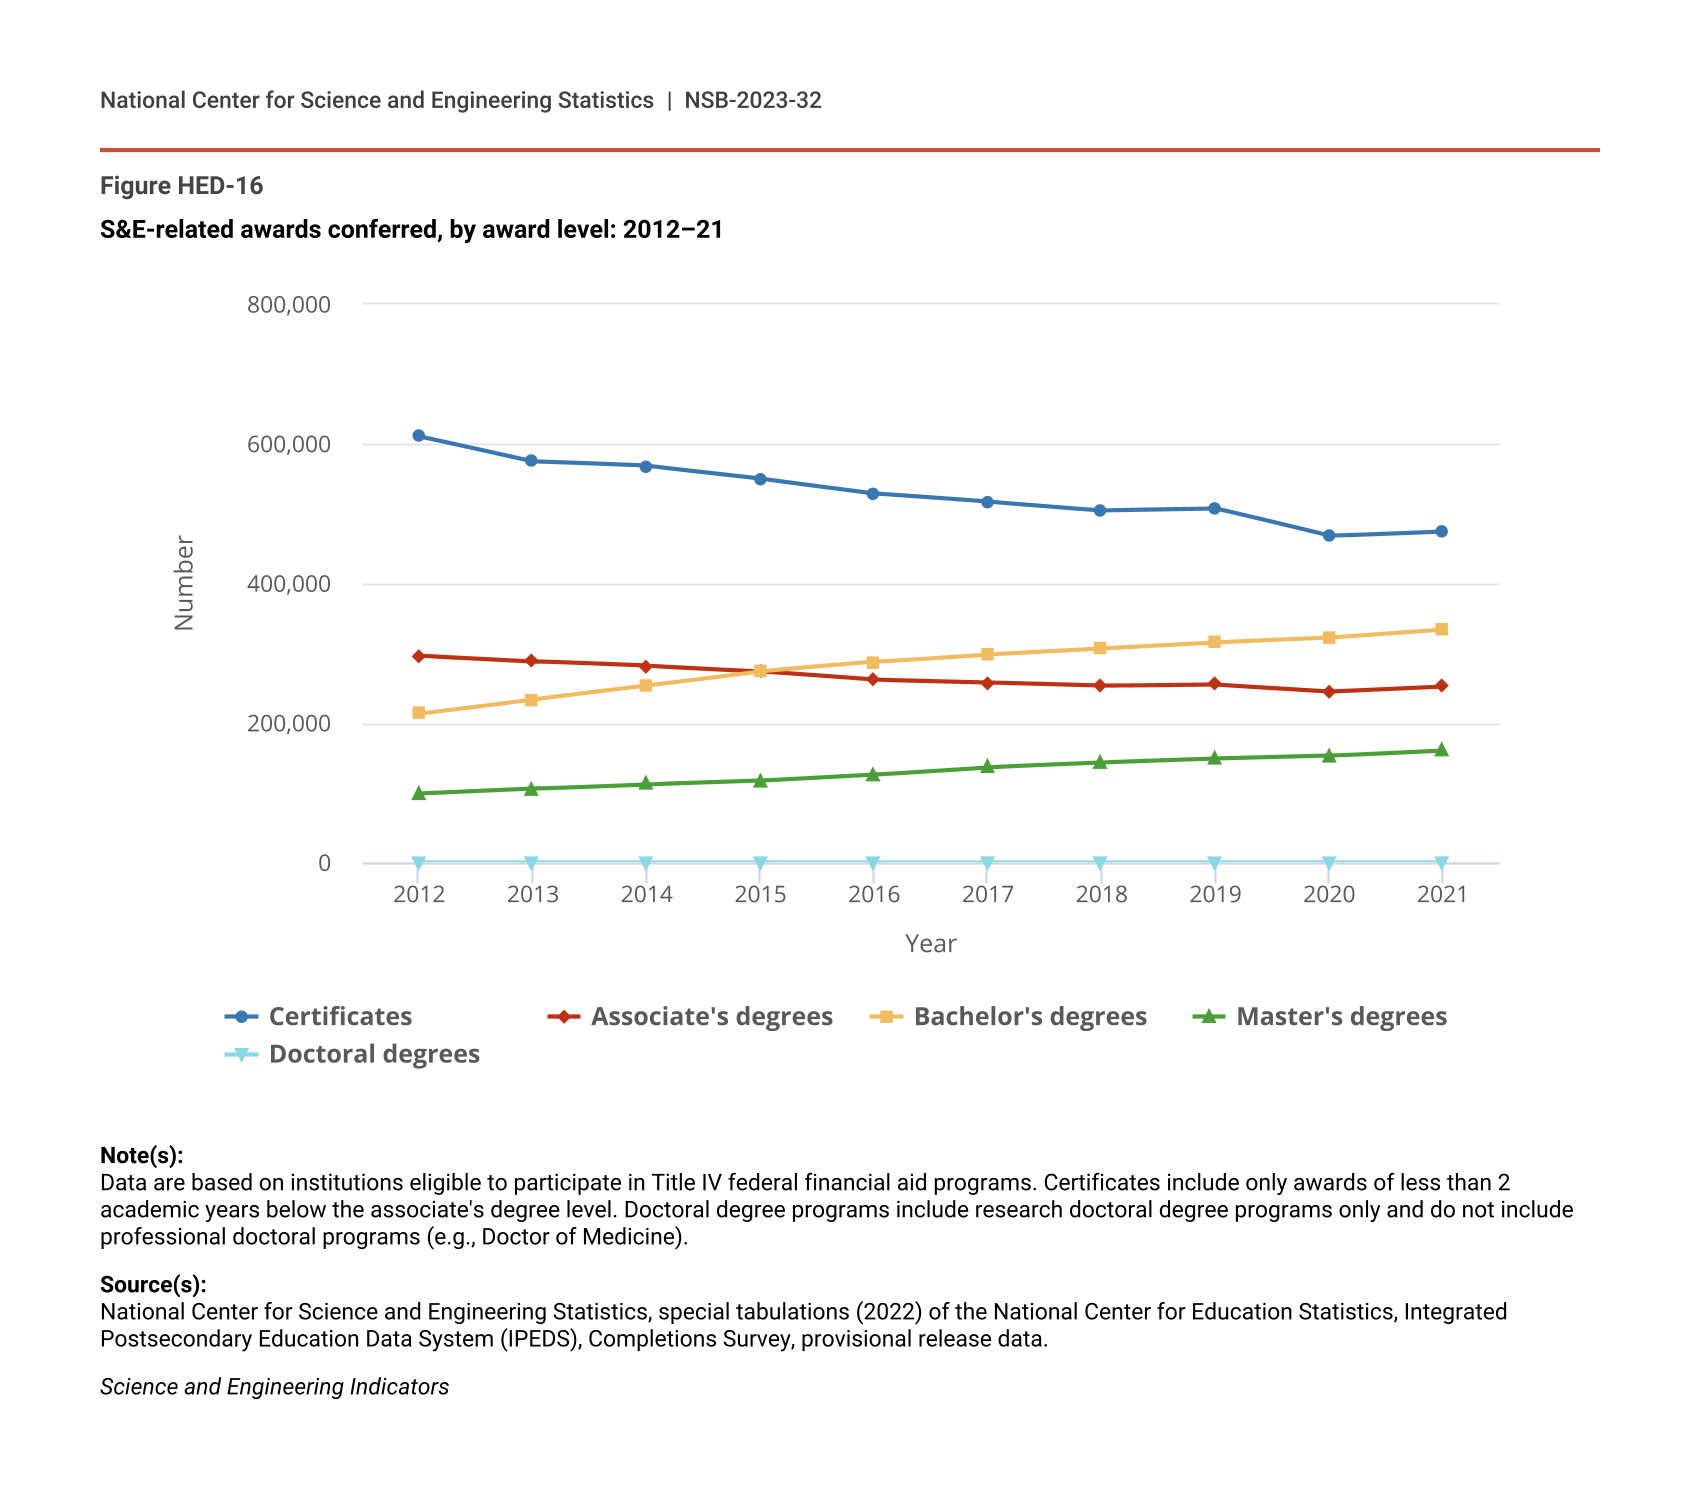
In contrast with the growth in S&E awards at all levels between 2012 and 2021, the trend in the number of S&E-related awards differed by award level (Figure HED-16). The number of S&E-related certificates and associate’s degrees awarded decreased between 2012 and 2021, while the number of bachelor’s and master’s degrees increased. The number of S&E-related doctoral degrees, which are comparatively rare, fluctuated with little long-term change.
S&E-related awards conferred, by award level: 2012–21
| Year | Certificates | Associate's degrees | Bachelor's degrees | Master's degrees | Doctoral degrees |
|---|---|---|---|---|---|
| 2012 | 611,229 | 296,419 | 213,551 | 98,764 | 444 |
| 2013 | 574,920 | 288,495 | 234,075 | 105,786 | 460 |
| 2014 | 568,463 | 281,774 | 253,671 | 112,194 | 489 |
| 2015 | 550,479 | 273,943 | 273,893 | 117,470 | 507 |
| 2016 | 529,454 | 261,833 | 287,445 | 126,393 | 515 |
| 2017 | 517,563 | 258,048 | 298,709 | 136,877 | 484 |
| 2018 | 505,163 | 253,585 | 307,096 | 143,154 | 458 |
| 2019 | 507,686 | 255,426 | 315,432 | 148,630 | 502 |
| 2020 | 468,186 | 245,644 | 322,133 | 152,812 | 518 |
| 2021 | 474,734 | 253,005 | 333,920 | 160,649 | 469 |
Note(s):
Data are based on institutions eligible to participate in Title IV federal financial aid programs. Certificates include only awards of less than 2 academic years below the associate's degree level. Doctoral degree programs include research doctoral degree programs only and do not include professional doctoral programs (e.g., Doctor of Medicine).
Source(s):
National Center for Science and Engineering Statistics, special tabulations (2022) of the National Center for Education Statistics, Integrated Postsecondary Education Data System (IPEDS), Completions Survey, provisional release data.
Science and Engineering Indicators
The field of health professions and related programs, which includes degrees in registered nursing, is by far the most prevalent broad S&E-related field (Table HED-4). This field accounted for the largest share of S&E-related awards from the certificate level to the doctorate level for both 2012 and 2021. Despite a 36% decline in the number of certificates awarded in health professions and related programs since 2012, it remained the most popular S&E-related field for certificates by a large margin. In contrast, the number of degrees in health professions and related programs increased by 64% (from 183,000 to 299,000) at the bachelor’s level and by 70% (from 86,000 to 146,000) at the master’s level. Other S&E-related degrees with proportionally large growth over this period included bachelor’s and master’s degrees in homeland security and fire protection. Awards with declining numbers included bachelor’s and master’s degrees in science and mathematics teacher education.
S&E-related degrees awarded, by degree level and field: 2012 and 2021
* = value < 0.05%.
Note(s):
Data are based on institutions eligible to participate in Title IV federal financial aid programs. Certificates include only awards of less than 2 academic years below the associate's degree level. Doctoral degree programs include research doctoral degree programs only and do not include professional doctoral programs (e.g., Doctor of Medicine).
Source(s):
National Center for Science and Engineering Statistics, special tabulations (2022) of the National Center for Education Statistics, Integrated Postsecondary Education Data System (IPEDS), Completions Survey, provisional release data.
Science and Engineering Indicators