 An official website of the United States government
 International Comparisons of S&E Higher Education
This section provides data on the U.S. position in higher education within a global context. Key topics include educational attainment in the overall population and trends in S&E first university and doctoral degree awards among the top degree-producing countries. Although the United States is among the most highly educated countries with respect to the share of its population with at least a bachelor’s degree, it is below average within the Organisation for Economic Co-operation and Development (OECD) with respect to advanced degree attainment. Furthermore, over the last two decades, the share of younger adults with postsecondary education increased faster in nearly all other advanced economies than it did in the United States.
India and China have increased S&E degree production more rapidly in the past decade than have many OECD member countries. India awards the highest number of S&E first university degrees, and China awards the most S&E doctorates, followed closely by the United States. Despite their recent gains in the number of S&E degrees awarded, India and China measure far lower than the United States and other advanced economies in the share of their young adult populations (20–34 years old) that earn postsecondary S&E degrees. A higher share of S&E degrees in China is awarded in engineering compared to other countries, whereas degrees in the United States are more focused in the social and behavioral sciences.
Educational Attainment
Educational attainment, measured as the proportion of a population that has reached a specific level of education, is often used as a proxy for human capital and the skill levels associated with that level of study (OECD 2022a). The United States ranks highly on educational attainment at the bachelor’s level: 39.5% of the 25- to 64-year-old population had a bachelor’s degree or higher in 2021, compared to the OECD average of 34.0% (Figure HED-28). However, educational attainment varies greatly by demographic group and by region in the United States. For example, in 2019, bachelor’s degree holders ranged from a high of 70.4% of individuals 25–44 years old in the District Columbia to a low of 22.7% in Mississippi (NSB 2022a: State Indicator S-30). The United States ranks comparatively lower internationally in educational attainment with respect to advanced degrees. In 2021, 14.4% of U.S. 25- to 64-year-olds had attained a master’s degree or higher, below the OECD average of 15.1% (Figure HED-28).
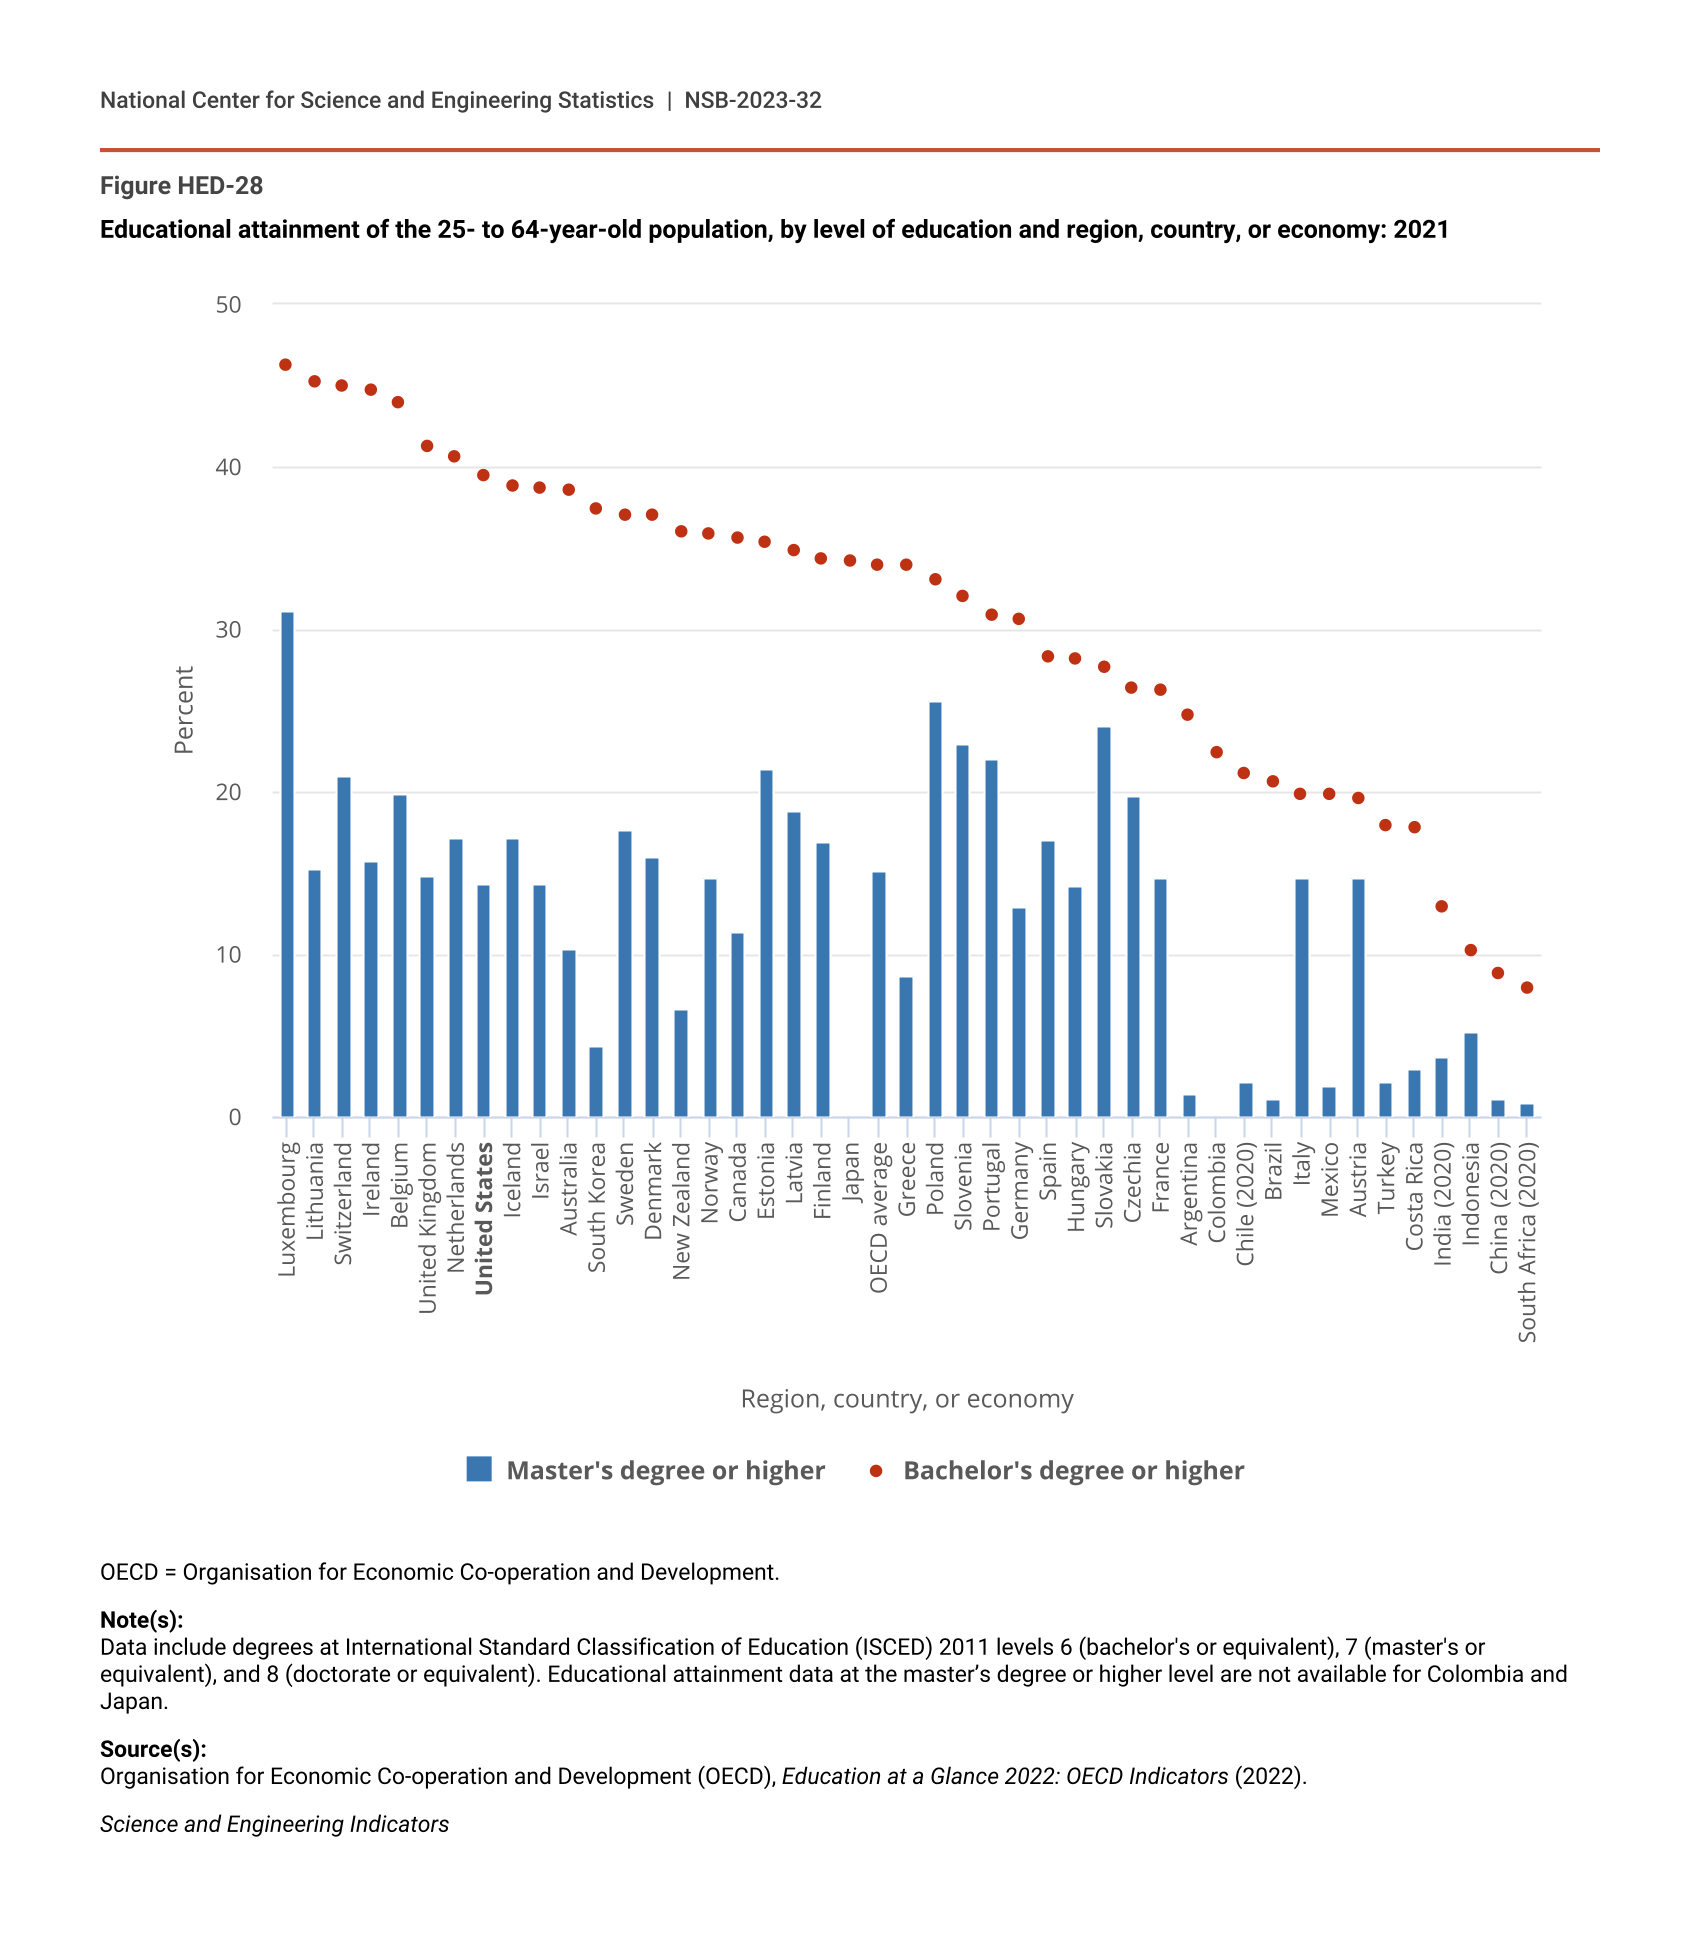
Educational attainment of the 25- to 64-year-old population, by level of education and region, country, or economy: 2021
| Region, country, or economy | Master's degree or higher | Bachelor's degree or higher |
|---|---|---|
| Luxembourg | 31.2 | 46.3 |
| Lithuania | 15.3 | 45.3 |
| Switzerland | 21.0 | 45.0 |
| Ireland | 15.8 | 44.7 |
| Belgium | 19.9 | 44.0 |
| United Kingdom | 14.9 | 41.3 |
| Netherlands | 17.2 | 40.7 |
| United States | 14.4 | 39.5 |
| Iceland | 17.2 | 38.9 |
| Israel | 14.4 | 38.7 |
| Australia | 10.4 | 38.6 |
| South Korea | 4.4 | 37.4 |
| Sweden | 17.7 | 37.1 |
| Denmark | 16.0 | 37.0 |
| New Zealand | 6.7 | 36.0 |
| Norway | 14.8 | 35.9 |
| Canada | 11.4 | 35.6 |
| Estonia | 21.4 | 35.4 |
| Latvia | 18.9 | 34.9 |
| Finland | 16.9 | 34.4 |
| Japan | NA | 34.2 |
| OECD average | 15.1 | 34.0 |
| Greece | 8.7 | 34.0 |
| Poland | 25.6 | 33.1 |
| Slovenia | 23.0 | 32.1 |
| Portugal | 22.1 | 30.9 |
| Germany | 13.0 | 30.6 |
| Spain | 17.1 | 28.3 |
| Hungary | 14.2 | 28.2 |
| Slovakia | 24.1 | 27.7 |
| Czechia | 19.8 | 26.4 |
| France | 14.7 | 26.3 |
| Argentina | 1.4 | 24.8 |
| Colombia | NA | 22.5 |
| Chile (2020) | 2.2 | 21.1 |
| Brazil | 1.1 | 20.7 |
| Italy | 14.7 | 19.9 |
| Mexico | 1.9 | 19.9 |
| Austria | 14.7 | 19.6 |
| Turkey | 2.2 | 17.9 |
| Costa Rica | 2.9 | 17.8 |
| India (2020) | 3.7 | 12.9 |
| Indonesia | 5.3 | 10.3 |
| China (2020) | 1.1 | 8.9 |
| South Africa (2020) | 0.9 | 7.9 |
OECD = Organisation for Economic Co-operation and Development.
Note(s):
Data include degrees at International Standard Classification of Education (ISCED) 2011 levels 6 (bachelor's or equivalent), 7 (master's or equivalent), and 8 (doctorate or equivalent). Educational attainment data at the master’s degree or higher level are not available for Colombia and Japan.
Source(s):
Organisation for Economic Co-operation and Development (OECD), Education at a Glance 2022: OECD Indicators (2022).
Science and Engineering Indicators
In recent years, educational attainment has increased faster in other advanced economies than it has in the United States. From 2000 to 2021, the share of 25- to 34-year-olds with tertiary education (roughly speaking, an associate’s degree or higher) increased by 13 percentage points in the United States, compared to an average increase of 21 percentage points across OECD member countries (OECD 2022a). The size of the increase in the United States during this period was smaller than the increase experienced in nearly all other OECD countries. The share of younger adults (25–34 years old) with at least a bachelor’s degree in the United States is slightly larger than the share for 25- to 64-year-olds; this contrasts with many other OECD countries, wherein this younger cohort is substantially more educated than the overall working-age population (NSB 2022b).
S&E First University Degrees
First university degrees are used in international comparisons to accommodate differences between national higher education systems. First university degrees are usually equivalent to bachelor’s degrees, but they also include “long first degrees” awarded by some countries that are comparable to master’s degrees (for more information, see the Glossary section, and see the Technical Appendix). India awarded 2.5 million S&E first university degrees in 2020, followed by China (2.0 million) and then by the United States (900,000) (Figure HED-29). On a percentage basis, Mexico and Turkey experienced the most rapid growth in S&E first university degree awards from 2011 to 2020. However, in contrast to S&E first university degrees, these countries are not among the top producers of S&E doctoral degrees (see the following section S&E Doctoral Degrees).
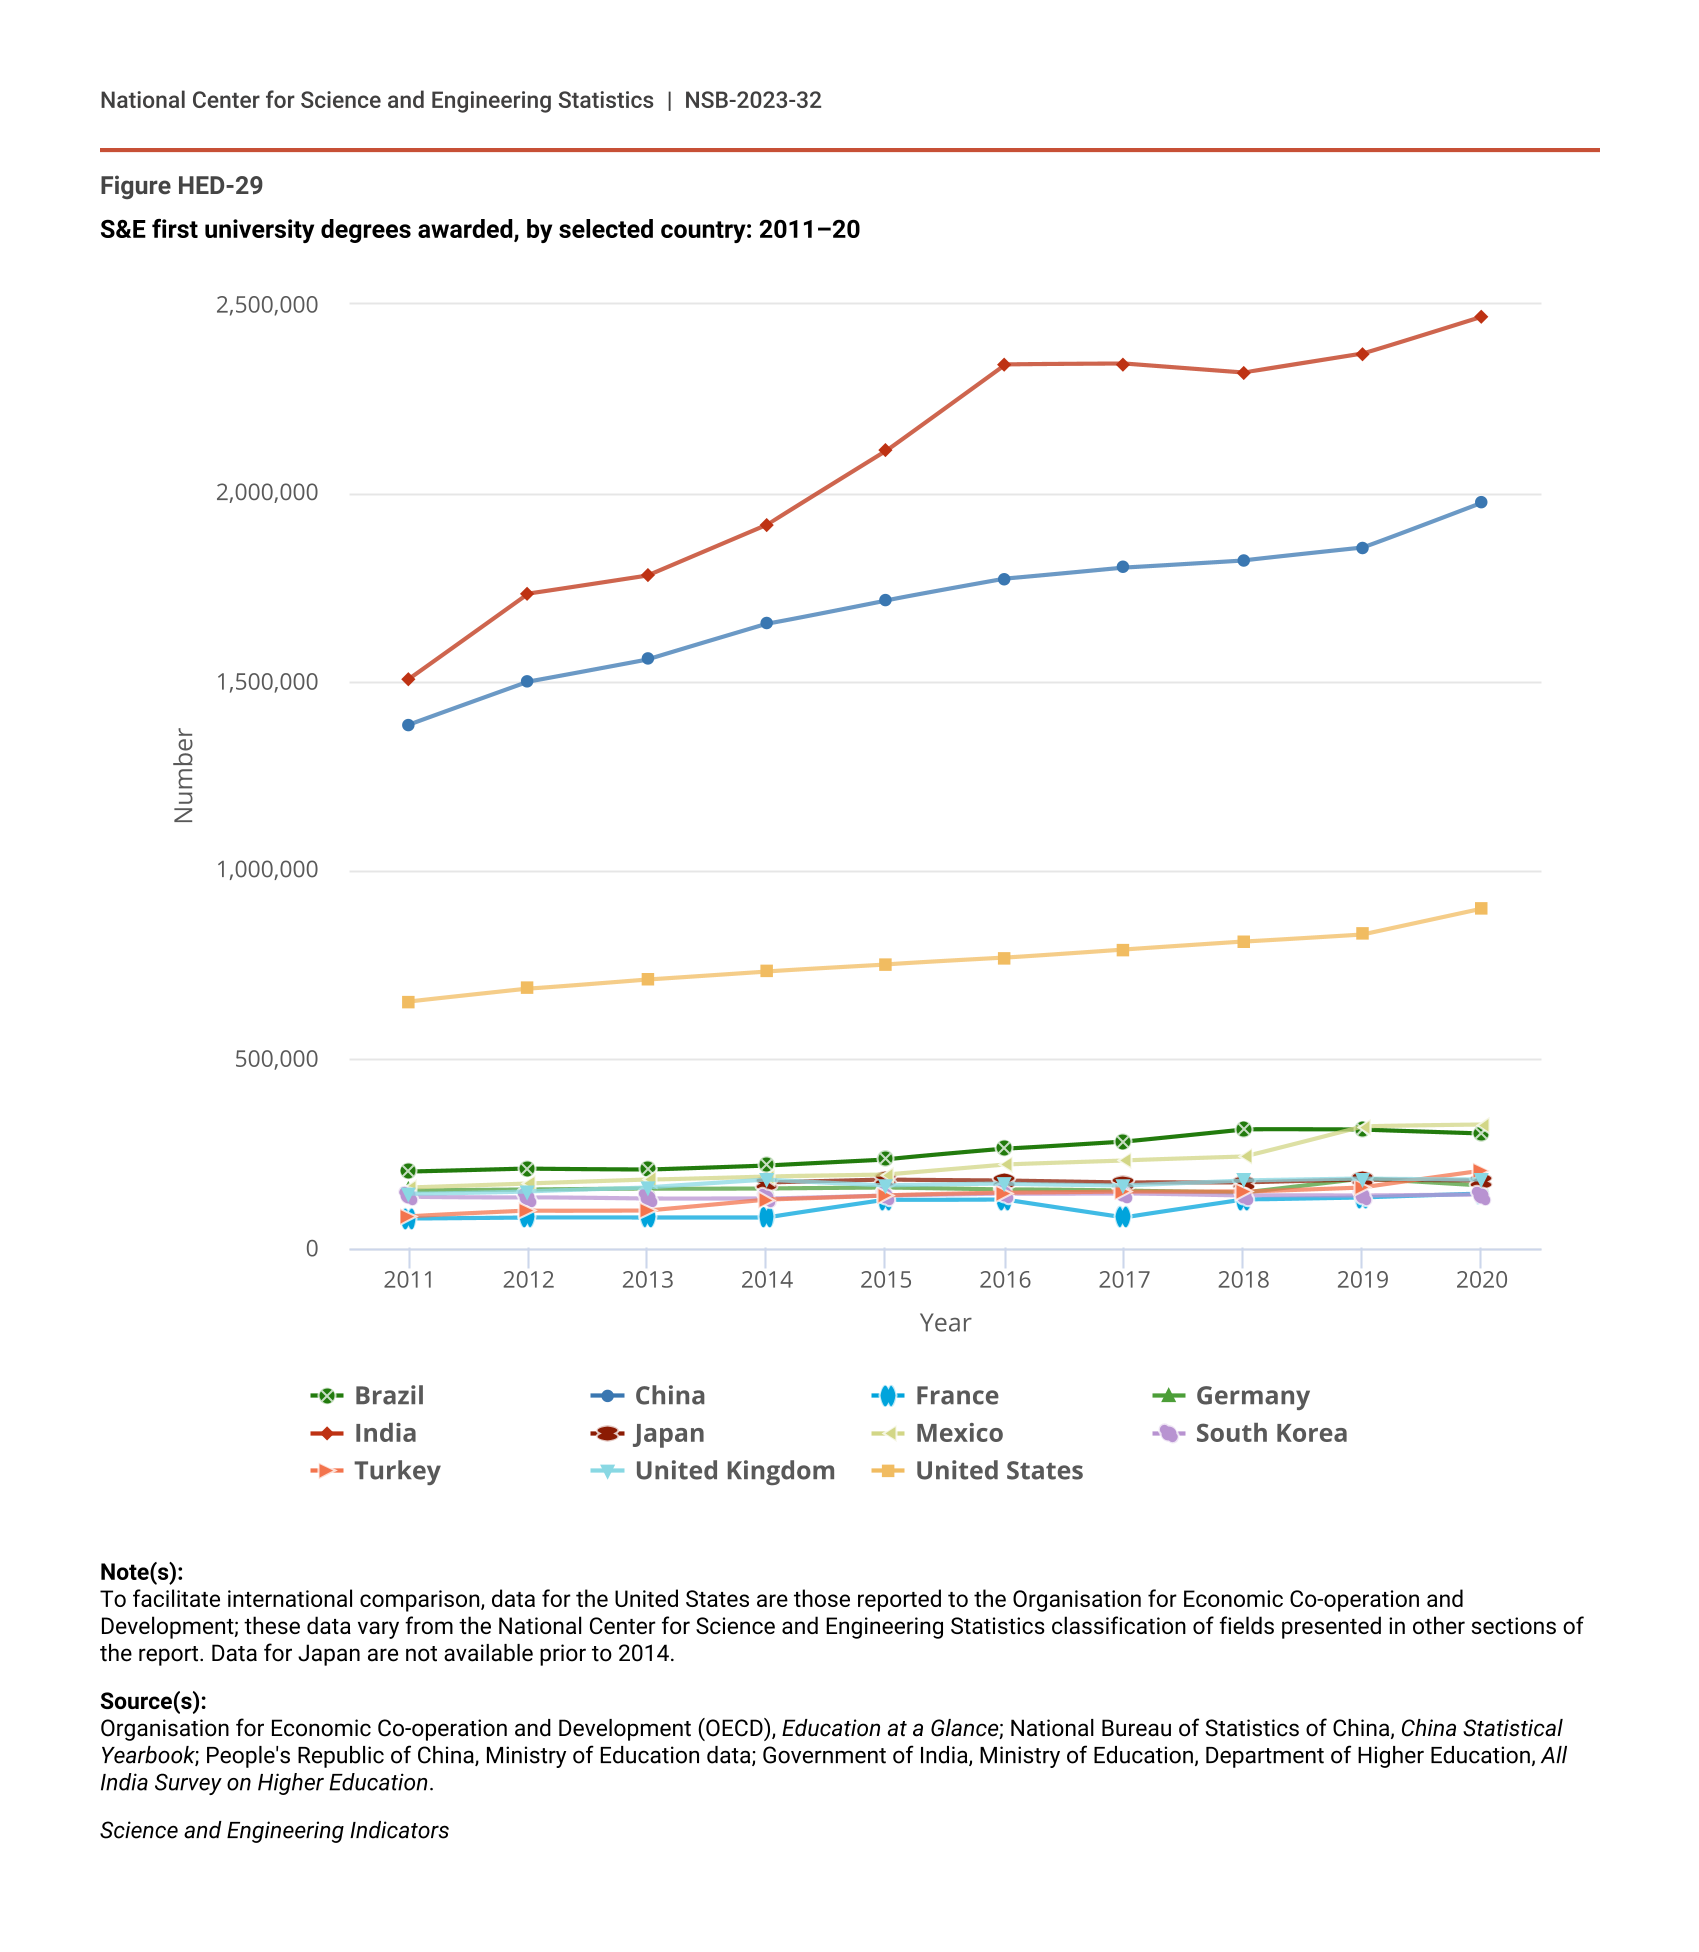
S&E first university degrees awarded, by selected country: 2011–20
| Year | Brazil | China | France | Germany | India | Japan | Mexico | South Korea | Turkey | United Kingdom | United States |
|---|---|---|---|---|---|---|---|---|---|---|---|
| 2011 | 201,636 | 1,387,374 | 78,294 | 152,872 | 1,507,992 | NA | 159,873 | 135,254 | 84,061 | 143,176 | 653,341 |
| 2012 | 209,920 | 1,500,689 | 81,209 | 155,223 | 1,734,087 | NA | 170,472 | 134,600 | 98,013 | 150,787 | 687,221 |
| 2013 | 208,304 | 1,559,840 | 80,800 | 157,719 | 1,782,542 | NA | 180,755 | 130,533 | 99,415 | 160,363 | 712,383 |
| 2014 | 219,525 | 1,653,565 | 80,885 | 158,834 | 1,916,704 | 173,283 | 189,782 | 130,648 | 128,672 | 180,340 | 733,698 |
| 2015 | 235,267 | 1,716,413 | 127,138 | 161,118 | 2,111,708 | 180,888 | 194,886 | 139,467 | 139,684 | 165,793 | 751,195 |
| 2016 | 262,301 | 1,772,830 | 129,028 | 155,534 | 2,340,790 | 178,891 | 221,456 | 144,725 | 146,128 | 169,832 | 768,291 |
| 2017 | 282,278 | 1,802,760 | 81,736 | 151,585 | 2,342,382 | 173,573 | 231,571 | 145,567 | 149,730 | 166,364 | 790,324 |
| 2018 | 314,863 | 1,821,950 | 128,197 | 146,831 | 2,318,604 | 172,899 | 241,291 | 139,111 | 149,986 | 179,822 | 811,195 |
| 2019 | 313,101 | 1,855,367 | 133,353 | 184,765 | 2,368,930 | 180,160 | 322,744 | 137,862 | 161,512 | 184,524 | 830,601 |
| 2020 | 303,016 | 1,975,602 | 143,286 | 165,929 | 2,467,873 | 177,608 | 326,468 | 140,499 | 205,405 | 182,531 | 898,973 |
Note(s):
To facilitate international comparison, data for the United States are those reported to the Organisation for Economic Co-operation and Development; these data vary from the National Center for Science and Engineering Statistics classification of fields presented in other sections of the report. Data for Japan are not available prior to 2014.
Source(s):
Organisation for Economic Co-operation and Development (OECD), Education at a Glance; National Bureau of Statistics of China, China Statistical Yearbook; People's Republic of China, Ministry of Education data; Government of India, Ministry of Education, Department of Higher Education, All India Survey on Higher Education.
Science and Engineering Indicators
The proportion of all first university degrees awarded in S&E fields varies across the top degree-producing countries, from a high of 49% in Mexico to a low of 24% in Brazil in 2020 (Figure HED-30). Engineering is generally the most popular broad S&E degree field, but the share varies considerably by country. For example, engineering accounted for 33% of all first university degrees in China in 2020. In contrast, engineering degrees were less common in the United Kingdom and the United States, where they accounted for 9% and 8% of first university degrees, respectively. These two countries were also among the most concentrated in the social and behavioral sciences: in 2020, the United Kingdom awarded 18% of first university degrees in this broad field, and the United States awarded 19%, surpassed only by Mexico (20%).
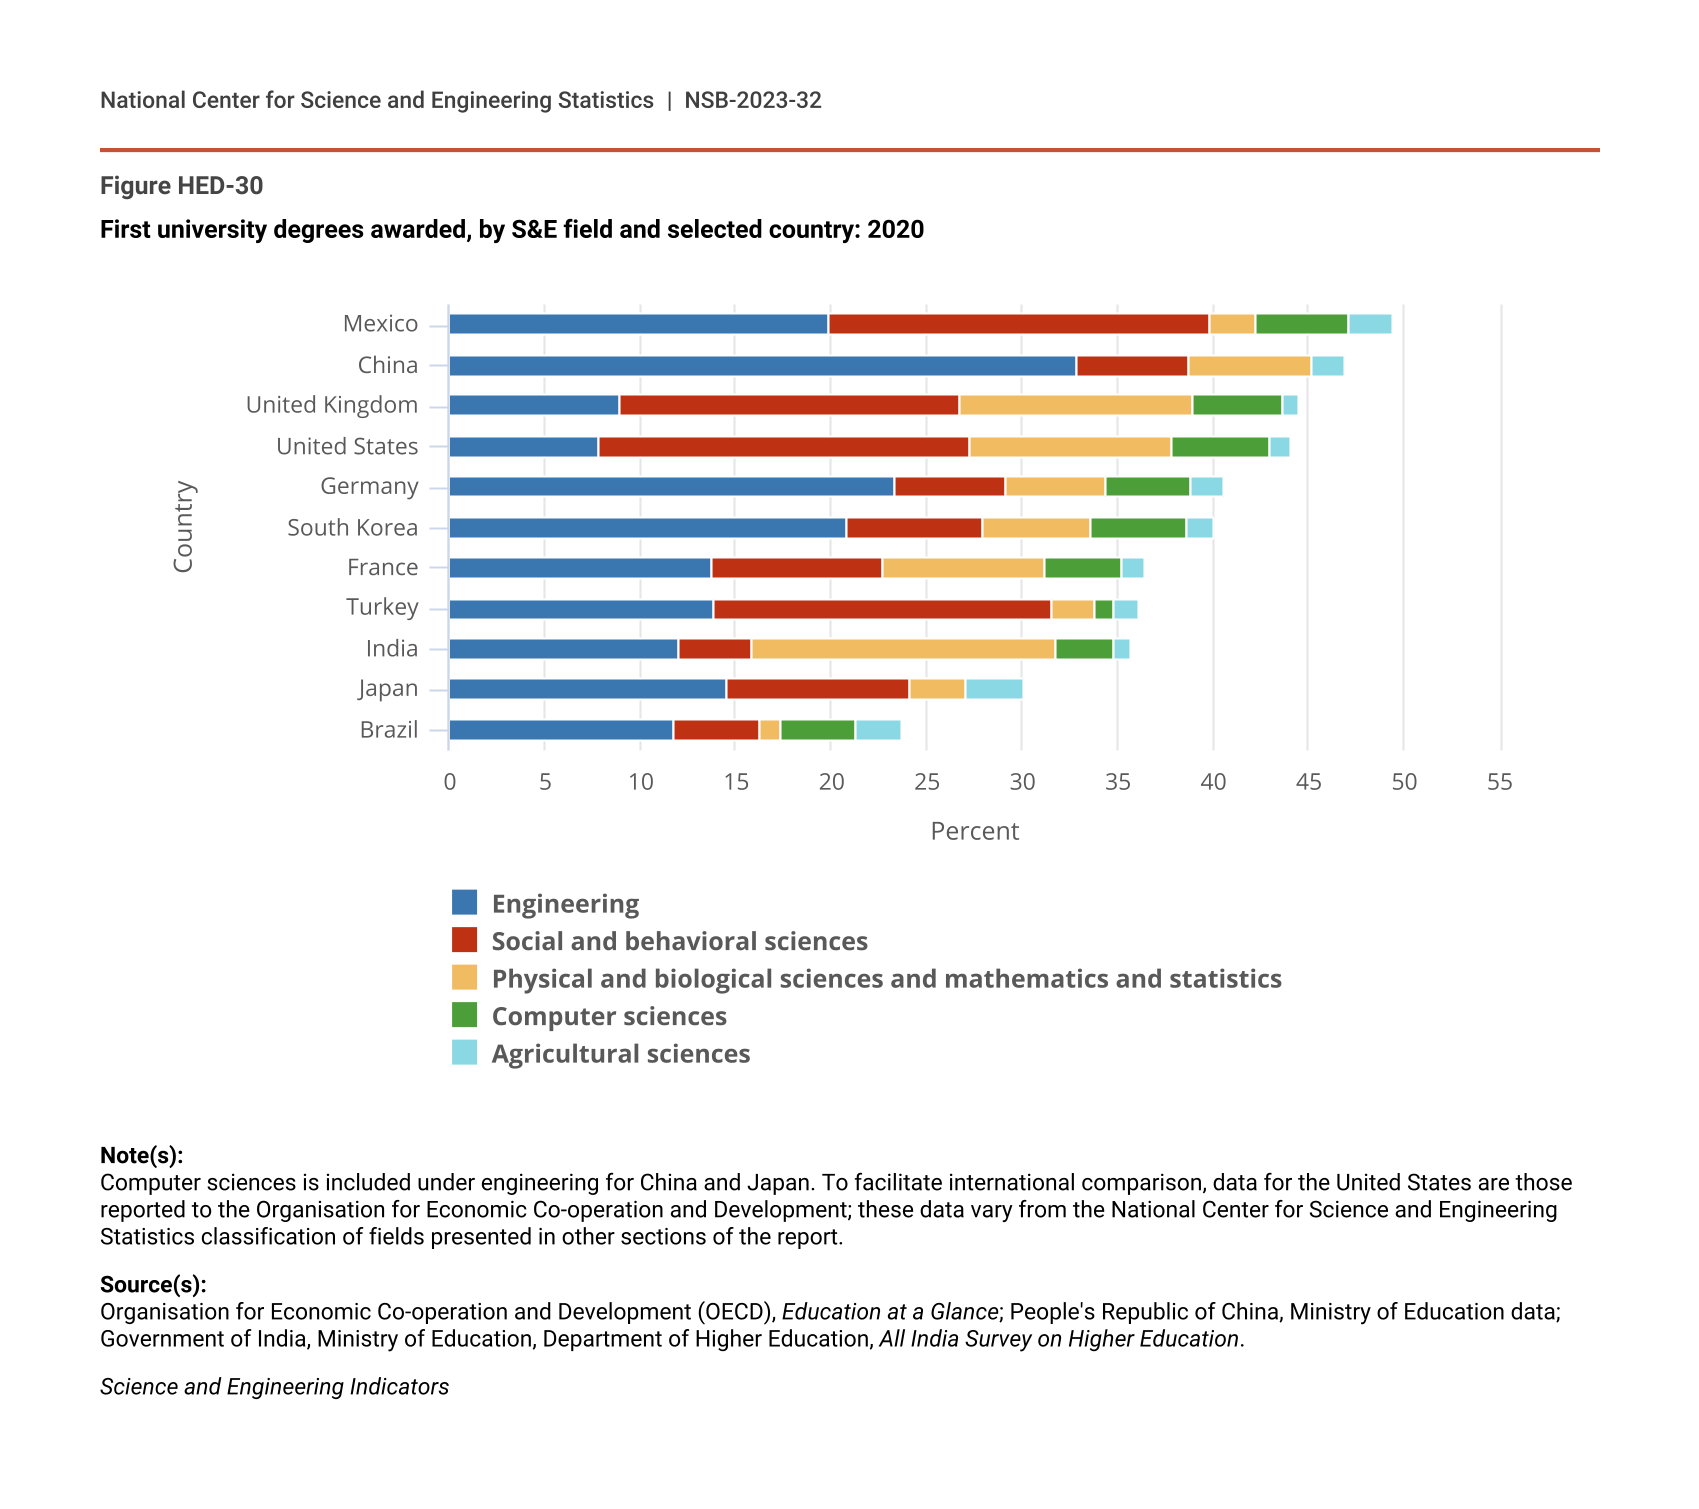
First university degrees awarded, by S&E field and selected country: 2020
| Country | Engineering | Social and behavioral sciences | Physical and biological sciences and mathematics and statistics | Computer sciences | Agricultural sciences |
|---|---|---|---|---|---|
| Mexico | 19.9 | 19.9 | 2.4 | 4.9 | 2.3 |
| China | 32.8 | 5.9 | 6.5 | NA | 1.7 |
| United Kingdom | 8.9 | 17.8 | 12.3 | 4.6 | 0.9 |
| United States | 7.9 | 19.4 | 10.6 | 5.1 | 1.1 |
| Germany | 23.3 | 5.8 | 5.3 | 4.4 | 1.8 |
| South Korea | 20.8 | 7.1 | 5.7 | 5.0 | 1.5 |
| France | 13.8 | 8.9 | 8.5 | 4.1 | 1.1 |
| Turkey | 13.9 | 17.6 | 2.3 | 1.0 | 1.3 |
| India | 12.0 | 3.8 | 16.0 | 3.0 | 0.9 |
| Japan | 14.5 | 9.6 | 3.0 | NA | 3.0 |
| Brazil | 11.8 | 4.5 | 1.0 | 4.0 | 2.4 |
Note(s):
Computer sciences is included under engineering for China and Japan. To facilitate international comparison, data for the United States are those reported to the Organisation for Economic Co-operation and Development; these data vary from the National Center for Science and Engineering Statistics classification of fields presented in other sections of the report.
Source(s):
Organisation for Economic Co-operation and Development (OECD), Education at a Glance; People's Republic of China, Ministry of Education data; Government of India, Ministry of Education, Department of Higher Education, All India Survey on Higher Education.
Science and Engineering Indicators
S&E Doctoral Degrees
China awarded the highest number of S&E doctoral degrees (43,000) in 2020, followed closely by the United States (42,000), which China surpassed in 2019 (Figure HED-31). Given the proximity of the United States and China on this indicator, additional discussion is provided in the sidebar Considerations for International Comparisons of S&E Doctoral Degrees. After experiencing rapid growth in the mid-2010s, the number of S&E doctorates awarded in India dropped to 17,000 in 2020, falling slightly below the number awarded by the United Kingdom. Other top producers of S&E doctoral degrees include Germany (14,000), Brazil (9,000), South Korea and France (about 8,000 each), and Japan (7,000). Among these countries, South Korea increased S&E doctoral degree production at the fastest rate (49%) from 2011 to 2020.
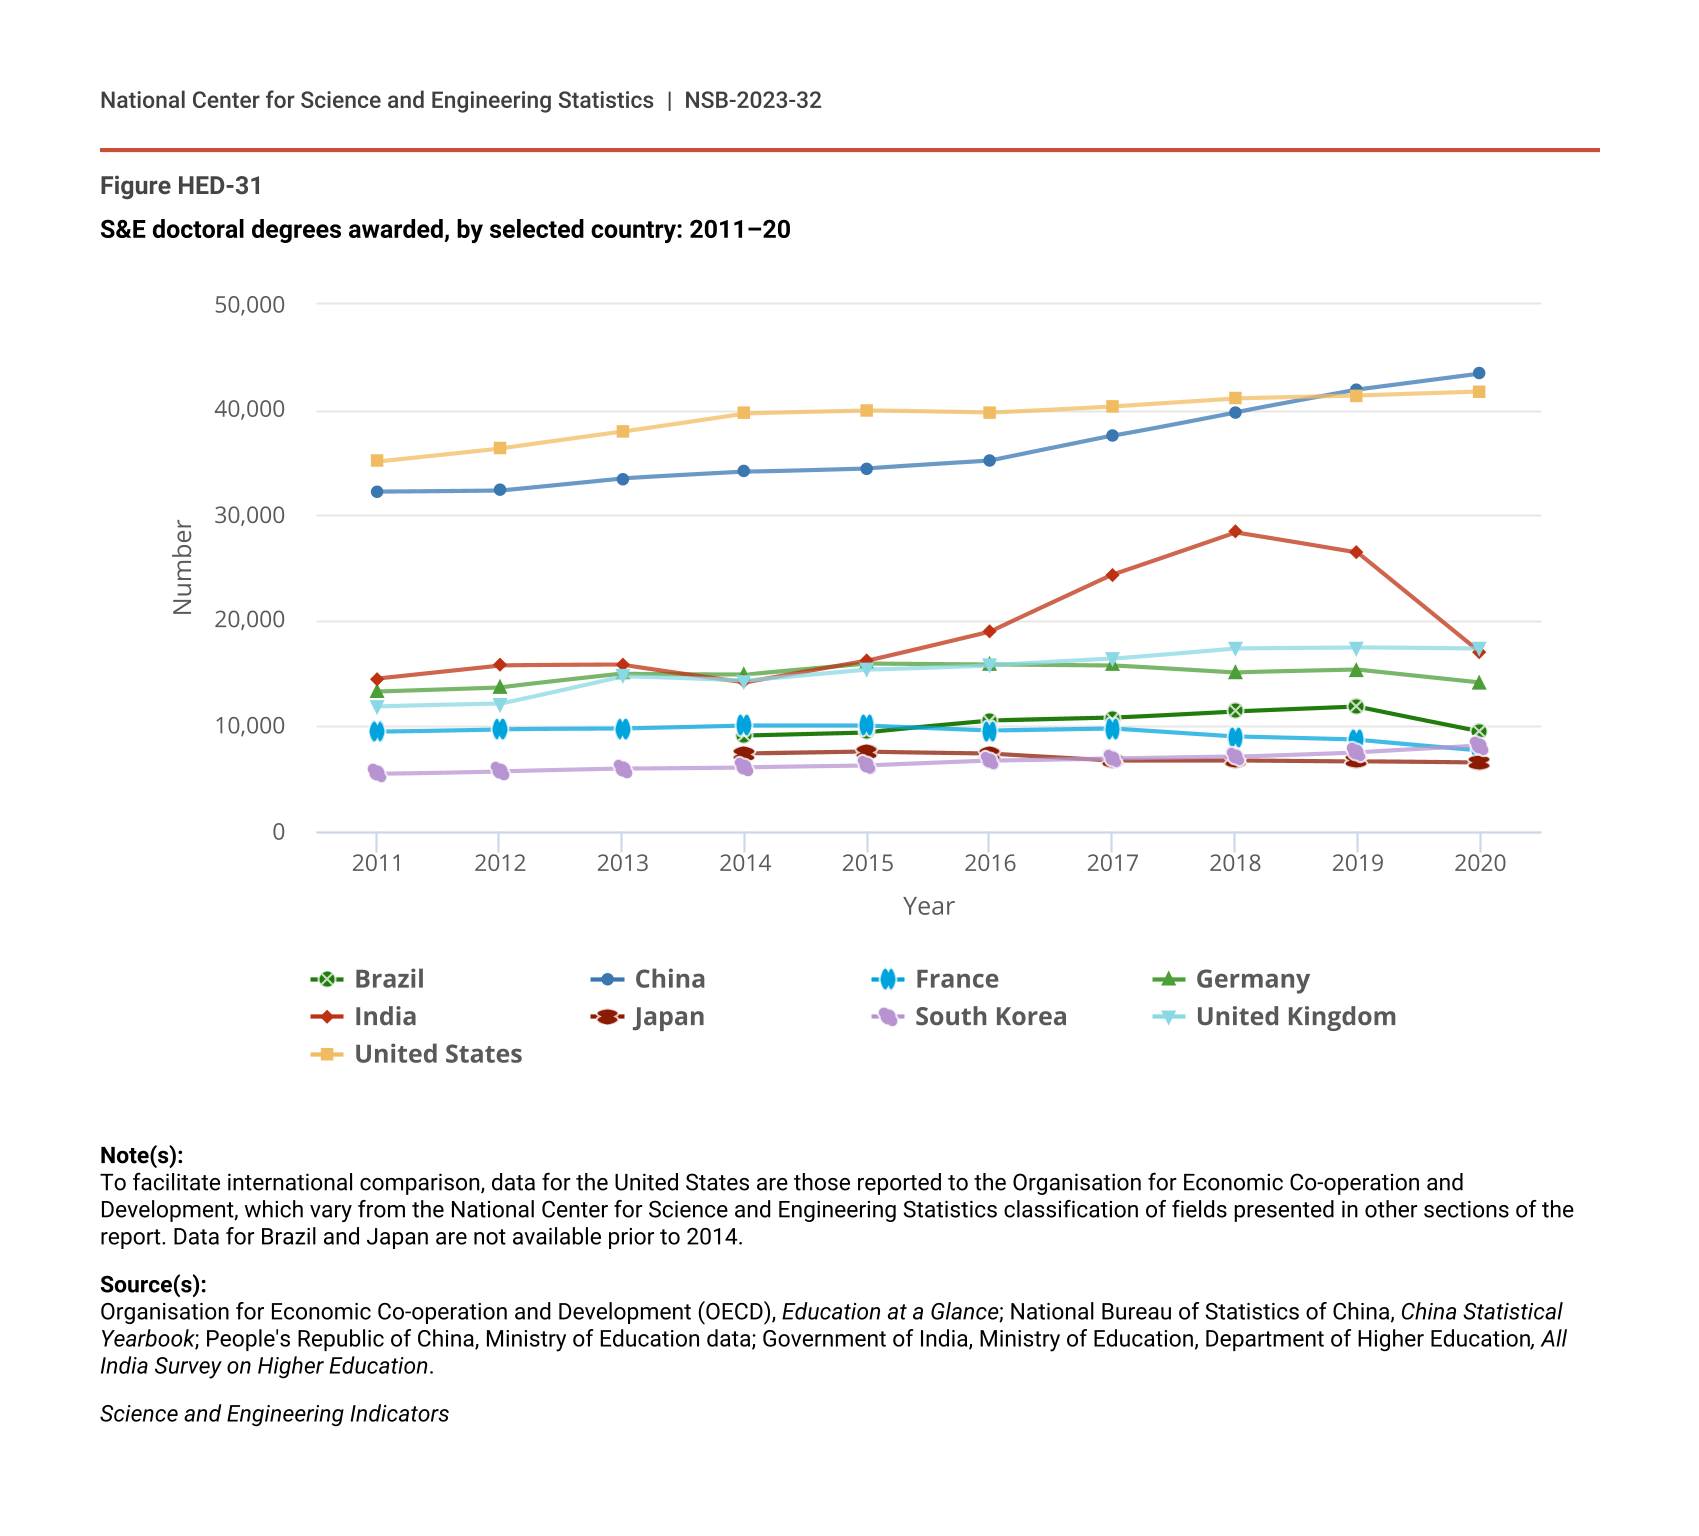
S&E doctoral degrees awarded, by selected country: 2011–20
| Year | Brazil | China | France | Germany | India | Japan | South Korea | United Kingdom | United States |
|---|---|---|---|---|---|---|---|---|---|
| 2011 | NA | 32,208 | 9,466 | 13,281 | 14,498 | NA | 5,454 | 11,859 | 35,113 |
| 2012 | NA | 32,331 | 9,692 | 13,666 | 15,730 | NA | 5,713 | 12,103 | 36,356 |
| 2013 | NA | 33,490 | 9,731 | 14,936 | 15,786 | NA | 5,963 | 14,732 | 37,951 |
| 2014 | 9,124 | 34,103 | 10,023 | 14,912 | 14,163 | 7,357 | 6,087 | 14,271 | 39,682 |
| 2015 | 9,414 | 34,440 | 10,020 | 15,957 | 16,216 | 7,540 | 6,240 | 15,337 | 39,933 |
| 2016 | 10,469 | 35,147 | 9,564 | 15,871 | 19,001 | 7,391 | 6,689 | 15,757 | 39,710 |
| 2017 | 10,752 | 37,506 | 9,755 | 15,761 | 24,383 | 6,745 | 6,903 | 16,372 | 40,319 |
| 2018 | 11,365 | 39,768 | 8,987 | 15,061 | 28,394 | 6,754 | 7,077 | 17,366 | 41,071 |
| 2019 | 11,817 | 41,890 | 8,683 | 15,309 | 26,443 | 6,646 | 7,504 | 17,438 | 41,333 |
| 2020 | 9,492 | 43,399 | 7,691 | 14,092 | 16,968 | 6,506 | 8,125 | 17,312 | 41,701 |
Note(s):
To facilitate international comparison, data for the United States are those reported to the Organisation for Economic Co-operation and Development, which vary from the National Center for Science and Engineering Statistics classification of fields presented in other sections of the report. Data for Brazil and Japan are not available prior to 2014.
Source(s):
Organisation for Economic Co-operation and Development (OECD), Education at a Glance; National Bureau of Statistics of China, China Statistical Yearbook; People's Republic of China, Ministry of Education data; Government of India, Ministry of Education, Department of Higher Education, All India Survey on Higher Education.
Science and Engineering Indicators
For most of the top producers of S&E doctoral degrees, more than half of all doctoral degrees awarded in 2020 were in S&E fields (Figure HED-32). Degrees in physical and biological sciences and mathematics and statistics accounted for the largest share of doctoral degrees in S&E fields in most of these countries. However, engineering degrees were more common in East Asian countries, especially China, where 36% of all doctorates were awarded in engineering in 2020. Doctoral degrees in computer sciences and agricultural sciences typically account for the lowest shares of S&E degrees, but agricultural sciences were comparatively more common in Brazil (10% of all doctorates awarded in 2020) and India (8%).
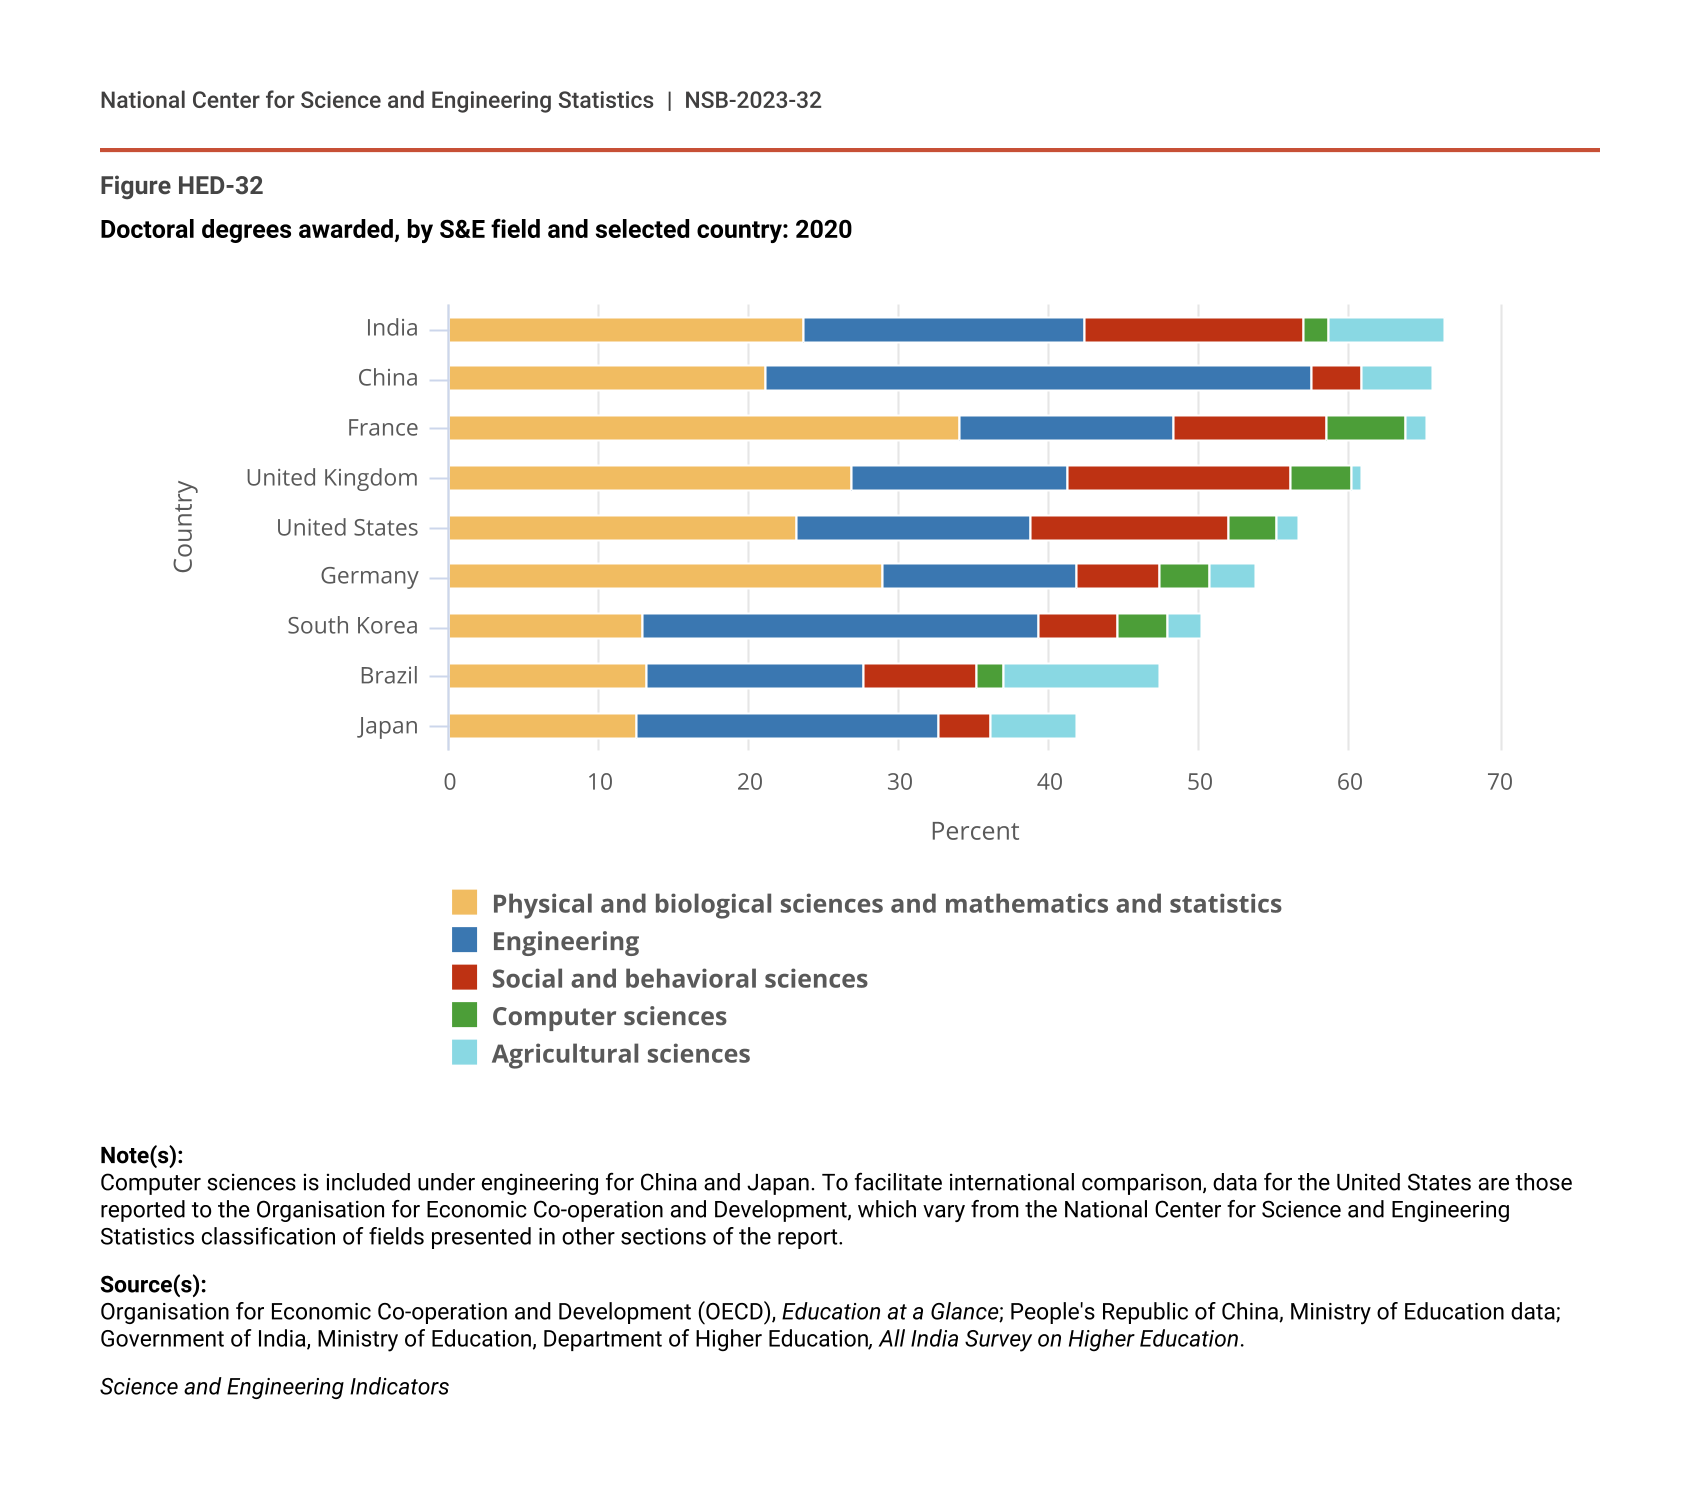
Doctoral degrees awarded, by S&E field and selected country: 2020
| Country | Physical and biological sciences and mathematics and statistics | Engineering | Social and behavioral sciences | Computer sciences | Agricultural sciences |
|---|---|---|---|---|---|
| India | 23.6 | 18.7 | 14.6 | 1.7 | 7.8 |
| China | 21.1 | 36.4 | 3.3 | NA | 4.8 |
| France | 34.0 | 14.4 | 10.1 | 5.3 | 1.4 |
| United Kingdom | 26.8 | 14.5 | 14.8 | 4.0 | 0.8 |
| United States | 23.2 | 15.6 | 13.1 | 3.3 | 1.5 |
| Germany | 28.9 | 12.9 | 5.6 | 3.3 | 3.1 |
| South Korea | 12.9 | 26.4 | 5.3 | 3.3 | 2.3 |
| Brazil | 13.2 | 14.4 | 7.5 | 1.8 | 10.4 |
| Japan | 12.5 | 20.1 | 3.5 | NA | 5.7 |
Note(s):
Computer sciences is included under engineering for China and Japan. To facilitate international comparison, data for the United States are those reported to the Organisation for Economic Co-operation and Development, which vary from the National Center for Science and Engineering Statistics classification of fields presented in other sections of the report.
Source(s):
Organisation for Economic Co-operation and Development (OECD), Education at a Glance; People's Republic of China, Ministry of Education data; Government of India, Ministry of Education, Department of Higher Education, All India Survey on Higher Education.
Science and Engineering Indicators
S&E Degree Production Intensity
Adjusting S&E degree awards relative to national population levels provides useful context when comparing S&E higher education across nations of varying sizes. S&E degree production intensity indicates the prevalence of S&E higher education among the portion of a country’s population in the age range most commonly pursuing postsecondary education. It is defined here as the number of S&E degrees awarded per 100,000 individuals ages 20–34 years old, including degrees awarded to international students. China and India both award more S&E first university degrees than the United States (Figure HED-29), yet they measure substantially lower in terms of S&E degree production intensity (Figure HED-33). The United States awarded over 1,300 S&E first university degrees per 100,000 20- to 34-year-olds in 2020, about twice the rate of China and India. The United States measures comparably to the United Kingdom and Germany, other top sources of S&E human capital, on this metric.
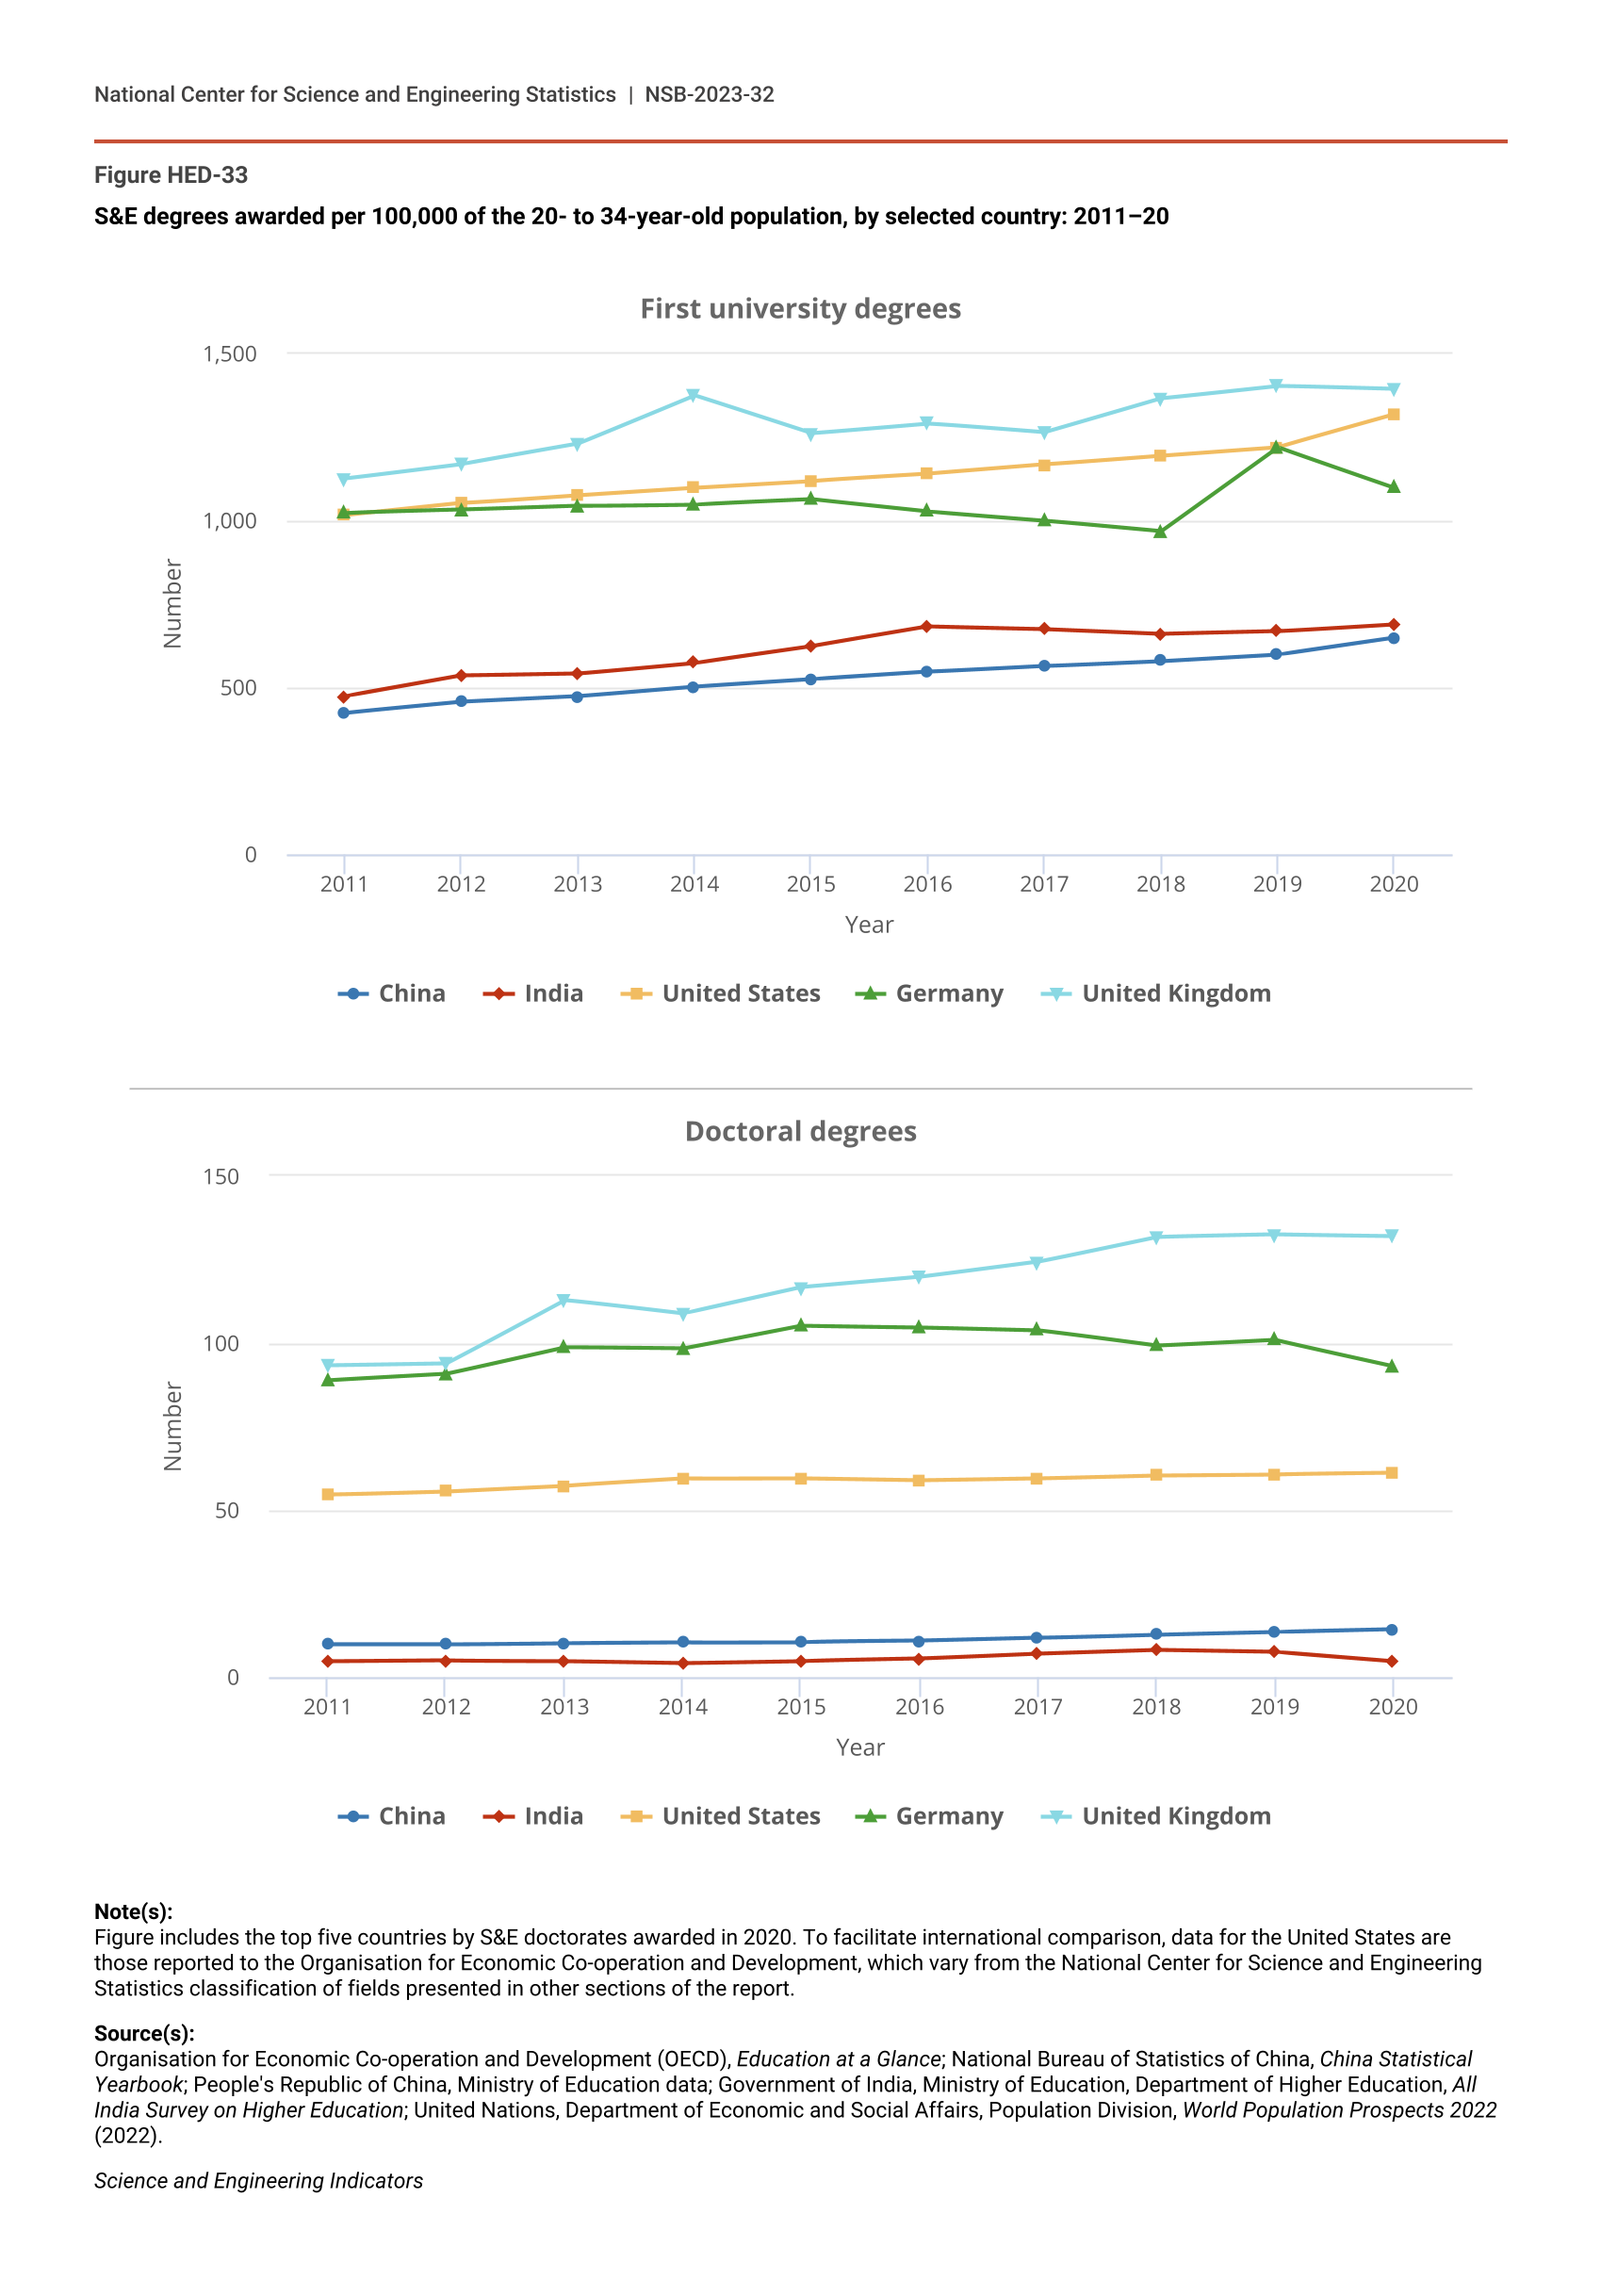
S&E degrees awarded per 100,000 of the 20- to 34-year-old population, by selected country: 2011–20
| Year | China | India | United States | Germany | United Kingdom |
|---|---|---|---|---|---|
| 2011 | 424.0 | 473.4 | 1,015.6 | 1,022.7 | 1,125.9 |
| 2012 | 456.5 | 535.6 | 1,051.5 | 1,031.6 | 1,169.5 |
| 2013 | 473.1 | 541.8 | 1,076.1 | 1,043.4 | 1,230.4 |
| 2014 | 502.0 | 573.9 | 1,098.4 | 1,047.9 | 1,375.2 |
| 2015 | 523.9 | 623.5 | 1,118.5 | 1,063.0 | 1,261.7 |
| 2016 | 546.3 | 682.3 | 1,139.2 | 1,026.6 | 1,291.2 |
| 2017 | 564.3 | 674.5 | 1,167.1 | 999.5 | 1,263.6 |
| 2018 | 579.6 | 660.4 | 1,193.9 | 967.5 | 1,365.5 |
| 2019 | 599.4 | 668.4 | 1,219.3 | 1,218.7 | 1,403.0 |
| 2020 | 650.0 | 689.8 | 1,316.9 | 1,097.7 | 1,393.2 |
| Year | China | India | United States | Germany | United Kingdom |
|---|---|---|---|---|---|
| 2011 | 9.8 | 4.6 | 54.6 | 88.9 | 93.3 |
| 2012 | 9.8 | 4.9 | 55.6 | 90.8 | 93.9 |
| 2013 | 10.2 | 4.8 | 57.3 | 98.8 | 113.0 |
| 2014 | 10.4 | 4.2 | 59.4 | 98.4 | 108.8 |
| 2015 | 10.5 | 4.8 | 59.5 | 105.3 | 116.7 |
| 2016 | 10.8 | 5.5 | 58.9 | 104.8 | 119.8 |
| 2017 | 11.7 | 7.0 | 59.5 | 103.9 | 124.4 |
| 2018 | 12.7 | 8.1 | 60.4 | 99.2 | 131.9 |
| 2019 | 13.5 | 7.5 | 60.7 | 101.0 | 132.6 |
| 2020 | 14.3 | 4.7 | 61.1 | 93.2 | 132.1 |
Note(s):
Figure includes the top five countries by S&E doctorates awarded in 2020. To facilitate international comparison, data for the United States are those reported to the Organisation for Economic Co-operation and Development, which vary from the National Center for Science and Engineering Statistics classification of fields presented in other sections of the report.
Source(s):
Organisation for Economic Co-operation and Development (OECD), Education at a Glance; National Bureau of Statistics of China, China Statistical Yearbook; People's Republic of China, Ministry of Education data; Government of India, Ministry of Education, Department of Higher Education, All India Survey on Higher Education; United Nations, Department of Economic and Social Affairs, Population Division, World Population Prospects 2022 (2022).
Science and Engineering Indicators
Comparisons of S&E degree production intensity show considerable differences among top degree-producing nations at the doctoral level (Figure HED-33). The United Kingdom has the highest degree production intensity, awarding 132 S&E doctoral degrees per 100,000 individuals ages 20–34 years old in 2020, followed by Germany (93) and then the United States (61). Although China and India have both increased their number of S&E degrees awarded over the last decade, these countries remain far eclipsed by advanced economies in S&E doctoral degree production intensity. For example, in 2020 China awarded 14 S&E doctoral degrees per 100,000 20- to 34-year-olds and India awarded 5 S&E doctoral degrees, or about 23% and 8%, respectively, of the degree production intensity of the United States.