 An official website of the United States government

U.S. R&D-to-GDP Ratio Reached 3.43% in 2022, Driven by Experimental Development
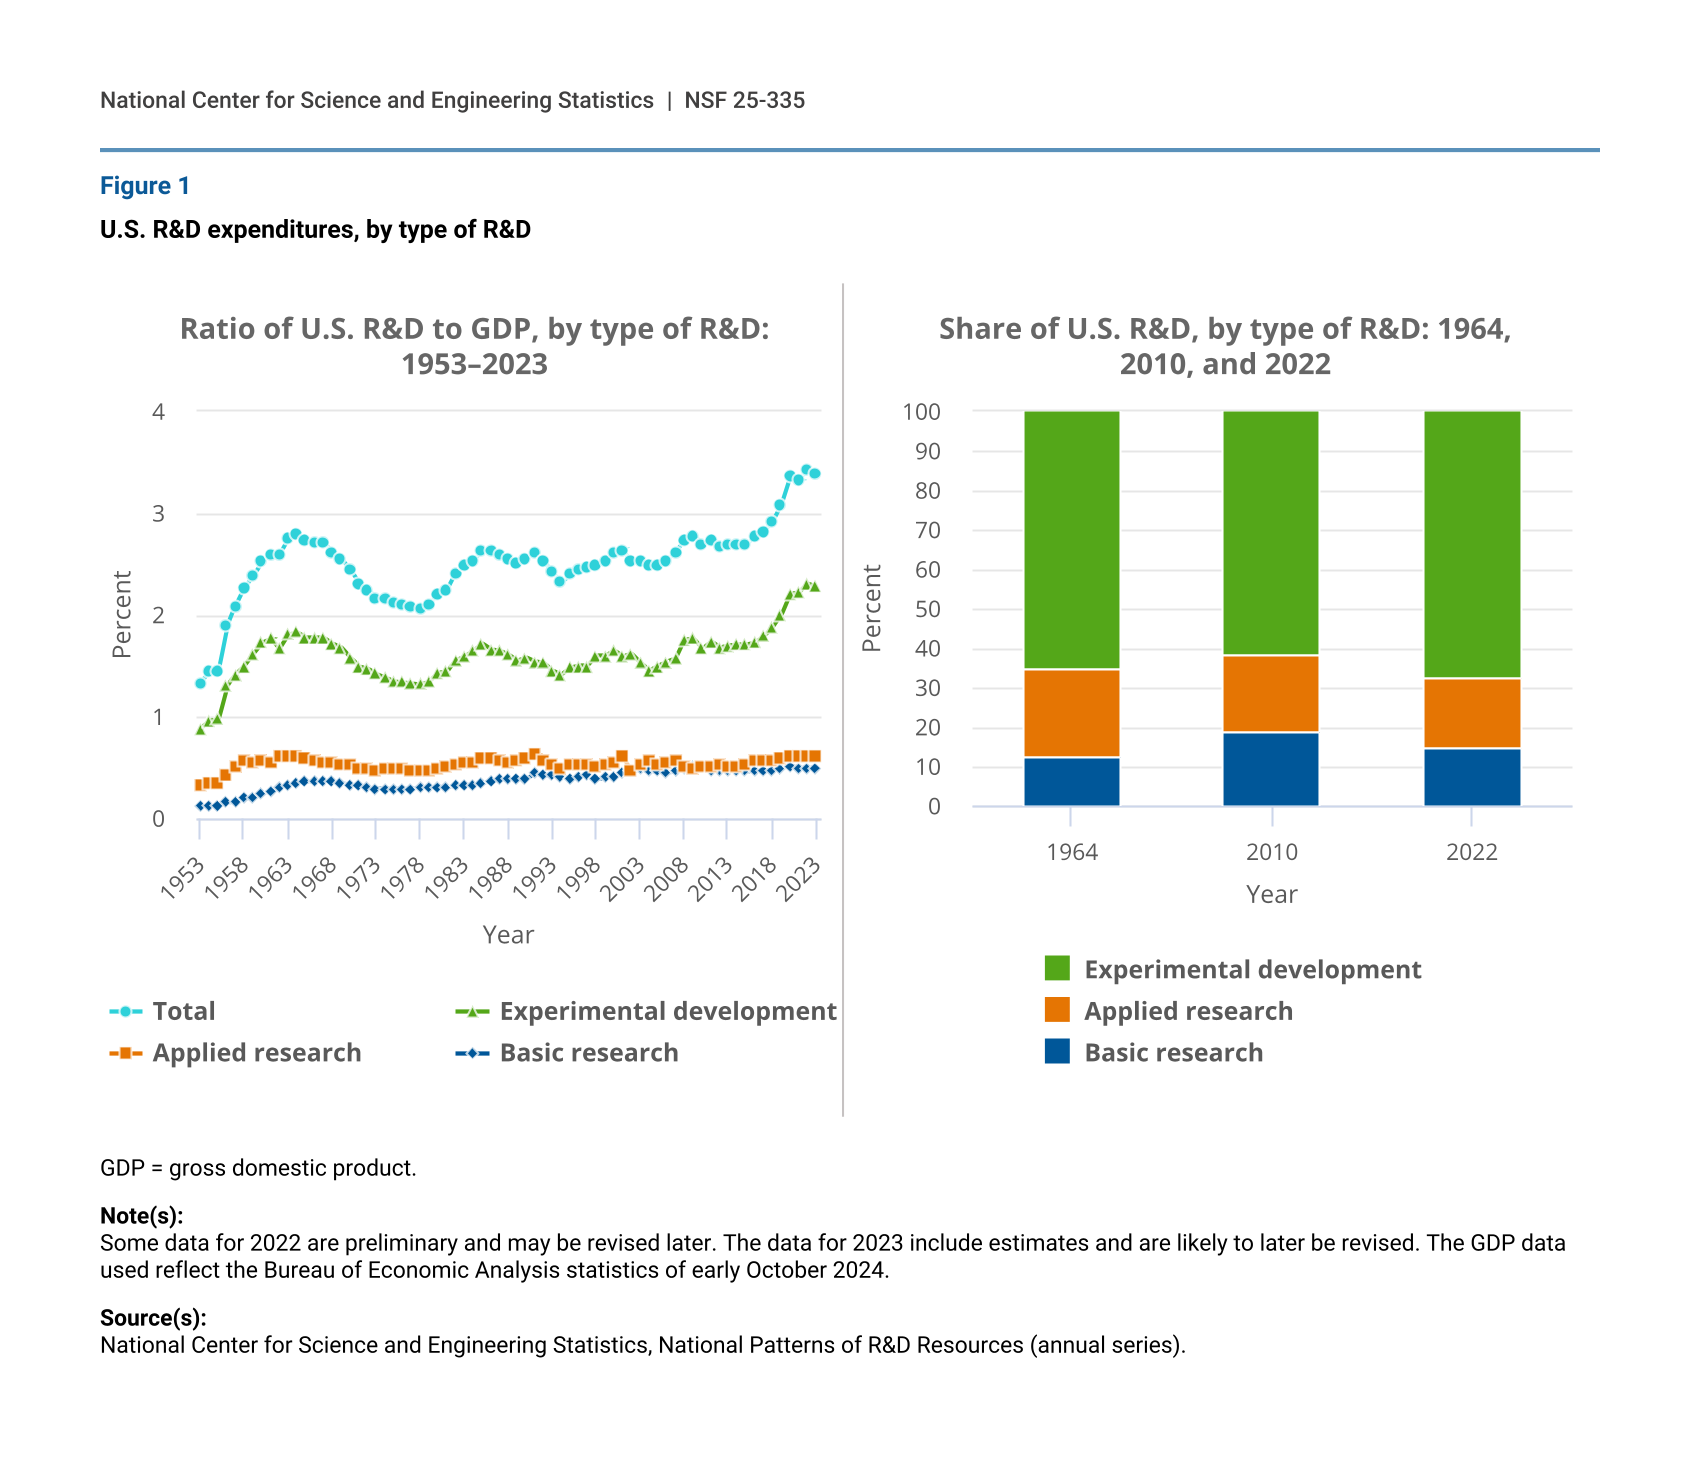
U.S. R&D expenditures, by type of R&D
| Year | Total | Basic research | Applied research | Experimental development |
|---|---|---|---|---|
| 1953 | 1.33 | 0.12 | 0.33 | 0.88 |
| 1954 | 1.44 | 0.13 | 0.35 | 0.96 |
| 1955 | 1.45 | 0.13 | 0.35 | 0.97 |
| 1956 | 1.89 | 0.16 | 0.43 | 1.30 |
| 1957 | 2.09 | 0.17 | 0.51 | 1.41 |
| 1958 | 2.27 | 0.20 | 0.57 | 1.50 |
| 1959 | 2.39 | 0.21 | 0.56 | 1.62 |
| 1960 | 2.53 | 0.24 | 0.57 | 1.73 |
| 1961 | 2.59 | 0.27 | 0.56 | 1.77 |
| 1962 | 2.59 | 0.30 | 0.61 | 1.67 |
| 1963 | 2.75 | 0.33 | 0.61 | 1.81 |
| 1964 | 2.79 | 0.35 | 0.61 | 1.83 |
| 1965 | 2.73 | 0.36 | 0.59 | 1.78 |
| 1966 | 2.71 | 0.36 | 0.57 | 1.78 |
| 1967 | 2.71 | 0.37 | 0.56 | 1.78 |
| 1968 | 2.62 | 0.36 | 0.55 | 1.72 |
| 1969 | 2.55 | 0.34 | 0.54 | 1.68 |
| 1970 | 2.45 | 0.33 | 0.54 | 1.58 |
| 1971 | 2.31 | 0.32 | 0.50 | 1.49 |
| 1972 | 2.25 | 0.30 | 0.48 | 1.47 |
| 1973 | 2.17 | 0.29 | 0.47 | 1.42 |
| 1974 | 2.16 | 0.29 | 0.48 | 1.39 |
| 1975 | 2.12 | 0.29 | 0.48 | 1.35 |
| 1976 | 2.10 | 0.29 | 0.48 | 1.34 |
| 1977 | 2.08 | 0.29 | 0.46 | 1.33 |
| 1978 | 2.07 | 0.30 | 0.46 | 1.32 |
| 1979 | 2.11 | 0.30 | 0.46 | 1.35 |
| 1980 | 2.21 | 0.31 | 0.48 | 1.43 |
| 1981 | 2.25 | 0.30 | 0.51 | 1.44 |
| 1982 | 2.41 | 0.32 | 0.54 | 1.55 |
| 1983 | 2.48 | 0.33 | 0.56 | 1.59 |
| 1984 | 2.53 | 0.33 | 0.56 | 1.65 |
| 1985 | 2.64 | 0.34 | 0.59 | 1.72 |
| 1986 | 2.63 | 0.37 | 0.59 | 1.66 |
| 1987 | 2.60 | 0.38 | 0.58 | 1.65 |
| 1988 | 2.56 | 0.38 | 0.56 | 1.61 |
| 1989 | 2.52 | 0.39 | 0.57 | 1.55 |
| 1990 | 2.55 | 0.39 | 0.59 | 1.58 |
| 1991 | 2.61 | 0.44 | 0.63 | 1.54 |
| 1992 | 2.54 | 0.42 | 0.58 | 1.53 |
| 1993 | 2.42 | 0.42 | 0.54 | 1.45 |
| 1994 | 2.32 | 0.41 | 0.50 | 1.41 |
| 1995 | 2.40 | 0.39 | 0.54 | 1.48 |
| 1996 | 2.44 | 0.41 | 0.53 | 1.50 |
| 1997 | 2.47 | 0.43 | 0.54 | 1.50 |
| 1998 | 2.49 | 0.38 | 0.51 | 1.60 |
| 1999 | 2.54 | 0.40 | 0.54 | 1.60 |
| 2000 | 2.61 | 0.41 | 0.55 | 1.65 |
| 2001 | 2.63 | 0.44 | 0.61 | 1.59 |
| 2002 | 2.54 | 0.46 | 0.46 | 1.62 |
| 2003 | 2.54 | 0.48 | 0.53 | 1.53 |
| 2004 | 2.48 | 0.46 | 0.57 | 1.45 |
| 2005 | 2.49 | 0.46 | 0.54 | 1.50 |
| 2006 | 2.54 | 0.45 | 0.55 | 1.54 |
| 2007 | 2.61 | 0.46 | 0.58 | 1.57 |
| 2008 | 2.74 | 0.48 | 0.51 | 1.76 |
| 2009 | 2.78 | 0.51 | 0.50 | 1.77 |
| 2010 | 2.70 | 0.51 | 0.52 | 1.67 |
| 2011 | 2.73 | 0.47 | 0.52 | 1.74 |
| 2012 | 2.67 | 0.46 | 0.53 | 1.68 |
| 2013 | 2.69 | 0.47 | 0.52 | 1.70 |
| 2014 | 2.70 | 0.47 | 0.52 | 1.71 |
| 2015 | 2.70 | 0.46 | 0.53 | 1.71 |
| 2016 | 2.77 | 0.47 | 0.58 | 1.73 |
| 2017 | 2.82 | 0.46 | 0.58 | 1.79 |
| 2018 | 2.92 | 0.47 | 0.57 | 1.88 |
| 2019 | 3.09 | 0.49 | 0.60 | 2.00 |
| 2020 | 3.36 | 0.52 | 0.62 | 2.21 |
| 2021 | 3.33 | 0.50 | 0.61 | 2.22 |
| 2022 | 3.43 | 0.50 | 0.62 | 2.31 |
| 2023 | 3.39 | 0.50 | 0.61 | 2.28 |
| Year | Basic research | Applied research | Experimental development |
|---|---|---|---|
| 1964 | 12.54 | 21.99 | 65.47 |
| 2010 | 18.81 | 19.40 | 61.79 |
| 2022 | 14.60 | 18.12 | 67.27 |
GDP = gross domestic product.
Note(s):
Some data for 2022 are preliminary and may be revised later. The data for 2023 include estimates and are likely to later be revised. The GDP data used reflect the Bureau of Economic Analysis statistics of early October 2024.
Source(s):
National Center for Science and Engineering Statistics, National Patterns of R&D Resources (annual series).
The ratio of U.S. research and development (R&D) to gross domestic product (GDP) reached 3.43% in 2022. The increase in the R&D-to-GDP ratio between 2010 and 2022 can primarily be attributed to experimental development, which increased as a percentage of GDP during that time from 1.67% to 2.31%, the highest share recorded to date. Prior to recent years, the R&D-to-GDP ratio peaked in 1964 at 2.79%. Basic research comprised 15% of total U.S. R&D in 2022, a decrease from its 2010 share (19%) but above its share in 1964 (13%). The share of applied research in U.S. R&D was 18% in 2022, below both its 2010 share (19%) and 1964 share (22%). The share of experimental development reached 67% in 2022, above both its 2010 share (62%) and 1964 share (65%).
The National Center for Science and Engineering Statistics (NCSES) has reviewed this product for unauthorized disclosure of confidential information and approved its release (NCSES-DRN25-009).
Suggested citation: National Center for Science and Engineering Statistics (NCSES). 2025. U.S. R&D-to-GDP Ratio Reached 3.43% in 2022, Driven by Experimental Development. NSF 25-335. Alexandria, VA: U.S. National Science Foundation. Available at https://ncses.nsf.gov/pubs/nsf25335.
NSF 25-335
|July 8, 2025