 An official website of the United States government

U.S. R&D Increased by $51 Billion in 2020 to $717 Billion; Estimate for 2021 Indicates Further Increase to $792 Billion
New data from the National Center for Science and Engineering Statistics (NCSES) within the National Science Foundation indicate that research and experimental development (R&D) performed in the United States totaled $717.0 billion in 2020 (table 1). The estimated total for 2021, based on performer-reported expectations, is $791.9 billion. U.S. R&D totals were $494.5 billion in 2015 and $406.6 billion in 2010. (All amounts and calculations are reported in current dollars, unless otherwise noted.)
The U.S. R&D system consists of the activities of a diverse group of R&D performers and sources of funding. Included here are private businesses, the federal government, nonfederal governments, higher education institutions, and other nonprofit organizations. The organizations that perform R&D often receive significant levels of outside funding, and organizations that fund R&D may also themselves be performers. The data for this InfoBrief derive mainly from NCSES surveys of the annual R&D expenditures of these performers and funders.
U.S. R&D expenditures, by performing sector and source of funds: 2010–21
FFRDC = federally funded research and development center.
a Some data for 2020 are preliminary and may be revised later.
b The data for 2021 include estimates and are likely to be revised later.
c Includes expenditures of federal intramural R&D as well as costs associated with administering extramural R&D.
d Some components of the R&D performed by nonprofit organizations are estimated and may be revised later.
Note(s):
Data are based on annual reports by performers. Expenditure levels for higher education, federal government, and nonfederal government performers are calendar year approximations based on fiscal year data.
Source(s):
National Center for Science and Engineering Statistics, National Patterns of R&D Resources (annual series).
The “Data Sources, Limitations, and Availability” section at the end of this InfoBrief summarizes the main data sources and methodology and provides further details on the data. Data cited in this report that do not appear in one of this InfoBrief’s tables or figures come from the companion data tables, National Patterns of R&D Resources: 2020–21 Data Update, found at https://ncses.nsf.gov/pubs/nsf23321.
Preliminary 2021 Estimates and Current Trends in U.S. R&D Totals and National R&D Intensity
U.S. Total R&D
Year-over-year increases in U.S. total R&D expenditures averaged $17.6 billion (4.0% Compound Average Growth Rate [CAGR]) over the 2010–15 period. Subsequent yearly increases have been more notable. The three years leading to 2020 saw increases of $50.6 billion (2017–18), $61.8 billion (2018–19) and $50.8 billion (2019–20), averaging a 7.7% rate for 2015–20. For 2021, business R&D and total R&D performance are estimated to increase by $69.2 and $74.9 billion, respectively (table 2).
Annual change in U.S. R&D expenditures and gross domestic product, by performing sector: 1990–2021
NA = not available.
FFRDCs = federally funded research and development centers.
a Some data for 2020 are preliminary and may be revised later.
b The R&D data for 2021 include estimates and are likely to be revised later.
c Survey data on state internal R&D performance were not available prior to 2006; data for 2008 were not collected.
d Some components of the R&D performed by nonprofit organizations are estimated and may later be revised.
Note(s):
The longer term trend rates are calculated as compound annual growth rates.
Source(s):
National Center for Science and Engineering Statistics, National Patterns of R&D Resources (annual series).
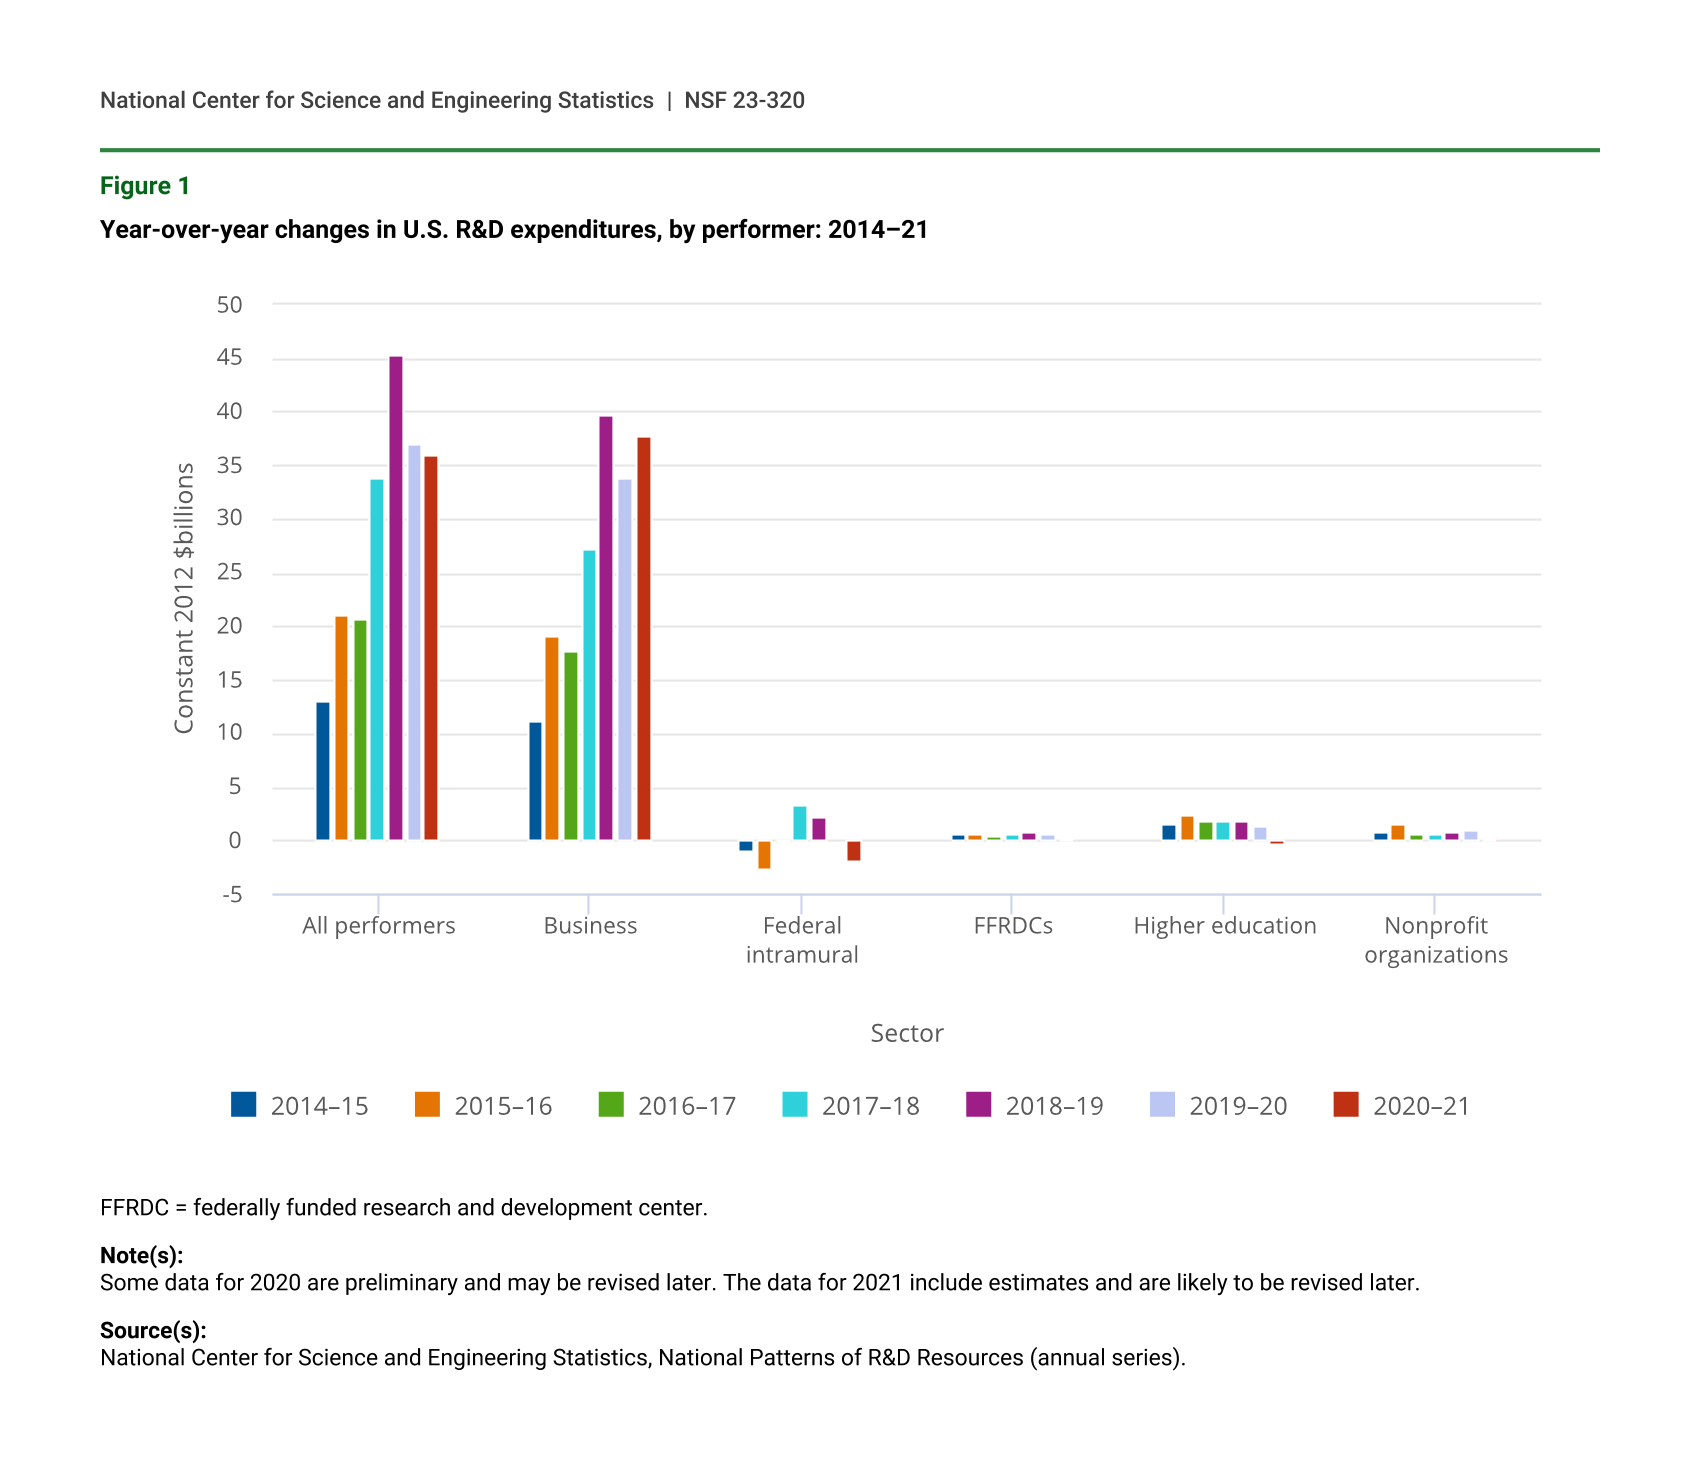
Adjusting for inflation, growth in U.S. total R&D averaged 4.1% annually over the 2010–20 period. By comparison, average annual growth of U.S. total R&D in the prior decade (2000–10) was lower at 2.1%. The estimate for 2021 shows inflation-adjusted R&D growing at 5.7% from the 2020 level. Comparisons in constant dollars demonstrate the effect of recent increased inflation on real R&D performance. In constant dollar terms, business R&D performance is estimated to increase by $37.7 billion over the 2020 level, while performance in the government and higher education sectors is estimated to decline (table 2, figure 1).
Year-over-year changes in U.S. R&D expenditures, by performer: 2014–21
| Sector | 2014–15 | 2015–16 | 2016–17 | 2017–18 | 2018–19 | 2019–20 | 2020–21 |
|---|---|---|---|---|---|---|---|
| All performers | 13.151 | 21.038 | 20.566 | 33.793 | 45.354 | 37.004 | 35.929 |
| Business | 11.160 | 19.049 | 17.684 | 27.201 | 39.726 | 33.872 | 37.702 |
| Federal intramural | -0.891 | -2.628 | -0.125 | 3.432 | 2.152 | -0.017 | -1.807 |
| FFRDCs | 0.541 | 0.557 | 0.490 | 0.682 | 0.874 | 0.558 | 0.196 |
| Higher education | 1.586 | 2.373 | 1.888 | 1.862 | 1.714 | 1.473 | -0.368 |
| Nonprofit organizations | 0.750 | 1.669 | 0.628 | 0.620 | 0.869 | 1.120 | 0.239 |
FFRDC = federally funded research and development center.
Note(s):
Some data for 2020 are preliminary and may be revised later. The data for 2021 include estimates and are likely to be revised later.
Source(s):
National Center for Science and Engineering Statistics, National Patterns of R&D Resources (annual series).
R&D-to-GDP Ratio
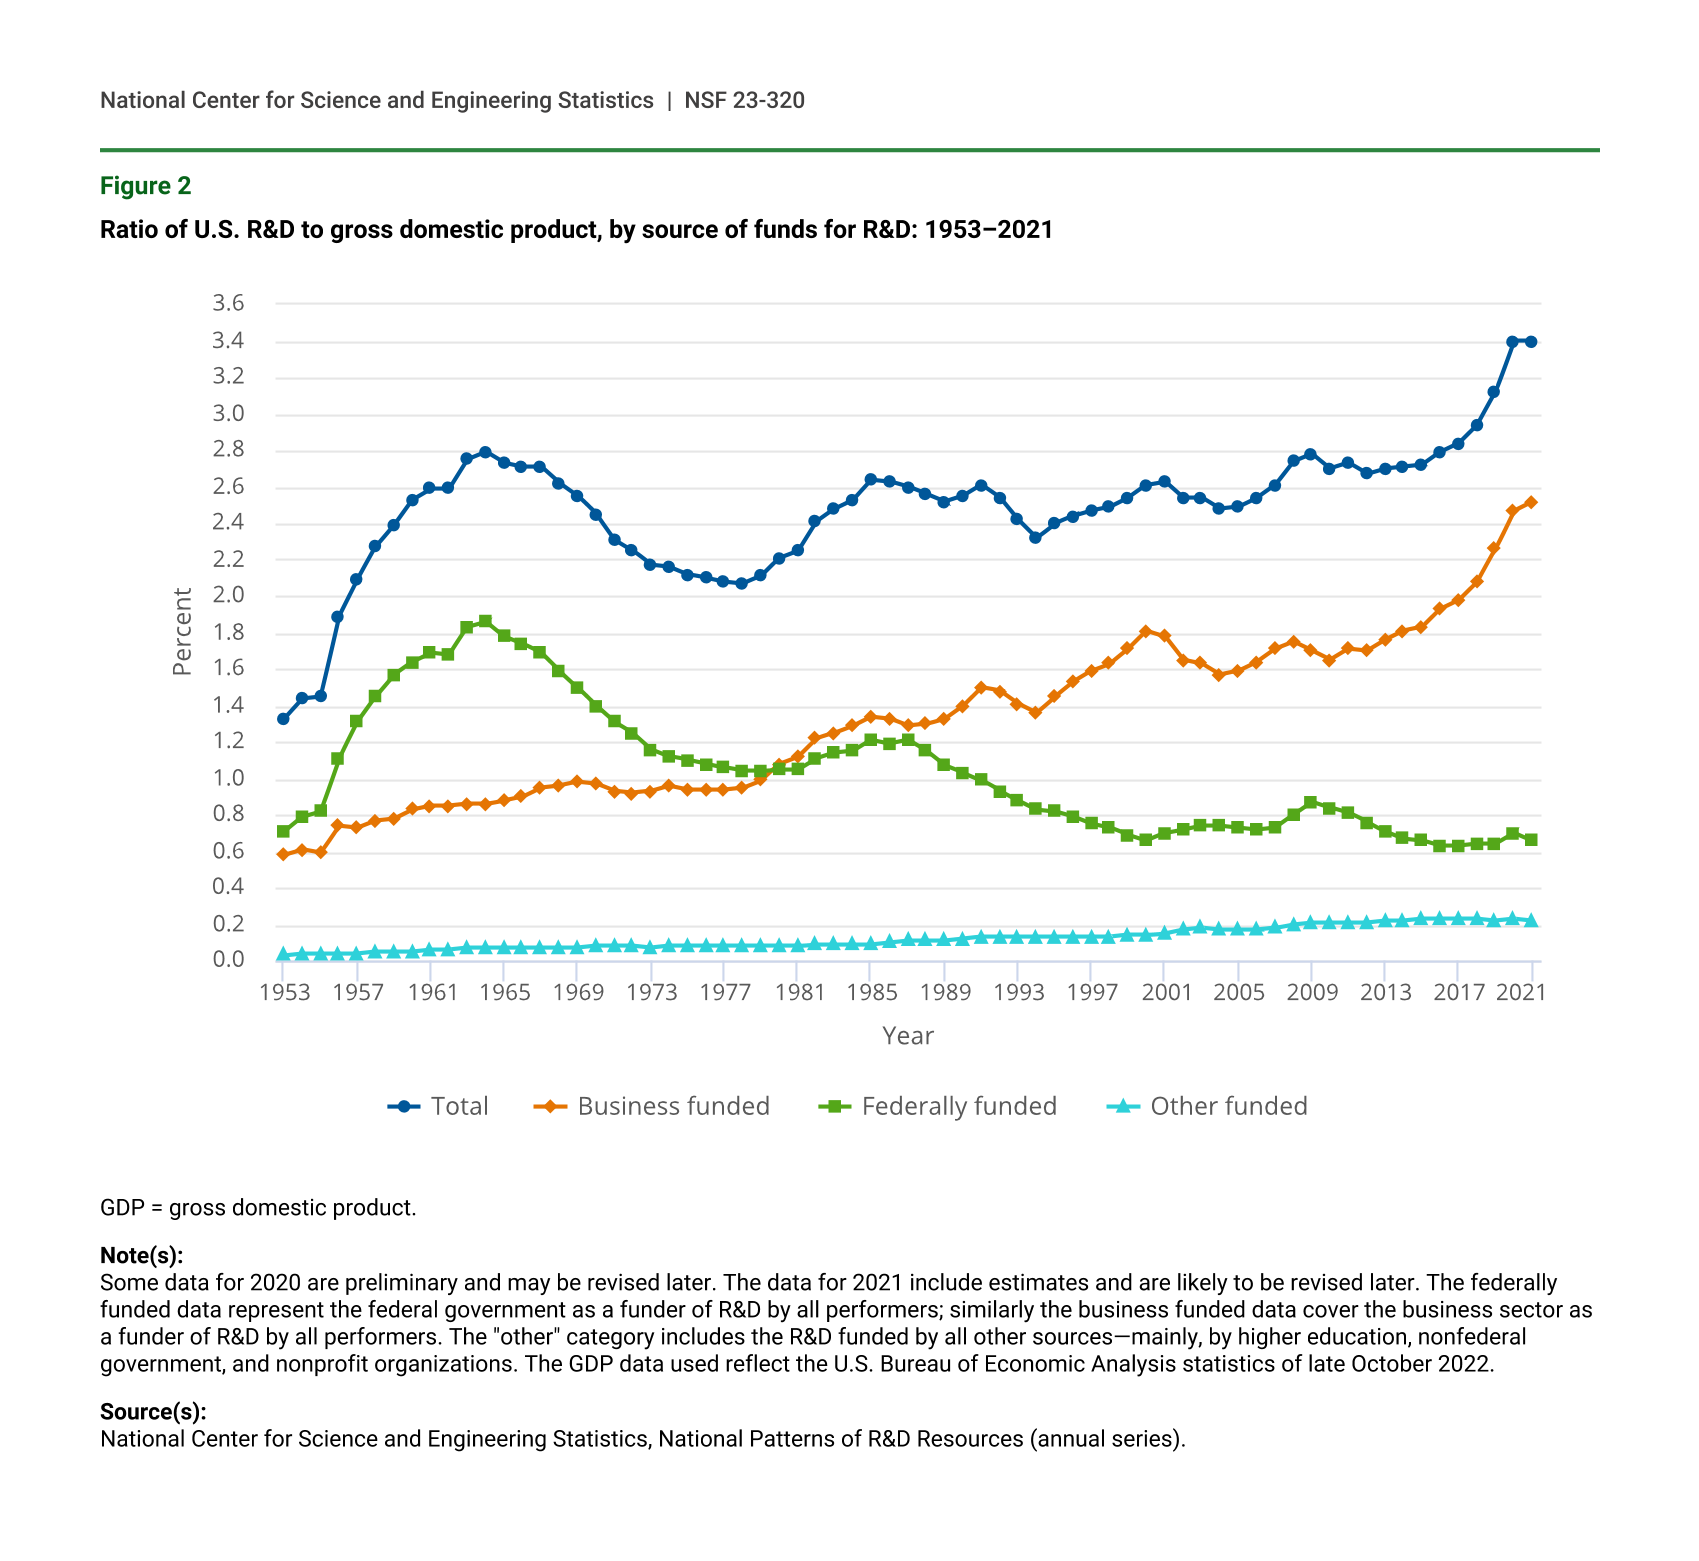
The ratio of total national R&D expenditures to gross domestic product (GDP) (i.e., R&D intensity) is widely used by national statistical offices and other policy analysts as an overall gauge of the relative priority of a nation’s R&D effort among multiple investment and consumption options. In this edition of the National Patterns series, the ratio of U.S. R&D to GDP was 3.40% in 2020 and is estimated to remain at 3.40% in 2021 (figure 2). Prior to 2019 when R&D intensity reached 3.12%, the highest U.S. ratios recorded were 2.79% in 1964, 2.78% in 2009, 2.79% again in 2016, 2.84% in 2017, and 2.94% in 2018. Reaching an R&D intensity level above 3.0% is widely regarded in the R&D policy community as a notable national achievement. U.S. R&D to GDP exceeded the Organisation for Economic Co-operation and Development average (2.67%). The U.S. ratio also exceeded that of other key R&D performing nations, such as China (2.40%), France (2.35%), and the United Kingdom (1.71% [2019]). Israel (5.44%) and South Korea (4.81%) had higher ratios than the United States, whereas Germany (3.13%) and Japan (3.27%) had similar ratios to the United States.
Ratio of U.S. R&D to gross domestic product, by source of funds for R&D: 1953–2021
| Year | Total | Business funded | Federally funded | Other funded |
|---|---|---|---|---|
| 1953 | 1.33 | 0.58 | 0.71 | 0.03 |
| 1954 | 1.44 | 0.61 | 0.79 | 0.04 |
| 1955 | 1.45 | 0.59 | 0.82 | 0.04 |
| 1956 | 1.89 | 0.74 | 1.11 | 0.04 |
| 1957 | 2.09 | 0.73 | 1.31 | 0.04 |
| 1958 | 2.27 | 0.77 | 1.45 | 0.05 |
| 1959 | 2.39 | 0.78 | 1.57 | 0.05 |
| 1960 | 2.53 | 0.83 | 1.64 | 0.05 |
| 1961 | 2.59 | 0.85 | 1.69 | 0.06 |
| 1962 | 2.59 | 0.85 | 1.68 | 0.06 |
| 1963 | 2.75 | 0.86 | 1.83 | 0.07 |
| 1964 | 2.79 | 0.86 | 1.86 | 0.07 |
| 1965 | 2.73 | 0.88 | 1.78 | 0.07 |
| 1966 | 2.71 | 0.90 | 1.74 | 0.07 |
| 1967 | 2.71 | 0.95 | 1.69 | 0.07 |
| 1968 | 2.62 | 0.96 | 1.59 | 0.07 |
| 1969 | 2.55 | 0.98 | 1.50 | 0.07 |
| 1970 | 2.45 | 0.97 | 1.40 | 0.08 |
| 1971 | 2.31 | 0.93 | 1.31 | 0.08 |
| 1972 | 2.25 | 0.92 | 1.25 | 0.08 |
| 1973 | 2.17 | 0.93 | 1.16 | 0.07 |
| 1974 | 2.16 | 0.96 | 1.12 | 0.08 |
| 1975 | 2.12 | 0.94 | 1.10 | 0.08 |
| 1976 | 2.10 | 0.94 | 1.08 | 0.08 |
| 1977 | 2.08 | 0.94 | 1.06 | 0.08 |
| 1978 | 2.07 | 0.95 | 1.04 | 0.08 |
| 1979 | 2.11 | 0.99 | 1.04 | 0.08 |
| 1980 | 2.21 | 1.08 | 1.05 | 0.08 |
| 1981 | 2.25 | 1.12 | 1.05 | 0.08 |
| 1982 | 2.41 | 1.22 | 1.11 | 0.09 |
| 1983 | 2.48 | 1.25 | 1.14 | 0.09 |
| 1984 | 2.53 | 1.29 | 1.15 | 0.09 |
| 1985 | 2.64 | 1.34 | 1.21 | 0.09 |
| 1986 | 2.63 | 1.33 | 1.19 | 0.10 |
| 1987 | 2.60 | 1.29 | 1.21 | 0.11 |
| 1988 | 2.56 | 1.30 | 1.15 | 0.11 |
| 1989 | 2.52 | 1.33 | 1.07 | 0.11 |
| 1990 | 2.55 | 1.40 | 1.03 | 0.12 |
| 1991 | 2.61 | 1.50 | 0.99 | 0.13 |
| 1992 | 2.54 | 1.48 | 0.93 | 0.13 |
| 1993 | 2.42 | 1.41 | 0.88 | 0.13 |
| 1994 | 2.32 | 1.36 | 0.83 | 0.13 |
| 1995 | 2.40 | 1.45 | 0.82 | 0.13 |
| 1996 | 2.44 | 1.53 | 0.79 | 0.13 |
| 1997 | 2.47 | 1.59 | 0.75 | 0.13 |
| 1998 | 2.49 | 1.63 | 0.73 | 0.13 |
| 1999 | 2.54 | 1.71 | 0.69 | 0.14 |
| 2000 | 2.61 | 1.81 | 0.66 | 0.14 |
| 2001 | 2.63 | 1.78 | 0.70 | 0.15 |
| 2002 | 2.54 | 1.65 | 0.72 | 0.17 |
| 2003 | 2.54 | 1.63 | 0.74 | 0.18 |
| 2004 | 2.48 | 1.57 | 0.74 | 0.17 |
| 2005 | 2.49 | 1.59 | 0.73 | 0.17 |
| 2006 | 2.54 | 1.64 | 0.72 | 0.17 |
| 2007 | 2.61 | 1.71 | 0.73 | 0.18 |
| 2008 | 2.74 | 1.75 | 0.80 | 0.20 |
| 2009 | 2.78 | 1.70 | 0.87 | 0.21 |
| 2010 | 2.70 | 1.65 | 0.84 | 0.21 |
| 2011 | 2.73 | 1.71 | 0.81 | 0.21 |
| 2012 | 2.67 | 1.70 | 0.76 | 0.21 |
| 2013 | 2.70 | 1.76 | 0.71 | 0.22 |
| 2014 | 2.71 | 1.81 | 0.67 | 0.22 |
| 2015 | 2.72 | 1.83 | 0.66 | 0.23 |
| 2016 | 2.79 | 1.93 | 0.63 | 0.23 |
| 2017 | 2.84 | 1.98 | 0.63 | 0.23 |
| 2018 | 2.94 | 2.08 | 0.64 | 0.23 |
| 2019 | 3.12 | 2.26 | 0.64 | 0.22 |
| 2020 | 3.40 | 2.47 | 0.70 | 0.23 |
| 2021 | 3.40 | 2.52 | 0.66 | 0.22 |
GDP = gross domestic product.
Note(s):
Some data for 2020 are preliminary and may be revised later. The data for 2021 include estimates and are likely to be revised later. The federally funded data represent the federal government as a funder of R&D by all performers; similarly the business funded data cover the business sector as a funder of R&D by all performers. The "other" category includes the R&D funded by all other sources—mainly, by higher education, nonfederal government, and nonprofit organizations. The GDP data used reflect the U.S. Bureau of Economic Analysis statistics of late October 2022.
Source(s):
National Center for Science and Engineering Statistics, National Patterns of R&D Resources (annual series).
The extent to which the rising ratio of U.S. R&D to GDP is attributable to increased business funding of R&D is clear. In the decade leading up to 2020, business funding grew at a 7.7% (CAGR) rate in 2010–20, while federal funding grew at a 1.5% rate and GDP grew at a 3.4% rate. Notably, the higher education sector’s funding of R&D grew at 6.6% over the same period.
Federally funded R&D as a percentage of GDP peaked in the 1960s at 1.86% in 1964 and generally has declined since. Even with the infusion of the American Recovery and Reinvestment Act (ARRA) funds, federally funded R&D did not rise higher than 0.87% of GDP in 2009. For the latter half of the past decade, federal funding for R&D remained at or below 0.70% of GDP. By contrast, business R&D funding in 2010 was 1.65% of GDP and increased to 2.47% by 2020.
Performers of R&D
Business
The business sector is by far the largest performer of U.S. R&D. In 2020, domestically performed business R&D accounted for $543.2 billion, or 76% of the $717.0 billion national R&D total (table 1 and table 3). The business sector’s predominance in national R&D performance has long been the case, with its annual share ranging between 69% and 76% since 2000.
R&D performed in the domestic United States by businesses occurs widely in manufacturing and nonmanufacturing. In 2020, companies in manufacturing industries performed 57% of business R&D. Among nonmanufacturing industries, information (including software publishing) and professional and scientific services accounted for 80% of the remainder.
U.S. R&D expenditures, by performing sector, source of funds, and type of R&D: 2020
* = amount < $0.5 million; ** = small to negligible amount, included as part of the funding provided by nonprofit organizations.
FFRDC = federally funded research and development center.
Note(s):
Some data for 2020 are preliminary and may be revised later. Some components of R&D performance and funding by other nonprofit organizations are projected and may later be revised.
Source(s):
National Center for Science and Engineering Statistics, National Patterns of R&D Resources (annual series).
Higher Education
R&D performed in the United States by the higher education sector totaled $80.8 billion in 2020, or 11% of U.S. total R&D (table 1 and table 3). In the period 2000–20, the higher education share of U.S. total R&D ranged between 11% and 14%.
Adjusted for inflation, growth in this sector’s R&D performance averaged 1.6% annually during 2010–20, well behind U.S. total R&D (4.1%). For the preceding decade, growth in higher education R&D performance was a robust 4.6%. The annual percent change in 2010–20 varied; there was low growth or contraction in 2010–14 with a return to modest increases in 2015–20. The estimate for 2021 indicates a slight contraction (-0.5%) when measured in constant dollars as inflation outpaces a slight increase in the level of higher education R&D performance (table 2).
Federal Agencies and Federally Funded Research and Development Centers
The federal government performed $64.2 billion of the U.S. R&D total in 2020 (table 1 and table 3). This amount included $40.4 billion (6% of the U.S. total) performed by the intramural R&D facilities of federal agencies and $23.9 billion (3%) performed by the 43 federally funded research and development centers (FFRDCs). The federal share of U.S. R&D performance ranged between 11% and 13% in 2000–10. Subsequently, the federal share declines to 8% in 2021. Much like recent R&D trends in the education sector, a modest 1.5% year-over-year increase in nominal federal R&D performance estimated for 2021 results in a 2.9% decline when measured in constant dollars (table 2).
State Government
Nonprofit Organizations
R&D performed in the United States by nonprofit organizations (excluding higher education institutions and federal and nonfederal government) was $28.0 billion in 2020, based on a new annual survey of this sector (table 1 and table 3). This was 4% of U.S. total R&D, a share that has changed little since the early 2000s.
R&D by Type of R&D
In 2020, basic research activities in all sectors accounted for $111.9 billion, or 16% of U.S. total R&D expenditures (table 4). Applied research was $133.3 billion, or 19% of the total. Most of the total of U.S. R&D expenditures was experimental development at $471.7 billion, or 66%.
The higher education sector accounted for just under half (45%) of basic research performance in 2020 (table 4). The business sector was the second-largest basic research performer (33%). Business was the majority performer (59%) of the $133.3 billion of applied research in 2020. Higher education was second at 17%; federal intramural performers plus FFRDCs accounted for 16% of the applied research total. Business continued to dominate development performance, accounting for 91% of the U.S. total $471.7 billion of that category in 2020.
Federal funding accounted for 41% of the $111.9 billion of basic research in 2020 (table 3). But federal funds were less prominent for applied research (33% of $133.3 billion) and experimental development (12% of $471.7 billion). The business sector provided the greatest share of funding for applied research (56%) and the predominant share for experimental development (86%). Interestingly, it also accounted for a sizable share (34%) of funding for basic research.
Over the 2010–20 period, the split of U.S. total R&D expenditures among the three types of R&D did not largely change. The share of applied research ranged between 19% and 21% throughout the period (table 4). Similarly, except for 2010 (possibly impacted by ARRA funds), the share of basic research remained in the 16%–17% range. Experimental development’s share was 62% in 2010 and remained at or below 66% through 2020. Adjusting for inflation, about $19 billion more in basic research was performed in 2020 than in 2010, $35 billion more in applied research, and $153 billion more in experimental development.
U.S. R&D expenditures, by type of R&D: Selected years, 1970–2021
NA = not available.
FFRDC = federally funded research and development center.
a Some data for 2020 are preliminary and may be revised later.
a The data for 2021 include estimates and are likely to be revised later.
Note(s):
Data throughout the span of time reported here are consistently based on Organisation for Economic Co-operation and Development Frascati Manual definitions for basic research, applied research, and experimental development. Prior to 2010, however, some changes had been introduced in the questionnaires of the sectoral expenditure surveys to improve the accuracy of respondents' classification of their R&D by type. Accordingly, small percentage changes in the historical data may not be meaningful.
Source(s):
National Center for Science and Engineering Statistics, National Patterns of R&D Resources (annual series).
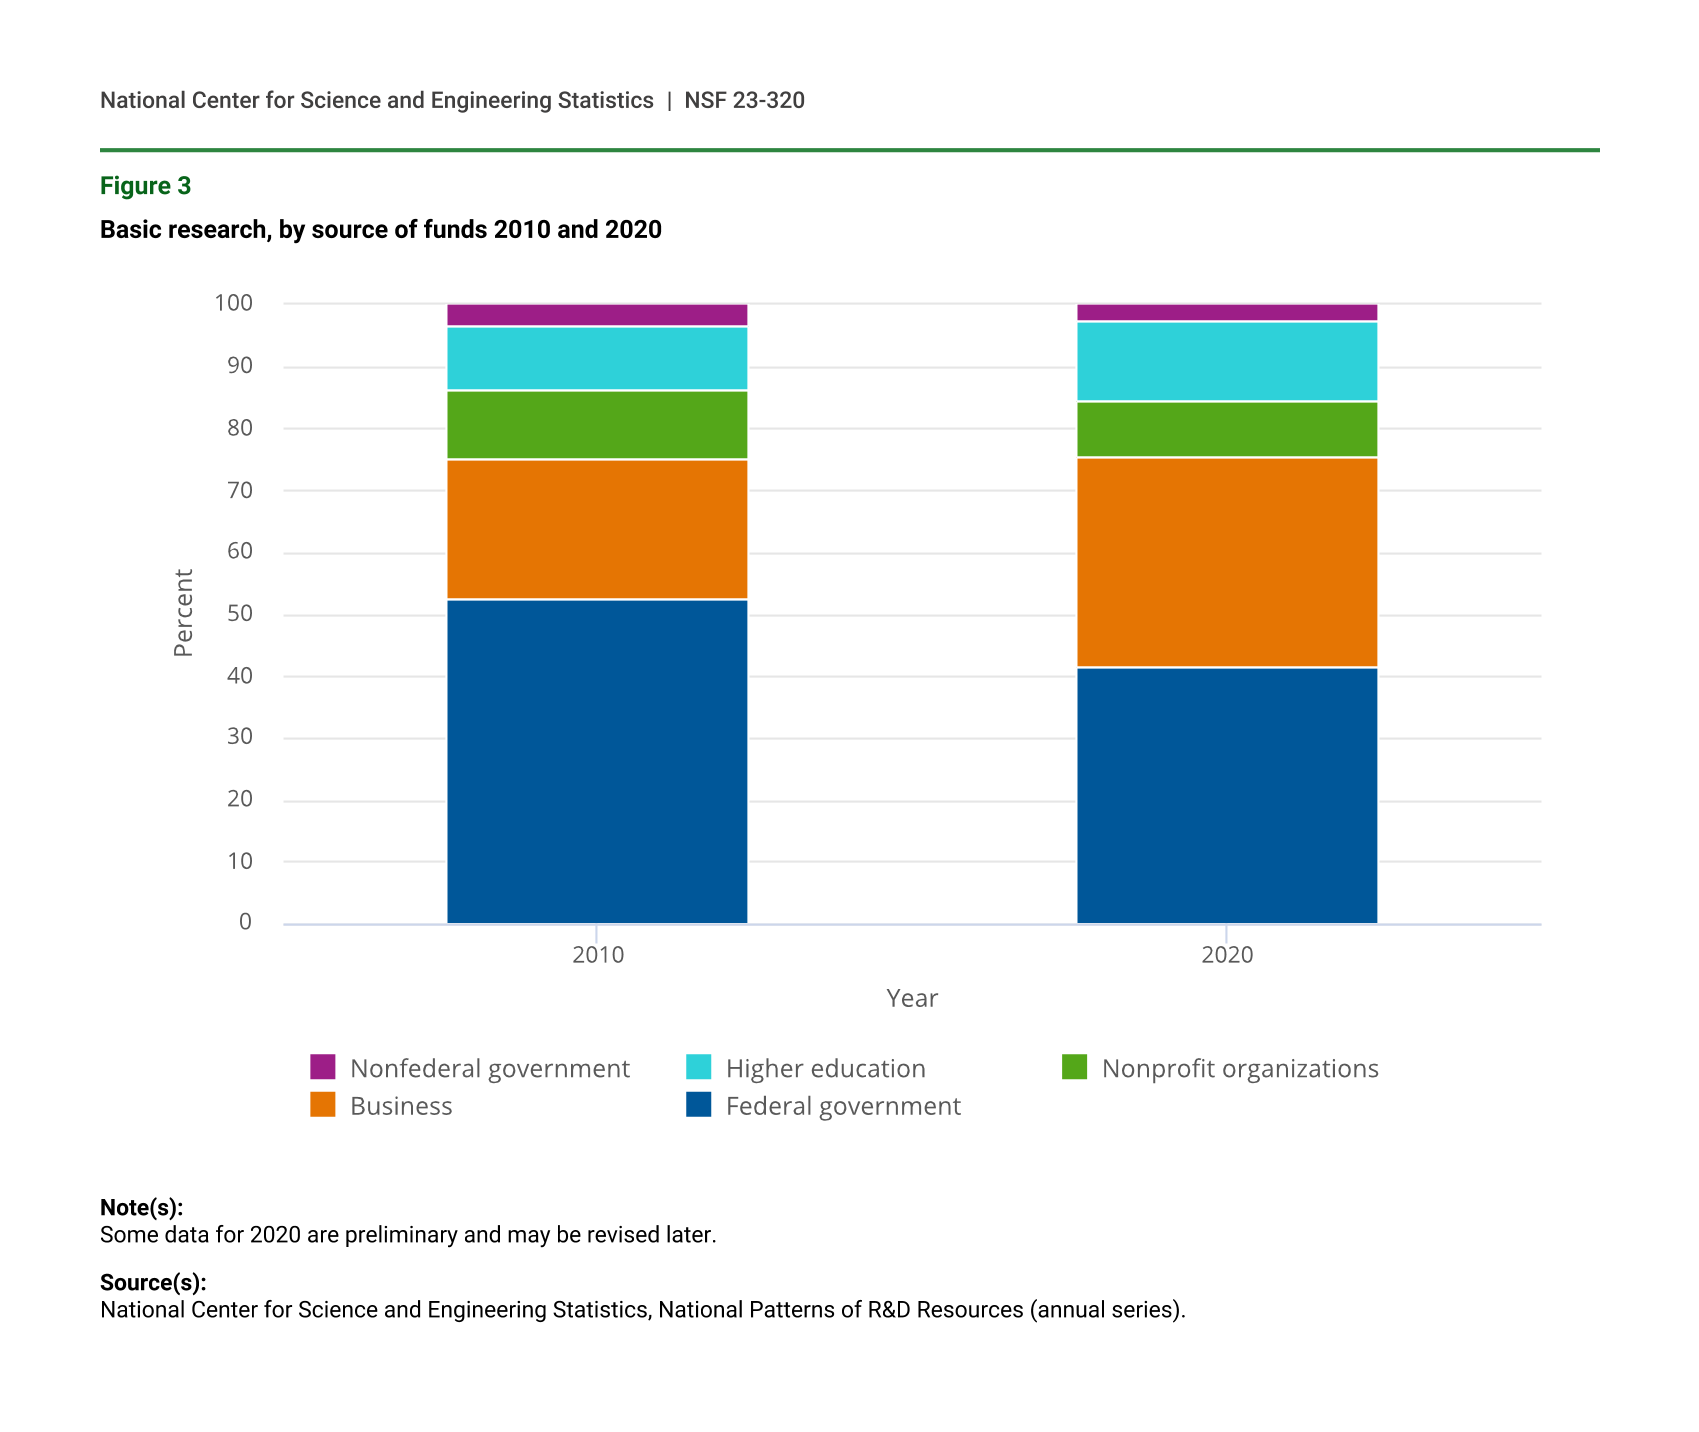
The shifting in the relative roles of performers and funders by sector—particularly among business, government, and higher education—are of great interest (table 4, figure 3). In 2010, businesses performed 21% of U.S. basic research, but the sector’s share of basic research rose to 33% by 2020. The share of U.S. basic research performed by higher education institutions—historically, the nation’s largest basic research performer—declined from 51% in 2010 to 45% in 2020, although in absolute terms higher education basic research performance increased from $39 billion to $51 billion during this period. Further, businesses funded 23% of U.S. basic research in 2010, rising to 34% in 2020 (figure 3). Over the same period, the federally funded share declined from 52% in 2010 to 41% in 2020. The increased relative performance of the business sector as a performer and funder of basic research is remarkable.
Basic research, by source of funds 2010 and 2020
| Year | Federal government | Business | Nonprofit organizations | Higher education | Nonfederal government |
|---|---|---|---|---|---|
| 2010 | 52.4 | 22.8 | 11.1 | 10.5 | 3.1 |
| 2020 | 41.3 | 34.2 | 9.0 | 12.9 | 2.6 |
Note(s):
Some data for 2020 are preliminary and may be revised later.
Source(s):
National Center for Science and Engineering Statistics, National Patterns of R&D Resources (annual series).
Data Sources, Limitations, and Availability
The statistics on U.S. R&D presented in this report derive mainly from integrating the data on R&D expenditures and funding collected by NCSES’s annual national surveys of the organizations that perform and fund the vast majority of U.S. R&D. These surveys cover each of four sectors of the economy: higher education, government, business enterprise, and nonprofit organizations. In some cases, the primary data from these surveys are adjusted to enable consistent integration of the statistics across these separately conducted surveys. In addition, preliminary or otherwise estimated values may be used where final data from one or more of the surveys are not yet available but can reasonably be calculated. Estimates in this InfoBrief are based on census and sample survey data which are subject to nonsampling error. Sample-survey–based estimates are also subject to sampling error. All comparative statements in this InfoBrief have undergone statistical testing and are significant at the 90% confidence level except statements reliant on modeled estimates.
The R&D surveys include NCSES’s annual surveys of business R&D (the Business Enterprise Research and Development Survey for 2019–20, the preceding Business Research and Development Survey for 2017–18, the Business R&D and Innovation Survey for 2008–16, and the Survey of Industrial R&D for 2007 and earlier years). In addition, the business R&D totals include the R&D expenditures reported by “micro” companies (defined as companies with fewer than 10 employees) through NCSES surveys fielded for 2016 and forward (the 2016 Business R&D and Innovation Survey—Microbusiness and the Annual Business Survey (ABS) since 2017). Other NCSES survey data sources are the Higher Education Research and Development Survey (for FYs 2010–20), and the preceding Survey of R&D Expenditures at Universities and Colleges (FY 2009 and earlier years), the Survey of Federal Funds for Research and Development (FYs 2020–21 and earlier years), and the FFRDC Research and Development Survey (FY 2020 and earlier years). Amounts for the R&D performed by nonprofit organizations with funding from the nonprofit sector and from business sources are estimated based on data and parameters from the FY 2020 Nonprofit Research Activities (NPRA) module of the ABS, the 2016 NPRA Survey, and the 1996–97 Survey of R&D Funding and Performance by Nonprofit Organizations.
A full set of detailed statistical tables associated with the National Patterns data is available in the companion report: National Patterns of R&D Resources: 2020–21 Data Update, at https://ncses.nsf.gov/pubs/nsf23321. This supplementary report also provides further details on the nature of the data and the National Patterns methodologies. For further information and questions, contact the author.
Notes
1Research and experimental development (R&D) comprise creative and systematic work undertaken in order to increase the stock of knowledge—including knowledge of humankind, culture, and society—and to devise new applications of available knowledge. Basic research is experimental or theoretical work undertaken primarily to acquire new knowledge of the underlying foundations of phenomena and observable facts, without any particular application or use in view. Applied research is original investigation undertaken in order to acquire new knowledge; directed primarily toward a specific, practical aim or objective. Experimental development is systematic work, drawing on knowledge gained from research and practical experience and producing additional knowledge, which is directed to producing new products or processes or to improving existing products or processes. See Organisation for Economic Co-Operation and Development (OECD). 2015. Frascati Manual 2015: Guidelines for Collecting and Reporting Data on Research and Experimental Development. The Measurement of Scientific, Technological and Innovation Activities, OECD Publishing: Paris. Available at https://doi.org/10.1787/9789264239012-en.
2In this report, dollars adjusted for inflation (i.e., constant dollars) are based on the gross domestic product (GDP) implicit price deflator (currently in 2012 dollars) as published by the Bureau of Economic Analysis (BEA) at https://www.bea.gov/iTable/index_nipa.cfm. Note that GDP deflators are calculated on an economy-wide scale and do not explicitly focus on R&D.
3Inflation measured by the Consumer Price Index (CPI) for 2014–20 ranged between 0.1% and 2.4%. In 2021, inflation was 4.7% (https://www.minneapolisfed.org/about-us/monetary-policy/inflation-calculator/consumer-price-index-1913-).
4Due to sample variability in the data for the business R&D component, the calculated R&D-to-GDP ratios for 1964, 2009, and 2017 are not significantly different from one another at a 90% confidence level.
5See Organisation for Economic Co-Operation and Development, Main Science and Technology Indicators, 2022, Paris. Available at https://www.oecd.org/sti/msti.htm.
6Additional statistics on R&D performed in the United States by the business sector are available at https://www.nsf.gov/statistics/srvyberd/. See also Wolfe R; National Center for Science and Engineering Statistics (NCSES). 2022. Businesses Spent Over a Half Trillion Dollars for R&D Performance in the United States During 2020, a 9.1% Increase Over 2019. NSF 22-343. Alexandria, VA: National Science Foundation. Available at http://ncses.nsf.gov/pubs/nsf22343.
7The data on higher education R&D reported by National Patterns differ from the underlying survey data in several respects. First, National Patterns translates the Higher Education R&D (HERD) Survey’s primary data in academic fiscal years to calendar year equivalents. Second, National Patterns reports higher education R&D expenditures that are adjusted to remove the double-counting of pass-through funding that are included in HERD Survey source data. For further details on this topic, see “Technical Notes” in the companion report National Center for Science and Engineering Statistics (NCSES). 2023. National Patterns of R&D Resources: 2020–21 Data Update. NSF 23-321. Alexandria, VA: National Science Foundation. Available at https://ncses.nsf.gov/pubs/nsf23321.
8The number of FFRDCs reflects that NCSES was informed in June 2021 that the Green Bank Observatory separated from the National Radio Astronomy Observatory in October 2016 to become an independent institution; both retained FFRDC status. The Master Government List of FFRDCs was subsequently updated to reflect this change.
9The most recent data on nonprofit organization R&D come from the FY 2020 Nonprofit Research Activities (NPRA) module of the ABS and the 2016 NPRA Survey. Data for nonprofit organization R&D, 2017–19 are estimated based on the 2016 and 2020 data. The availability of 2020 survey data allowed for improved measurement of nonprofit R&D performance over 2017–21 period, resulting in minor changes to previously published estimates. For 1998–2015, data for nonprofit organization R&D funded by the federal government come from the NCSES annual Survey of Federal Funds for Research and Development; data for that funded by businesses and by the nonprofit sector itself are estimated, based on parameters from the 1996–97 Survey of Research and Development Funding and Performance by Nonprofit Organizations.
10For further details on the correspondence between sectors used to measure R&D and those used in the System of National Accounts, please see the Frascati Manual 2015: Guidelines for Collecting and Reporting Data on Research and Experimental Development.
11Estimates from the NCSES business R&D surveys mentioned are all derived from sample data and thereby contain sampling error. Consequently, estimates of total U.S. R&D also contain sampling error. For more information on this topic and other surveys used in the National Patterns tabulations, see the “Technical Notes” in the companion report available at https://ncses.nsf.gov/pubs/nsf23321.
Suggested Citation
Anderson G, Jankowski J, and Boroush M; National Center for Science and Engineering Statistics (NCSES). 2023. U.S. R&D Increased by $51 Billion in 2020 to $717 Billion; Estimate for 2021 Indicates Further Increase to $792 Billion. NSF 23-320. Alexandria, VA: National Science Foundation. Available at https://ncses.nsf.gov/pubs/nsf23320.
Contact Us
NCSES
National Center for Science and Engineering Statistics
Directorate for Social, Behavioral and Economic Sciences
National Science Foundation
2415 Eisenhower Avenue, Suite W14200
Alexandria, VA 22314
Tel: (703) 292-8780
FIRS: (800) 877-8339
TDD: (800) 281-8749
E-mail: ncsesweb@nsf.gov
NSF 23-320
|January 4, 2023