Report
Science and Engineering Degrees Earned
Overview
The representation of women, minorities, and persons with disabilities among postsecondary science and engineering (S&E) degree recipients may indicate their forthcoming participation in the science, technology, engineering, and mathematics (STEM) workforce. Most college graduates employed in S&E occupations work in the same broad field as their highest degree (see NSB, NSF 2021: table LBR-2). Demographic disparities in S&E education may thus signal future differences in employment in related occupations. Using data from 2011 through 2020 from the Integrated Postsecondary Education Data System (IPEDS), this section examines high-level patterns and demographic trends of S&E degree recipients. Information on the sex of the degree recipient is available for all individuals, whereas race and ethnicity information is available only for U.S. citizens and permanent residents. Baseline demographic information is derived from the Census Bureau’s Current Population Survey (CPS) for individuals ages 18–34 years, who approximate the population receiving postsecondary education at the associate’s, master’s, and doctorate levels.
S&E degree data are presented according to five broad fields: social and behavioral sciences, agricultural and biological sciences, physical and earth sciences, mathematics and computer sciences, and engineering. Within these broad S&E fields, selected specific S&E fields are described with especially low or high proportions of bachelor’s degrees earned by women or underrepresented minority groups (Hispanics or Latinos, Blacks or African Americans, and American Indians or Alaska Natives). One sidebar presents information about women earning associate’s degrees in S&E technologies, a field that contributes to the pool of workers trained for most middle-skill and some S&E-related occupations. A second sidebar highlights the changing racial and ethnic composition of the college-age population in the United States. The final section uses data from the National Center for Science and Engineering Statistics’ (NCSES’s) Survey of Earned Doctorates (SED) to provide insight into S&E doctoral degrees earned by persons with disabilities. The data show that between 2011 and 2020, the greatest gains by women and underrepresented minorities were in S&E degrees earned at the associate’s level. At higher degree levels and within S&E fields of study, representation of women and minorities is unevenly distributed. The proportion of S&E doctorate recipients with at least one disability was similar to the proportion of individuals with a disability among all doctoral recipients in 2021.
Comprehensive annual degree data by field, sex, race, and ethnicity are provided by degree level in the related detailed data tables (table 2-1, table 2-2, table 2-3, table 2-4) that accompany the report online.
Overall S&E Degrees Earned by Women
The number of S&E degrees earned by women increased at all degree levels between 2011 and 2020.
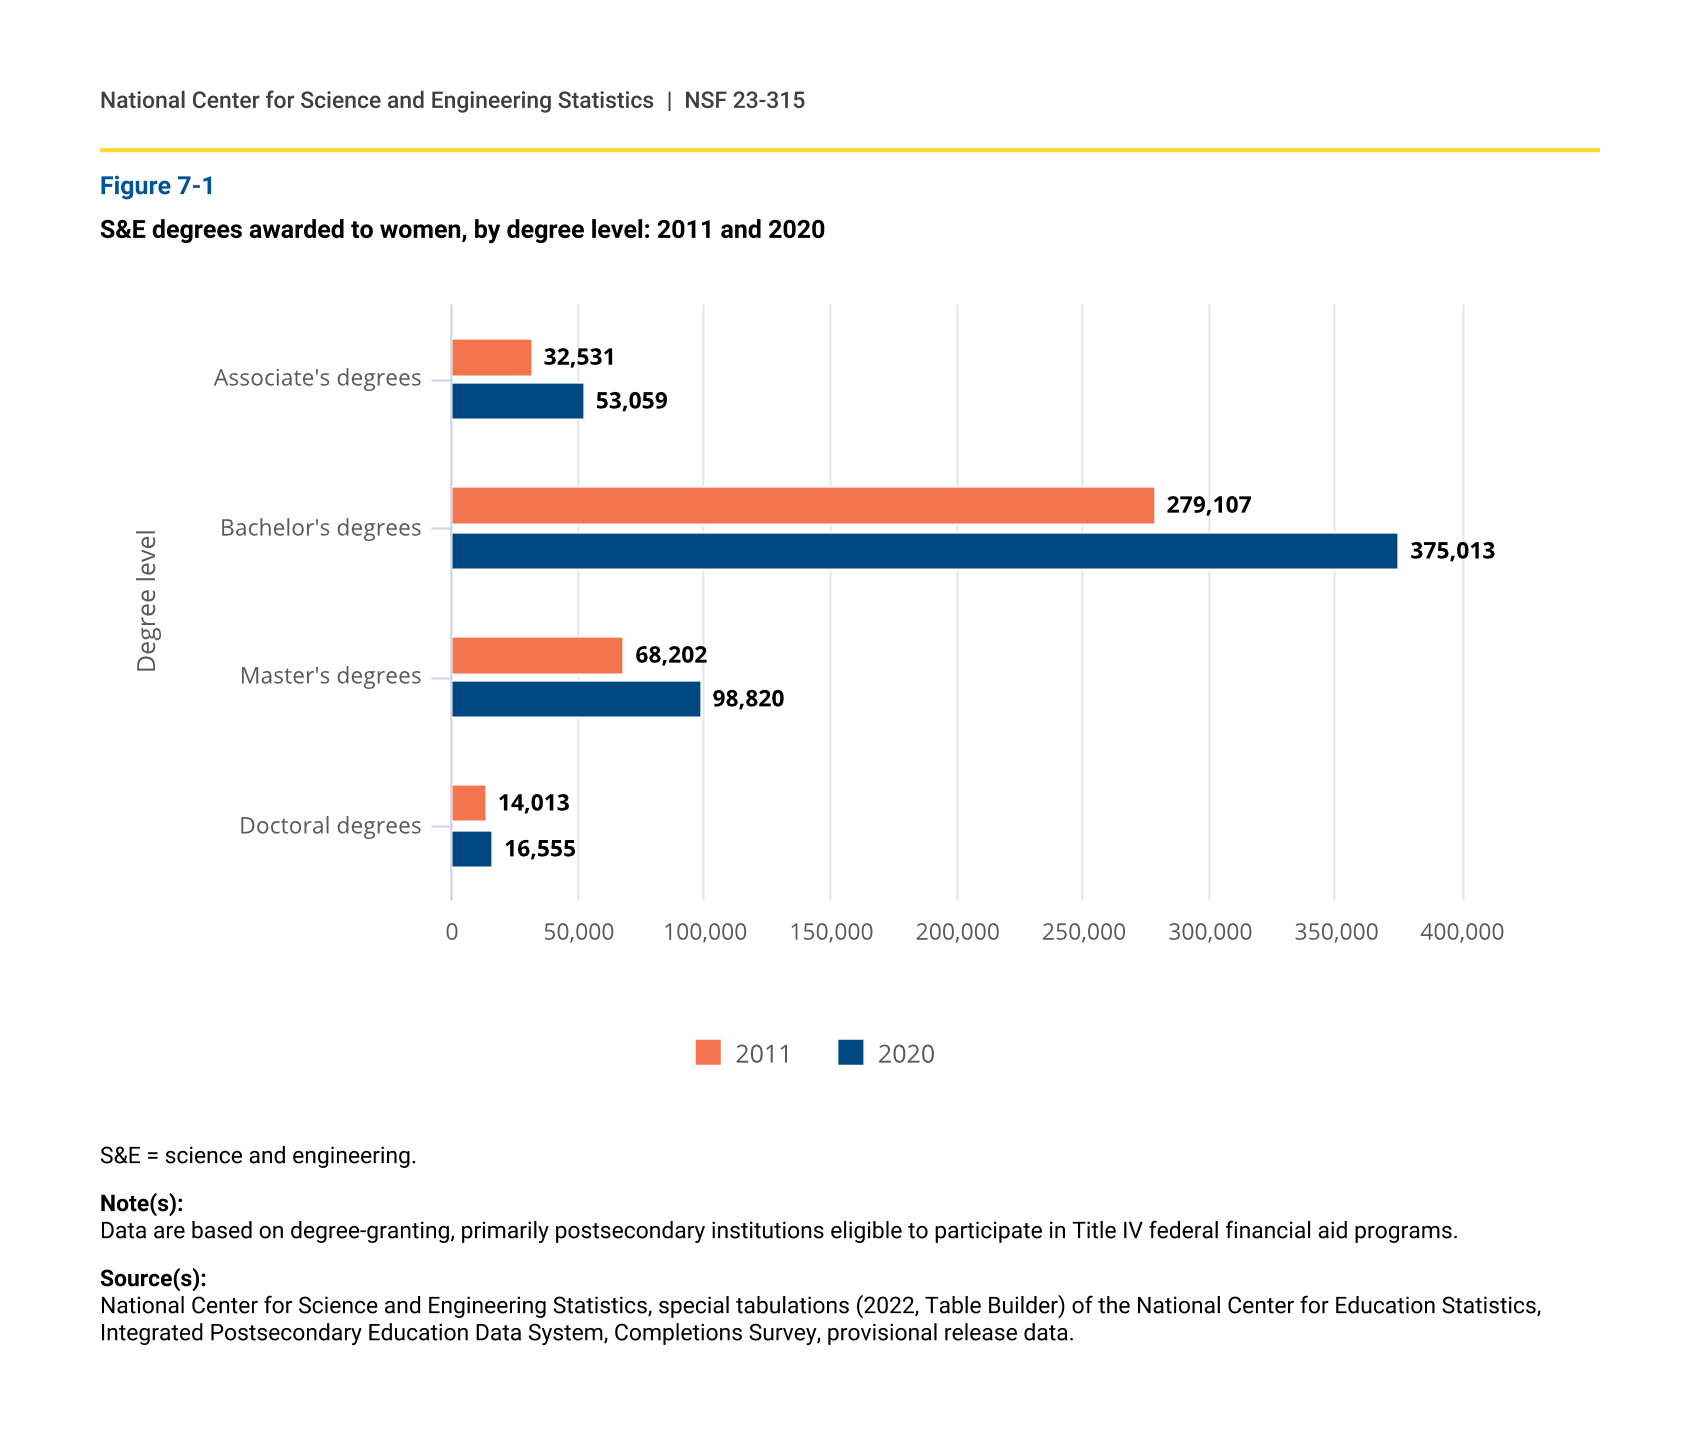
In 2020, women were awarded approximately 53,000 associate’s degrees, 375,000 bachelor’s degrees, 99,000 master’s degrees, and 17,000 doctoral degrees in S&E fields (figure 7-1). From 2011 to 2020, the number of S&E degrees awarded to women increased the most at the bachelor’s degree level (96,000 degrees), representing a 34% increase. The 63% increase in S&E associate’s degrees awarded to women was the largest percentage increase over this period among all degree levels. S&E master’s degrees awarded to women increased by 45%, and doctoral degrees awarded to women increased by 18% over this decade.
S&E degrees awarded to women, by degree level: 2011 and 2020
| Degree level | 2011 | 2020 |
|---|---|---|
| Associate's degrees | 32,531 | 53,059 |
| Bachelor's degrees | 279,107 | 375,013 |
| Master's degrees | 68,202 | 98,820 |
| Doctoral degrees | 14,013 | 16,555 |
S&E = science and engineering.
Note(s):
Data are based on degree-granting, primarily postsecondary institutions eligible to participate in Title IV federal financial aid programs.
Source(s):
National Center for Science and Engineering Statistics, special tabulations (2022, Table Builder) of the National Center for Education Statistics, Integrated Postsecondary Education Data System, Completions Survey, provisional release data.
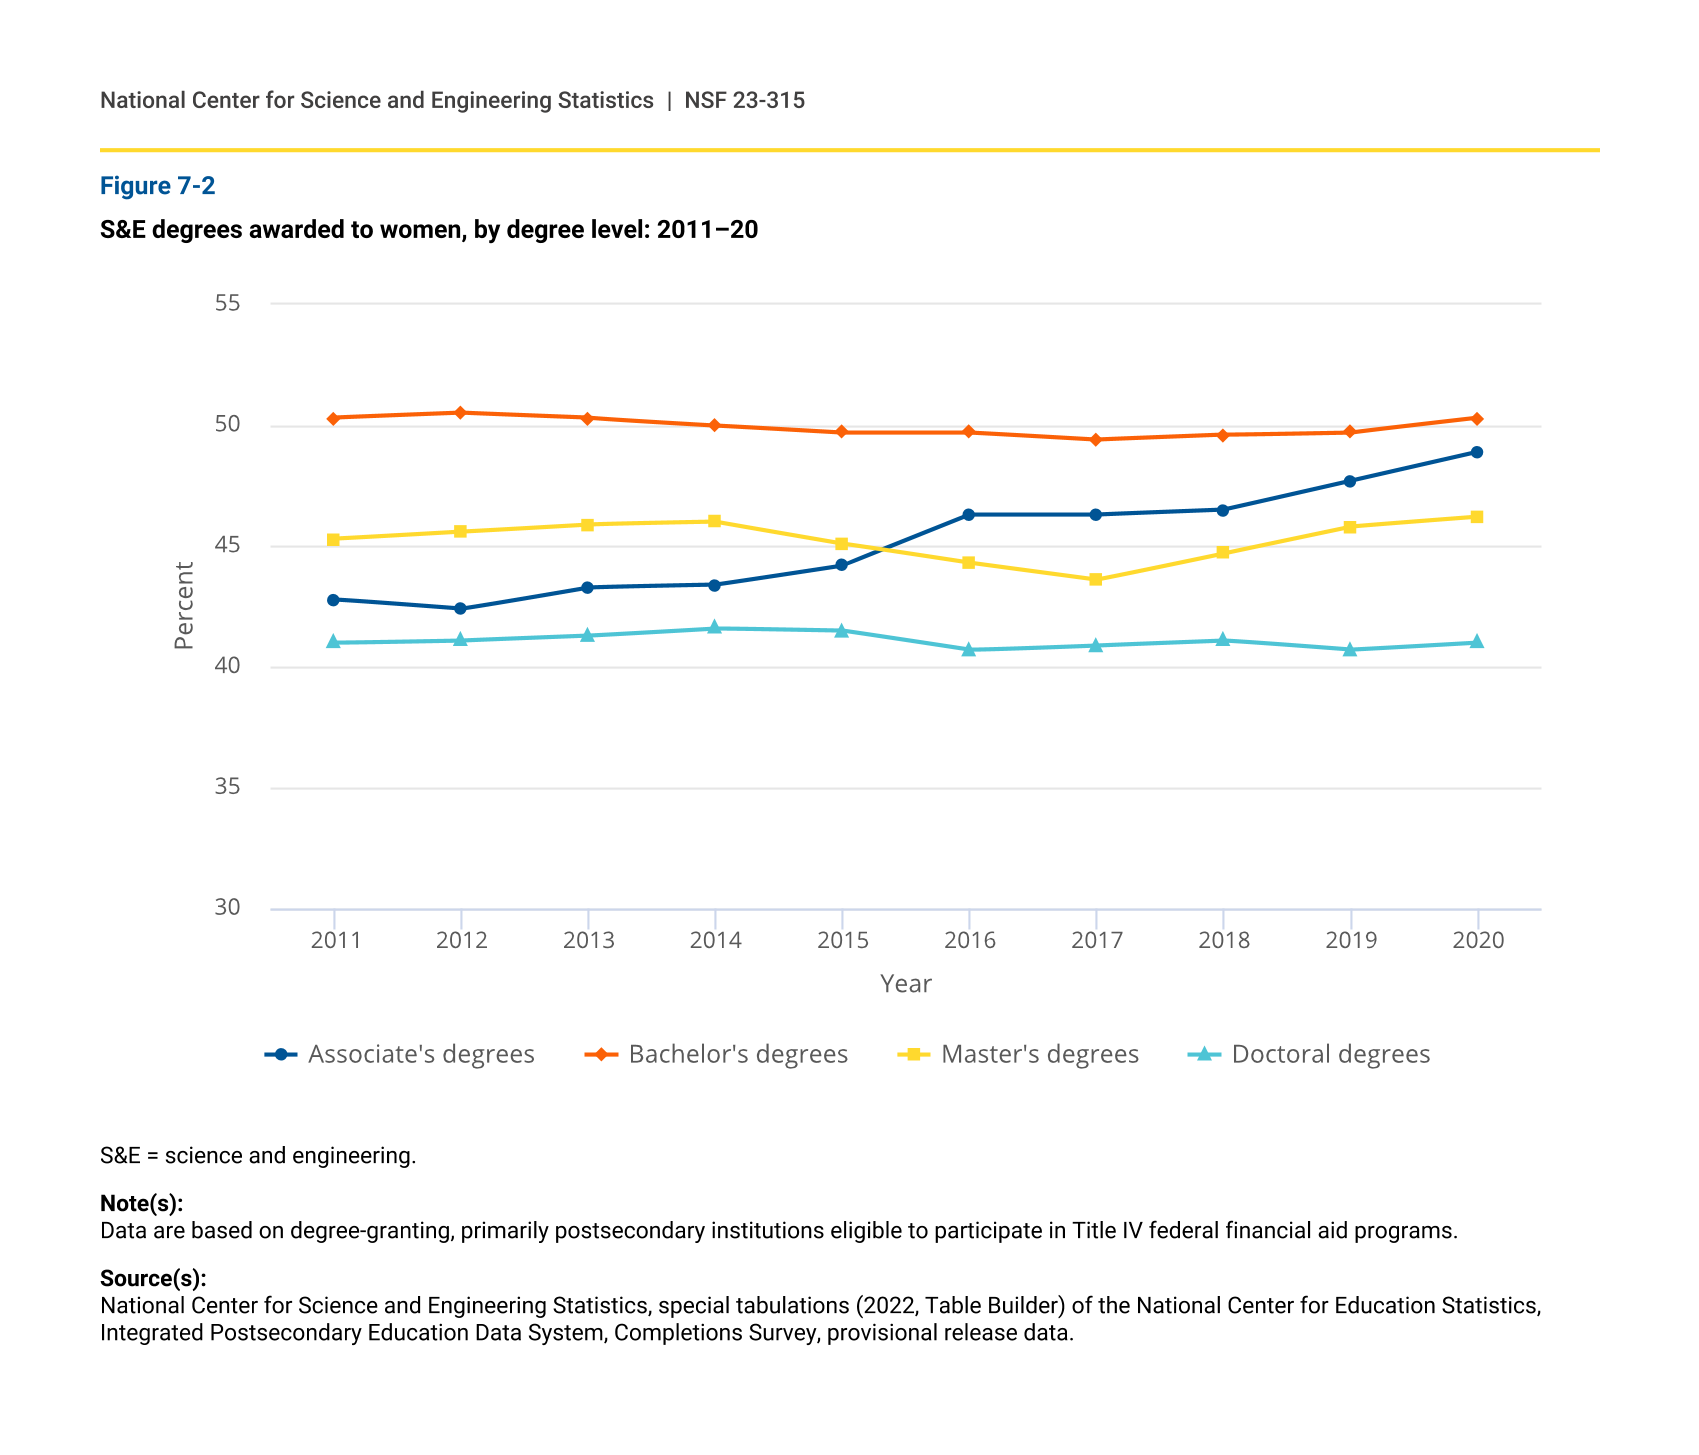
The share of S&E degrees earned by women increased at the associate’s degree level between 2011 and 2020.
Between 2011 and 2020, women’s share of S&E degrees remained relatively consistent across degree levels, with the exception of associate’s degrees (figure 7-2). The share of associate’s degrees earned by women grew from 43% in 2011 to 49% in 2020. This increase mostly reflected a large number of Hispanic students earning associate’s degrees in social and behavioral sciences (table 2-1). Women earn half of S&E bachelor’s degrees, which has been a consistent pattern for more than a decade (NCSES 2017). Women were slightly underrepresented in S&E at the master’s (46%) and doctoral (41%) levels in 2020.
S&E degrees awarded to women, by degree level: 2011–20
| Year | Associate's degrees | Bachelor's degrees | Master's degrees | Doctoral degrees |
|---|---|---|---|---|
| 2011 | 42.8 | 50.3 | 45.3 | 41.0 |
| 2012 | 42.4 | 50.5 | 45.6 | 41.1 |
| 2013 | 43.3 | 50.3 | 45.9 | 41.3 |
| 2014 | 43.4 | 50.0 | 46.0 | 41.6 |
| 2015 | 44.2 | 49.7 | 45.1 | 41.5 |
| 2016 | 46.3 | 49.7 | 44.3 | 40.7 |
| 2017 | 46.3 | 49.4 | 43.6 | 40.9 |
| 2018 | 46.5 | 49.6 | 44.7 | 41.1 |
| 2019 | 47.7 | 49.7 | 45.8 | 40.7 |
| 2020 | 48.9 | 50.3 | 46.2 | 41.0 |
S&E = science and engineering.
Note(s):
Data are based on degree-granting, primarily postsecondary institutions eligible to participate in Title IV federal financial aid programs.
Source(s):
National Center for Science and Engineering Statistics, special tabulations (2022, Table Builder) of the National Center for Education Statistics, Integrated Postsecondary Education Data System, Completions Survey, provisional release data.
Degrees Earned by Women in Broad S&E Fields
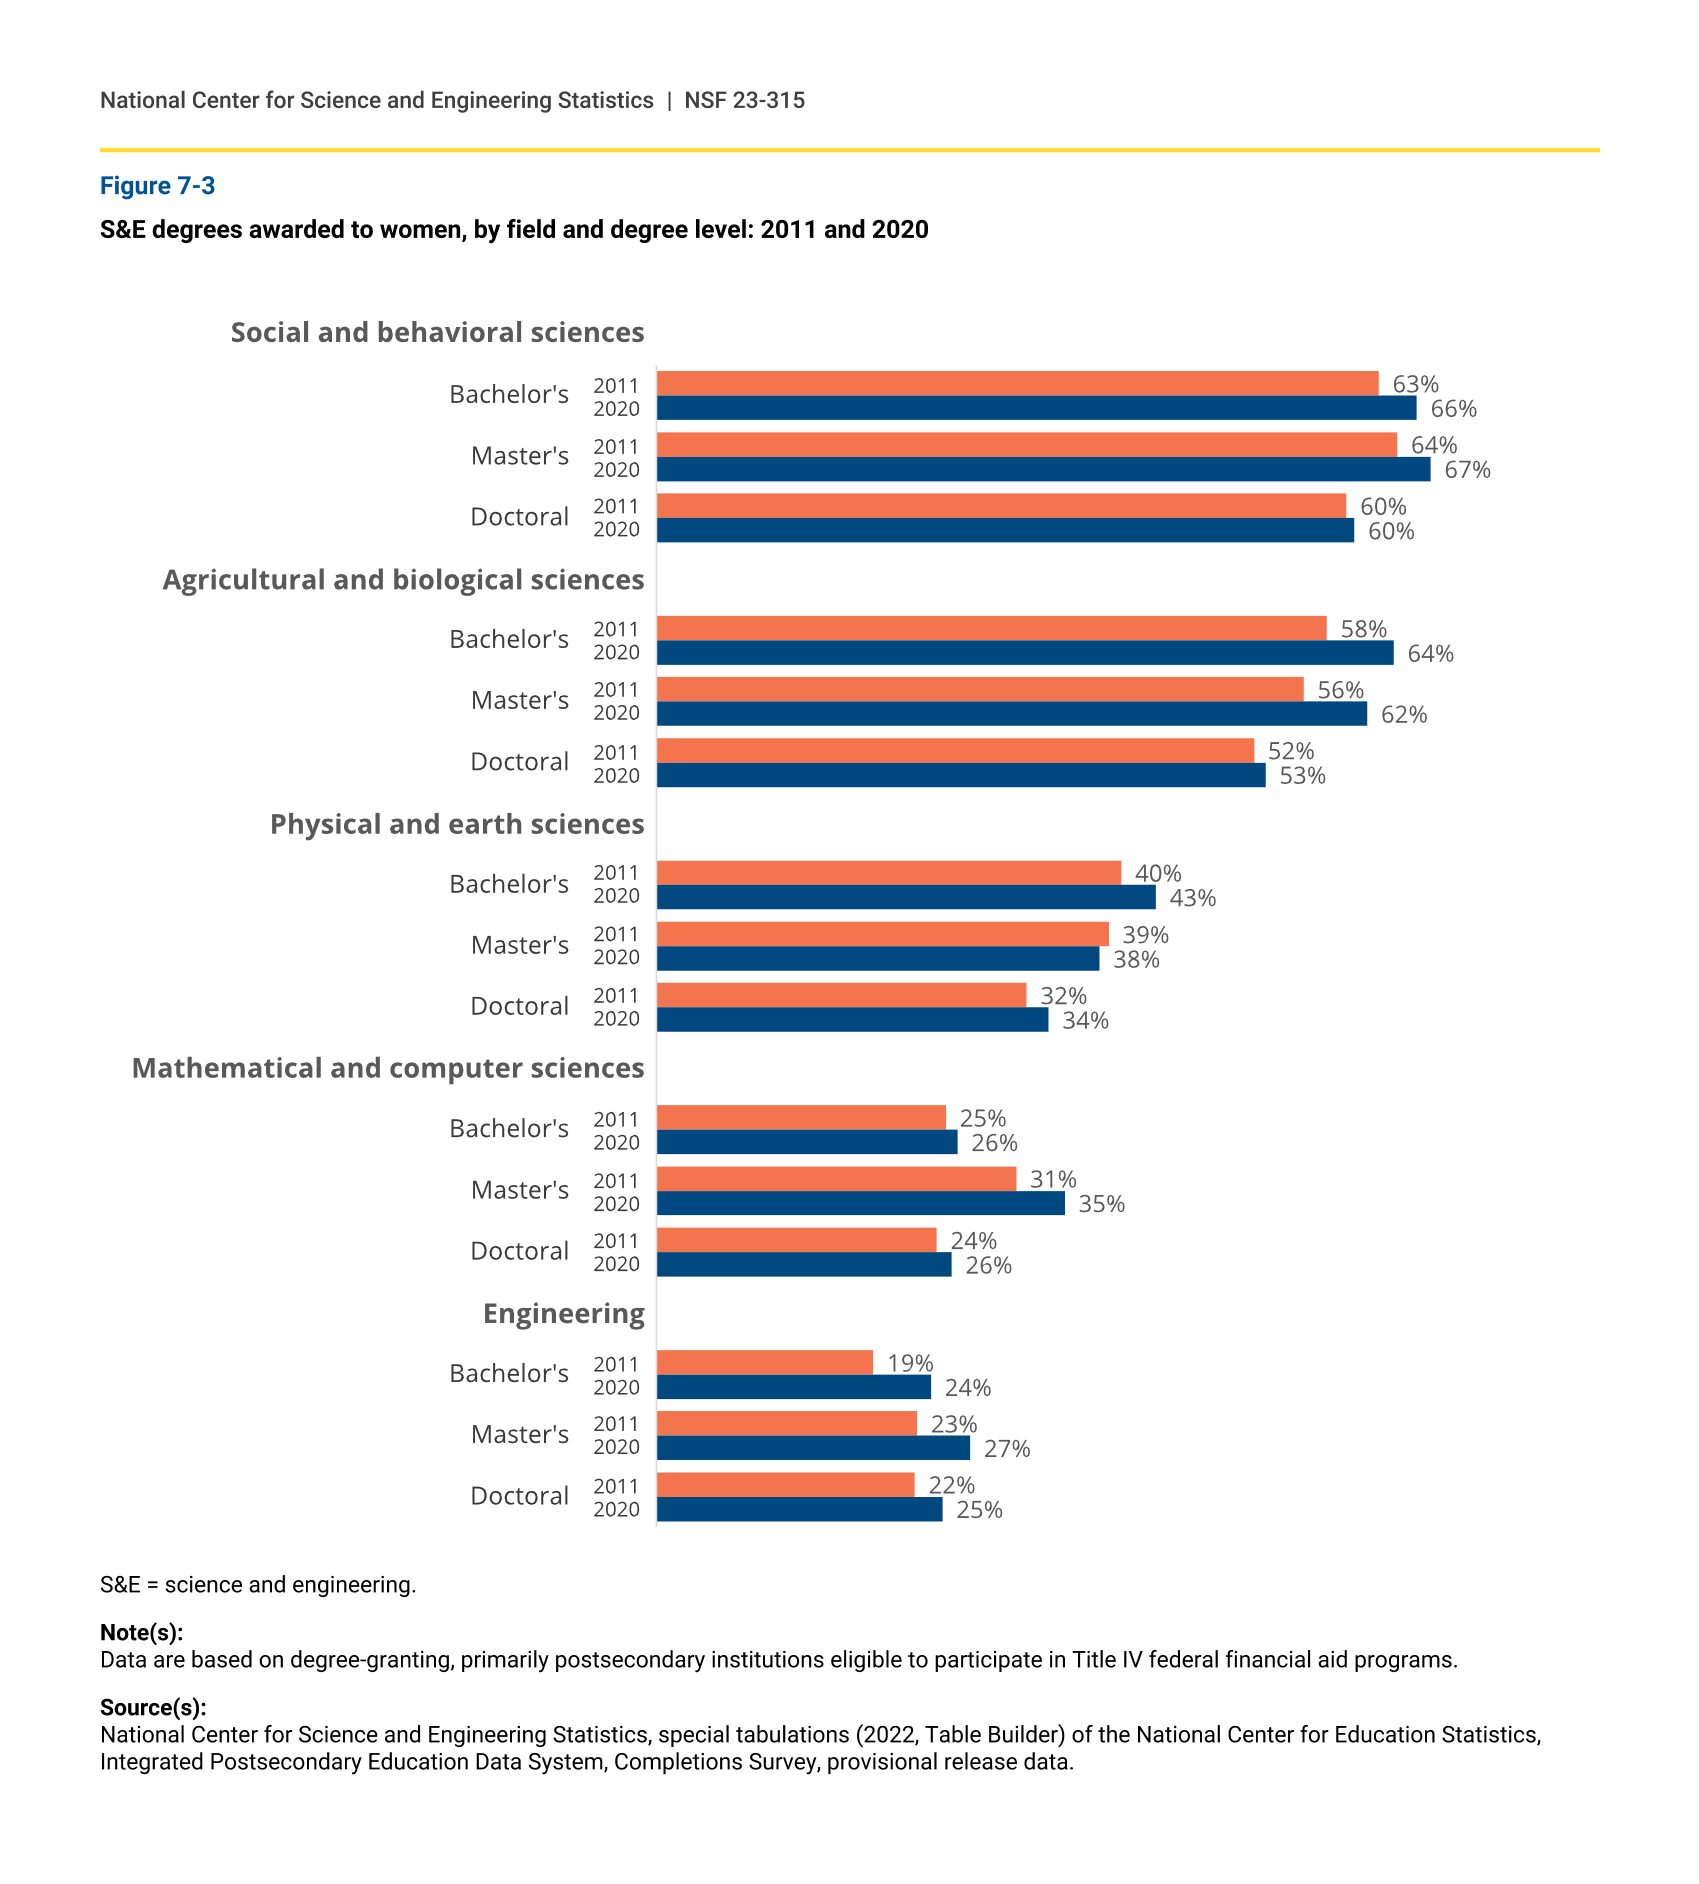
Representation of women varies greatly by broad S&E field.
Women accounted for 66% of bachelor’s degrees in social and behavioral sciences and 64% of degrees in agricultural and biological sciences in 2020 (figure 7-3). In contrast, they accounted for 26% of these degrees in mathematics and computer sciences and 24% in engineering. Comparable differences for these fields occur at the master’s and doctoral degree levels between women and men (table 2-3, table 2-4).
S&E degrees awarded to women, by field and degree level: 2011 and 2020
S&E = science and engineering.
Note(s):
Data are based on degree-granting, primarily postsecondary institutions eligible to participate in Title IV federal financial aid programs.
Source(s):
National Center for Science and Engineering Statistics, special tabulations (2022, Table Builder) of the National Center for Education Statistics, Integrated Postsecondary Education Data System, Completions Survey, provisional release data.
Women earn the highest proportion of degrees in social and behavioral sciences overall but a much smaller share of economics degrees, compared with men.
In 2020, women earned 66% of bachelor’s, 67% of master’s, and 60% of doctoral degrees in social and behavioral sciences (figure 7-3). Women’s share of degrees has increased in this broad field at all degree levels since 2011.
The distribution of degrees awarded to women within specific fields of social and behavioral sciences is uneven (table 2-2 to table 2-4). The overall high representation of women in this broad S&E field is partly due to the very high share of degrees earned by women in psychology (79% of bachelor’s degrees in 2020). Although women earned a majority of the degrees across nearly all fields within social and behavioral sciences at all degree levels, economics remains a notable exception. Women earned 33% of bachelor’s degrees in economics in 2020 and were underrepresented in economics at the master’s and doctoral levels. This gap between the share of degrees earned by women in economics and in social and behavioral sciences has persisted over the past decade.
Women earn more than half of degrees in agricultural and biological sciences.
The share of degrees in agricultural and biological sciences earned by women increased from 2011 to 2020 (figure 7-3). Similar to the overall pattern for S&E degrees, women earned lower shares of agricultural and biological sciences degrees at the doctorate level, earning 53% of doctoral degrees, 62% of master’s degrees, and 64% of bachelor’s degrees in 2020. Among all S&E broad fields, the proportion of degrees in agricultural and biological sciences earned by women is second only to those earned by women in social and behavioral sciences.
Women are underrepresented in physical and earth sciences, especially physics.
At all degree levels, women earn less than half of degrees in physical and earth sciences (figure 7-3). The pattern of a smaller proportion of degrees at the higher levels occurs here. In 2020, women earned 34% of doctoral degrees, 38% of master’s degrees, and 43% of bachelor’s degrees in this broad S&E field.
Chemistry and physics are the most common fields within physical and earth sciences by number of degrees awarded at the bachelor’s level (table 2-2). Compared to the overall share of all physical and earth sciences degrees earned by women, women earned higher shares of degrees in chemistry and much lower shares in physics at all degree levels (table 2-2 to table 2-4). The difference is greatest at the bachelor’s level: women earn more than half (53%) of chemistry degrees and about a quarter (24%) of physics degrees. Despite modest gains in the proportion of physics degrees earned by women over the past decade, physics remains a key field where women are significantly underrepresented among postsecondary degree recipients.
Women earn a low share of degrees in mathematics and computer sciences.
Women account for a low share of degree recipients in the broad field of mathematics and computer sciences. In 2020, 35% of master’s degrees in this broad S&E field were awarded to women, whereas 26% of bachelor’s and doctoral degrees were awarded to women (figure 7-3). Women’s representation increased the most at the master’s degree level, where the share of degrees earned by women grew from 31% to 35%.
Within this broad S&E field, the representation of women is particularly low in computer sciences. At the bachelor’s level, the proportion of women receiving computer science degrees is lower than it was a generation ago. Women earned 21% of these degrees in 2020 compared with 29% in 1995 (NCSES 2017: figure 2-C). However, the 21% of computer science bachelor’s degree earned by women in 2020 represented an increase from 2011, when 18% of these degrees were earned by women (table 2-2).
The number and proportion of engineering degrees awarded to women has increased.
Although women remain underrepresented in engineering degree awards, their share of engineering degrees earned increased at all levels between 2011 and 2020 (figure 7-3). Growth was particularly pronounced at the bachelor’s level, where the number of engineering degrees awarded to women more than doubled from nearly 15,000 in 2011 to over 31,000 in 2020 (table 2-2). As of 2020, women earned approximately a quarter of engineering degrees at the bachelor’s, master’s, and doctoral degree levels (figure 7-3). Women are also underrepresented in engineering technologies, where they earned 15% of associate’s degrees in 2020 (see sidebar S&E Technology Associate’s Degrees).
Overall S&E Degrees Earned by Underrepresented Minorities
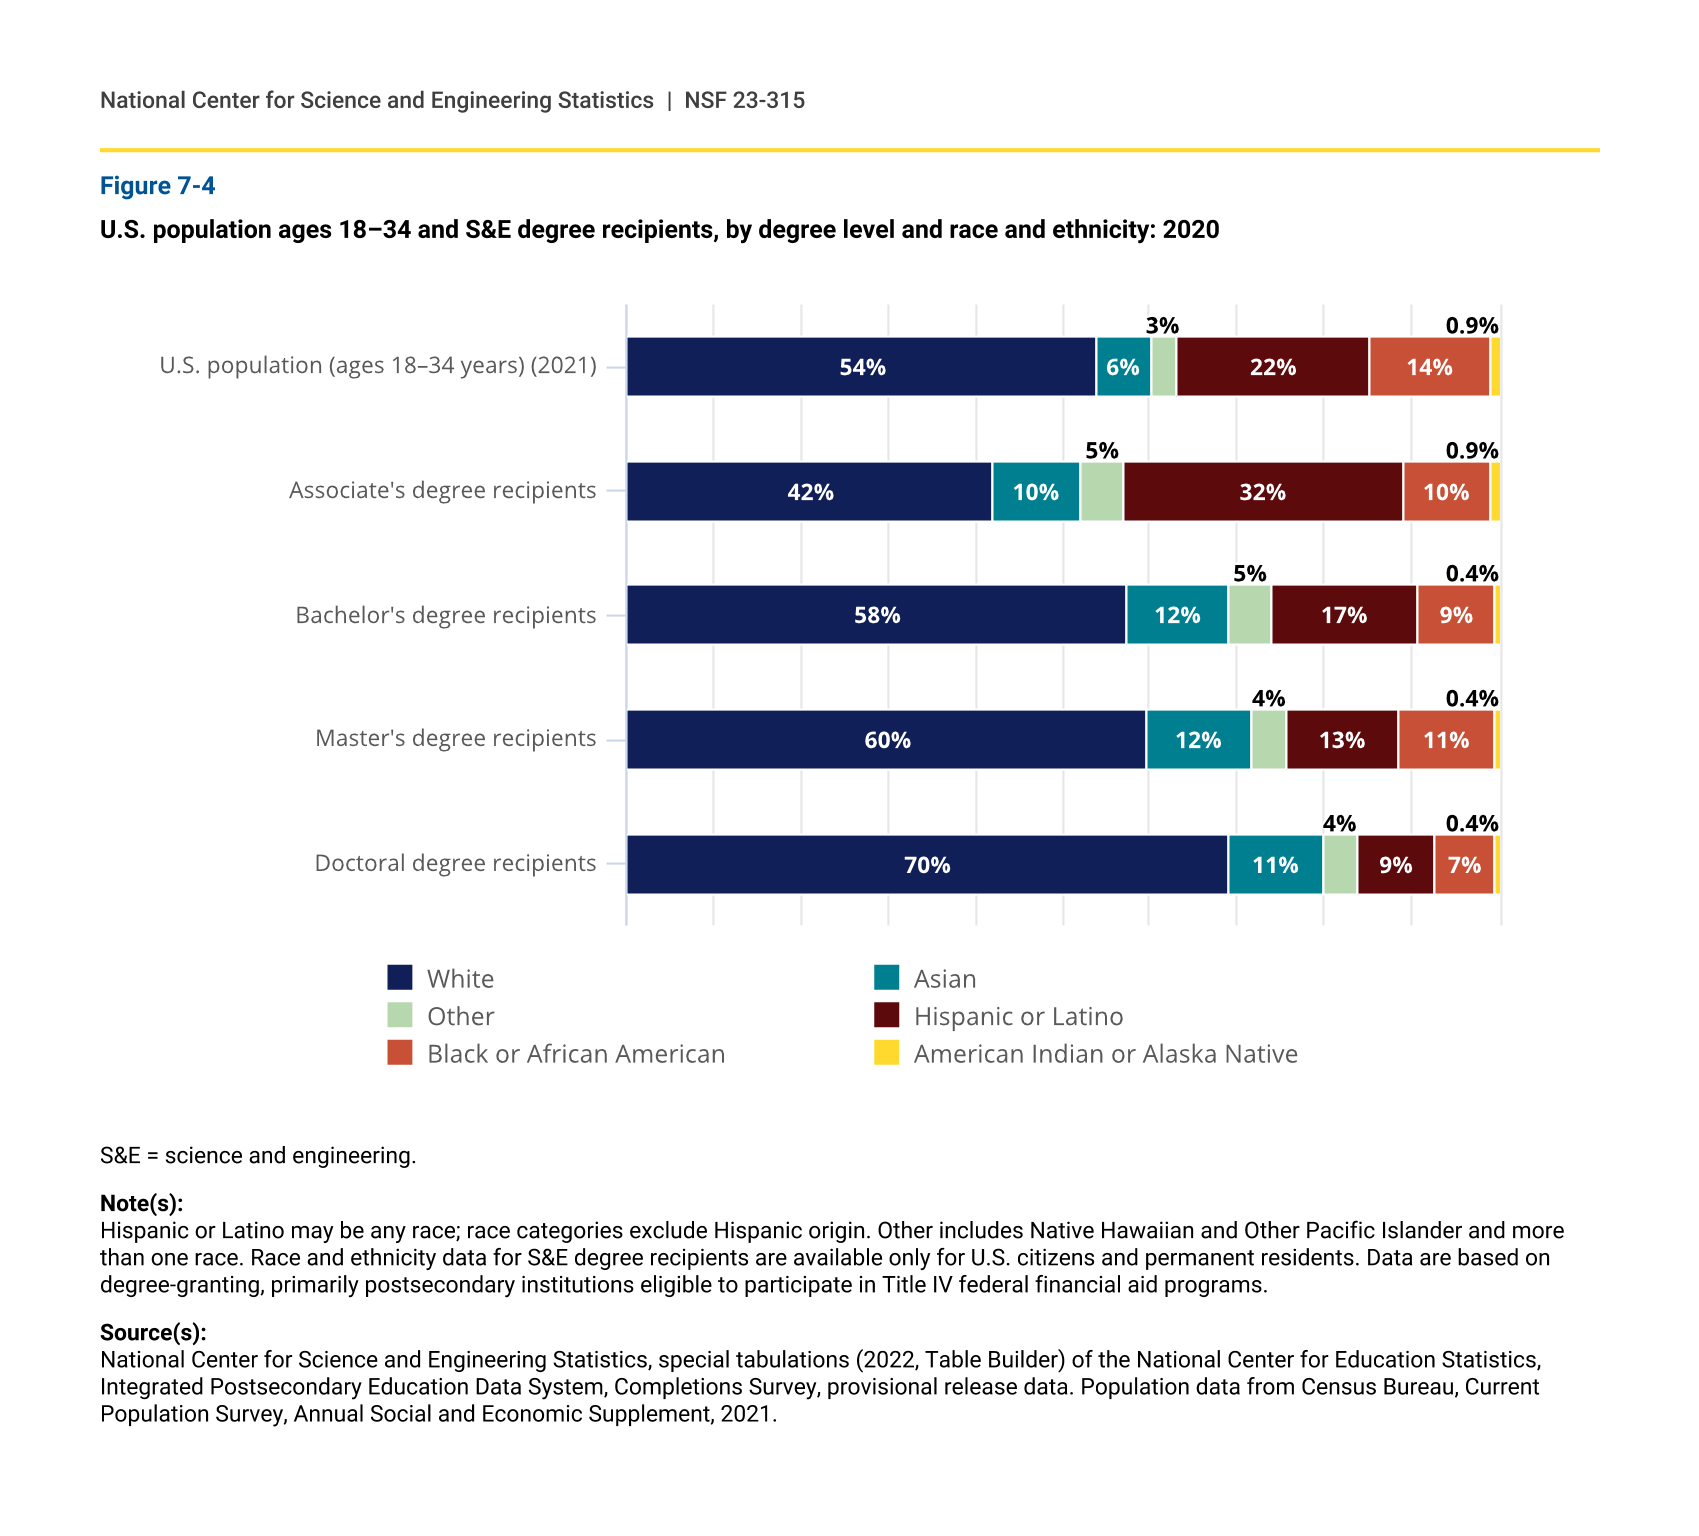
Among S&E degrees earned by underrepresented minorities, the highest proportion was associate’s degrees.
In 2020, persons from underrepresented minority groups—Hispanic, Black, and American Indian or Alaska Native—collectively earned 43% of associate’s degrees, 26% of bachelor’s degrees, 24% of master’s degrees, and 16% of doctoral degrees in the five broad S&E fields of study (figure 7-4). At the associate’s level, Hispanic individuals earned a higher share of S&E degrees (32%) relative to their share of the college-age population (22%) (figure 7-4). However, Hispanic students and those from other underrepresented minority groups account for much lower shares of degree recipients at the bachelor’s degree level and above. For example, the percentage of S&E associate’s degrees awarded to American Indian or Alaska Native students is twice as large as the percentage of S&E degrees awarded to this group at any other level. In contrast, White students and Asian students each make up a disproportionately large share of S&E degree recipients at the bachelor’s level and above. In 2020, White students accounted for 70% of S&E doctoral degrees and Asian students accounted for 11% (figure 7-4).
U.S. population ages 18–34 and S&E degree recipients, by degree level and race and ethnicity: 2020
| Selected population | White | Asian | Other | Hispanic or Latino | Black or African American | American Indian or Alaska Native |
|---|---|---|---|---|---|---|
| U.S. population (ages 18–34 years) (2021) | 54 | 6 | 3 | 22 | 14 | 0.9 |
| Associate's degree recipients | 42 | 10 | 5 | 32 | 10 | 0.9 |
| Bachelor's degree recipients | 58 | 12 | 5 | 17 | 9 | 0.4 |
| Master's degree recipients | 60 | 12 | 4 | 13 | 11 | 0.4 |
| Doctoral degree recipients | 70 | 11 | 4 | 9 | 7 | 0.4 |
S&E = science and engineering.
Note(s):
Hispanic or Latino may be any race; race categories exclude Hispanic origin. Other includes Native Hawaiian and Other Pacific Islander and more than one race. Race and ethnicity data for S&E degree recipients are available only for U.S. citizens and permanent residents. Data are based on degree-granting, primarily postsecondary institutions eligible to participate in Title IV federal financial aid programs.
Source(s):
National Center for Science and Engineering Statistics, special tabulations (2022, Table Builder) of the National Center for Education Statistics, Integrated Postsecondary Education Data System, Completions Survey, provisional release data. Population data from Census Bureau, Current Population Survey, Annual Social and Economic Supplement, 2021.
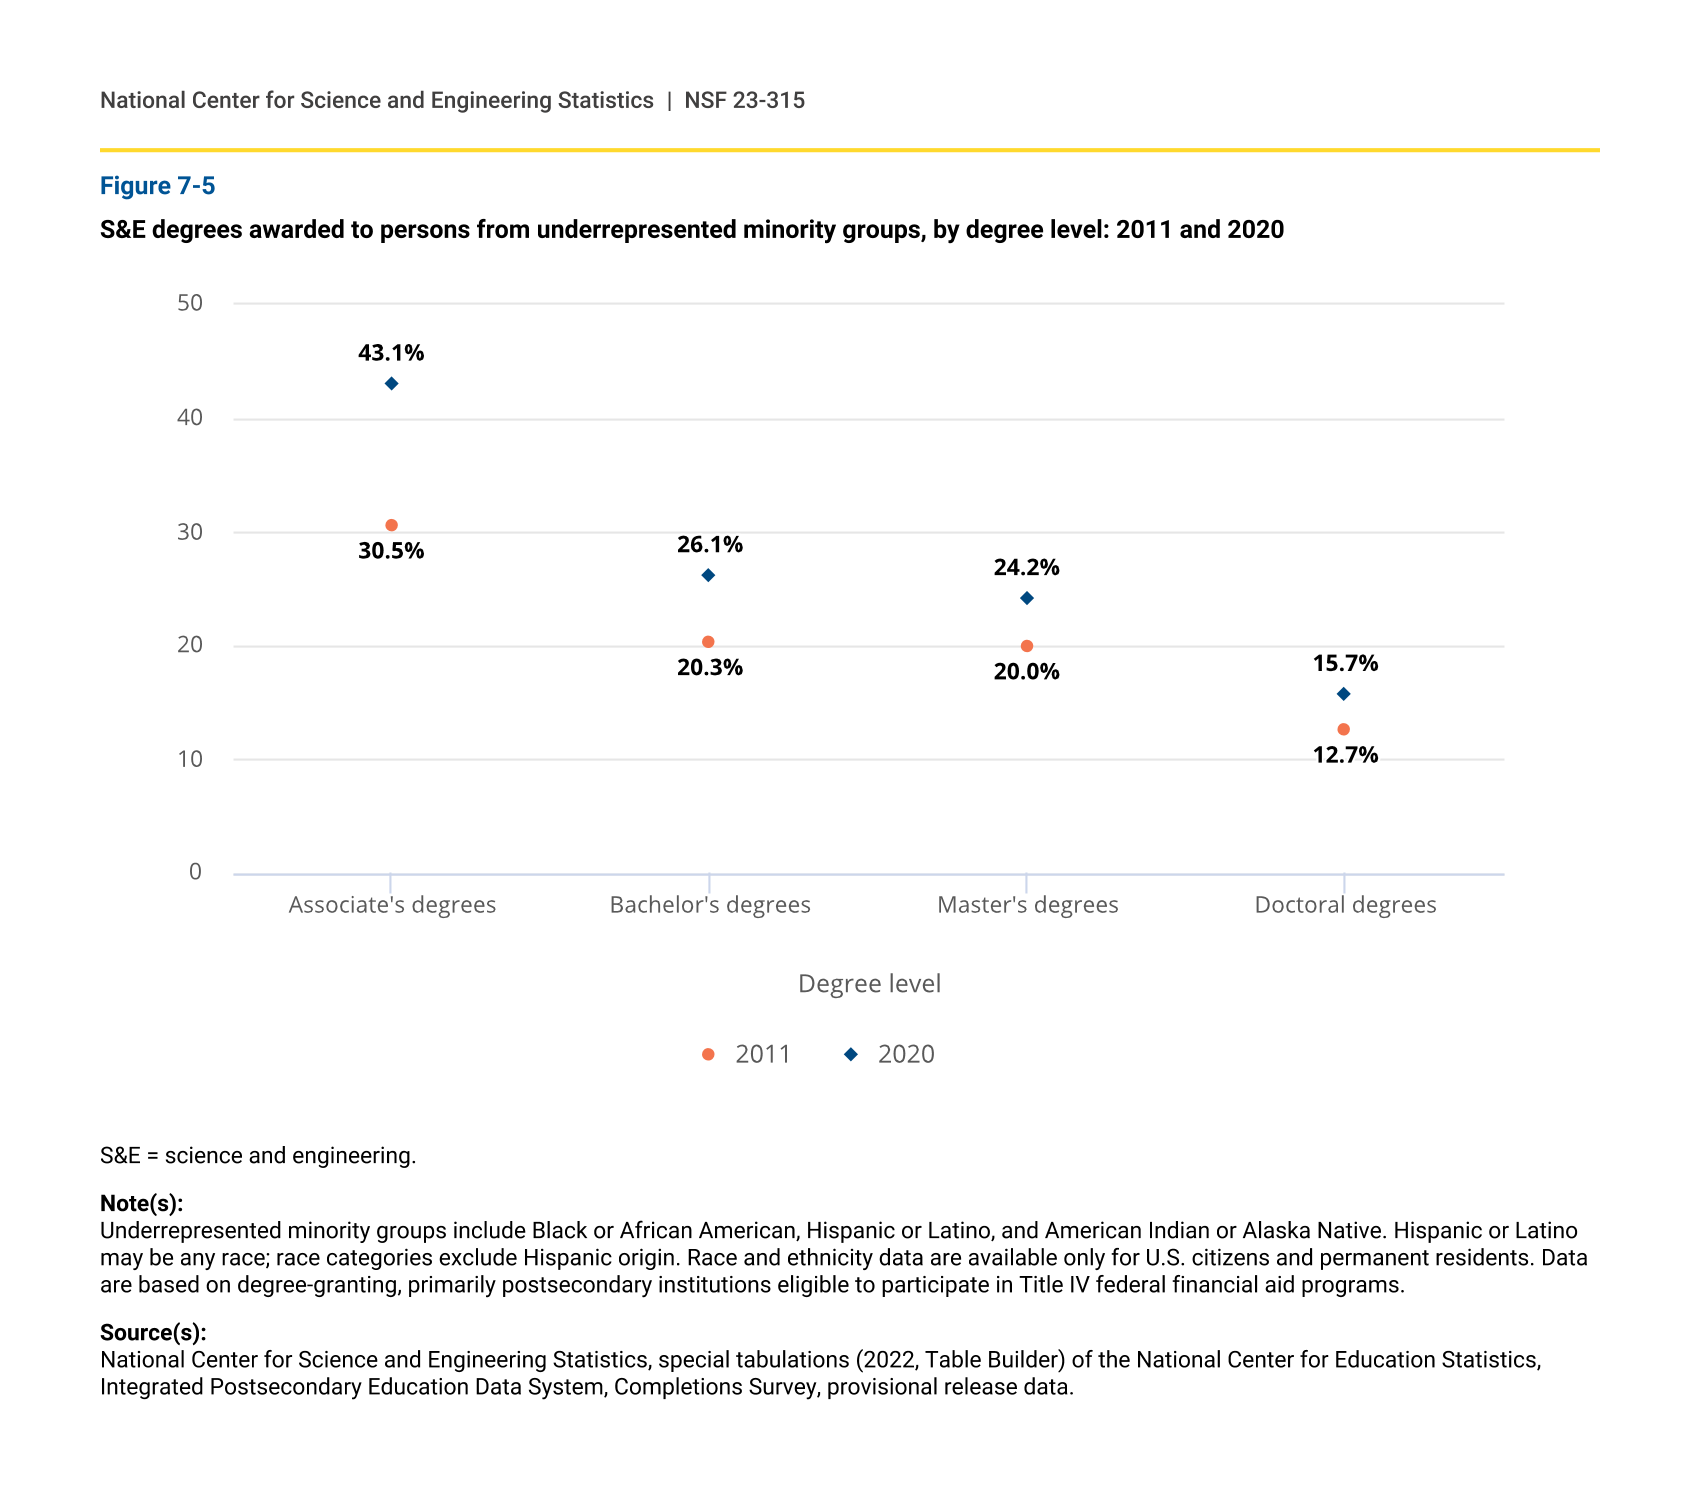
The proportion of S&E degrees earned by underrepresented minorities increased between 2011 and 2020.
The number and share of S&E degrees earned by underrepresented minorities increased at all degree levels over the past decade (table 2-1 to table 2-4). S&E associate’s degrees earned by underrepresented minorities grew at the highest rate, increasing by 13 percentage points from 31% in 2011 to 43% in 2020 (figure 7-5). The increase is much less pronounced at higher degree levels, especially for S&E doctorates, where the share of degrees earned by underrepresented minorities increased from 13% to 16%.
S&E degrees awarded to persons from underrepresented minority groups, by degree level: 2011 and 2020
| Degree level | 2011 | 2020 |
|---|---|---|
| Associate's degrees | 30.5 | 43.1 |
| Bachelor's degrees | 20.3 | 26.1 |
| Master's degrees | 20.0 | 24.2 |
| Doctoral degrees | 12.7 | 15.7 |
S&E = science and engineering.
Note(s):
Underrepresented minority groups include Black or African American, Hispanic or Latino, and American Indian or Alaska Native. Hispanic or Latino may be any race; race categories exclude Hispanic origin. Race and ethnicity data are available only for U.S. citizens and permanent residents. Data are based on degree-granting, primarily postsecondary institutions eligible to participate in Title IV federal financial aid programs.
Source(s):
National Center for Science and Engineering Statistics, special tabulations (2022, Table Builder) of the National Center for Education Statistics, Integrated Postsecondary Education Data System, Completions Survey, provisional release data.
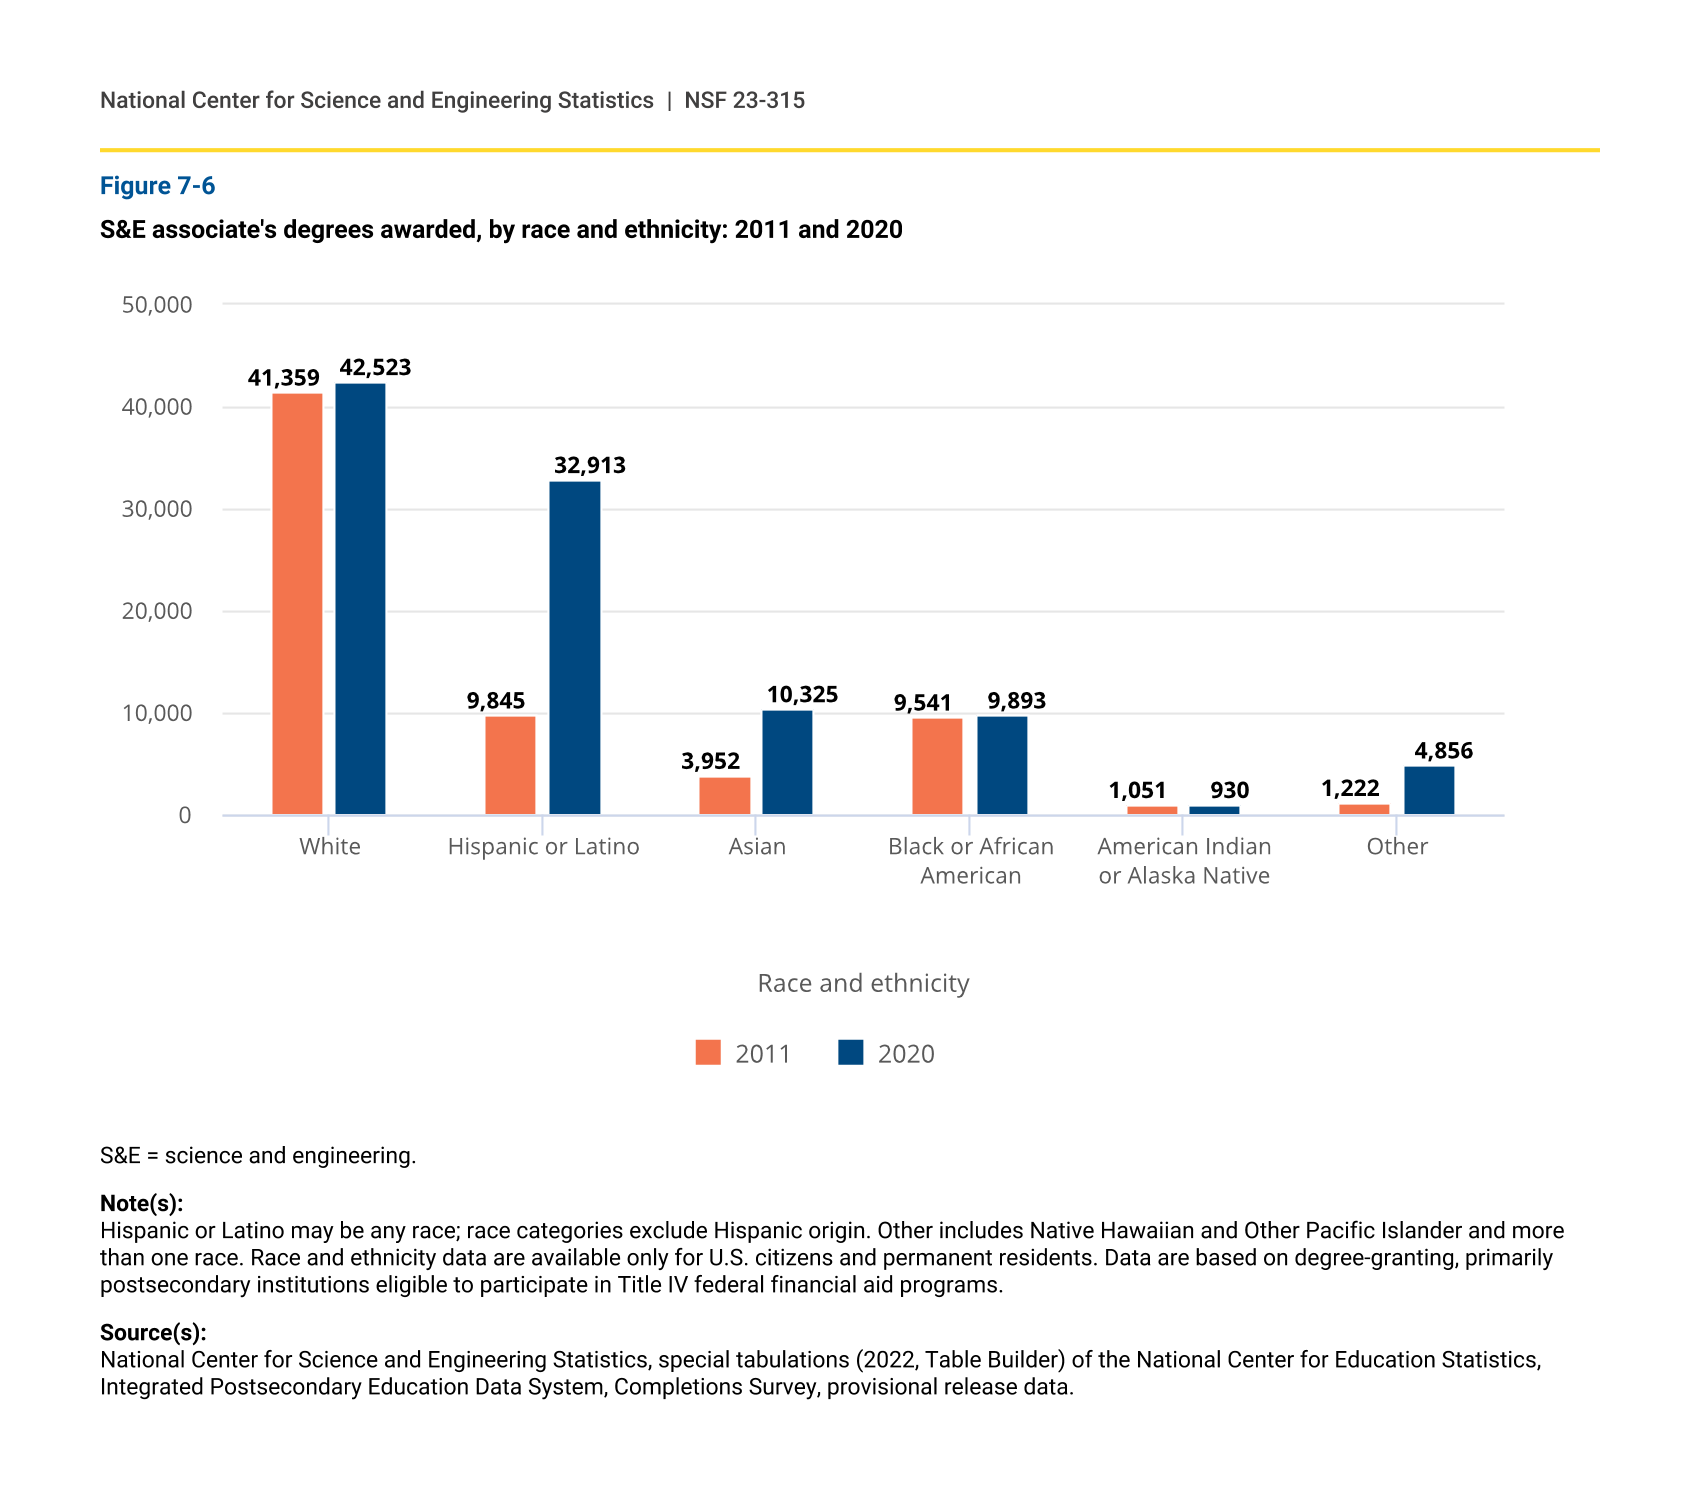
S&E associate’s degrees awarded to Hispanic students more than tripled between 2011 and 2020.
Virtually all of the increase in S&E associate’s degrees earned by underrepresented minority students in the past decade is due to an increase in degrees earned by Hispanic students. The number of associate’s degrees earned by Hispanic students more than tripled, going from 10,000 degrees in 2011 to 33,000 degrees in 2020 (figure 7-6). In contrast, the number of associate’s degrees earned by Black students and American Indian or Alaska Native students were similar in 2011 and 2020. Relative to all associate’s degree recipients, Hispanic students are concentrated in social and behavioral sciences (table 2-1).
S&E associate's degrees awarded, by race and ethnicity: 2011 and 2020
| Race and ethnicity | 2011 | 2020 |
|---|---|---|
| White | 41,359 | 42,523 |
| Hispanic or Latino | 9,845 | 32,913 |
| Asian | 3,952 | 10,325 |
| Black or African American | 9,541 | 9,893 |
| American Indian or Alaska Native | 1,051 | 930 |
| Other | 1,222 | 4,856 |
S&E = science and engineering.
Note(s):
Hispanic or Latino may be any race; race categories exclude Hispanic origin. Other includes Native Hawaiian and Other Pacific Islander and more than one race. Race and ethnicity data are available only for U.S. citizens and permanent residents. Data are based on degree-granting, primarily postsecondary institutions eligible to participate in Title IV federal financial aid programs.
Source(s):
National Center for Science and Engineering Statistics, special tabulations (2022, Table Builder) of the National Center for Education Statistics, Integrated Postsecondary Education Data System, Completions Survey, provisional release data.
Bachelor’s Degrees Earned by Hispanic or Latino Students
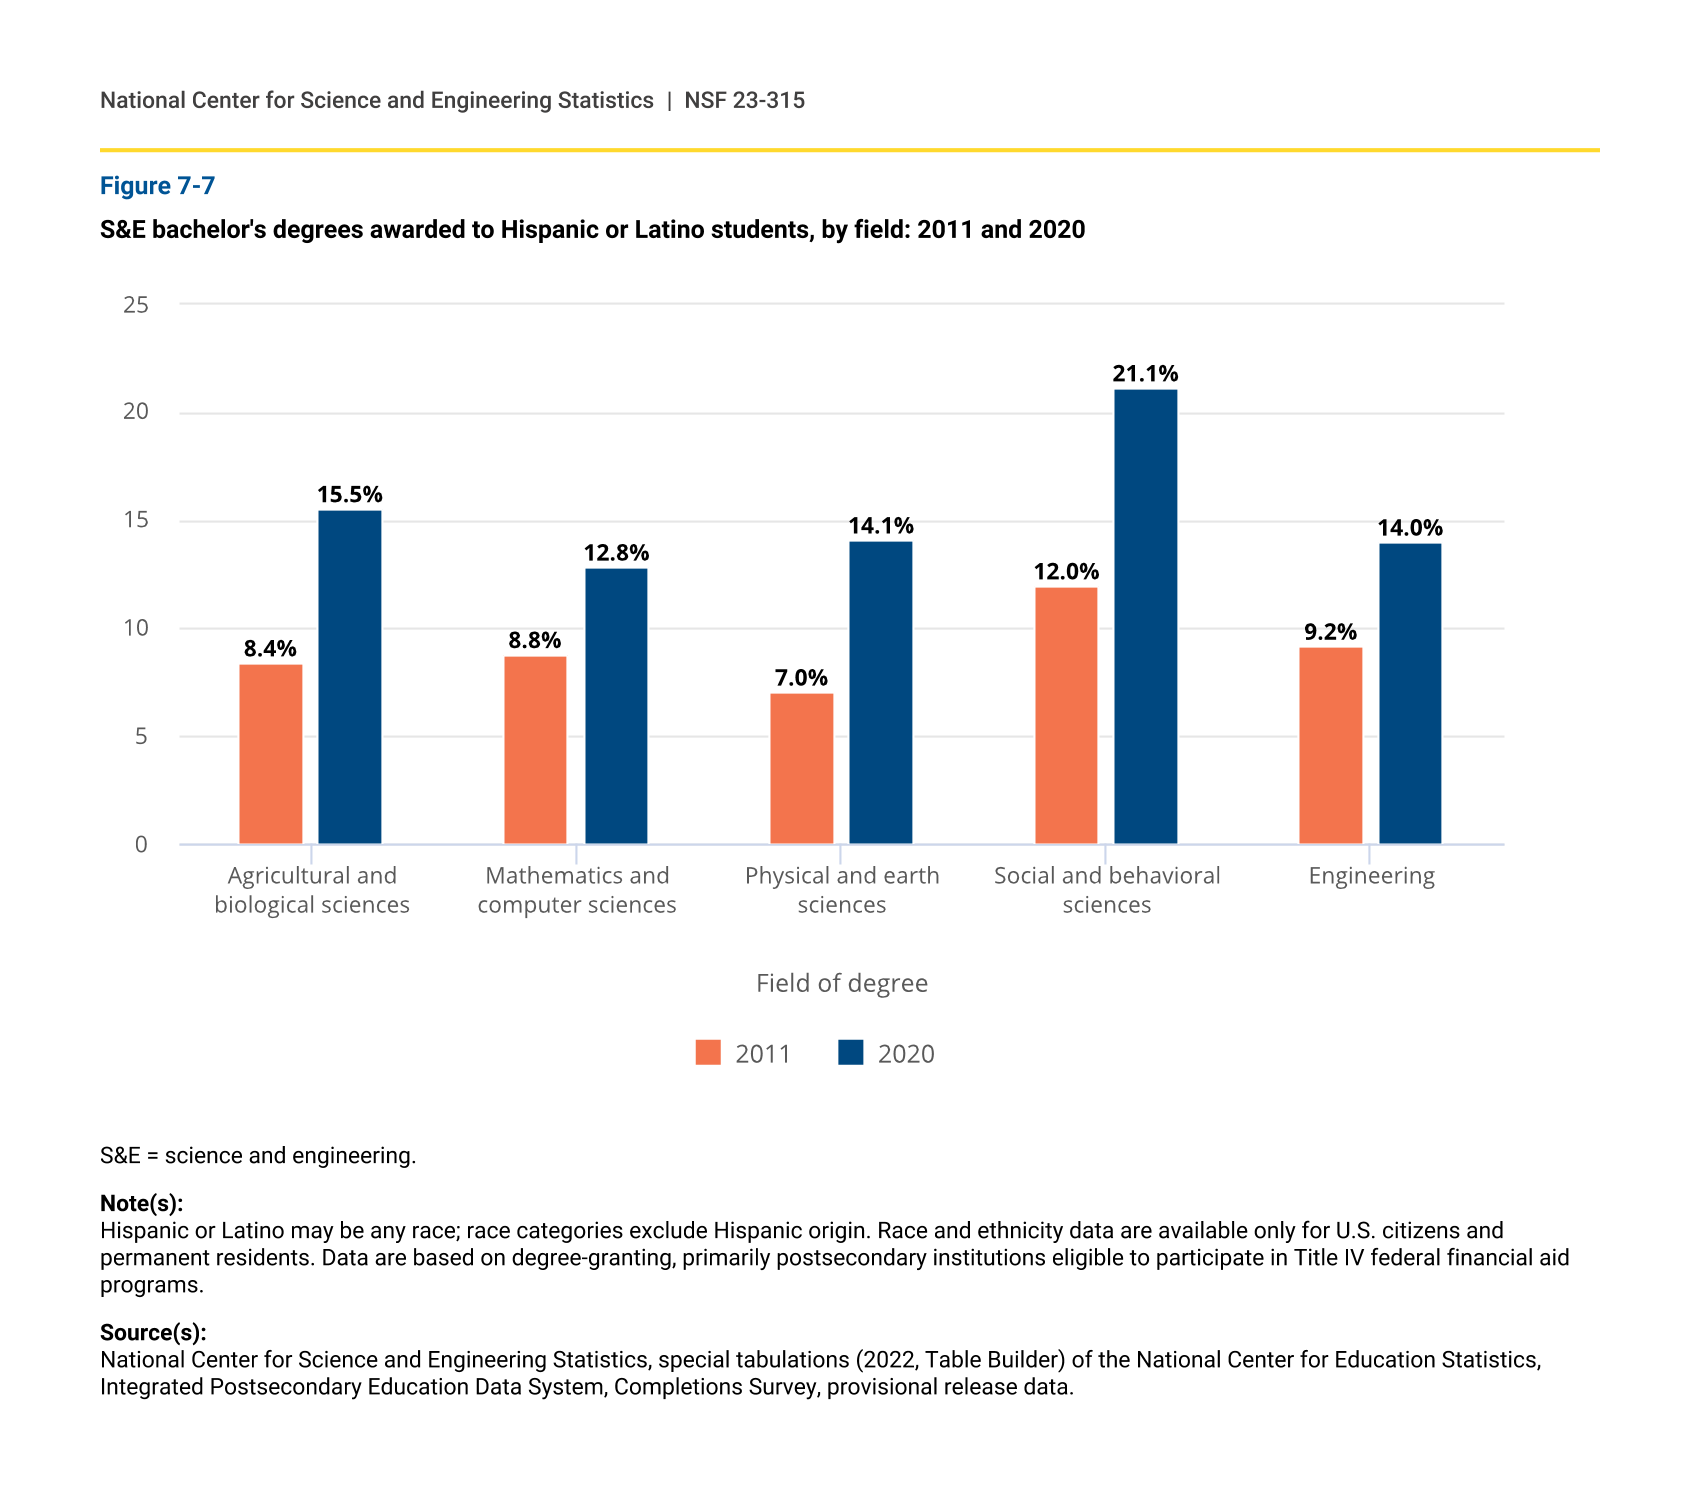
The percentage of S&E bachelor’s degrees earned by Hispanic students increased from 2011 to 2020.
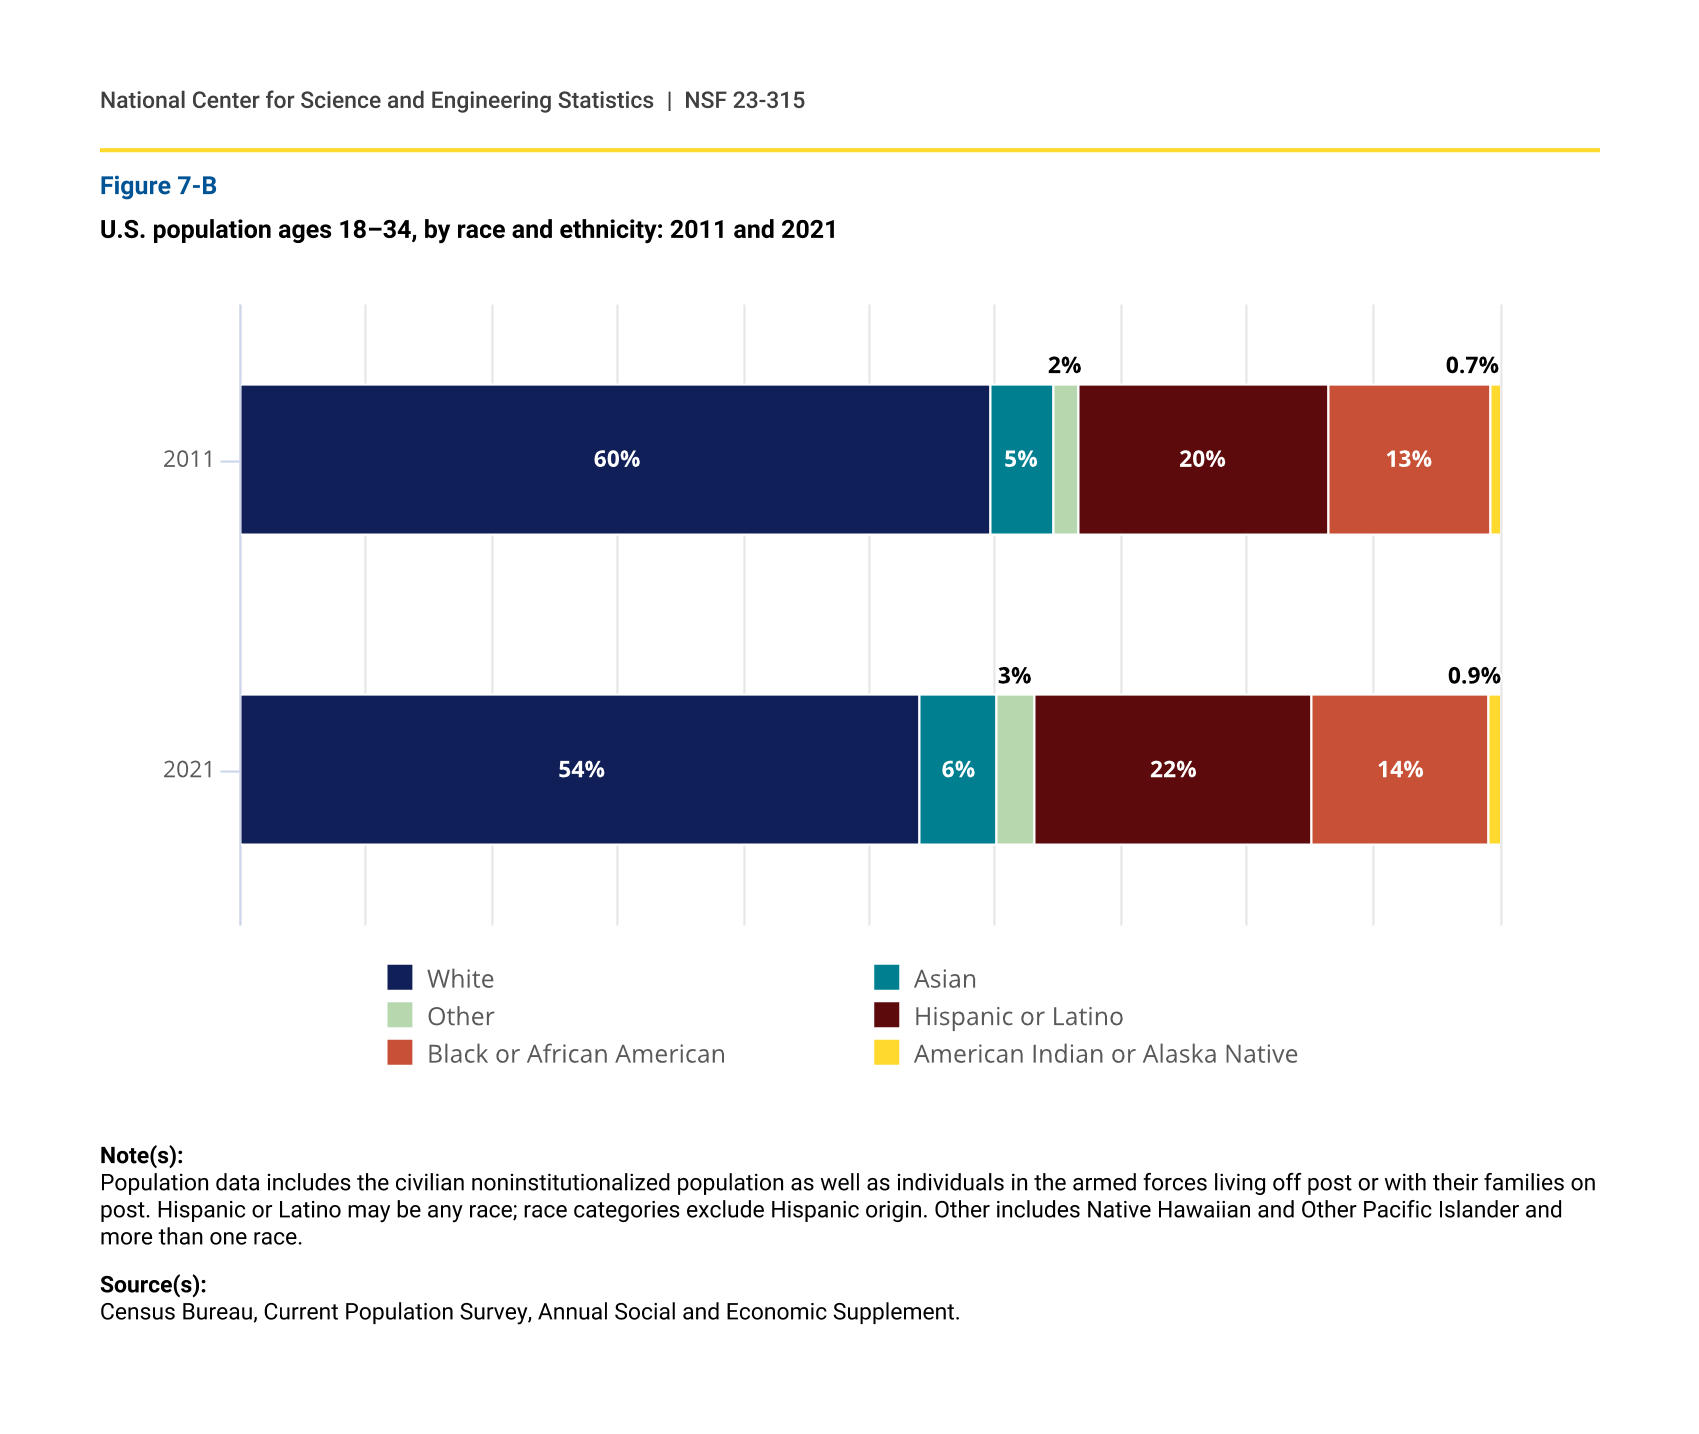
Over the past decade, Hispanic students have earned increasing shares of S&E bachelor’s degrees across all broad S&E fields (figure 7-7). This growth has occurred in tandem with a significant increase in the Hispanic share of the population of typical degree-seeking age (see sidebar The Changing Racial and Ethnic Composition of the U.S. College-Age Population). The share of social and behavioral sciences degrees earned by Hispanic students increased rapidly, from 12% in 2011 to 21% in 2020. Consequently, the Hispanic share of bachelor’s degrees in social and behavioral sciences is nearly identical to their share of the 18- to 34-year-old population, which was 22% in 2021 (figure 7-B).
S&E bachelor's degrees awarded to Hispanic or Latino students, by field: 2011 and 2020
| Field of degree | 2011 | 2020 |
|---|---|---|
| Agricultural and biological sciences | 8.4 | 15.5 |
| Mathematics and computer sciences | 8.8 | 12.8 |
| Physical and earth sciences | 7.0 | 14.1 |
| Social and behavioral sciences | 12.0 | 21.1 |
| Engineering | 9.2 | 14.0 |
S&E = science and engineering.
Note(s):
Hispanic or Latino may be any race; race categories exclude Hispanic origin. Race and ethnicity data are available only for U.S. citizens and permanent residents. Data are based on degree-granting, primarily postsecondary institutions eligible to participate in Title IV federal financial aid programs.
Source(s):
National Center for Science and Engineering Statistics, special tabulations (2022, Table Builder) of the National Center for Education Statistics, Integrated Postsecondary Education Data System, Completions Survey, provisional release data.
Within social and behavioral sciences, Hispanic students earned 30% of the bachelor’s degrees in sociology and 13% in economics (table 2-2). The proportion of degrees earned by Hispanic students varies only slightly across the remaining broad fields of S&E. In 2020, the share of bachelor’s degrees earned by Hispanic students in physical and earth sciences, which in 2011 had the lowest share of Hispanic degree recipients, was comparable to their share of these degrees in agricultural and biological sciences, mathematics and computer sciences, and engineering. Hispanic students earned between 13% and 16% of the bachelor’s degrees in these four broad fields.
Bachelor’s Degrees Earned by Black or African American Students
Black students are underrepresented among S&E bachelor’s degree recipients.
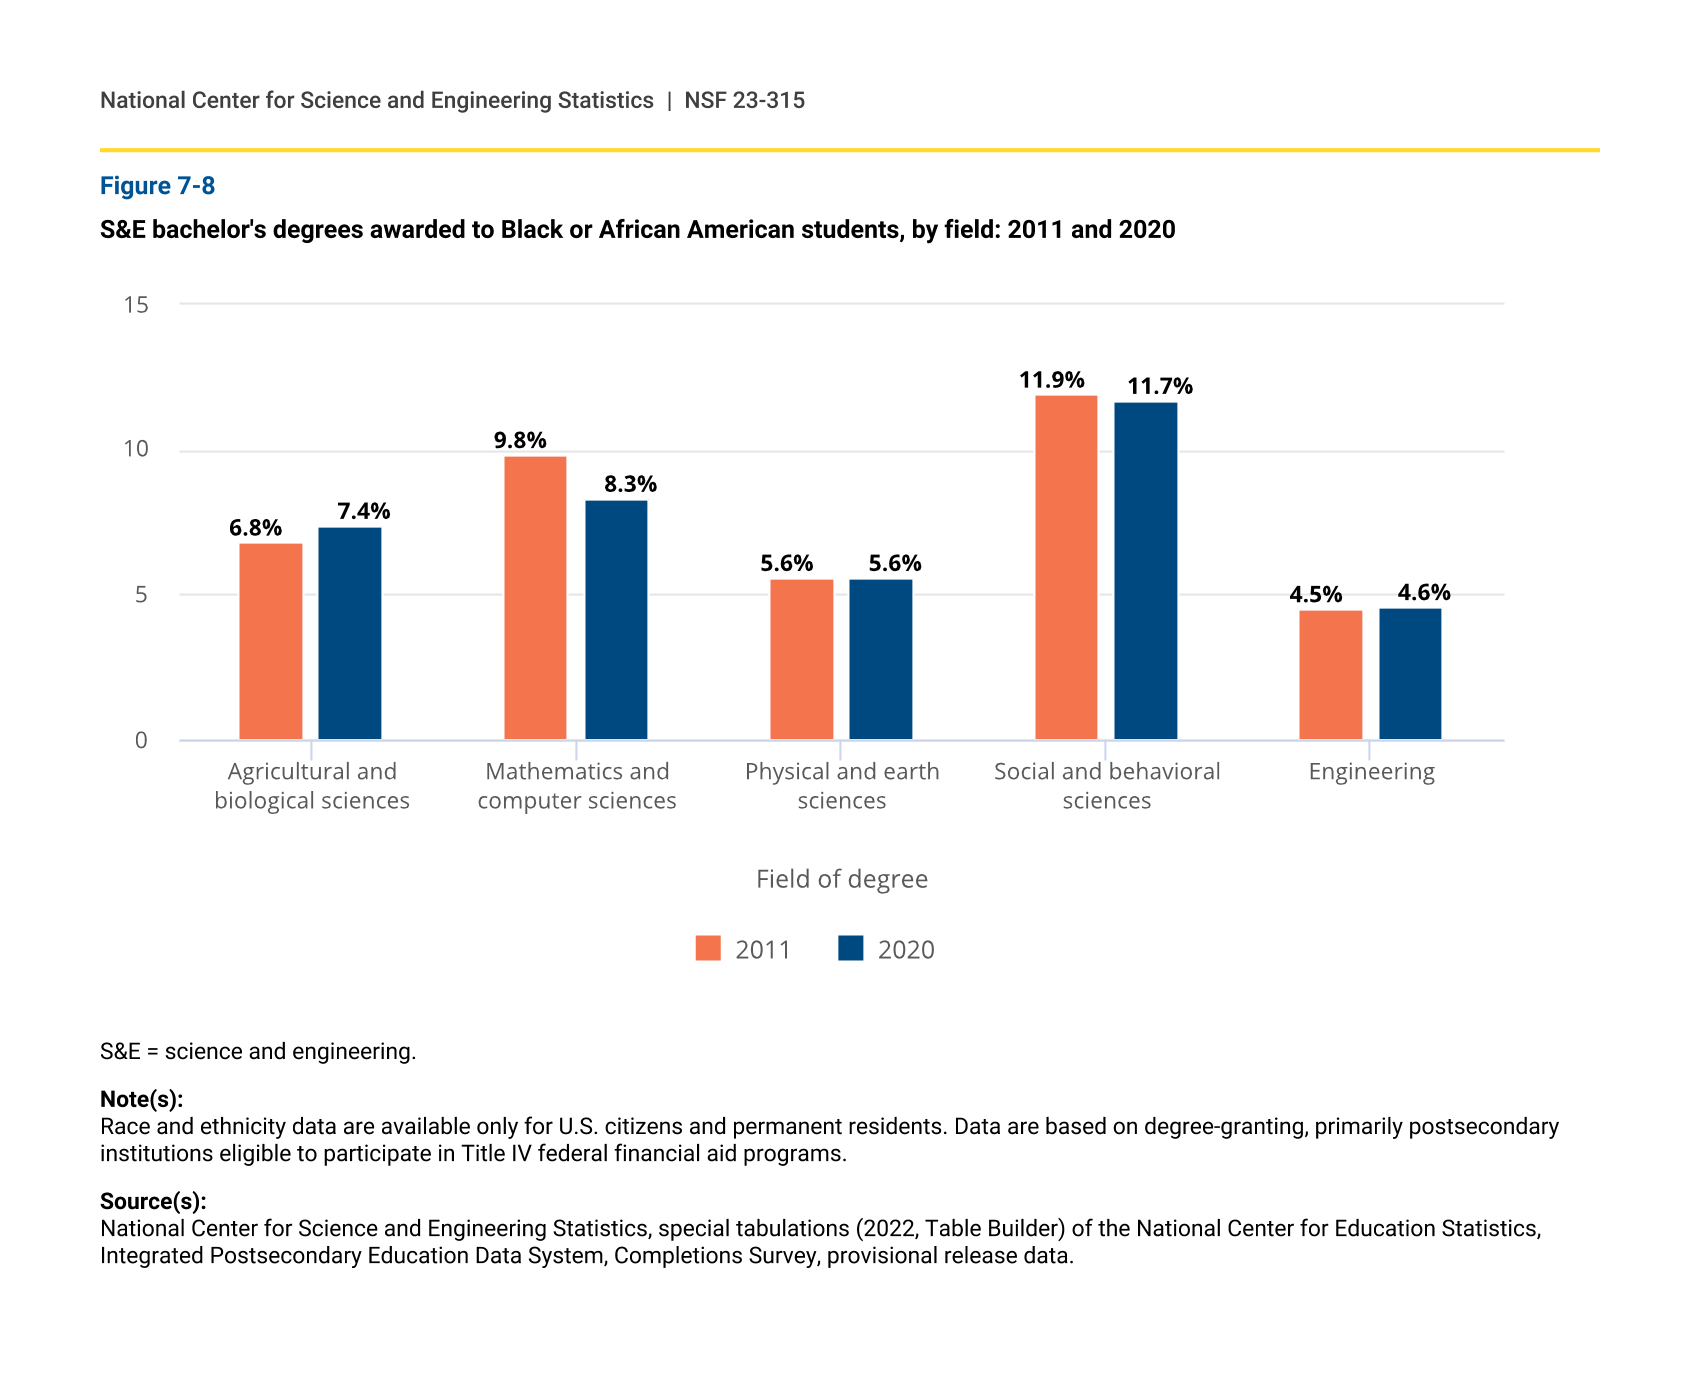
Representation of Black students among S&E bachelor’s degree recipients varies by S&E field (figure 7-8). Black students have the highest representation in social and behavioral sciences, earning 12% of bachelor’s degrees in 2020. Representation is lowest in engineering, where Black students earned 5% of bachelor’s degrees. From 2011 to 2020, this share remained nearly unchanged, even though the number of engineering degrees earned by Black students steadily increased (table 2-2). This pattern holds true across all fields of S&E. The share of degrees earned by Black students has not changed substantially over the past decade, despite an increase in the overall numbers of S&E bachelor’s degrees earned. Across all broad fields of S&E, Black individuals are underrepresented at the bachelor’s degree level relative to their share of the 18- to 34-year-old population (14% in 2021) (figure 7-B).
S&E bachelor's degrees awarded to Black or African American students, by field: 2011 and 2020
| Field of degree | 2011 | 2020 |
|---|---|---|
| Agricultural and biological sciences | 6.8 | 7.4 |
| Mathematics and computer sciences | 9.8 | 8.3 |
| Physical and earth sciences | 5.6 | 5.6 |
| Social and behavioral sciences | 11.9 | 11.7 |
| Engineering | 4.5 | 4.6 |
S&E = science and engineering.
Note(s):
Race and ethnicity data are available only for U.S. citizens and permanent residents. Data are based on degree-granting, primarily postsecondary institutions eligible to participate in Title IV federal financial aid programs.
Source(s):
National Center for Science and Engineering Statistics, special tabulations (2022, Table Builder) of the National Center for Education Statistics, Integrated Postsecondary Education Data System, Completions Survey, provisional release data.
Bachelor’s Degrees Earned by American Indian or Alaska Native Students
S&E bachelor’s degrees earned by American Indian or Alaska Native students decreased between 2011 and 2020.
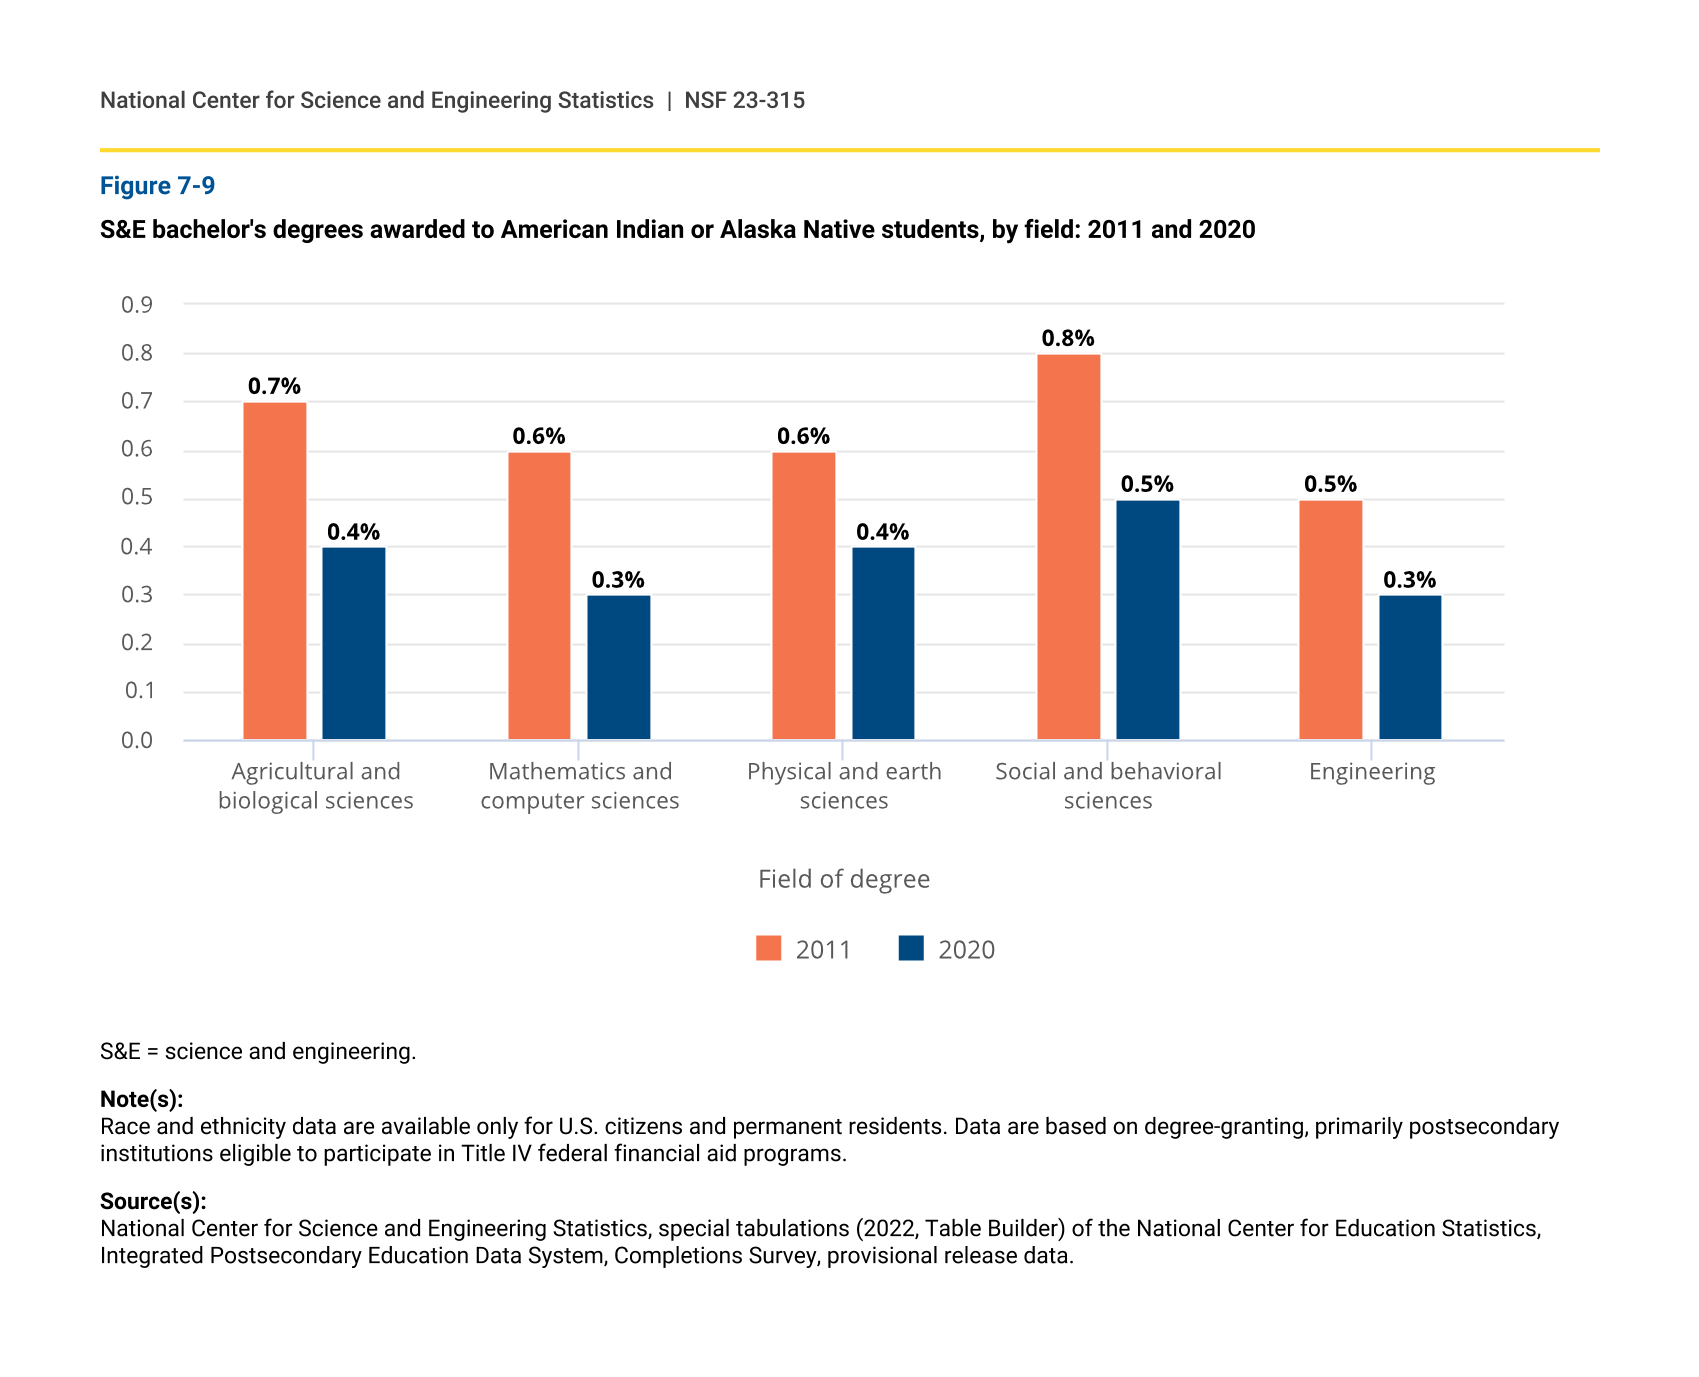
American Indian or Alaska Native students account for a low and declining share of S&E degree recipients (figure 7-9). Both the number (table 2-2) and share of bachelor’s degrees earned by American Indian or Alaska Native students across all fields of S&E declined from 2011 to 2020 (figure 7-9). The share of degrees earned by American Indian or Alaska Native students is lowest in mathematics and computer sciences and in engineering. About 0.3% of bachelor’s degrees in these two broad S&E fields were earned by American Indian or Alaska Native students. Like students from other underrepresented minority groups, American Indian or Alaska Native students account for a larger share of degrees in social and behavioral sciences (0.5% in 2020) relative to other fields of S&E; however, this difference is not as pronounced as it is for Hispanic and Black students.
Total S&E bachelor’s degrees awarded to American Indian or Alaska Native students dropped by 22% from 2011 to 2020 (table 2-2). Declines also occurred at the master’s and doctoral levels (table 2-3, table 2-4). American Indian or Alaska Native students are substantially underrepresented among S&E degree recipients at the bachelor’s level and above. American Indian or Alaska Native individuals accounted for 0.9% of the 18- to 34-year-old population in 2021 (figure 7-B) and received 0.4% of S&E bachelor’s, master’s, and doctoral degrees in 2020 (figure 7-4).
S&E bachelor's degrees awarded to American Indian or Alaska Native students, by field: 2011 and 2020
| Field of degree | 2011 | 2020 |
|---|---|---|
| Agricultural and biological sciences | 0.7 | 0.4 |
| Mathematics and computer sciences | 0.6 | 0.3 |
| Physical and earth sciences | 0.6 | 0.4 |
| Social and behavioral sciences | 0.8 | 0.5 |
| Engineering | 0.5 | 0.3 |
S&E = science and engineering.
Note(s):
Race and ethnicity data are available only for U.S. citizens and permanent residents. Data are based on degree-granting, primarily postsecondary institutions eligible to participate in Title IV federal financial aid programs.
Source(s):
National Center for Science and Engineering Statistics, special tabulations (2022, Table Builder) of the National Center for Education Statistics, Integrated Postsecondary Education Data System, Completions Survey, provisional release data.
Doctorates Earned by Persons with Disabilities
Individuals with at least one disability earned 11% of S&E doctorate degrees.
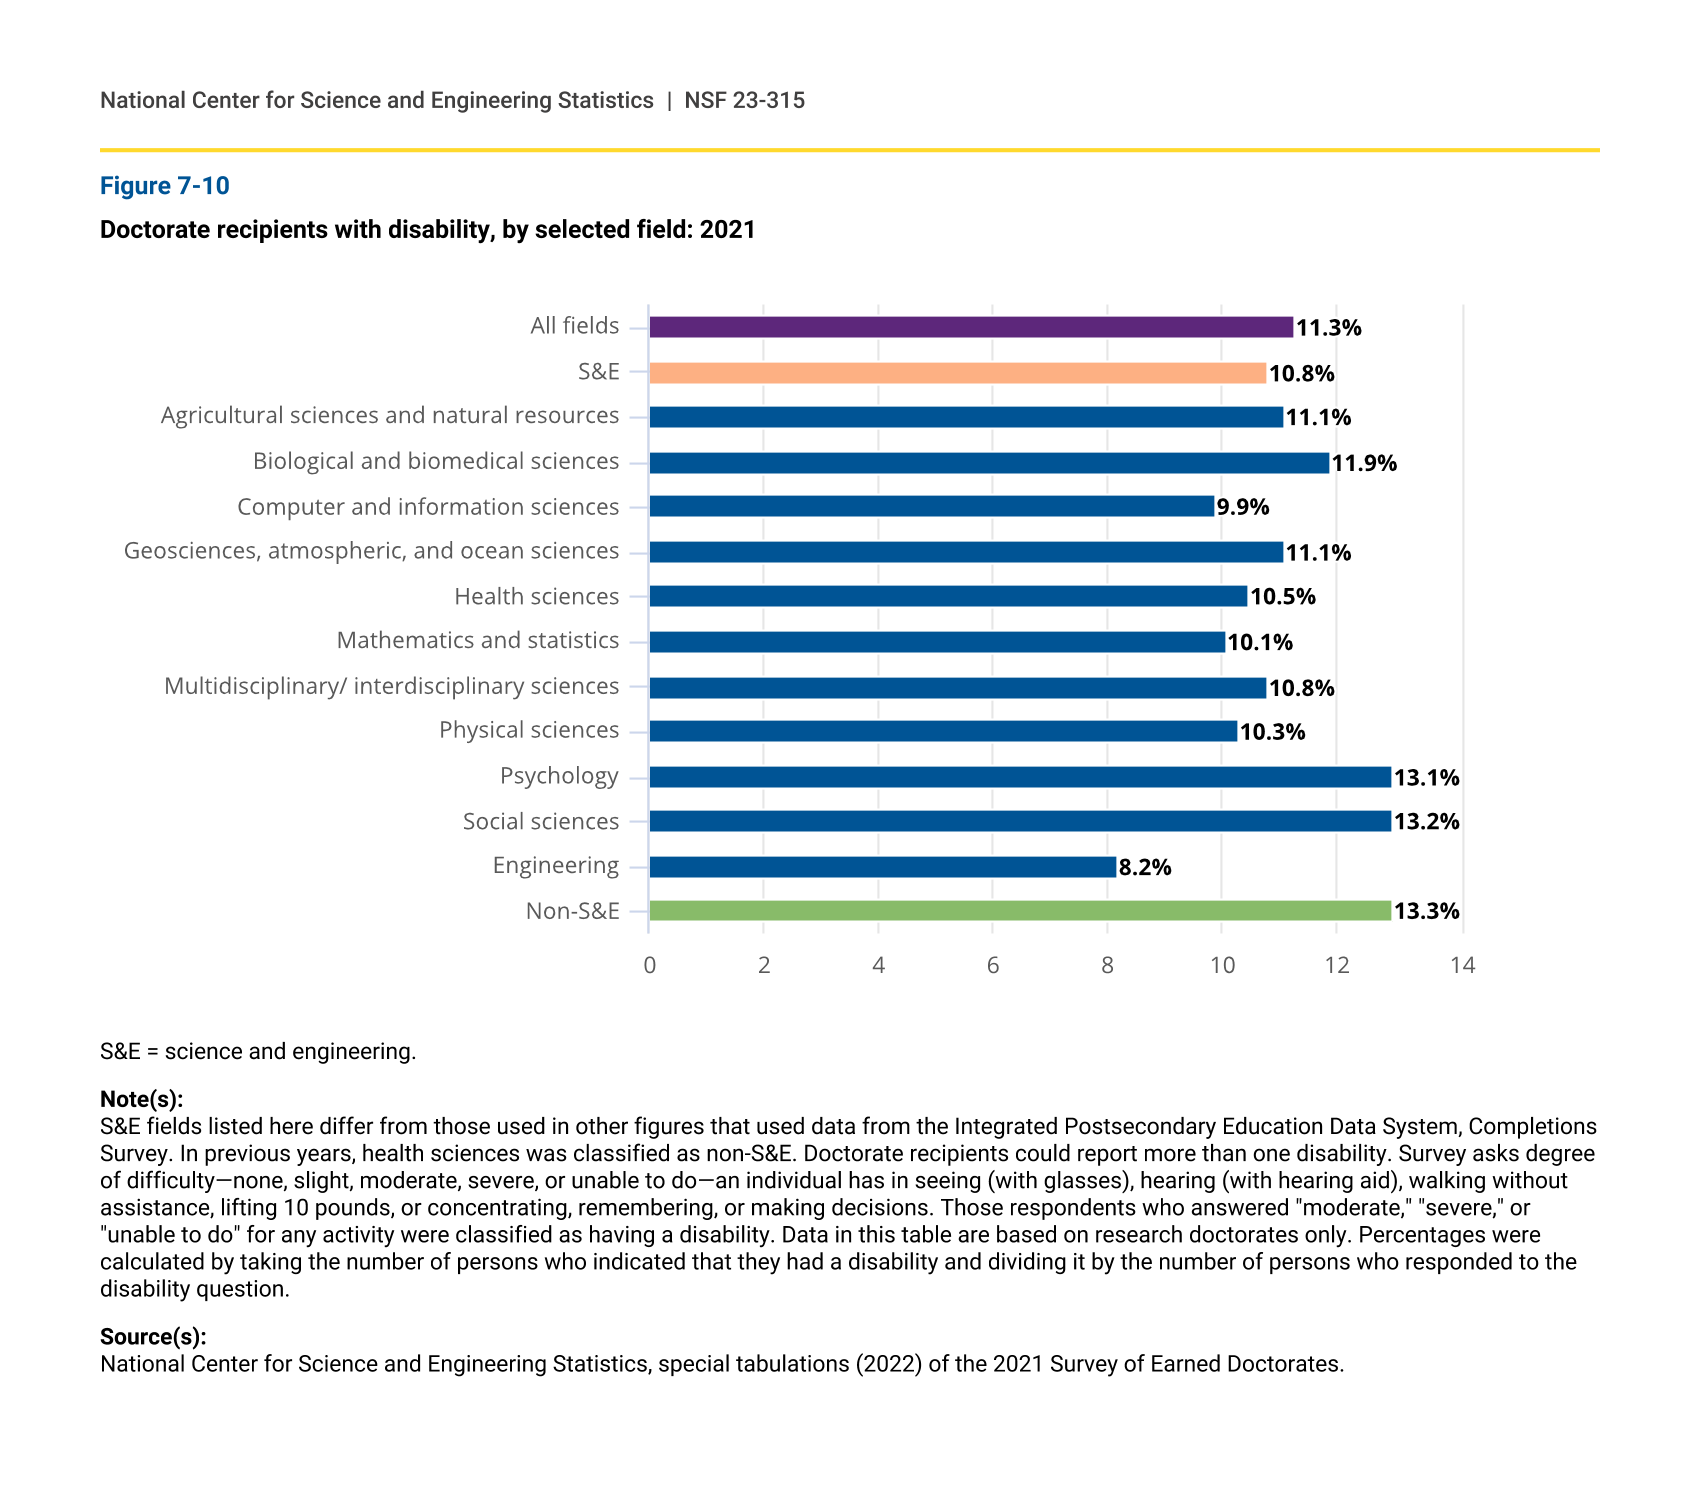
Compared with data for other groups, data on postsecondary degrees earned by persons with disabilities are limited. However, data from NCSES’s Survey of Earned Doctorates are available for doctorate recipients with one or more disabilities. Slight variations are observable in the share of doctorate recipients reporting a disability between S&E and non-S&E fields, as well as across different S&E fields (figure 7-10). In 2021, among all doctorate recipients, 11% reported at least one disability, as did a similar proportion (11%) of S&E doctorate recipients. A slightly higher proportion (13%) of doctoral degree recipients in non-S&E fields had at least one disability. Among S&E doctorate recipients, individuals earning degrees in psychology and social sciences had the highest rate of disability (13%) and those in engineering had the lowest rate (8%). Disability is defined as an individual reporting at least moderate difficulty on at least one of several tasks (see the sidebar Defining Persons with at Least One Disability in the Introduction for details).
Doctorate recipients with disability, by selected field: 2021
| Field | Percent |
|---|---|
| All fields | 11.3 |
| S&E | 10.8 |
| Agricultural sciences and natural resources | 11.1 |
| Biological and biomedical sciences | 11.9 |
| Computer and information sciences | 9.9 |
| Geosciences, atmospheric, and ocean sciences | 11.1 |
| Health sciences | 10.5 |
| Mathematics and statistics | 10.1 |
| Multidisciplinary/ interdisciplinary sciences | 10.8 |
| Physical sciences | 10.3 |
| Psychology | 13.1 |
| Social sciences | 13.2 |
| Engineering | 8.2 |
| Non-S&E | 13.3 |
S&E = science and engineering.
Note(s):
S&E fields listed here differ from those used in other figures that used data from the Integrated Postsecondary Education Data System, Completions Survey. In previous years, health sciences was classified as non-S&E. Doctorate recipients could report more than one disability. Survey asks degree of difficulty—none, slight, moderate, severe, or unable to do—an individual has in seeing (with glasses), hearing (with hearing aid), walking without assistance, lifting 10 pounds, or concentrating, remembering, or making decisions. Those respondents who answered "moderate," "severe," or "unable to do" for any activity were classified as having a disability. Data in this table are based on research doctorates only. Percentages were calculated by taking the number of persons who indicated that they had a disability and dividing it by the number of persons who responded to the disability question.
Source(s):
National Center for Science and Engineering Statistics, special tabulations (2022) of the 2021 Survey of Earned Doctorates.