Technical Notes
Data sources
Current Population Survey Annual Social and Economic Supplement
The Current Population Survey (CPS) is a monthly household survey sponsored jointly by the Census Bureau and the Bureau of Labor Statistics. The CPS is the primary source of labor force statistics for the population of the United States. Additional information about the CPS is available at https://www.census.gov/programs-surveys/cps.html.
The Annual Social and Economic Supplement (ASEC) is conducted annually in the months of February, March, and April. In addition to the usual monthly labor force data, this supplement provides information on work experience, income, noncash benefits, and migration of persons ages 15 years and older. Additional information about the CPS ASEC is available at https://www.census.gov/data/datasets/time-series/demo/cps/cps-asec.html.
The CPS estimates presented in this report were derived from the 2011, 2019, and 2021 ASEC supplements. Estimates that do not meet minimum unweighted sample size requirements or that exceed established coefficient of variation thresholds are not included in the analysis. Excluded groups are indicated in the figure or table notes.
STEM occupations
Occupations in the CPS are classified using the Standard Occupational Classification (SOC) system (see https://www.bls.gov/soc/). Because the CPS data used here spans 10 years, the occupation codes are based on two SOC systems: (1) the 2010 SOC for the 2011 and 2019 ASEC and (2) the 2018 SOC for the 2021 ASEC. The occupation codes from the two systems were combined into a single list and then grouped into (1) science, technology, engineering, and mathematics (STEM) occupations including S&E, S&E-related, and middle-skill occupations and (2) non-STEM occupations (see table A-1). For additional information, see Appendix B in the CPS ASEC Technical Documentation at https://www.census.gov/data/datasets/time-series/demo/cps/cps-asec.html.
STEM occupation codes
STEM = science, technology, engineering, and mathematics.
Source(s):
National Center for Science and Engineering Statistics, analysis (2022) of Census Bureau occupation codes from the 2011, 2019, and 2021 Current Population Survey.
Median wage and salary earnings
In this report, median wage and salary earnings were calculated for those who were employed and had positive earnings during the survey year and who worked in the previous year. Although current employment status and occupation refer to the year of the survey, wage and salary refer to earnings during the previous calendar year. Wage and salary earnings for the previous year refer to those from the job held longest during the preceding year. The medians exclude (1) the currently employed who were unemployed in the previous year and (2) the currently unemployed. For more information, see the Glossary in CPS ASEC Technical Documentation.
Unemployment
In the CPS, the civilian labor force includes all noninstitutionalized civilians ages 16 years or older who are either employed or unemployed and excludes the institutionalized population (those residing in nursing homes and mental health facilities and in prison), active-duty military personnel, full-time college students who are not working for pay, and others not in the labor force (for example, retirees or stay-at-home parents).
The unemployment rate represents the number of persons unemployed as a percentage of the civilian labor force ages 16 years old and over. The unemployment rate refers to the respondents’ status in the labor force for the survey year.
National Survey of College Graduates
The National Survey of College Graduates (NSCG) is a biennially conducted survey of individuals with at least a bachelor’s degree, under the age of 76, and living in the United States at the time of the survey. In this report, data from the 2021 NSCG for respondents employed in S&E, S&E-related, or non-S&E occupations were evaluated. Part-time employment and involuntarily employed part-time were assessed based on status at the time of the survey. Additional information on the NSCG is available at https://www.nsf.gov/statistics/srvygrads/.
Integrated Postsecondary Education Data System Survey
The Integrated Postsecondary Education Data System (IPEDS) is a set of interrelated surveys of postsecondary institutions that participate in federal student financial aid programs authorized by Title IV of the Higher Education Act of 1965. The annual surveys are conducted by the U.S. Department of Education’s National Center for Education Statistics (NCES). Because the data in IPEDS come from all eligible institutions, there are no sampling errors. Additional information about IPEDS is available at https://nces.ed.gov/ipeds/.
This report uses data from the IPEDS Completions Surveys from 2011–21 to provide information about degrees awarded at the associate through doctoral levels. The IPEDS Completions Survey collects data on the level and field of degree awards, as well as the sex, citizenship, and race and ethnicity of the degree recipient. Sex is available for all degree recipients, but race and ethnicity are available only for U.S. citizens and permanent residents. For race and ethnicity analysis using the IPEDS data, degree recipients holding temporary U.S. visas are excluded. The reported number and share of degrees earned by each racial and ethnic group are derived from U.S. citizens and permanent residents. Disability status is not included in the survey.
NCES categorizes fields of degree in IPEDS according to Classification of Instructional Programs (CIP) codes. NCSES maps the CIP fields of degrees into a set of broad and detailed fields of study spanning S&E and non-S&E disciplines. This report uses the same classification system for IPEDS fields of degree as prior Women, Minorities, and Persons with Disabilities and Science and Engineering Indicators reports, which differs from the NCSES Taxonomy of Disciplines (TOD) implemented in NCSES surveys. Degree data from the IPEDS Completions Survey are available through the NCSES Table Builder.
Survey of Graduate Students and Postdoctorates in Science and Engineering
The Survey of Graduate Students and Postdoctorates in Science and Engineering (GSS) is an annual census of all U.S. academic institutions granting research-based master’s degrees or doctorates in science, engineering, and selected health fields as of the fall of the survey year. The survey collects the total number of master's and doctoral students, postdoctoral appointees, and doctorate-level nonfaculty researchers by demographic and other characteristics, such as source of financial support. Additional information about the GSS is available at https://www.nsf.gov/statistics/srvygradpostdoc/.
Data on race and ethnicity are available only for U.S. citizens and permanent residents. For race and ethnicity analysis using the GSS data, graduate students holding temporary U.S. visas are excluded. The reported number and share of postsecondary enrollment by each racial and ethnic group are derived from the U.S. citizens and permanent residents. Age and disability status information are not included in the survey. The GSS was redesigned in 2017, and fields of study were changed to align with the NCSES TOD, thus increasing comparability with other NCSES surveys. S&E fields presented in the enrollment section that rely on GSS data, therefore, vary from the IPEDS classification used for S&E degree awards. Because the 2017 change in the GSS limits comparability with previous years of the survey when data are disaggregated by S&E field, this report used GSS data from 2017–21. More information about the 2017 changes is available in the “Data Comparability” section of the Technical Notes for Survey of Graduate Students and Postdoctorates in Science and Engineering: Fall 2017.
Survey of Earned Doctorates
The Survey of Earned Doctorates (SED) is an annual census of all individuals receiving a research doctorate from an accredited U.S. academic institution. The SED collects information on the doctoral recipient's educational history, demographic characteristics, and postgraduation plans. The data for a given year include all doctorates awarded in the 12-month period ending on 30 June of that year. In this report, 2021 survey data on doctorate recipients reporting at least one disability were used. Additional information about the SED is available from https://nsf.gov/statistics/srvydoctorates/.
Survey of Doctorate Recipients
The Survey of Doctorate Recipients (SDR) is a biennial, longitudinal survey of individuals with a research doctoral degree in a science, engineering, or health field from a U.S. academic institution. Sets of individuals are surveyed from the year of their degree award until age 75. In this report, data from the 2021 survey are provided in the associated data tables. Additional information on the SDR is available at https://www.nsf.gov/statistics/srvydoctoratework/.
Statistical testing of sample survey data
Statistical tests are used to determine whether differences observed in sample survey data are valid differences in the population and not simply due to chance. When this report includes statements about differences based on sample survey data, the differences are statistically significant at the 10% level.
A statistically significant difference is not necessarily large. It is simply a difference that is unlikely to be caused by chance variation in sampling. With a sufficiently large sample, extremely small differences can be statistically significant. Conversely, differences that appear large may not be statistically significant if one or both estimates being compared are based on small samples. Occasionally, large differences are noted in the text as not being statistically significant to alert the reader that these differences may have occurred by chance due to limited sample data.
Appendix: NCSES table builder
This report website includes a Data Tables page with additional data on employment, degrees awarded, and graduate enrollment for women, minorities, and persons with disabilities. NCSES also publishes a suite of data tools that allows users to access datasets and build their own tables. The datasets relevant to this report are as follows: SED, GSS, NSCG, SDR, IPEDS Completions Survey, and IPEDS Enrollment Survey.
Building a table in data explorer: example
For this example, you will be creating a table of doctorate recipients in S&E by broad field, sex, citizenship, and race and ethnicity in 2021.
- Visit https://ncsesdata.nsf.gov/home.
- If needed, click the Menu in the top right corner to view all options. Click the drop-down arrow next to “Build Table” and select “Earned Doctorates.”
- This is the table builder interface. Notice the left-side panel containing the measures and dimensions offered by this dataset. If the left-side panel is not visible, click on the first button, labeled “Left Rail,” above the table. Measures are the numbers in the body of the table. Dimensions are the ways in which you can filter and categorize these measures.
- On the left-side panel, click “Graduates, Certificates, and Educational History.” On the slide-out panel that opens, click on “Doctorate Recipients.” Check “By Demographic Characteristics” and click “Add to Table.” The measure is now set to doctorate recipients, and the default column dimension for this measure is “Year.”
- The data tool will automatically populate data for every survey cycle. To filter for only 2021, click on the “Survey Cycle and Other Technical” dimension on the left-side panel. Then, click on “Year.” On the right side of the pop-up, click “Clear All,” select “2021” in the left selection box, and click the right-facing arrow in the middle of the two boxes. Click “Update.”
- On the left-side panel under “Dimensions,” click on “Fields of Study,” then on “Academic Discipline - CIP.” A pop-up with a hierarchy of fields of study appears. In the top left of the pop-up, uncheck “New Major Fields (SED-CIP)” and select “Science and engineering” from the selection list in the left box. Your selection and respective subfields will automatically move to the right box. Click add to table as "Row.”
- On the left-side panel under “Dimensions,” click “Sex,” then click “Sex” in the slide-out panel, uncheck “Unknown sex,” and add to table as “Row.”
- On the left-side panel under “Dimensions,” click “Race and Ethnicity,” then click “Race and Ethnicity” in the slide-out panel. Make sure all the categories are selected, and add to table as "Row.”
- Tip: This guide helps you add dimensions in the appropriate order, but at any point you may rearrange the dimensions by dragging and dropping them in the column and row boxes above the table.
- Tip: Some rows and columns in the table may be preceded by a plus or minus sign, meaning that the given table section can be expanded or collapsed, respectively. Expand all rows and columns (see 11b and c) before exporting (see 11d), otherwise some data may not appear.
- Want to do more with your table? Above the table, you will find a row of buttons with varied functionality:
- “Left Rail” collapses and expands the left-side panel.
- “+ Rows” expands all of the rows in your table; “- Rows” collapses them.
- “+ Columns” expands all of the columns in your table; “- Columns” collapses them.
- “Export” downloads the currently displayed table as a CSV file.
- “Sort” rearranges the order of dimension categories.
- “Convert to Chart” changes the current table into a chart in the data tool’s chart builder.
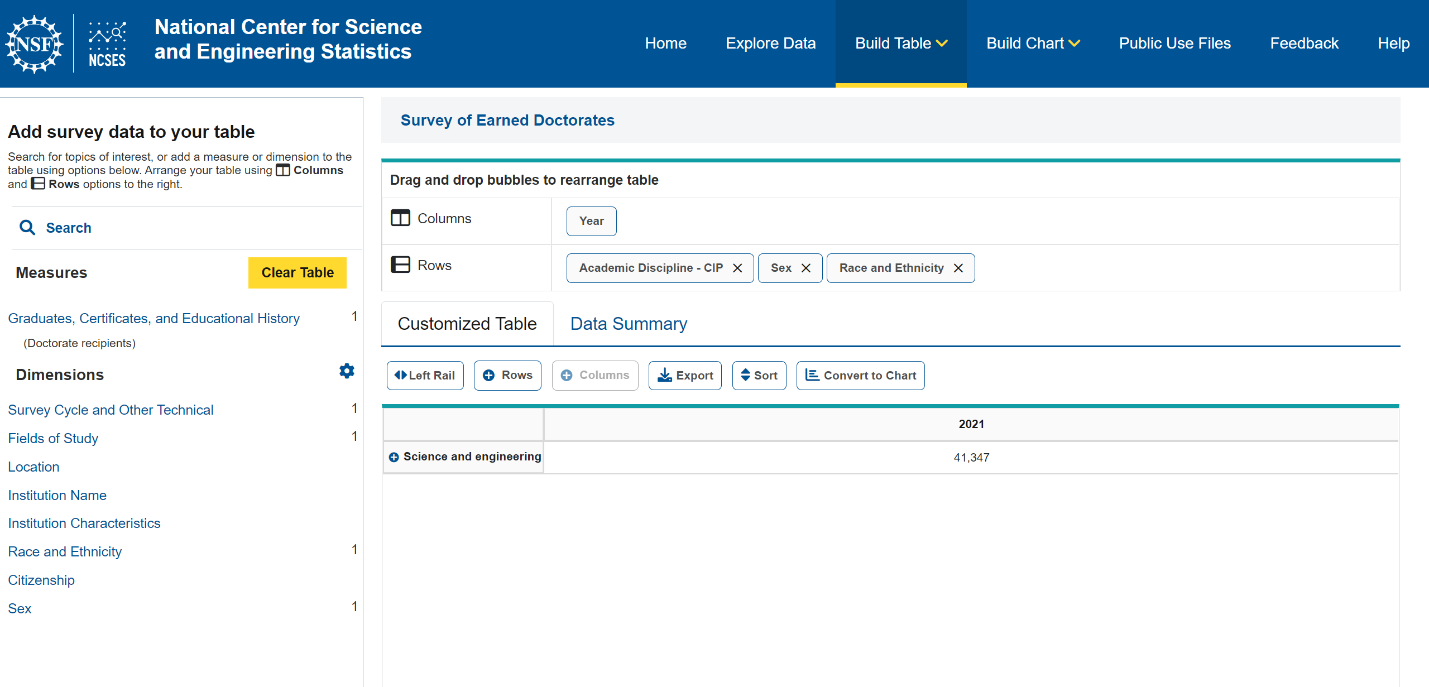
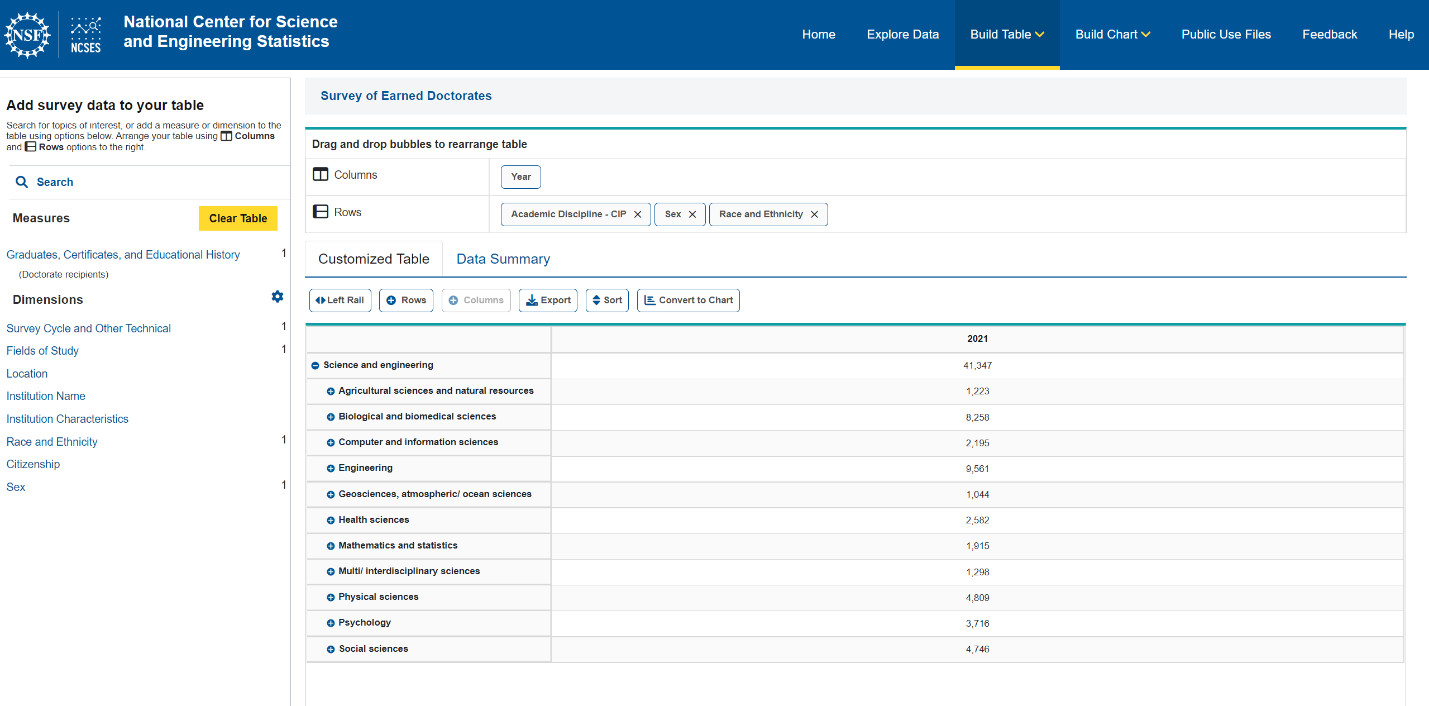
Please reference the images below to ensure the above steps have been followed properly.
For questions relating to the NCSES Data Tools, contact: NCSESdata@nsf.gov.
Screenshot of finished table with some row categories expanded.
Screenshot of finished table with all rows collapsed.