 An official website of the United States government

State Agencies’ R&D Increased 1% in FY 2021; Five States Account for Nearly 60% of All State Government R&D
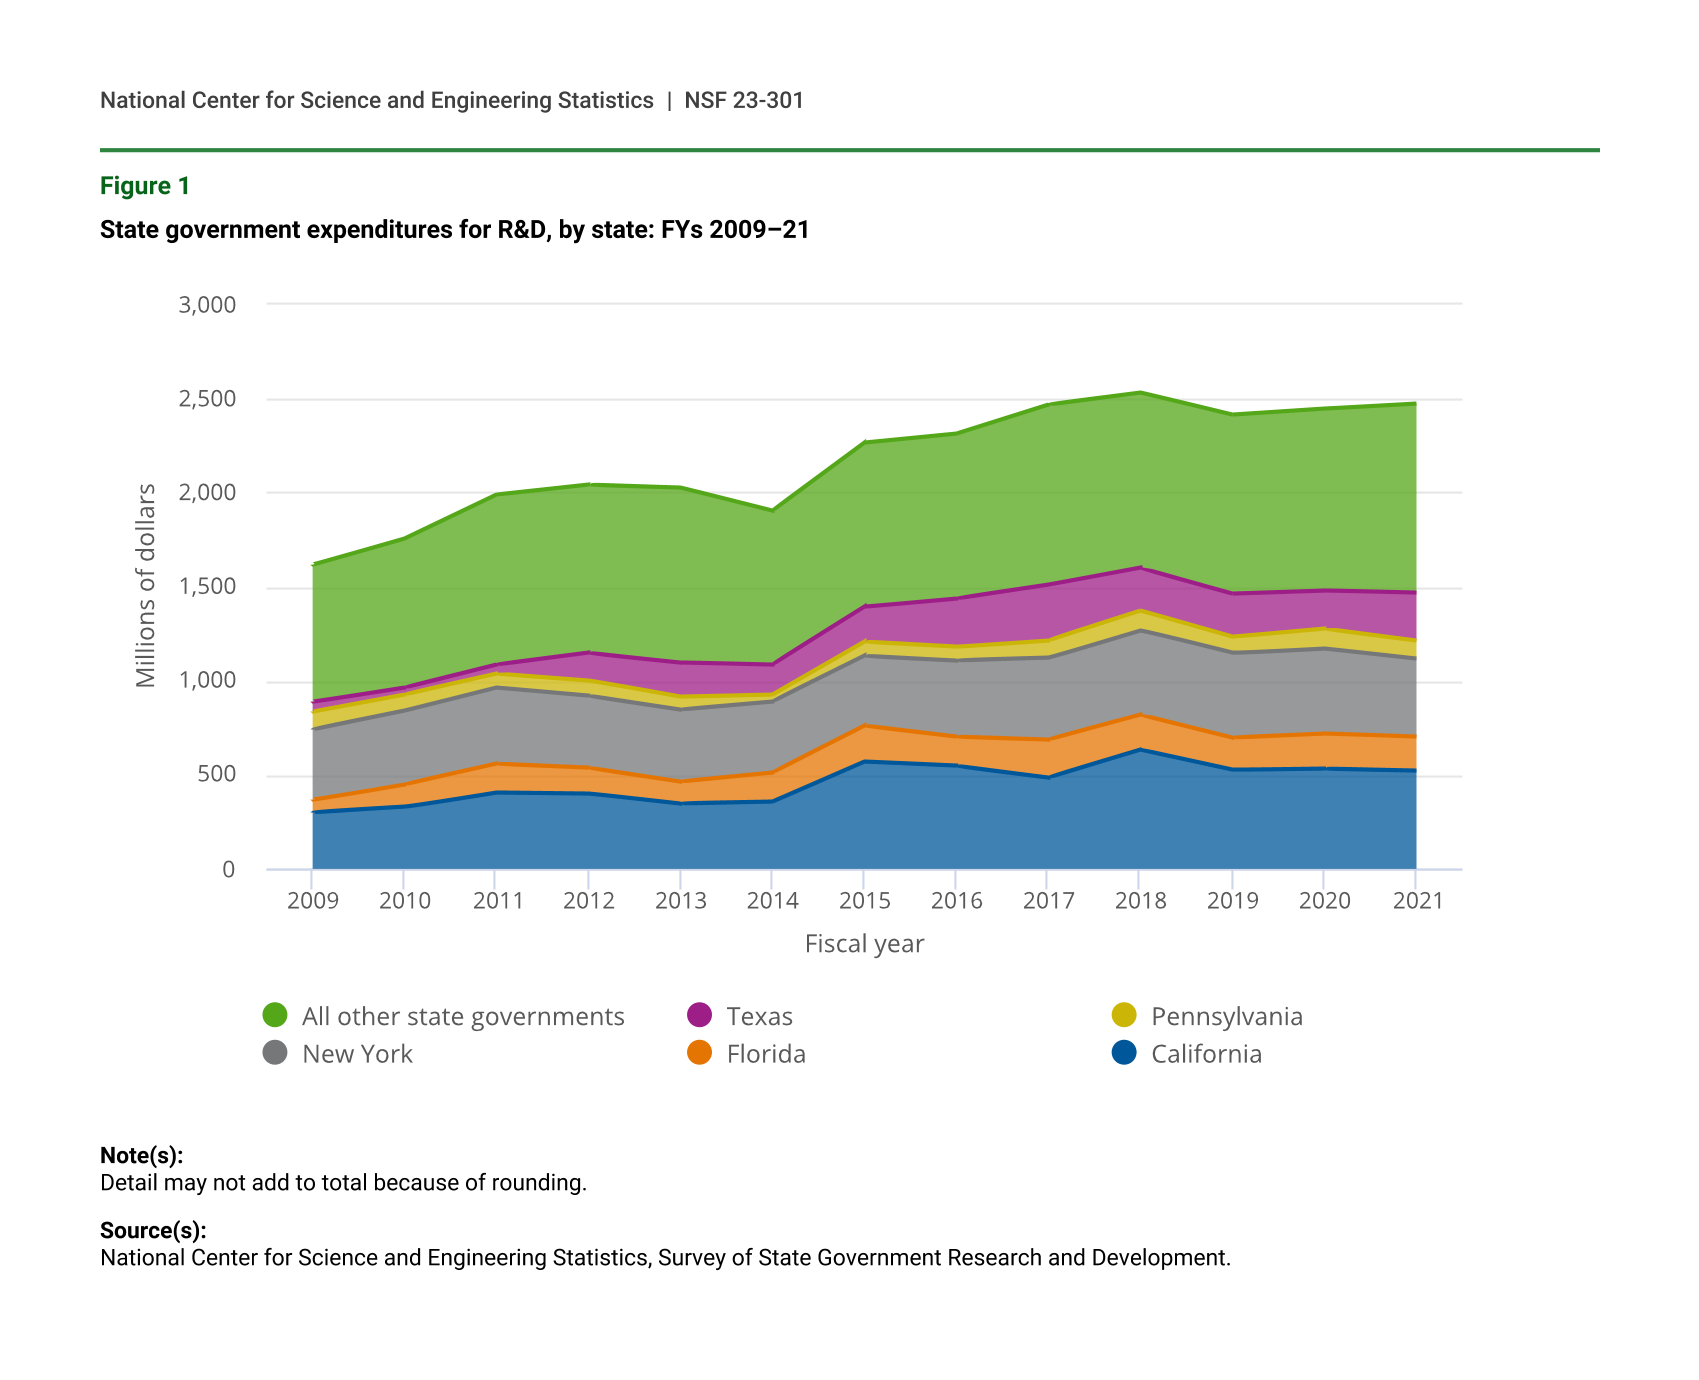
State government agencies’ expenditures for research and development totaled nearly $2.5 billion in FY 2021, an increase of 1.1% from FY 2020 (figure 1). While total state government agency R&D expenditures saw a slight increase between FY 2020 and FY 2021, state agency expenditures for R&D decreased in four of the five largest states. Agency spending on R&D declined in California (-1.9%), Florida (-3.4%), New York (-8.1%), and Pennsylvania (-9.2%), while spending in Texas increased (24.6%). Combined, these five states constitute 59.4% of all state agency expenditures for R&D. Spending in all other states combined increased 4.1% from FY 2020.
This InfoBrief presents summary statistics from the FY 2021 Survey of State Government Research and Development, sponsored by the National Center for Science and Engineering Statistics (NCSES) within the National Science Foundation. Amounts reported do not include direct appropriations from state legislatures to universities, colleges, and private organizations.
State government expenditures for R&D, by state: FYs 2009–21
| Fiscal year | California | Florida | New York | Pennsylvania | Texas | All other state governments |
|---|---|---|---|---|---|---|
| 2009 | 300 | 67 | 375 | 96 | 49 | 729 |
| 2010 | 329 | 121 | 391 | 88 | 35 | 792 |
| 2011 | 408 | 151 | 405 | 75 | 47 | 904 |
| 2012 | 402 | 137 | 382 | 81 | 147 | 894 |
| 2013 | 347 | 119 | 382 | 66 | 185 | 929 |
| 2014 | 356 | 157 | 377 | 35 | 162 | 818 |
| 2015 | 569 | 192 | 371 | 75 | 185 | 874 |
| 2016 | 547 | 156 | 405 | 73 | 255 | 878 |
| 2017 | 486 | 202 | 434 | 93 | 294 | 959 |
| 2018 | 633 | 186 | 450 | 102 | 229 | 931 |
| 2019 | 527 | 171 | 449 | 85 | 233 | 948 |
| 2020 | 534 | 185 | 454 | 103 | 205 | 964 |
| 2021 | 524 | 178 | 417 | 94 | 256 | 1,003 |
Note(s):
Detail may not add to total because of rounding.
Source(s):
National Center for Science and Engineering Statistics, Survey of State Government Research and Development.
Summary of State Government R&D Totals
Expenditures on R&D accounted for 98.8% of the $2.5 billion in state government agency expenditures on R&D and R&D plant in FY 2021 (table 1). R&D plant accounted for just $29 million. State governments served as the largest source of funds for agency R&D (75.2%, or $1.9 billion), whereas federal funds accounted for 24.8%, or $612 million.
State agency R&D and R&D facilities expenditures: FYs 2020–21
a Intramural performers include employees within the same state department or agency and services performed by others in support of internal R&D projects.
b Includes government functions for corrections, criminal justice, education, forensic sciences, labor, public safety, and social services.
Note(s):
R&D plant includes acquisition of land, facilities, major equipment, and major building renovations intended primarily for R&D use. Detail may not add to total because of rounding.
Source(s):
National Center for Science and Engineering Statistics, Survey of State Government Research and Development.
Of the six functional categories of state agency R&D, health-related R&D remained the largest with over $1.0 billion in expenditures, increasing just 0.3% from FY 2020. Although R&D on environmental and natural resources declined from $448 million in FY 2020 to $429 million in FY 2021, it remains the second-largest functional area. Energy-related R&D increased 5.1% year to year to $411 million. Agriculture R&D declined 15.7% in FY 2021 to $120 million from its all-time-highest level in FY 2020 of $142 million and is now similar to funding levels from FY 2017, when it totaled $117 million.
Expenditures for R&D plant (construction projects, major building renovations, major equipment purchases, and land and building acquisitions intended primarily for R&D use) totaled $29 million in FY 2021, up from nearly $10 million in FY 2020.
State Government R&D Performance
Overview
Although state governments are both funders and performers of R&D, the majority (72.7%) of their expenditures support extramural R&D (i.e., performers other than state agencies). Higher education institutions were the primary recipients of these expenditures, receiving 53.4% of all extramural funding, followed by companies and individuals (28.3%). Intramural performers of R&D, the state agencies themselves, totaled $674 million in FY 2021, a decrease of 2.6% from $692 million in FY 2020.
Intramural R&D Performance
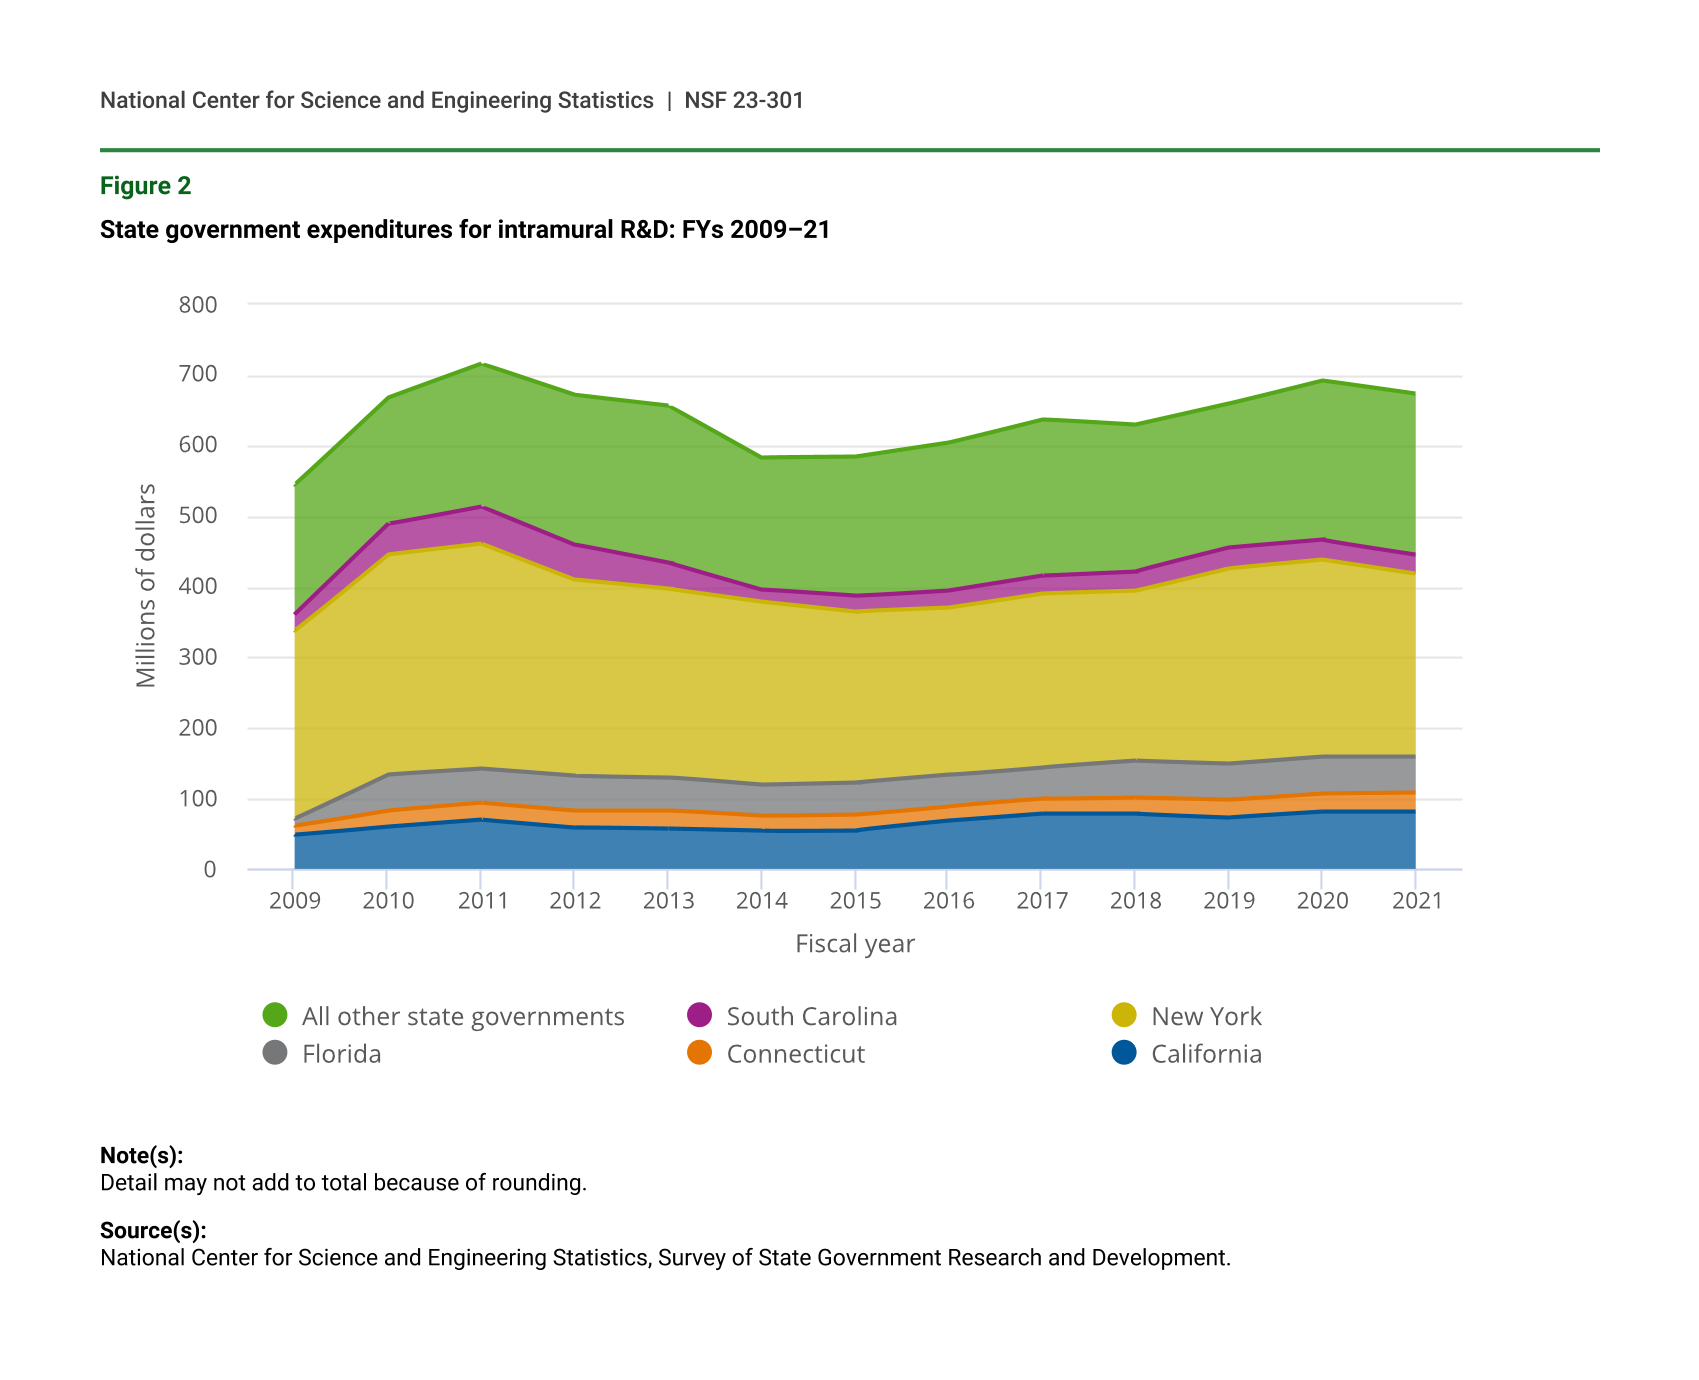
Five states accounted for 66.3% of the $674 million in total expenditures for intramural R&D performed by state agencies in FY 2021: New York ($259 million), California ($81 million), Florida ($51 million), South Carolina ($28 million), and Connecticut ($27 million) (figure 2). New York state’s own intramural R&D expenditures account for nearly 38.5% of all state governments’ intramural R&D and are larger than the sum of all other state governments minus California, Connecticut, Florida, and South Carolina. In FY 2021, 44.3% ($299 million) of all state agency intramural R&D performance was supported by federal funds; for New York state, however, 54.3% of intramural R&D expenditures were from federal funds.
State agency intramural performance is focused on applied research, with 75.0% ($506 million) of all intramural expenditures classified as applied, while basic research and experimental development constitute 17.7% and 7.2%, respectively.
State government expenditures for intramural R&D: FYs 2009–21
| Fiscal year | California | Connecticut | Florida | New York | South Carolina | All other state governments |
|---|---|---|---|---|---|---|
| 2009 | 48 | 13 | 10 | 266 | 24 | 183 |
| 2010 | 60 | 23 | 51 | 312 | 43 | 179 |
| 2011 | 70 | 24 | 48 | 319 | 53 | 202 |
| 2012 | 59 | 24 | 49 | 278 | 50 | 212 |
| 2013 | 57 | 26 | 47 | 267 | 37 | 223 |
| 2014 | 54 | 21 | 44 | 260 | 17 | 187 |
| 2015 | 55 | 22 | 45 | 243 | 22 | 197 |
| 2016 | 68 | 21 | 44 | 237 | 25 | 209 |
| 2017 | 78 | 21 | 45 | 246 | 26 | 221 |
| 2018 | 78 | 23 | 52 | 241 | 28 | 207 |
| 2019 | 73 | 25 | 51 | 277 | 29 | 204 |
| 2020 | 81 | 26 | 52 | 279 | 28 | 226 |
| 2021 | 81 | 27 | 51 | 259 | 28 | 227 |
Note(s):
Detail may not add to total because of rounding.
Source(s):
National Center for Science and Engineering Statistics, Survey of State Government Research and Development.
Extramural R&D Performance
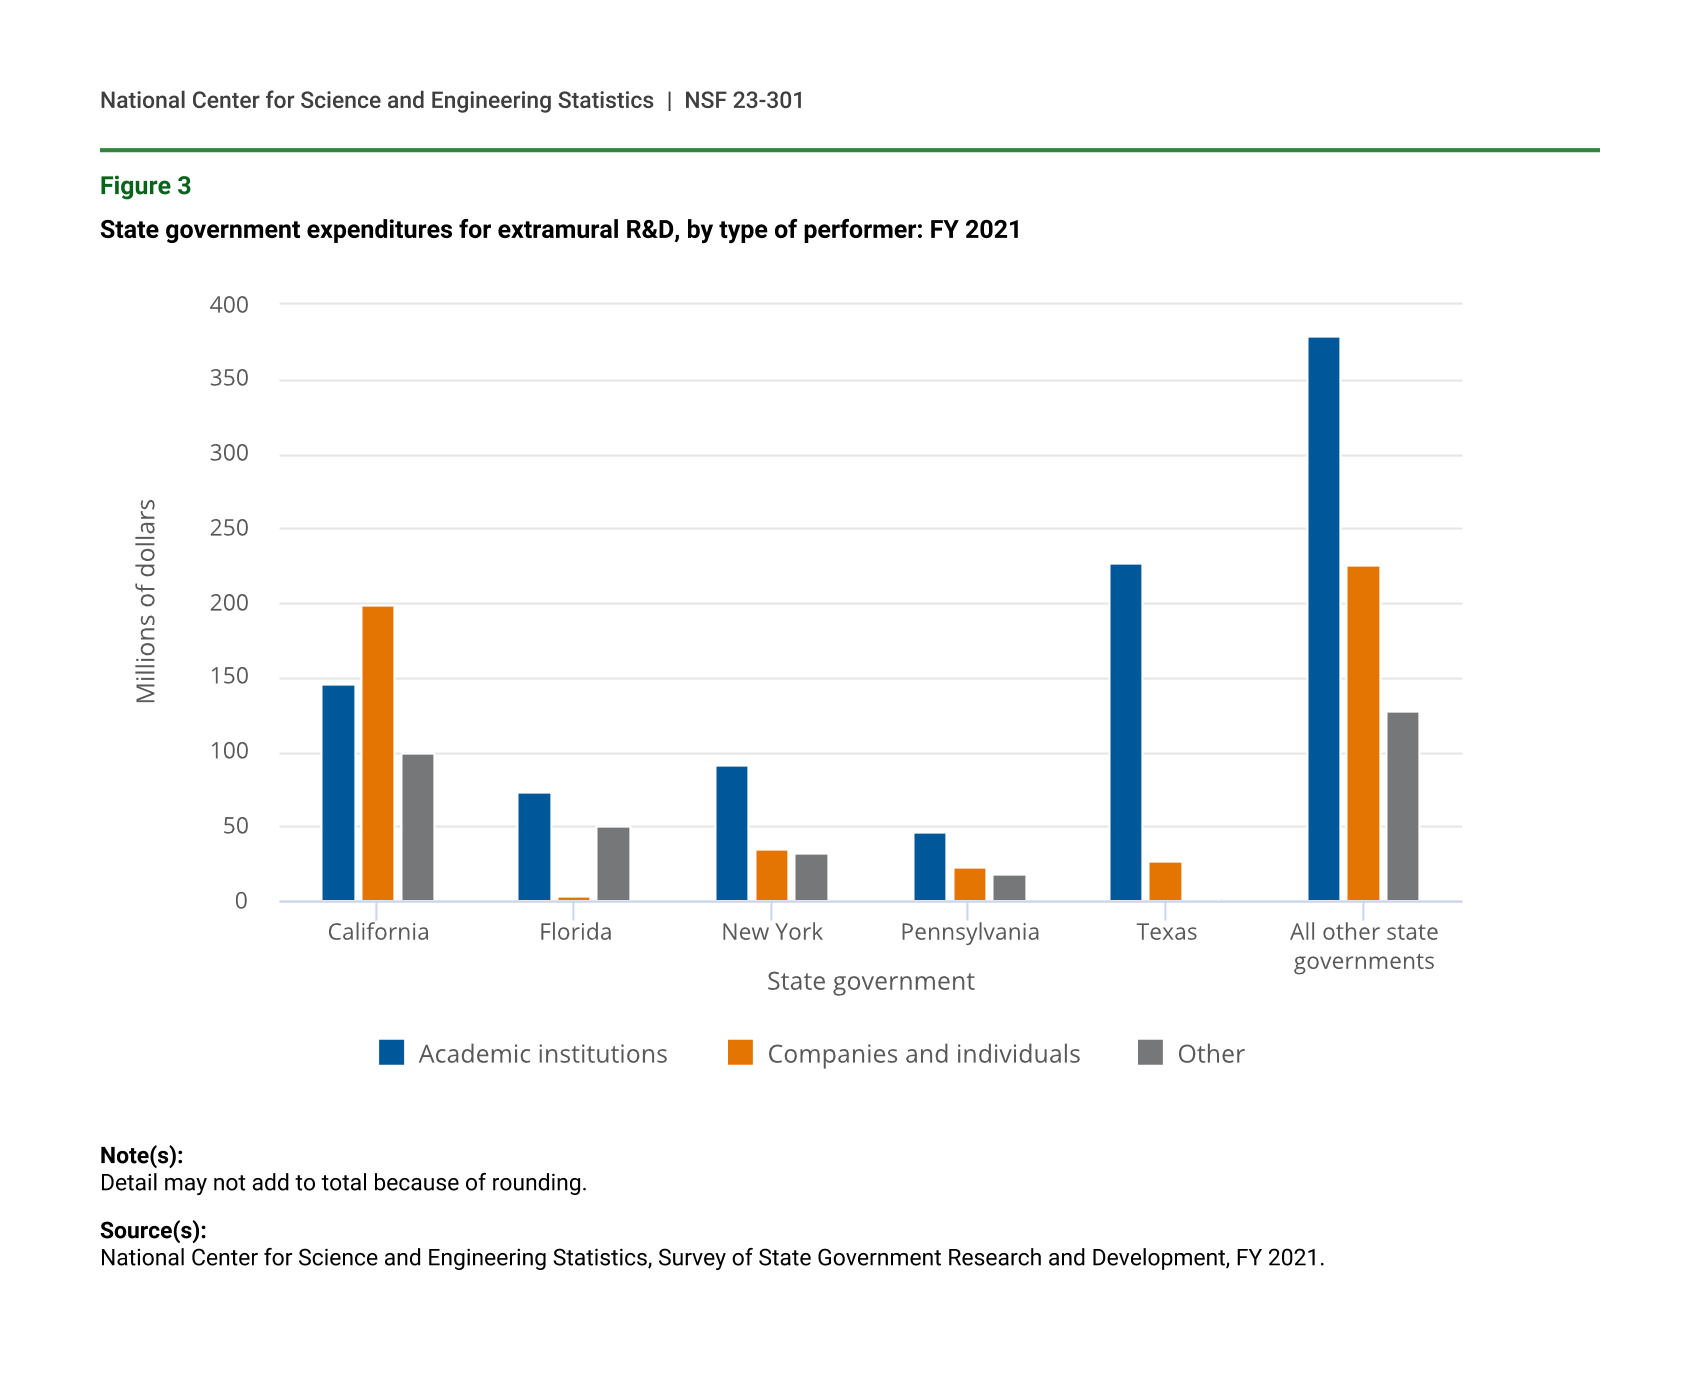
In FY 2021, all state government expenditures for extramural performance of R&D totaled $1.8 billion (figure 3). Just as the state governments of California, Florida, New York, Pennsylvania, and Texas constitute 59.4% of total state R&D expenditures, these same states had a similar contribution to extramural R&D expenditures. Combined, these five states accounted for 59.3% ($1.1 billion) of the total extramural R&D.
However, states varied in how they distributed extramural R&D. For example, Texas state agencies directed $226 million of the state’s total extramural R&D of $253 million toward academic institutions, compared with just $26 million to companies and individuals. By comparison, California’s distribution of extramural R&D funding is relatively balanced across the three sectors, with $145 million directed toward academic institutions, $198 million toward companies and individuals, and $100 million toward other performers.
State government expenditures for extramural R&D, by type of performer: FY 2021
| State government | Academic institutions | Companies and individuals | Other |
|---|---|---|---|
| California | 145 | 198 | 100 |
| Florida | 73 | 3 | 51 |
| New York | 91 | 35 | 32 |
| Pennsylvania | 46 | 22 | 18 |
| Texas | 226 | 26 | 1 |
| All other state governments | 379 | 225 | 127 |
Note(s):
Detail may not add to total because of rounding.
Source(s):
National Center for Science and Engineering Statistics, Survey of State Government Research and Development, FY 2021.
R&D by State Government Functions
Whether performed by state agencies themselves or by other performers outside the agency, most states reported a broad mix of R&D projects related to state government functions: agriculture, energy, environment and natural resources, health, and transportation (table 2). Health-related R&D expenditures account for the largest share (41.7%) of state agencies’ R&D. Environment and natural resources R&D expenditures and energy R&D expenditures accounted for 17.3% and 16.6%, respectively, of total state government R&D expenditures in FY 2021. Transportation, agriculture, and all other functions’ share of total R&D expenditures in FY 2021 were 12.2%, 4.8%, and 7.3%, respectively.
Individual state agency expenditures for R&D, by total R&D and function, for the 20 largest agencies: FY 2021
a U.S. total reflects all 50 states and the District of Columbia.
Note(s):
Includes state agency funding from all sources for both intramural and extramural performance. Detail may not add to total because of rounding.
Source(s):
National Center for Science and Engineering Statistics, Survey of State Government Research and Development.
Agency-Specific R&D Details
Of the 476 state agencies that responded to the survey in FY 2021, the largest 20 state agencies, by total expenditures, accounted for 56.4% of all agency R&D expenditures. To illustrate how concentrated expenditures are for health-related R&D, these 20 agencies accounted for $792 million of the $1 billion in state agency health R&D, or 76.8% of the funding for total health-related R&D. Although many states invested in health-related R&D, it is still highly concentrated. The six largest health agencies reporting R&D expenditures in FY 2021 constitute 66.3% of all state government health-related R&D. State expenditures for energy-related R&D are even more highly concentrated; the California Energy Commission alone accounted for 56.2% of all state agencies’ energy-related R&D expenditures.
Data Sources and Limitations
All 50 states and the District of Columbia participated in the FY 2021 survey, and 476 of the 498 selected agencies responded to the survey. Puerto Rico agencies did not report to the survey for FY 2021. Data for the FY 2021 survey were collected for NCSES by the Census Bureau under an interagency agreement.
For most states, the fiscal year begins on 1 July and ends the following 30 June. For example, FY 2021 begins on 1 July 2020 and ends on 30 June 2021. There are, however, five exceptions to the 30 June fiscal year end: New York (ends 31 March), Texas (ends 31 August), and Alabama, Michigan, and the District of Columbia (ends 30 September). Data presented in this InfoBrief are for each of the respective fiscal year periods as defined by the states.
Terms such as state, state government, and state agencies have equivalent meaning and are used interchangeably throughout this InfoBrief. The amounts reported here are for R&D expenditures of state government departments, agencies, public authorities, commissions, and other dependent entities that operate separately or somewhat autonomously from the central state government. State government R&D totals can display considerable volatility between survey years due to several national and state-specific factors. Large changes are not unusual, especially for discretionary spending items such as R&D. R&D plant expenditures can be highly variable year to year and will increase or decrease as capital projects begin or end.
Amounts reported do not include direct appropriations from state legislatures to universities, colleges, and private organizations. As a result, the $960 million in FY 2021 expenditures reported by state agencies to support R&D performance by academic institutions differs from the figure reported by universities and colleges in the NCSES Higher Education R&D Survey for expenditures on R&D activities funded from state and local government sources because the latter includes direct state appropriations.
State- and agency-specific data not available in this InfoBrief are available in the full set of data tables from this survey in the report Survey of State Government Research and Development: FY 2021 at https://ncses.nsf.gov/pubs/nsf23302.
Notes
1Detailed time series data on expenditures for agricultural-related R&D are available in data table 9, available at https://ncses.nsf.gov/pubs/nsf23302.
2Expenditures for R&D do not include expenditures for R&D plant because the two are separate funding activities.
3Data on intramural R&D by source of funds are available in data table 5, available at https://ncses.nsf.gov/pubs/nsf23302.
4Data on intramural R&D by source of funds are available in data table 7, available at https://ncses.nsf.gov/pubs/nsf23302.
5Detailed data on intramural R&D by state and performer are available in data table 2, available at https://ncses.nsf.gov/pubs/nsf23302.
6“Other” extramural performers includes nonprofit organizations, including foundations; federal government departments and agencies; other departments or agencies within the state; other state governments; county, city, special district, or regional local governments.
Suggested Citation
Pece CV; National Center for Science and Engineering Statistics (NCSES). 2022. State Agencies’ R&D Increased 1% in FY 2021; Five States Account for Nearly 60% of All State R&D. NSF 23-301. Alexandria, VA: National Science Foundation. Available at https://ncses.nsf.gov/pubs/nsf23301.
Contact Us
NCSES
National Center for Science and Engineering Statistics
Directorate for Social, Behavioral and Economic Sciences
National Science Foundation
2415 Eisenhower Avenue, Suite W14200
Alexandria, VA 22314
Tel: (703) 292-8780
FIRS: (800) 877-8339
TDD: (800) 281-8749
E-mail ncsesweb@nsf.gov
NSF 23-301
|November 29, 2022