 An official website of the United States government
 Public Familiarity with Science and Technology Research Processes
As noted earlier, research on public perceptions of science has shifted over time. Although earlier work often focused on public knowledge of facts, more recent work emphasizes how people understand the practice of science. Building on the notion that scientific literacy should include comprehension of how to conduct scientific inquiry (Miller 1983), recent research on public understanding of science has begun to assess what people know about how scientists perform scientific research (Hendriks, Kienhues, and Bromme 2020). Scientists can vary in their methods of inquiry and in the quality of their inquiries. At least some recent research has assessed the extent to which people tend to understand basic principles of scientific inquiry that are often taught in the context of higher education science training.
What Americans understand about how S&T research is conducted is also related to how the general U.S. population views S&T institutions and professionals, including the extent to which American adults trust S&T institutions and professionals. Knowing how well Americans understand the processes that S&T professionals use to make observations about the world can offer insights about the context of, and even potential explanations for, their general perceptions about S&T. For example, proactively acknowledging that uncertainty is an element of the scientific process because scientists continue to test ideas over time can encourage confidence in science in general (Druckman 2015; Jamieson and Hardy 2014).
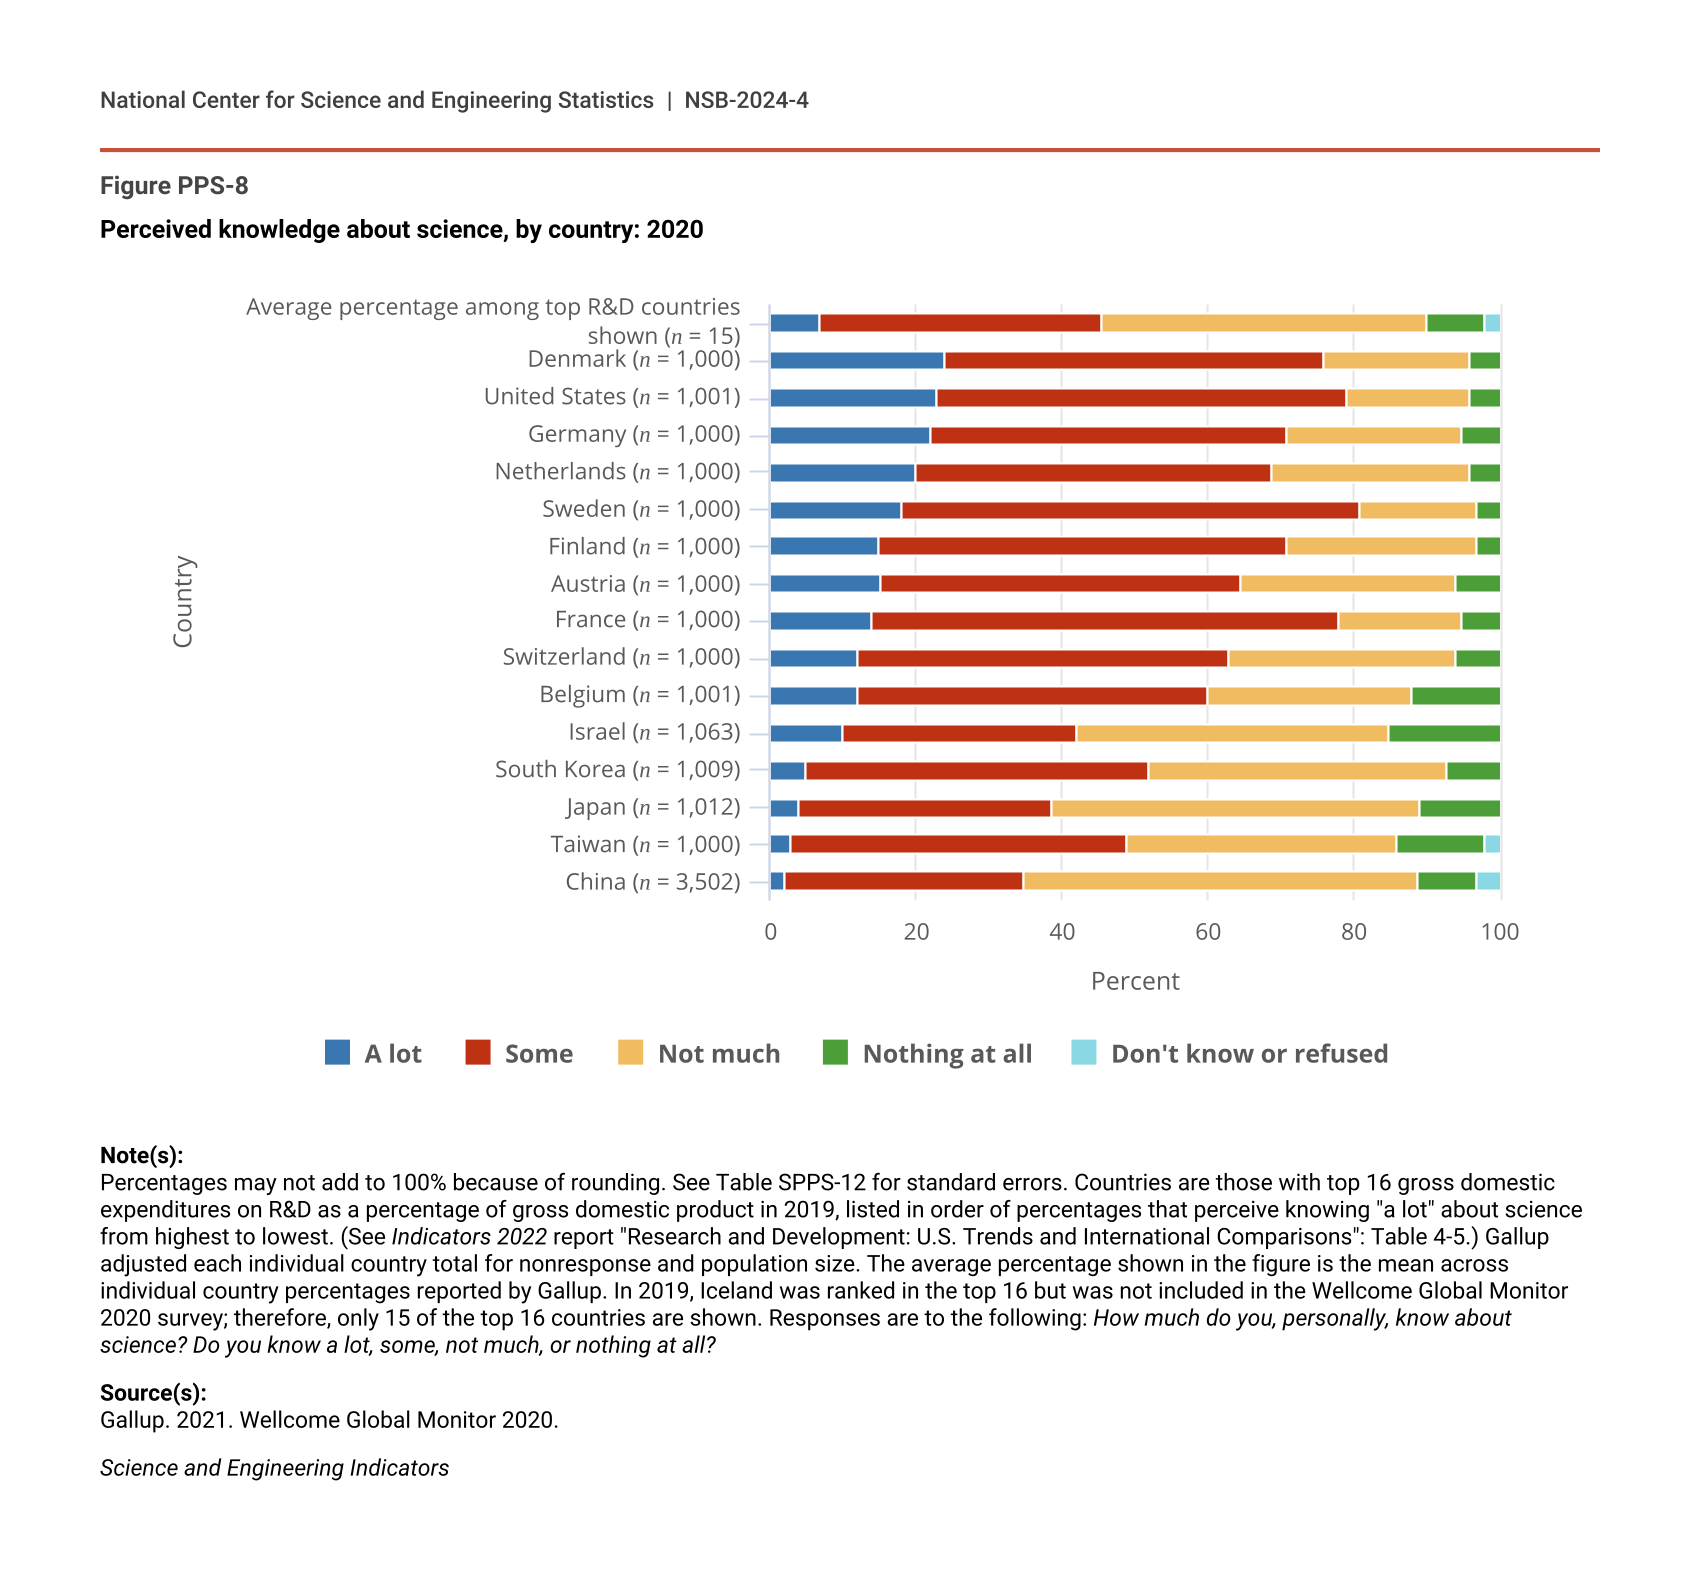
Many Americans report not having much scientific knowledge when asked for their subjective report of how much they know. Data from the 2020 Wellcome Global Monitor survey found that 23% of Americans surveyed believed they knew “a lot” about science (Figure PPS-8). This was, nonetheless, a higher percentage than was reported by citizens of the 15 other countries with the largest gross domestic expenditures on R&D as a percentage of their GDPs included in the report except Denmark, Germany, and the Netherlands, which were not statistically different in the percentage reported. On average, 7% of citizens across all 15 surveyed countries said they knew “a lot” about science.
Perceived knowledge about science, by country: 2020
| Country | A lot | Some | Not much | Nothing at all | Don't know or refused |
|---|---|---|---|---|---|
| Average percentage among top R&D countries shown (n = 15) | 7 | 39 | 45 | 8 | 2 |
| Denmark (n = 1,000) | 24 | 52 | 20 | 4 | 0 |
| United States (n = 1,001) | 23 | 57 | 17 | 4 | 0 |
| Germany (n = 1,000) | 22 | 49 | 24 | 5 | 0 |
| Netherlands (n = 1,000) | 20 | 49 | 27 | 4 | 0 |
| Sweden (n = 1,000) | 18 | 63 | 16 | 3 | 0 |
| Finland (n = 1,000) | 15 | 56 | 26 | 3 | 0 |
| Austria (n = 1,000) | 15 | 49 | 29 | 6 | 0 |
| France (n = 1,000) | 14 | 64 | 17 | 5 | 0 |
| Switzerland (n = 1,000) | 12 | 51 | 31 | 6 | 0 |
| Belgium (n = 1,001) | 12 | 48 | 28 | 12 | 0 |
| Israel (n = 1,063) | 10 | 32 | 43 | 15 | 0 |
| South Korea (n = 1,009) | 5 | 47 | 41 | 7 | 0 |
| Japan (n = 1,012) | 4 | 35 | 51 | 11 | 0 |
| Taiwan (n = 1,000) | 3 | 46 | 37 | 12 | 2 |
| China (n = 3,502) | 2 | 33 | 54 | 8 | 3 |
Note(s):
Percentages may not add to 100% because of rounding. See Table SPPS-12 for standard errors. Countries are those with top 16 gross domestic expenditures on R&D as a percentage of gross domestic product in 2019, listed in order of percentages that perceive knowing "a lot" about science from highest to lowest. (See Indicators 2022 report "Research and Development: U.S. Trends and International Comparisons": Table 4-5.) Gallup adjusted each individual country total for nonresponse and population size. The average percentage shown in the figure is the mean across individual country percentages reported by Gallup. In 2019, Iceland was ranked in the top 16 but was not included in the Wellcome Global Monitor 2020 survey; therefore, only 15 of the top 16 countries are shown. Responses are to the following: How much do you, personally, know about science? Do you know a lot, some, not much, or nothing at all?
Source(s):
Gallup. 2021. Wellcome Global Monitor 2020.
Science and Engineering Indicators
According to ATP data collected in November 2020 by the Pew Research Center, when asked which of a series of statements best describes the practice of science, a majority (66%) believed that the scientific method produces findings that are meant to be continually tested and updated over time, but a substantial minority of respondents (34%) believed that the process produces “unchanging core principles and truths” or was unsure (see Indicators 2022 report “Science and Technology: Public Perceptions, Awareness, and Information Sources”). These results suggest that most American adults understand the possibility of changes over time in the empirical evidence generated by scientific research, but a third of this population does not. At least some scientific knowledge reflects a relatively established body of evidence and does not change often, which some respondents might understand; nonetheless, the majority of respondents in the Pew Research Center study also reported that science can include new studies to test established ideas.
Additional evidence from the ATP reveals that a majority of U.S. adults have some substantive understanding of experimental logic; 60% of U.S. adults could correctly note that a control group can be useful in making sense of study results (see Indicators 2022 report “Science and Technology: Public Perceptions, Awareness, and Information Sources”). When asked, however, only half of U.S. adults (50%) could correctly identify a scientific hypothesis. Those results suggest that a sizable proportion of the U.S. adult population may not currently understand the scientific process of hypothesis testing in the same way that professional scientists working in scientific communities do.
U.S. adults’ understanding of scientific logic and of the effectiveness of the scientific method is positively related to their confidence in scientists to act in accordance with public interests, which is an indicator of trust. Trust comprises not only perceptions of competence but also perceptions of shared interest between parties (Southwell et al. 2019). The latest national evidence available to illustrate an association between individuals’ understanding of science as a process and their confidence in scientists is Pew Research Center data collected in November 2020. In those data, accurate understanding of the scientific process is positively associated with respondents’ expression of “a great deal” of confidence in scientists to act in the public’s best interests (Table PPS-3). For example, among those who accurately responded that assigning a control group to not receive medication would be a useful way to test whether a medication works, 44% also expressed a great deal of confidence in scientists to act in the best interests of the public. By comparison, a lower percentage (32%) of those who incorrectly did not report that a control group would be useful (meaning those who did not demonstrate understanding of experimental logic) expressed such confidence. In addition, approximately half (47%) of respondents who knew what a hypothesis is expressed a great deal of confidence in scientists, whereas 31% of those who did not demonstrate knowledge of what a hypothesis is expressed a great deal of confidence in scientists “to act in the best interests of the public” (Table PPS-3).
Confidence in scientists to act in the best interests of the public, by indicator of scientific method understanding: 2020
a Includes "not sure," incorrect responses, and refusals.
Note(s):
Percentages may not add to 100% because the nonresponse category for level of confidence is not shown. See Table SPPS-13 for standard errors. Responses are to the following: How much confidence, if any, do you have in [scientists] to act in the best interests of the public?
A scientist is conducting a study to determine how well a new medication treats ear infections. The scientist tells the participants to put 10 drops in their infected ear each day. After 2 weeks, all participants' ear infections had healed. Which of the following changes to the design of this study would most improve the ability to test if the new medication effectively treats ear infections? Create a second group of participants with ear infections who do not use any ear drops. Create a second group of participants with ear infections who use 15 drops a day. Have participants use ear drops for only 1 week. Have participants put ear drops in both their infected ear and healthy ear. Not sure.
The time a computer takes to start has increased dramatically. One possible explanation for this is that the computer is running out of memory. This explanation is a scientific… Hypothesis. Conclusion. Experiment. Observation. Not sure.
Source(s):
Pew Research Center, American Trends Panel Wave 79 (2020), conducted 18–29 November 2020.
Science and Engineering Indicators
Americans’ confidence in medical scientists was similar to confidence in scientists generally according to the November 2020 Pew Research Center data; those respondents who had a greater understanding of science as a process tended to have higher levels of confidence in scientists generally and in medical scientists (Table PPS-3, Table PPS-4). Among those who understood the value of a control group in a study, 43% also expressed a great deal of confidence in medical scientists; among those who did not acknowledge the value of a control group, only 35% expressed a great deal of confidence in medical scientists.
Confidence in medical scientists to act in the best interests of the public, by indicator of scientific method understanding: 2020
a Includes "not sure," incorrect responses, and refusals.
Note(s):
Percentages may not add to 100% because the nonresponse category for level of confidence is not shown. See Table SPPS-14 for standard errors. Responses are to the following: How much confidence, if any, do you have in [medical scientists] to act in the best interests of the public?
A scientist is conducting a study to determine how well a new medication treats ear infections. The scientist tells the participants to put 10 drops in their infected ear each day. After 2 weeks, all participants' ear infections had healed. Which of the following changes to the design of this study would most improve the ability to test if the new medication effectively treats ear infections? Create a second group of participants with ear infections who do not use any ear drops. Create a second group of participants with ear infections who use 15 drops a day. Have participants use ear drops for only 1 week. Have participants put ear drops in both their infected ear and healthy ear. Not sure.
The time a computer takes to start has increased dramatically. One possible explanation for this is that the computer is running out of memory. This explanation is a scientific… Hypothesis. Conclusion. Experiment. Observation. Not sure.
Source(s):
Pew Research Center, American Trends Panel Wave 79 (2020), conducted 18–29 November 2020.
Science and Engineering Indicators