 An official website of the United States government
 Public Perceptions of Science and Technology
Public opinion on S&T includes beliefs about the general promise and benefits of scientific research for society. In addition, how people think about S&T is likely influenced by the extent to which U.S. adults are aware of specific topics addressed by scientific research and popular conceptualization of those topics. Examples of specific topics investigated by researchers in recent years that could influence future public opinion include artificial intelligence (AI), robotics, and automation technology; neurotechnology; climate change; and water contamination. Popular beliefs about STEM education in the United States also are relevant to discussion of the future of S&T in this country.
General Perceptions of S&T
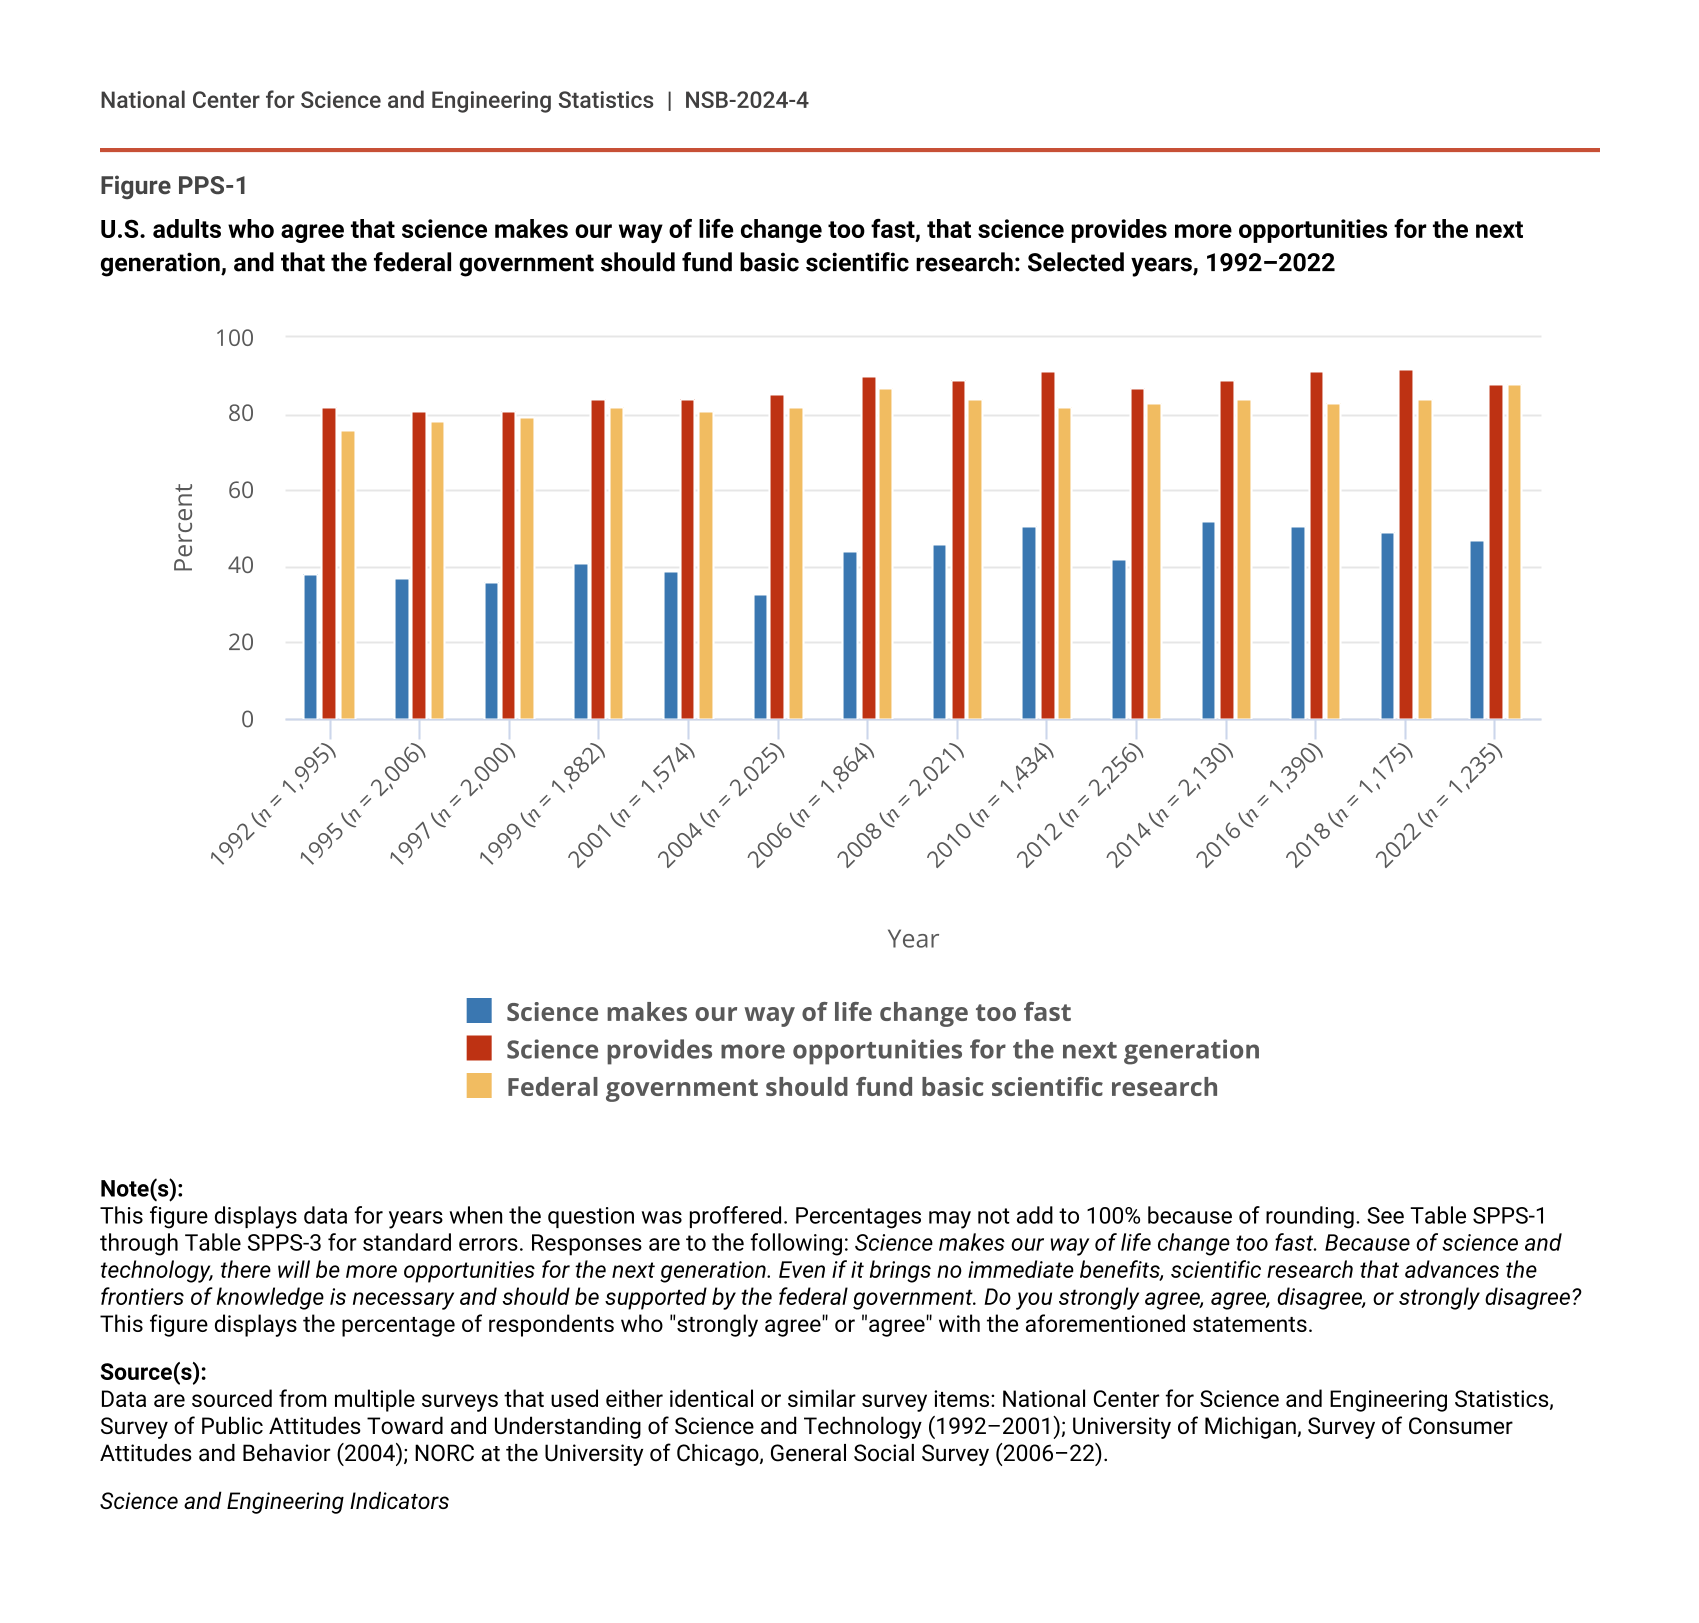
Americans’ support for S&T as a general enterprise has been consistently positive for at least four decades. Since the late 1970s, the General Social Survey (GSS)—a nationally representative survey of adults in the United States—has assessed Americans’ perceptions of S&T (Smith et al. 2012–18). From 1979 to 2018, the GSS found a clear majority of American adults agreed that the benefits of scientific research strongly or slightly outweigh the harmful results (see Indicators 2022 report “Science and Technology: Public Perceptions, Awareness, and Information Sources”). From 1992 to 2022, the GSS also found that most Americans surveyed believed that there would be more opportunities “for the next generation” because of S&T and that they supported federal funding for basic scientific research, even when they did not expect that research to produce immediate benefits (Figure PPS-1). In 2022, 88% of U.S. adults agreed that scientific research that advances the frontiers of knowledge is necessary and deserves federal government support.
U.S. adults who agree that science makes our way of life change too fast, that science provides more opportunities for the next generation, and that the federal government should fund basic scientific research: Selected years, 1992–2022
| Year | Science makes our way of life change too fast | Science provides more opportunities for the next generation | Federal government should fund basic scientific research |
|---|---|---|---|
| 1992 (n = 1,995) | 38 | 82 | 76 |
| 1995 (n = 2,006) | 37 | 81 | 78 |
| 1997 (n = 2,000) | 36 | 81 | 79 |
| 1999 (n = 1,882) | 41 | 84 | 82 |
| 2001 (n = 1,574) | 39 | 84 | 81 |
| 2004 (n = 2,025) | 33 | 85 | 82 |
| 2006 (n = 1,864) | 44 | 90 | 87 |
| 2008 (n = 2,021) | 46 | 89 | 84 |
| 2010 (n = 1,434) | 51 | 91 | 82 |
| 2012 (n = 2,256) | 42 | 87 | 83 |
| 2014 (n = 2,130) | 52 | 89 | 84 |
| 2016 (n = 1,390) | 51 | 91 | 83 |
| 2018 (n = 1,175) | 49 | 92 | 84 |
| 2022 (n = 1,235) | 47 | 88 | 88 |
Note(s):
This figure displays data for years when the question was proffered. Percentages may not add to 100% because of rounding. See Table SPPS-1 through Table SPPS-3 for standard errors. Responses are to the following: Science makes our way of life change too fast. Because of science and technology, there will be more opportunities for the next generation. Even if it brings no immediate benefits, scientific research that advances the frontiers of knowledge is necessary and should be supported by the federal government. Do you strongly agree, agree, disagree, or strongly disagree? This figure displays the percentage of respondents who "strongly agree" or "agree" with the aforementioned statements.
Source(s):
Data are sourced from multiple surveys that used either identical or similar survey items: National Center for Science and Engineering Statistics, Survey of Public Attitudes Toward and Understanding of Science and Technology (1992–2001); University of Michigan, Survey of Consumer Attitudes and Behavior (2004); NORC at the University of Chicago, General Social Survey (2006–22).
Science and Engineering Indicators
One exception to Americans’ tendency to support S&T has been the perception that science makes life change too fast. In the last decade, Americans have been almost evenly split about the view that science has such a downside (Figure PPS-1). Since 2014, the GSS found that roughly half of respondents agreed or strongly agreed that “science makes our way of life change too fast,” moving up from an average of 41% from 1995 to 2012 to an average of 50% from 2014 to 2022.
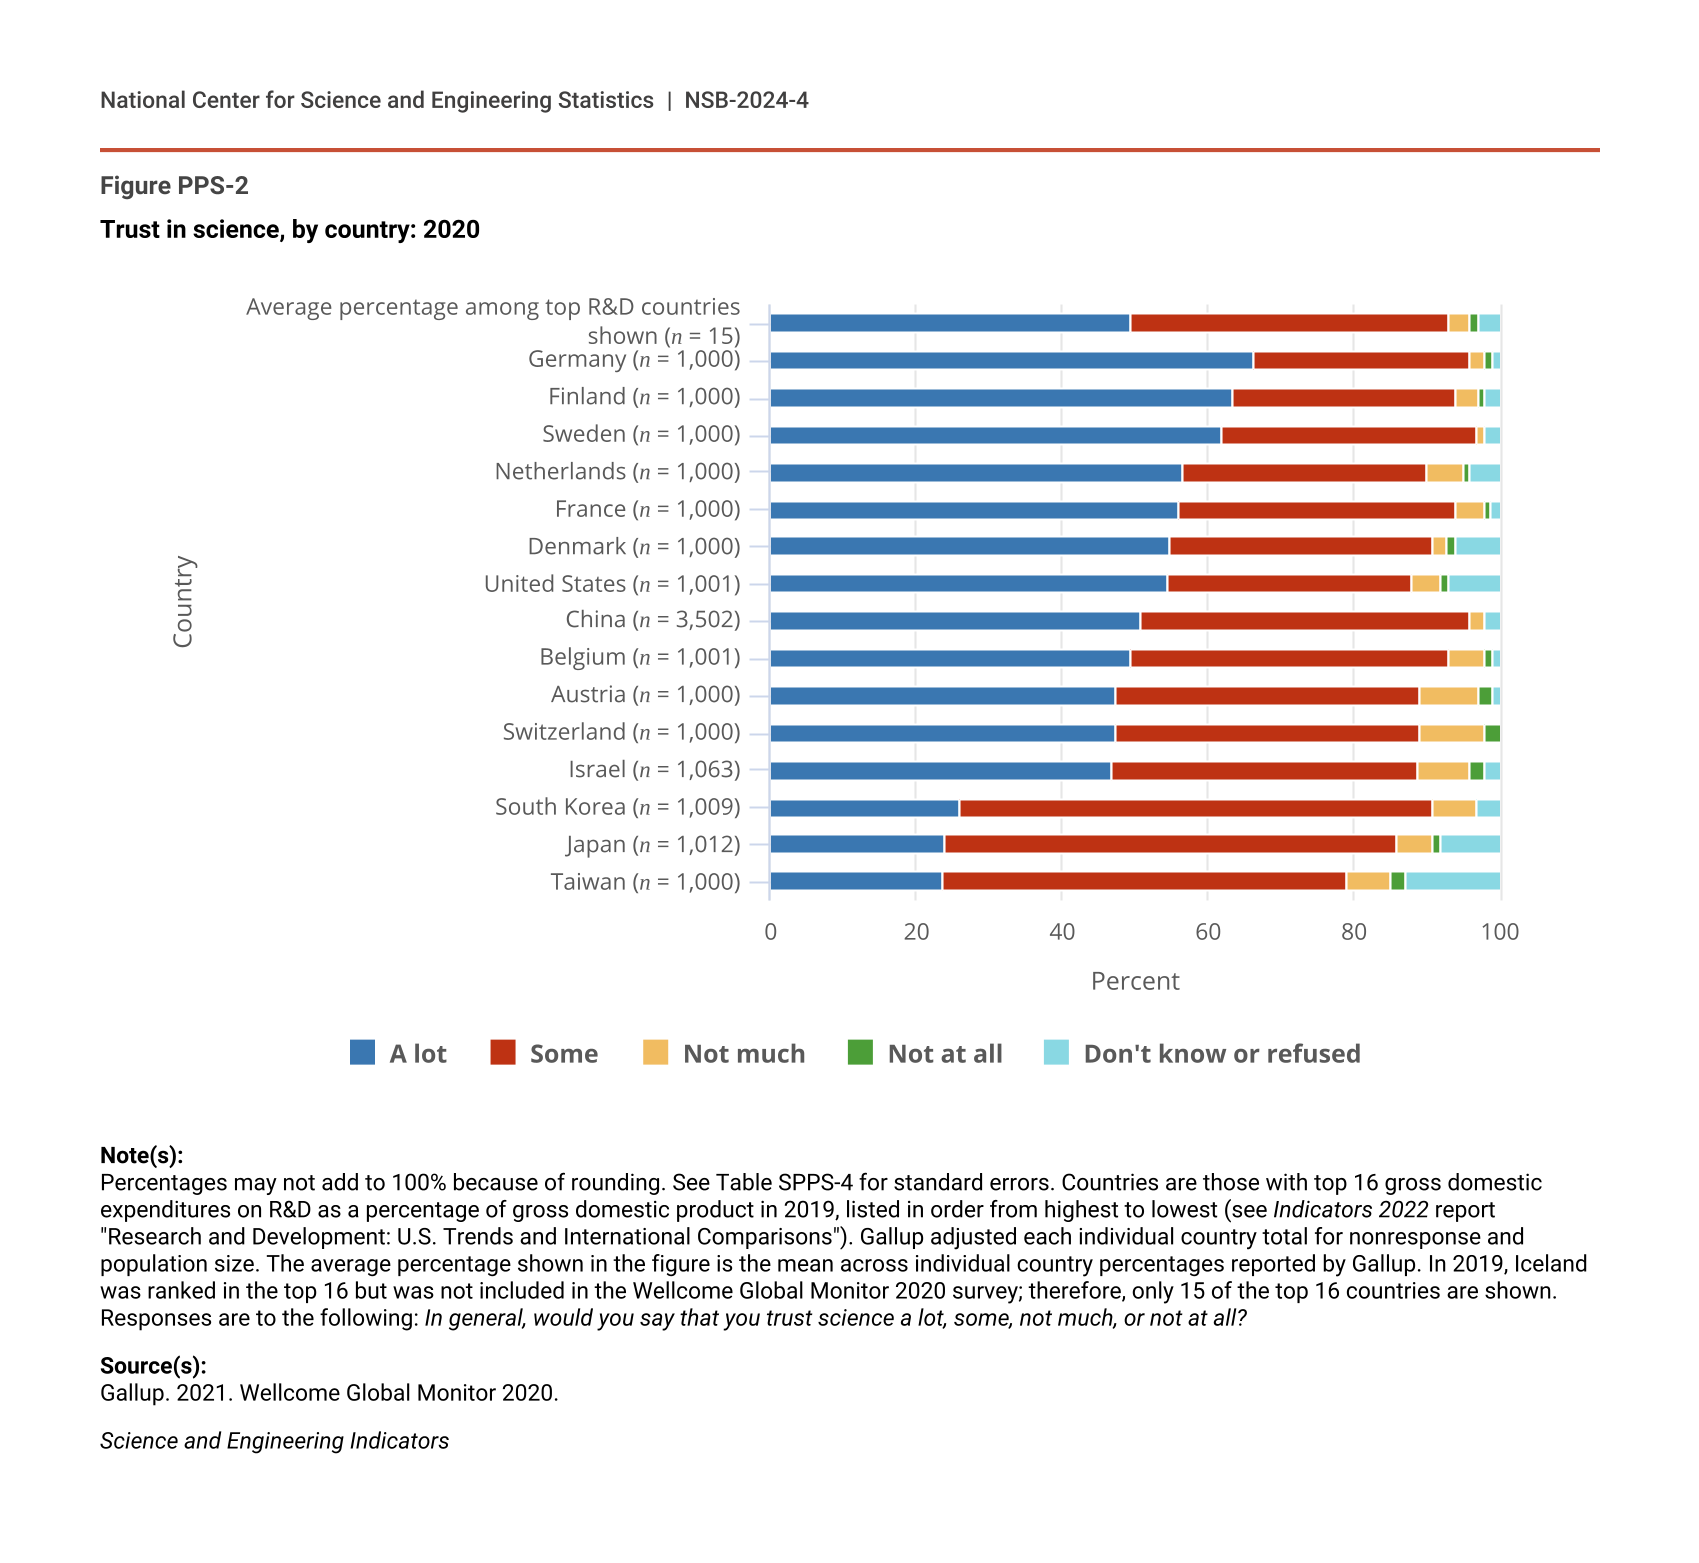
Americans also have tended to report that they trust science, a stance similar to that of residents of the other countries that spend the most on S&T R&D compared with the rest of the world. According to the Wellcome Global Monitor 2020 survey (Gallup 2021a)—the world’s largest study on how people around the world think and feel about science and major health challenges—a majority of Americans surveyed (88%) reported that they trust science “some” or “a lot” (Figure PPS-2). This widespread prevalence of trust was largely consistent with the views of citizens in other countries that, like the United States, have invested substantially in R&D. Overall, 94% of adults in the top 15 countries included in the Wellcome Global Monitor with the largest gross domestic expenditures on R&D as a percentage of 2019 gross domestic product (GDP) reported trusting science “some” or “a lot” (Figure PPS-2).
Trust in science, by country: 2020
| Country | A lot | Some | Not much | Not at all | Don't know or refused |
|---|---|---|---|---|---|
| Average percentage among top R&D countries shown (n = 15) | 50 | 44 | 3 | 1 | 3 |
| Germany (n = 1,000) | 67 | 30 | 2 | 1 | 1 |
| Finland (n = 1,000) | 64 | 31 | 3 | 1 | 2 |
| Sweden (n = 1,000) | 62 | 35 | 1 | 0 | 2 |
| Netherlands (n = 1,000) | 57 | 34 | 5 | 1 | 4 |
| France (n = 1,000) | 56 | 38 | 4 | 1 | 1 |
| Denmark (n = 1,000) | 55 | 36 | 2 | 1 | 6 |
| United States (n = 1,001) | 55 | 34 | 4 | 1 | 7 |
| China (n = 3,502) | 51 | 45 | 2 | 0 | 2 |
| Belgium (n = 1,001) | 50 | 44 | 5 | 1 | 1 |
| Austria (n = 1,000) | 48 | 42 | 8 | 2 | 1 |
| Switzerland (n = 1,000) | 48 | 42 | 9 | 2 | 0 |
| Israel (n = 1,063) | 47 | 42 | 7 | 2 | 2 |
| South Korea (n = 1,009) | 26 | 65 | 6 | 0 | 3 |
| Japan (n = 1,012) | 24 | 62 | 5 | 1 | 8 |
| Taiwan (n = 1,000) | 24 | 56 | 6 | 2 | 13 |
Note(s):
Percentages may not add to 100% because of rounding. See Table SPPS-4 for standard errors. Countries are those with top 16 gross domestic expenditures on R&D as a percentage of gross domestic product in 2019, listed in order from highest to lowest (see Indicators 2022 report "Research and Development: U.S. Trends and International Comparisons"). Gallup adjusted each individual country total for nonresponse and population size. The average percentage shown in the figure is the mean across individual country percentages reported by Gallup. In 2019, Iceland was ranked in the top 16 but was not included in the Wellcome Global Monitor 2020 survey; therefore, only 15 of the top 16 countries are shown. Responses are to the following: In general, would you say that you trust science a lot, some, not much, or not at all?
Source(s):
Gallup. 2021. Wellcome Global Monitor 2020.
Science and Engineering Indicators
Despite Americans’ general endorsement of science and the stability of their general perceptions of science over time, there are some notable differences in confidence in S&T between some groups. One source of those variations is the extent to which people understand how scientists conduct research and use the logic of science to generate evidence. This issue will be explored later in this report; see section Public Familiarity with Science and Technology Research Processes.
Perceptions of Scientists
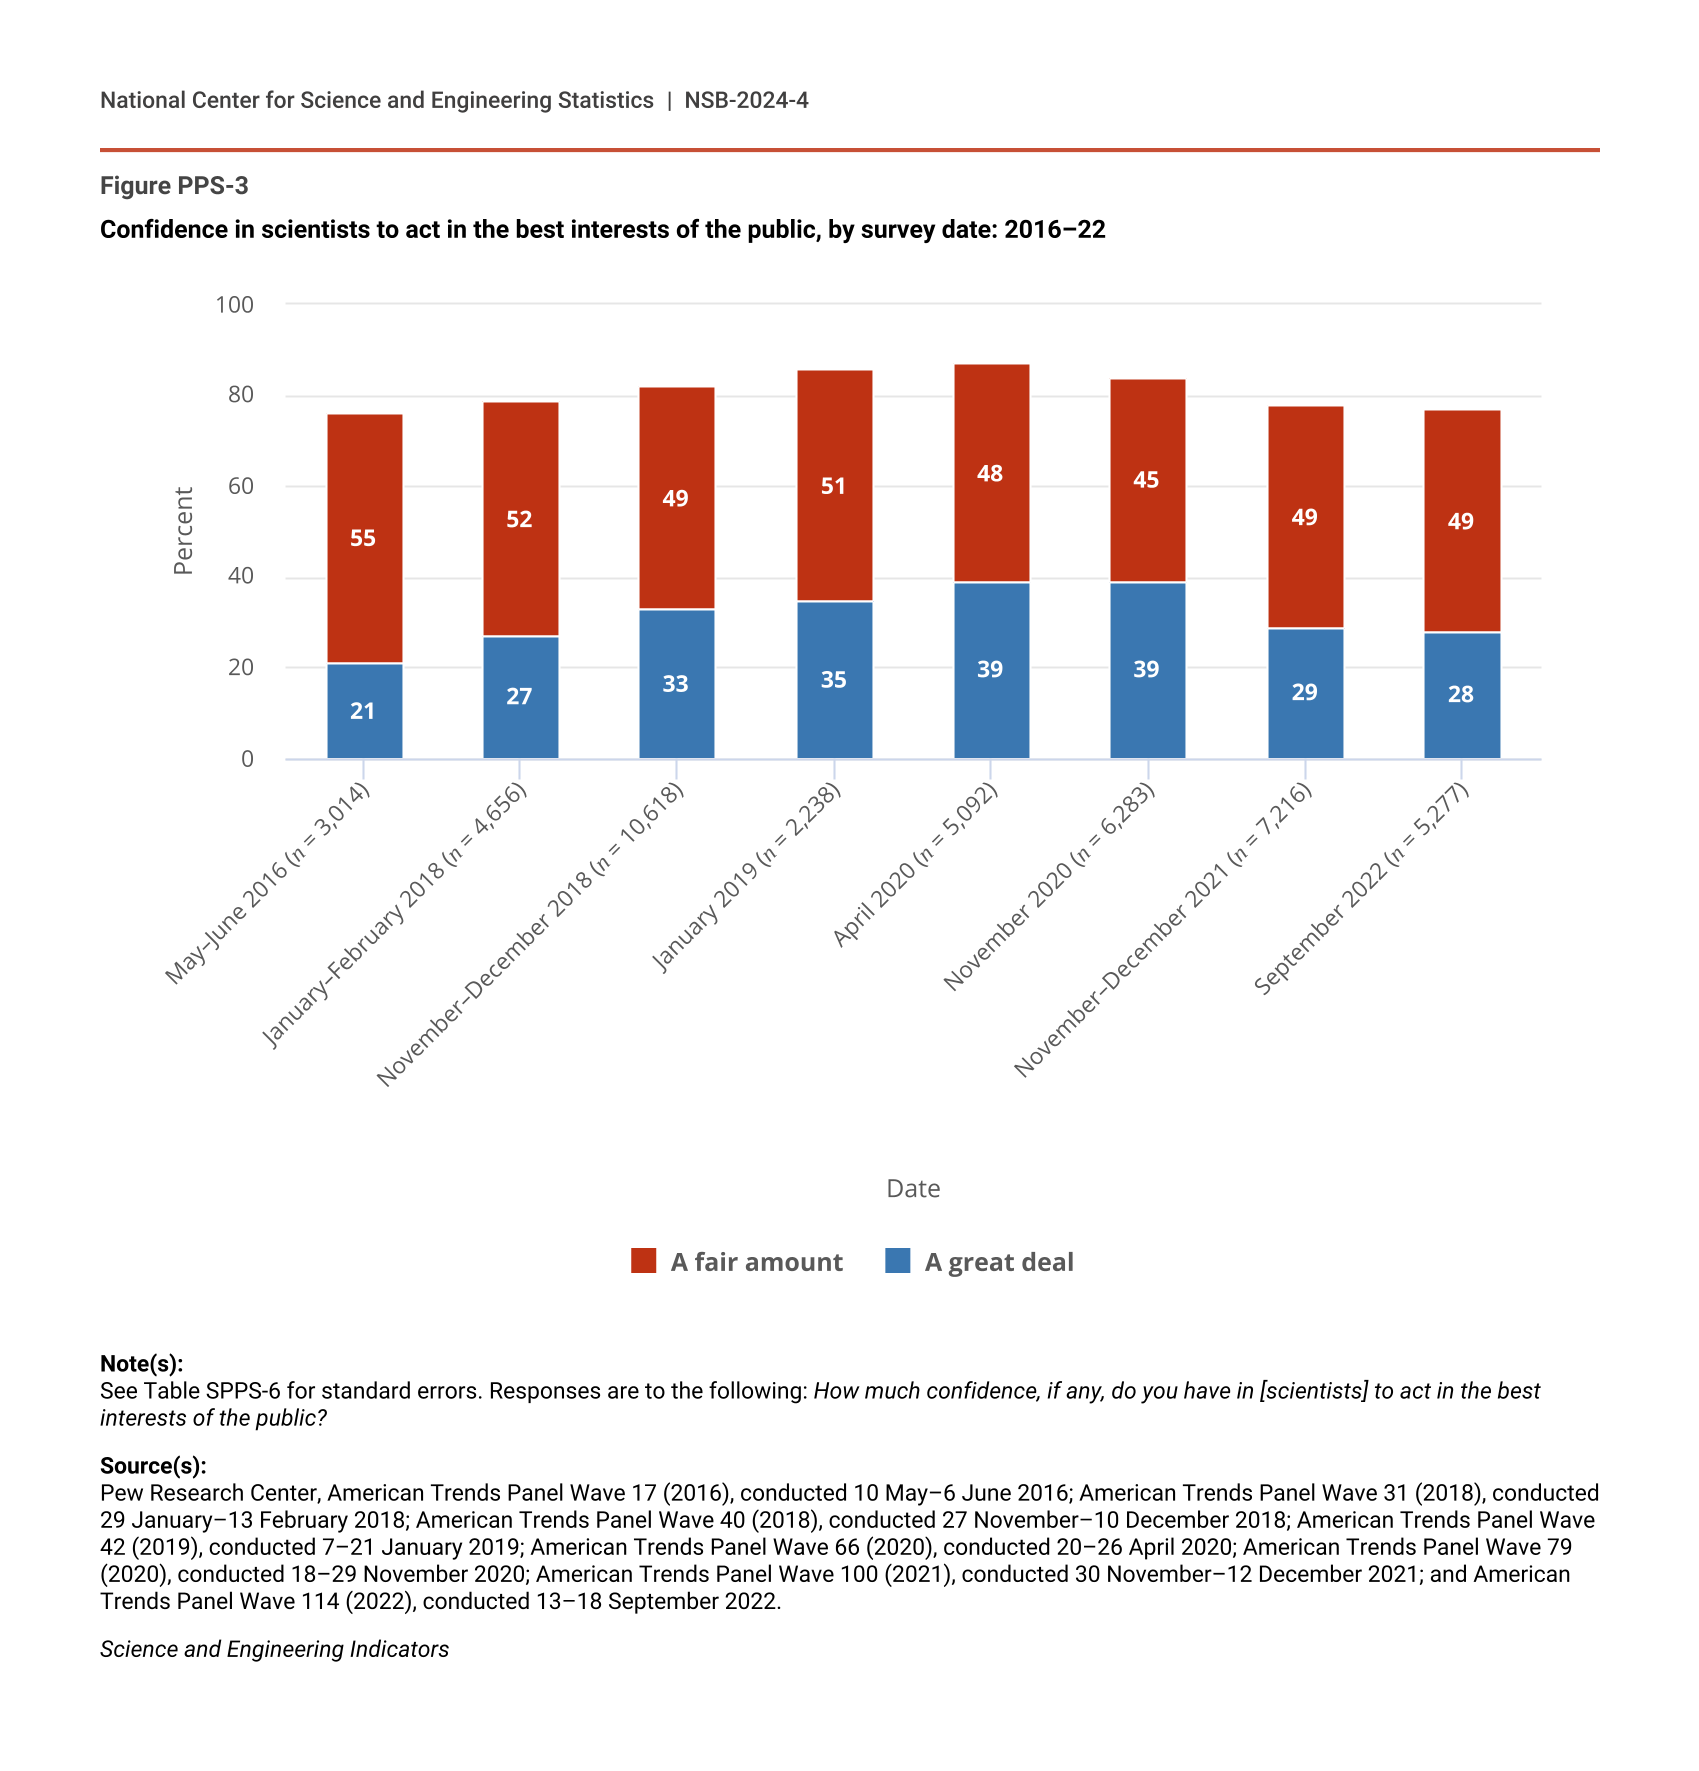
Since the 1980s, Americans’ confidence in scientists has been high relative to their confidence in other professionals (Krause et al. 2019). From 1985 to 2022, most Americans were confident that scientists act in the best interests of society (Figure PPS-3; Table PPS-1; also see Indicators 2022 report “Science and Technology: Public Perceptions, Awareness, and Information Sources”: Figure PPS-4). Over that period, for example, several surveys, including the GSS, asked respondents the extent to which they agreed that scientists are dedicated people who work for the good of humanity, help to solve challenging problems, and work to make life better for the average person. A consistently high percentage of Americans agreed with those statements in every GSS during that period, although there has been some fluctuation. For example, the percentage of Americans who believe scientists work to make life better for the average person ranged from 80% in 1985 to 89% in 2018. The tendency of Americans to express confidence in scientists and scientific institutions is notable, given that some recent headlines have implied a decline in Americans’ levels of trust or even implied widespread mistrust—without accompanying evidence—in scientists (Fearnow 2021; Piccone 2020).
Confidence in scientists to act in the best interests of the public, by survey date: 2016–22
| Date | A great deal | A fair amount |
|---|---|---|
| May–June 2016 (n = 3,014) | 21 | 55 |
| January–February 2018 (n = 4,656) | 27 | 52 |
| November–December 2018 (n = 10,618) | 33 | 49 |
| January 2019 (n = 2,238) | 35 | 51 |
| April 2020 (n = 5,092) | 39 | 48 |
| November 2020 (n = 6,283) | 39 | 45 |
| November–December 2021 (n = 7,216) | 29 | 49 |
| September 2022 (n = 5,277) | 28 | 49 |
Note(s):
See Table SPPS-6 for standard errors. Responses are to the following: How much confidence, if any, do you have in [scientists] to act in the best interests of the public?
Source(s):
Pew Research Center, American Trends Panel Wave 17 (2016), conducted 10 May–6 June 2016; American Trends Panel Wave 31 (2018), conducted 29 January–13 February 2018; American Trends Panel Wave 40 (2018), conducted 27 November–10 December 2018; American Trends Panel Wave 42 (2019), conducted 7–21 January 2019; American Trends Panel Wave 66 (2020), conducted 20–26 April 2020; American Trends Panel Wave 79 (2020), conducted 18–29 November 2020; American Trends Panel Wave 100 (2021), conducted 30 November–12 December 2021; and American Trends Panel Wave 114 (2022), conducted 13–18 September 2022.
Science and Engineering Indicators
Confidence in scientists to act in the best interests of the public, by demographic characteristics: 2022
a Income tiers are based on 2021 family incomes that have been adjusted for household size and cost of living in respondents' geographic region. Middle income includes respondents whose family incomes are between two-thirds of and double the median-adjusted family income among the panel of respondents. For a three-person household, upper income is approximately $131,500 and above, middle income is from $43,800 to $131,500, and lower income is less than $43,800.
Note(s):
Percentages may not add to 100% because the nonresponse category for level of confidence is not shown. See Table SPPS-7 for standard errors. Responses are to the following: How much confidence, if any, do you have in [scientists] to act in the best interests of the public?
Source(s):
Pew Research Center, American Trends Panel Wave 114 (2022), conducted 13–28 September 2022.
Science and Engineering Indicators
Recent historical events such as the COVID-19 pandemic have not dramatically dampened the general tendency of Americans to trust scientists. The onset of the COVID-19 pandemic did not immediately coincide with a decline in U.S. adults’ confidence in either scientists in general or medical scientists in April and May 2020 (Funk, Kennedy, and Johnson 2020). The broader empirical picture of Americans’ confidence in scientists in general since 2016 includes a continuous pattern of high confidence levels, with the majority of U.S. adults expressing confidence in scientists at multiple points, as well as a brief uptick in 2019 and 2020 and a regression to 2016 confidence levels by late 2021 (Figure PPS-3). As recently as September 2022, a clear majority of U.S. adults expressed at least a fair amount of confidence in scientists to act in the best interests of the public (Figure PPS-3), as has been the case for decades. The percentage of U.S. adults expressing a great deal of confidence in scientists in general rose to 39% in April 2020 and remained at 39% in November 2020 before declining to 28% by September 2022.
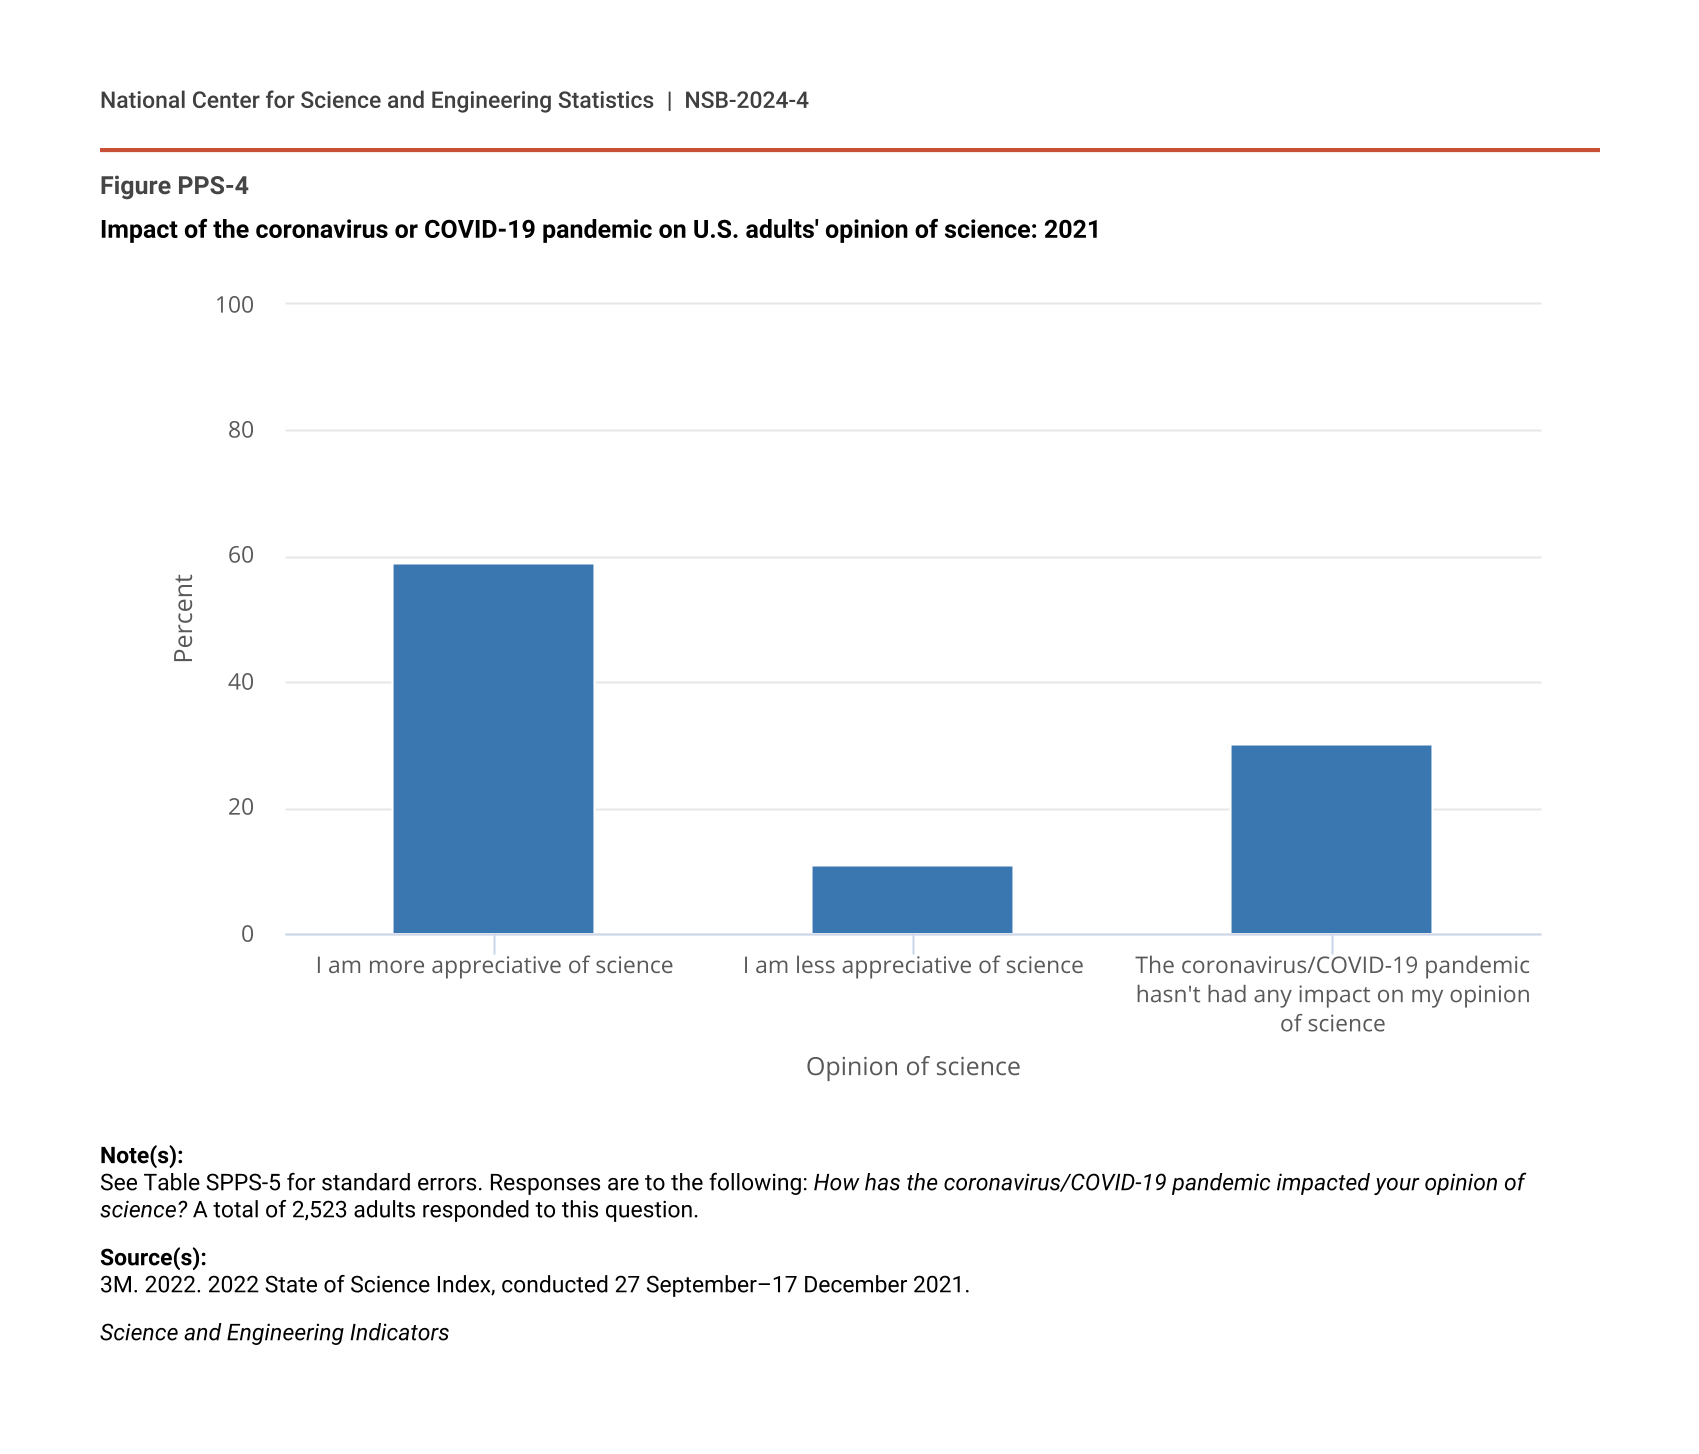
Data collected for the 2021 3M State of Science Index survey highlight the tendency of U.S. adults to believe their appreciation for science increased following the 2020 onset of the COVID-19 pandemic (3M 2020). A majority of Americans (59%) reported growing more appreciative of science in light of the COVID-19 pandemic according to data collected from September through December 2021 (Figure PPS-4). Such appreciation likely reflected at least in part the public salience of scientific research during the first year of the pandemic.
Impact of the coronavirus or COVID-19 pandemic on U.S. adults' opinion of science: 2021
| Opinion of science | All adults (n = 2,523) |
|---|---|
| I am more appreciative of science | 59 |
| I am less appreciative of science | 11 |
| The coronavirus/COVID-19 pandemic hasn't had any impact on my opinion of science | 30 |
Note(s):
See Table SPPS-5 for standard errors. Responses are to the following: How has the coronavirus/COVID-19 pandemic impacted your opinion of science? A total of 2,523 adults responded to this question.
Source(s):
3M. 2022. 2022 State of Science Index, conducted 27 September–17 December 2021.
Science and Engineering Indicators
Although confidence in scientists has remained high at a population level for decades, Americans are not uniform in their expressed confidence. According to September 2022 data from the Pew Research Center’s American Trends Panel (ATP), confidence in scientists in general differed by education and income (Table PPS-1). For example, 42% of U.S. adults with a postgraduate degree expressed a great deal of confidence in scientists, whereas 21% of U.S. adults with a high school diploma or less did. Income also predicted confidence in scientists to act in the best interests of society: 37% of U.S. adults in the highest of three family income tiers in the survey expressed a great deal of confidence, whereas 25% of U.S. adults in the lowest family income tier expressed that same level of confidence. What accounts for the differences in confidence in scientists between adults with different education and income levels is an important empirical question. Factors such as race, ethnicity, and sex do not appear to account entirely for the confidence differences between socioeconomic groups, because the 2022 ATP data demonstrate no differences in confidence in scientists as a function of respondent race based on measured categories and because any observed differences reflecting respondent sex and ethnicity were smaller than 10 percentage points (Table PPS-1). Later, this report assesses one factor that predicts confidence—namely, the extent to which people understand how scientific inquiry ideally occurs. (See section Public Familiarity with Science and Technology Research Processes.)
Perceptions of Engineers and Engineering
Social science researchers have limited evidence as to whether Americans draw distinction between scientists and engineers. Some experimental evidence comparing survey respondents’ answers with questions about scientists and engineers suggests that Americans tend not to differentiate between scientists and engineers in terms of their value to society, including 2012 GSS data (see Indicators 2020 report “Science and Technology: Public Attitudes, Knowledge, and Interest”). According to a 2013 Pew Research Center study, U.S. adults respect the work of engineers in a similar manner as they respect the work of medical doctors and scientists. The majority of U.S. adults in that study reported holding medical doctors, scientists, and engineers in roughly equal regard (Pew Research Center 2013). (Whether U.S. adults draw distinctions within topical domains, such as distinguishing between medical practitioners who see patients and medical researchers, is unclear.) Among American adults, 63% believed engineers contribute a lot to societal well-being, 65% believed scientists contribute a lot to societal well-being, and 66% believed medical doctors do so. Those positive perceptions of engineering generally align with earlier survey research commissioned for the National Academy of Engineering (NAE 2008).
Perceptions of Specific S&T Topics
Although Americans have tended to broadly support S&T, they sometimes express concerns about specific topics that arise with the publication of new research and the introduction of new technologies. As described in this section, recent peer-reviewed literature highlights evidence on public perceptions of research on a variety of topics, including conceptualizations of AI, robotics, and automation technology; neurotechnology; perceptions of climate change and climate change research; perceptions of water contamination; and beliefs about STEM education. Past public perception research has involved a range of topics about which popular conceptualization has changed over time, such as biotechnology (Bauer 2005). This report includes example topics that have been prominent recently in public discussions and for which available data may be relevant to evaluating Americans’ trust in scientific institutions, understanding of scientific processes, or exposure to scientific activities.
Artificial Intelligence, Robotics, and Automation Technology
Public understanding of what constitutes AI and how to evaluate such technology has evolved. Even prior to recent news coverage of technologies such as content generation applications, AI became a relatively prominent topic in public discussions about science in recent decades compared with previous discourse. Fast and Horvitz (2017) studied 30 years of New York Times references to AI—between 1986 and 2016—and found that mentions of AI, including references both to optimism and concerns about ethics and loss of control, began increasing in 2009. The emergence of new AI developments since 2022 (e.g., refinement of large language model applications) has inspired new survey research (Vogels 2023), although the pace of prominent news coverage has yet to be matched by extensive social science survey research specifically focused on AI technology released since 2022. At the same time, a body of existing survey evidence suggests uncertainty and variation among Americans in their perceptions of AI, robotics, and automation technology, which helps to forecast U.S. adults’ perceptions in the near future.
Data from 3M’s 2020 State of Science Index survey suggested some uncertainty among Americans over the definition of AI. When Americans were asked how much they know about AI in 2020, 22% reported knowing “nothing” about AI, 17% reported that they know “a lot,” and 62% reported knowing “some” (3M 2020). Americans also recently have varied in their familiarity with different applications of AI. In December 2022, the Pew Research Center asked U.S. respondents about the extent to which they have heard or read about tasks that AI technologies could perform, including prediction of extreme weather events, skin cancer detection, and writing news stories. According to results, 46% of U.S. adults had encountered information about AI being used to aid weather prediction, 22% were aware of information about the use of AI for skin cancer detection, and 33% had heard or read information about AI being employed to write news articles (Funk, Tyson, and Kennedy 2023).
Public understanding of AI, robotics, and automation technology also may change in coming years if patterns of public perceptions predict future tendencies. Evidence suggests, for example, that popular conceptions of automation technology and robotics change as more people have opportunities for direct experience with various automated applications. Tenhundfeld and colleagues (2019, 2020) found that participants’ willingness to rely on an automatic parking feature in an electric car varied as a function of how much experience they had with the technology. Over time, as they gained more experience with the feature, participants’ tendency to allow automation to control the car increased (measured as the lack of behavioral intervention to stop the automated system from operating) (Tenhundfeld et al. 2020).
In a different example, Sanders and colleagues (2017, 2019) investigated human perceptions of robots in terms of perceived trust and willingness to allow a robot to perform various tasks. One of these studies (Sanders et al. 2017) found that prior interaction with robots was positively associated with trust in them. Another study (Sanders et al. 2019) found that participants were more likely to choose a robot for a task that was relatively dangerous and was likely to result in death. Respondents were also more likely to choose humans to do mundane warehouse tasks, noting job and income considerations for human workers and the implications of robots replacing human workers.
In recent years, news outlets have highlighted AI technologies capable of generating content such as news stories and visual images in response to text prompts; for example, Knight (2022) reported on the topic. As noted earlier, the Pew Research Center surveyed Americans in 2022 regarding perceptions of those and other AI technologies. Results revealed a diverse range of perspectives regarding the perceived importance of various AI developments (Funk, Tyson, and Kennedy 2023). Among those who had encountered information about AI to write news articles, 16% viewed such technology as a major advance. Among those who had heard or read about AI to predict extreme weather, 50% saw such technology as a major advance. The perceived importance of AI technology developments may change over time as Americans become more familiar with various AI technologies. At the same time, the 2022 Pew Research Center data also are consistent with the hypothesis that Americans’ judgments about the importance and risks of technologies reflect perceptions of the implications of specific technologies for personal safety and well-being.
Popular imagination regarding AI beyond automated mechanical tasks and robotics is potentially fertile ground for future investigation; currently, however, much about human perceptions of AI remains undocumented. In March 2023, for example, the Pew Research Center surveyed U.S. adults about their awareness and use of ChatGPT, an open-access AI tool that relies on the use of a large language model to respond to user questions and requests for content. Among U.S. adults, 58% reported to have heard at least a little about the technology, but only 14% had used it to learn something new—and, among those who reported having used it, 66% reported it was only somewhat useful, not too useful, or not at all useful (Vogels 2023). That sense of utility may change as users spend more time with the technology or if more users try the technology.
Earlier survey research also has shown some ambivalence in public opinion about AI R&D. Analysis by Zhang and Dafoe (2019) of a public opinion poll of 2,000 adults (ages 18 and older) found that a substantial number (nearly half) of Americans support further development of AI, defined in the survey as “computer systems that perform tasks or make decisions that usually require human intelligence” (Zhang and Dafoe 2019:5). This study is consistent with results from a Pew Research Center report (Johnson and Tyson 2020) in which roughly half of U.S. respondents said that the development of AI “has mostly been a good thing for society.” A related review of public opinion surveys between 2010 and 2022 suggested that U.S. adults tend to anticipate AI will facilitate future advances in medicine (Beets et al. 2023).
Existing evidence also suggests widespread ambivalence and lack of awareness of specific details regarding AI applications. More than a third of participants in the Zhang and Dafoe (2019) analysis, for example, neither supported nor opposed AI development (28%) or were unsure about what they thought of AI development (10%). What support for AI research existed among participants also appears to be conditional. The vast majority (82%) of those surveyed by Zhang and Dafoe believed robots or AI should be carefully managed. A review of over a decade of public opinion data on the use of AI in health care settings also suggested approximately half of U.S. adults are not aware of specific instances in which AI is applied in health care (Beets et al. 2023); in the 2020 Science Media and the Public study conducted by YouGov, for example, 48% of U.S. adults had little or no awareness of the use of AI to improve disease diagnosis efficiency. Taken together, current public perception research on AI suggests that many Americans lack awareness about AI or feel uncertain about it, yet they feel some conditional optimism about it as well. The vast majority of U.S. adults appear to have some concern about future technology management.
Neurotechnology
Neurotechnology refers to manufactured devices that can monitor human brain processes and provide feedback to people based on that monitoring. As Farahany (2023) has noted, consumer neurotechnology devices now include a wide range of tools that connect human brains to computers as well as algorithms that make it possible for computers to analyze and respond to data resulting from brain monitoring. Neurotechnological devices have been developed to treat conditions such as chronic pain, epilepsy, Parkinson’s disease, and depression as well as to assist individuals with disabilities (Sattler and Pietralla 2022). For example, brain-computer interfaces show promise in helping to rehabilitate patients with severe motor impairments, paralysis, and disabilities using wearable or implanted electrodes that harness brain activity to control external devices like wheelchairs and body prostheses (Chaudhary, Birbaumer, and Ramos-Murguialday 2016). Neurotechnology applications to generate feedback from consumers and enable consumer input and control of various interfaces also now exist (Farahany 2023). Neurotechnology development has attracted industry investment and has posed ethical challenges related to identity, privacy protection, data tracking, and rights to cognitive liberty and mental privacy (Farahany 2023; MacDuffie, Ransom, and Klein 2022).
Empirical evidence regarding public perceptions of neurotechnology is limited. Extant data also reflect changes over time in the physical nature of neurotechnology devices; this is important to note, given that developers appear likely to continue changing and improving such devices in coming years. In 2016, the Pew Research Center surveyed U.S. adults regarding biomedical technologies to enhance human abilities and found that 69% of adults reported they would be “very” or “somewhat” worried about brain chips. Moreover, 66% of adults said they would not want enhancements of their brains (Pew Research Center 2016). Similarly, the Pew Research Center reported in 2022 on another study of U.S. adults in which 78% of adults would not want a computer chip implanted in their brain for enhanced cognitive function and improved processing of information if it were available to them (Rainie et al. 2022). Table PPS-2 describes conditions in which respondents reported they would be comfortable with an implanted device. The majority (77%) of U.S. adults reported that they favored the proposed use of computer chip implants in the brain to allow increased movement for people who are paralyzed, for example, whereas a lower percentage (25%) favored the use of implanted chips to make it possible for thoughts in the brain to search content on the Internet without typing. Evidence specifically regarding implanted devices may not necessarily generalize to technologies that are not as physically invasive as implanted devices, however; Sattler and Pietralla (2022) surveyed German adults, for example, and found respondents tended to prefer noninvasive technologies over relatively invasive technologies.
Responses to proposed uses of computer chip implants in the brain: 2021
Note(s):
Percentages may not add to 100%. See Table SPPS-8 for standard errors. Responses are to the following: Computer chip implants in the brain could be used for a number of purposes. Would you favor or oppose the use of computer chips implants in the brain for each of the following purposes?
Source(s):
Pew Research Center, American Trends Panel Wave 99 (2021), conducted 1–7 November 2021.
Science and Engineering Indicators
At least some evidence also suggests that public acceptance of neurotechnology devices may be conditional on the perceived context and the purposes of use. In two waves of surveys in 2018 and 2019, MacDuffie, Ransom, and Klein (2022) asked a sample of U.S. general public respondents (n = 1,088) and a sample of industry representatives (n = 66) about perceptions of “neural devices” that read information from the brain or spinal cord. Most general public respondents (82%) agreed that the topic of user data privacy was important to them, yet only 47% of general public respondents agreed that they were confident neural devices will be designed with privacy in mind. (Among the small sample of industry representatives surveyed, 64% agreed that they were confident devices will be designed with privacy in mind.) In Germany, Sattler and Pietralla (2022) found that moral acceptability and willingness of devices depended on the perceived purposes of those devices. For example, respondents preferred the use of devices for treatment of medical conditions rather than individual human enhancement. Moreover, respondents were not uniform in their acceptance of neurotechnology devices; in the Sattler and Pietralla (2022) study, factors such as perceived stress, religiosity, and gender identity predicted potential user openness to such devices.
In the United States, public opinion research on the frontiers of noninvasive neurotechnology has been limited to date, with available survey data focused on perceptions of either specific technologies such as implanted chips or perceptions of general categories such as neural devices. Some evidence suggests widespread concern among American adults when asked about the use of neurotechnology, but it is currently unclear how well they understand the specific capabilities and planned future uses of such devices. The recent pace of neurotechnology development in various industries and the likely future iteration of device formats and purposes suggest a need for additional public opinion research to address whether such technology changes could be useful.
Climate Change
The percentage of Americans who have expressed concern about the rise in the Earth’s average temperature over time has increased in recent decades (see Indicators 2020 report “Science and Technology: Public Attitudes, Knowledge, and Interest”). U.S. adults’ beliefs about climate change S&T include both relatively broad support for including climate scientists in government policy deliberation as well as a common perception that climate scientists do not yet extensively understand climate change mitigation. An April 2021 Pew Research Center survey found that 54% of Americans agree that climate scientists should play a larger role in climate policy debates, although a smaller percentage (18%) agreed that climate scientists currently understand “very well” the best ways to mitigate climate change (Funk 2021). The belief that climate scientists do not extensively understand climate change mitigation possibilities, however, has not dampened support for mitigation strategy research, as illustrated by Pew Research Center data collected in May and June 2023. According to data from the 2023 survey, 67% of U.S. adults believe the United States should prioritize efforts to develop renewable energy sources, such as wind and solar, instead of expanding oil, coal, and natural gas production (Tyson, Funk, and Kennedy 2023). U.S. adults generally acknowledge the relevance of climate science research to societal decision-making even as more remains to be learned about climate change mitigation, and they express support for relevant renewable energy S&T development.
Recent research also offers insight on factors that can shape and influence perceptions of climate change concepts. The vocabulary that researchers use to describe concepts and the use (or absence) of specific examples may affect public understanding of climate change terminology. In a study of understanding of terms from the United Nations’ Intergovernmental Panel on Climate Change reports, for example, respondents expressed difficulty in understanding phrases such as carbon neutral (which refers to processes that result in no net addition of carbon dioxide to the atmosphere) or unprecedented transition—which, in turn, complicated their interpretation of report content (Bruine de Bruin et al. 2021). In addition, exposure to news stories can directly affect public opinion about climate change, both in terms of increasing the perceived general importance of the topic as well as issue-framing effects (Newman, Nisbet, and Nisbet 2018). News references to the credibility of science and scientific institutions can indirectly affect beliefs about the credibility of climate change research (Hmielowski et al. 2014).
Personal experience also may affect interpretation of climate change messages. The extent to which a person has thought about climate change previously also appears to limit possibilities for media content to affect beliefs about climate change (Wonneberger, Meijers, and Schuck 2020). Local weather experiences and natural disasters appear to shape individuals’ beliefs regarding whether climate change is occurring (Sloggy et al. 2021) as well as risk perceptions of climate change and preferences for government climate policy (Kim, Seo, and Sinclair 2021). Research indicates that perceptions of climate change and climate change research are functions of both existing beliefs and patterns in the information environment—suggesting the potential for change but also relative stability if consistent news coverage and online information about climate change slowly accumulate over time.
Water Contamination
Water is vital for human life (Jéquier and Constant 2010), and contaminant-free drinking water is important for human health. Although water quality in the United States generally has improved according to conventional metrics in recent decades, research has documented important threats to human health related to water contamination. Specifically, substances such as lead (GAO 2020) and human-made chemicals such as per- and polyfluoroalkyl substances (PFAS) (GAO 2021)—sometimes found in public drinking water systems, private wells, and various consumer products—can threaten water quality, as can harmful bacteria. News coverage in the past decade has spotlighted the discovery of toxins in drinking water in communities such as Flint, Michigan, and Jackson, Mississippi (Breslow 2022). Despite national news coverage and scientific inquiry regarding the prevalence and effects of contamination, available peer-reviewed literature lacks robust empirical evidence of the extent of public understanding of water contamination research, although recent research suggests the potential value of water research education for encouraging public cooperation with testing efforts (Gibson et al. 2022).
Water safety and quality have been topics featured in public discourse in the United States in recent years. Evidence suggests that water safety and quality topics have increased in prominence on social media platforms. For example, social media posts mentioning PFAS-related content increased on two platforms, Reddit and Twitter (known as X subsequent to this study), by more than sixfold (by 670%) from 2017 to 2019 (Tian et al. 2022), a pattern that study authors attribute in part to news coverage about PFAS exposure in the United States. Survey evidence also suggests that a substantial minority of Americans have harbored concerns about drinking water safety since at least 2018. A 2018 survey of more than 4,000 U.S. adults found that 15% did not believe their home tap water was safe to drink (Park et al. 2023).
Americans’ perceptions of home tap water safety vary by socioeconomic factors. In the Park et al. (2023) study, those with relatively less than a high school diploma were more likely to report concern about home tap water safety compared with those with a college degree, and people living in a household with $35,000 or less in annual income were more likely to report home tap water safety concerns than those with $100,000 or more in annual income. Among those with less than a high school diploma, 21% did not believe their home tap water was safe to drink.
May 2022 ATP data from the Pew Research Center underscore important differences between socioeconomic groups in the perceived quality of local community water (Figure PPS-5). Among Americans with a high school diploma or less, 19% viewed the safety of drinking water as “a big problem” in their local community; among college graduates, however, 12% of adults saw drinking water safety as “a big problem.” Similarly, among those in the lowest income tier of respondents (less than $43,800 annual household income), 25% saw drinking water quality as a big problem, while among those in the highest income bracket (with incomes above $131,500 annually), 8% viewed drinking water as a big problem in their local community. Such perception differences coincide with research on variation between neighborhoods in demonstrable exposure to some types of contaminants such as lead (Xue et al. 2022).
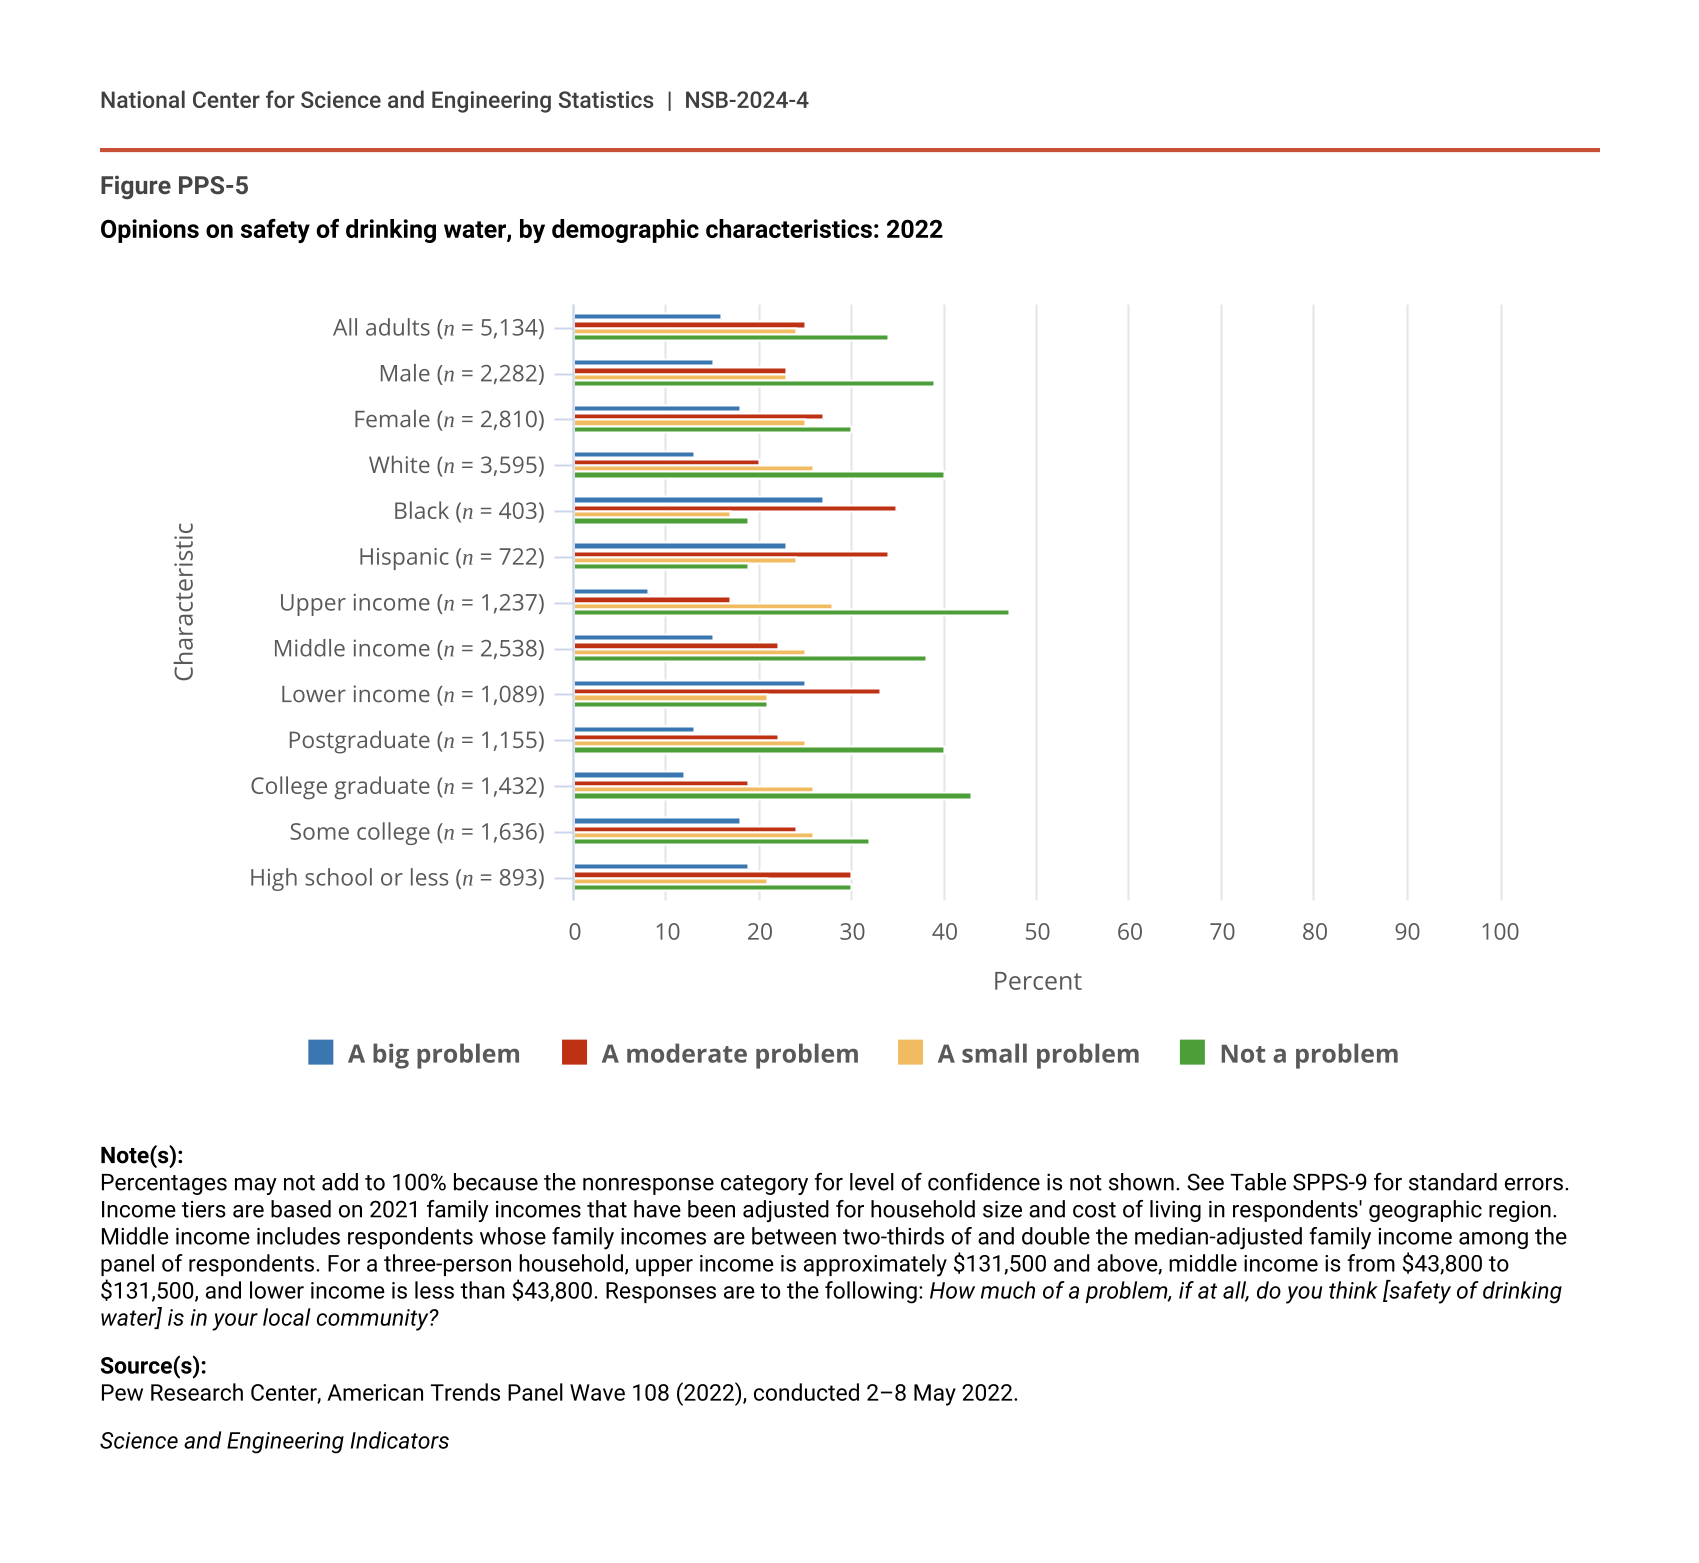
Opinions on safety of drinking water, by demographic characteristics: 2022
| Characteristic | A big problem | A moderate problem | A small problem | Not a problem |
|---|---|---|---|---|
| All adults (n = 5,134) | 16 | 25 | 24 | 34 |
| Male (n = 2,282) | 15 | 23 | 23 | 39 |
| Female (n = 2,810) | 18 | 27 | 25 | 30 |
| White (n = 3,595) | 13 | 20 | 26 | 40 |
| Black (n = 403) | 27 | 35 | 17 | 19 |
| Hispanic (n = 722) | 23 | 34 | 24 | 19 |
| Upper income (n = 1,237) | 8 | 17 | 28 | 47 |
| Middle income (n = 2,538) | 15 | 22 | 25 | 38 |
| Lower income (n = 1,089) | 25 | 33 | 21 | 21 |
| Postgraduate (n = 1,155) | 13 | 22 | 25 | 40 |
| College graduate (n = 1,432) | 12 | 19 | 26 | 43 |
| Some college (n = 1,636) | 18 | 24 | 26 | 32 |
| High school or less (n = 893) | 19 | 30 | 21 | 30 |
Note(s):
Percentages may not add to 100% because the nonresponse category for level of confidence is not shown. See Table SPPS-9 for standard errors. Income tiers are based on 2021 family incomes that have been adjusted for household size and cost of living in respondents' geographic region. Middle income includes respondents whose family incomes are between two-thirds of and double the median-adjusted family income among the panel of respondents. For a three-person household, upper income is approximately $131,500 and above, middle income is from $43,800 to $131,500, and lower income is less than $43,800. Responses are to the following: How much of a problem, if at all, do you think [safety of drinking water] is in your local community?
Source(s):
Pew Research Center, American Trends Panel Wave 108 (2022), conducted 2–8 May 2022.
Science and Engineering Indicators
Aside from evidence of general concerns about water quality, however, the extent to which American adults understand water contamination processes, water quality research, and potential remedies is not yet clear in available peer-reviewed literature. Some evidence suggests that educational information about certain aspects of water quality testing and research can motivate relevant water testing behavior. Experimental evidence from a study with North Carolina residents, for example, demonstrated that residents with a private well who were offered a free well test, along with information as to why such testing is important (e.g., because using one’s senses such as vision or taste alone can be insufficient to detect water problems), tended to opt for testing more than their counterparts (Gibson et al. 2022). Those offered a free test and information were more likely to opt for well testing than those in a control group, those who were offered a free well test without explanatory information, and those who were offered explanatory information without a free well test. Such responses to information about water quality testing may reflect the importance of addressing existing gaps in residents’ mental models of how water researchers conduct their work and what data water testing can produce (Gibson et al. 2022). Future research could investigate whether Americans understand that water safety research comprises different attributes of water quality: those that are apparent to human sensory perception and those that are invisible or not detectable by typical human senses alone.
STEM Education
Public perception of STEM education in K–12 U.S. public schools comprises a mix of fond recollection of science classes; concern about present investment in K–12 schools; and widespread judgment that the STEM education offered to elementary, middle, and high school students in the United States is worse than that offered in at least some other countries. A Pew Research Center survey (Funk and Parker 2018) found that 75% of U.S. adult respondents reported that they liked science courses during their time as K–12 students; 58% of adults reported liking their K–12 mathematics courses. When asked to choose whether they liked those courses because of the subject matter itself or because of the way the subject matter was taught, 68% of those who liked their science courses said the subject matter was the main reason they enjoyed those classes. Despite Americans’ fondness for their own STEM experiences, only 31% of U.S. respondents in October 2019 considered K–12 STEM education in the United States to be at least above average when compared with what is available in other nations (Figure PPS-6). Regarding undergraduate and graduate STEM education in the United States, about half of respondents (52%) thought STEM education in U.S. colleges and universities is above average or the best in the world compared with what is available in other countries. Future inquiry could explore the basis for such perceptions.
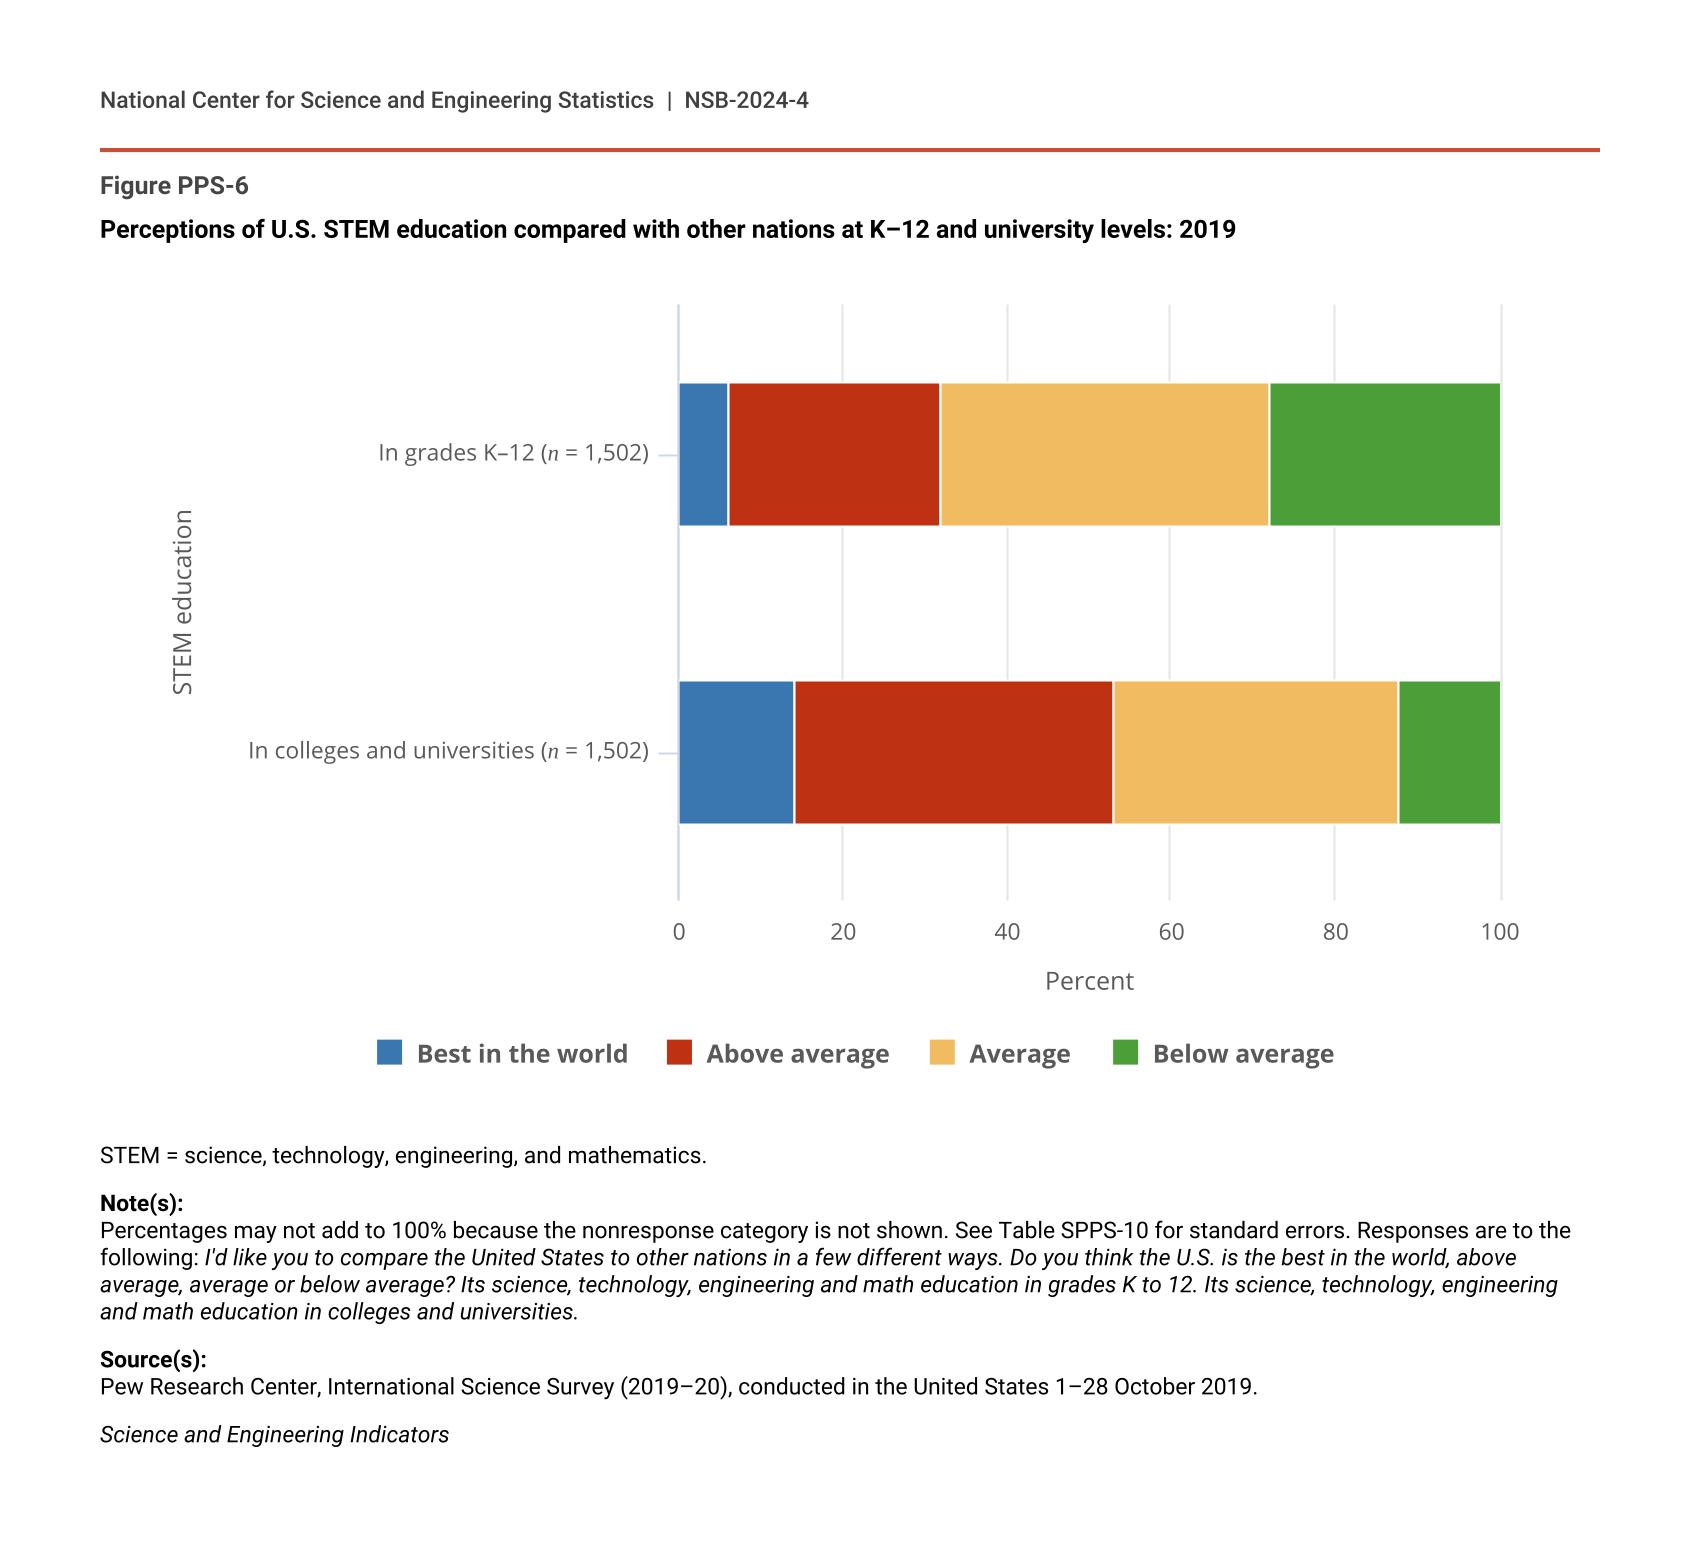
Perceptions of U.S. STEM education compared with other nations at K–12 and university levels: 2019
| STEM education | Best in the world | Above average | Average | Below average |
|---|---|---|---|---|
| In grades K–12 (n = 1,502) | 6 | 25 | 39 | 27 |
| In colleges and universities (n = 1,502) | 14 | 38 | 34 | 12 |
STEM = science, technology, engineering, and mathematics.
Note(s):
Percentages may not add to 100% because the nonresponse category is not shown. See Table SPPS-10 for standard errors. Responses are to the following: I'd like you to compare the United States to other nations in a few different ways. Do you think the U.S. is the best in the world, above average, average or below average? Its science, technology, engineering and math education in grades K to 12. Its science, technology, engineering and math education in colleges and universities.
Source(s):
Pew Research Center, International Science Survey (2019–20), conducted in the United States 1–28 October 2019.
Science and Engineering Indicators
Perceptions of STEM education quality among Americans appear to reflect concerns about resource availability more than reasons such as dismissive cultural beliefs. The 2022 3M State of Science Index survey asked U.S. respondents what barriers were most important in “standing in the way of students accessing a strong STEM education,” and the most common responses were a lack of STEM classes in school, the inability of students to pay for STEM education, and a lack of STEM teachers (Figure PPS-7). Although most Americans see value in STEM education, they typically do not see elementary, middle, and high school STEM education as the best in the world, and they are most likely to cite resource constraints as major barriers to access. Other Science and Engineering Indicators reports focus on institutional measures of STEM education quality in the United States (see Indicators 2024 reports “Elementary and Secondary STEM Education” and “Higher Education in Science and Engineering”).
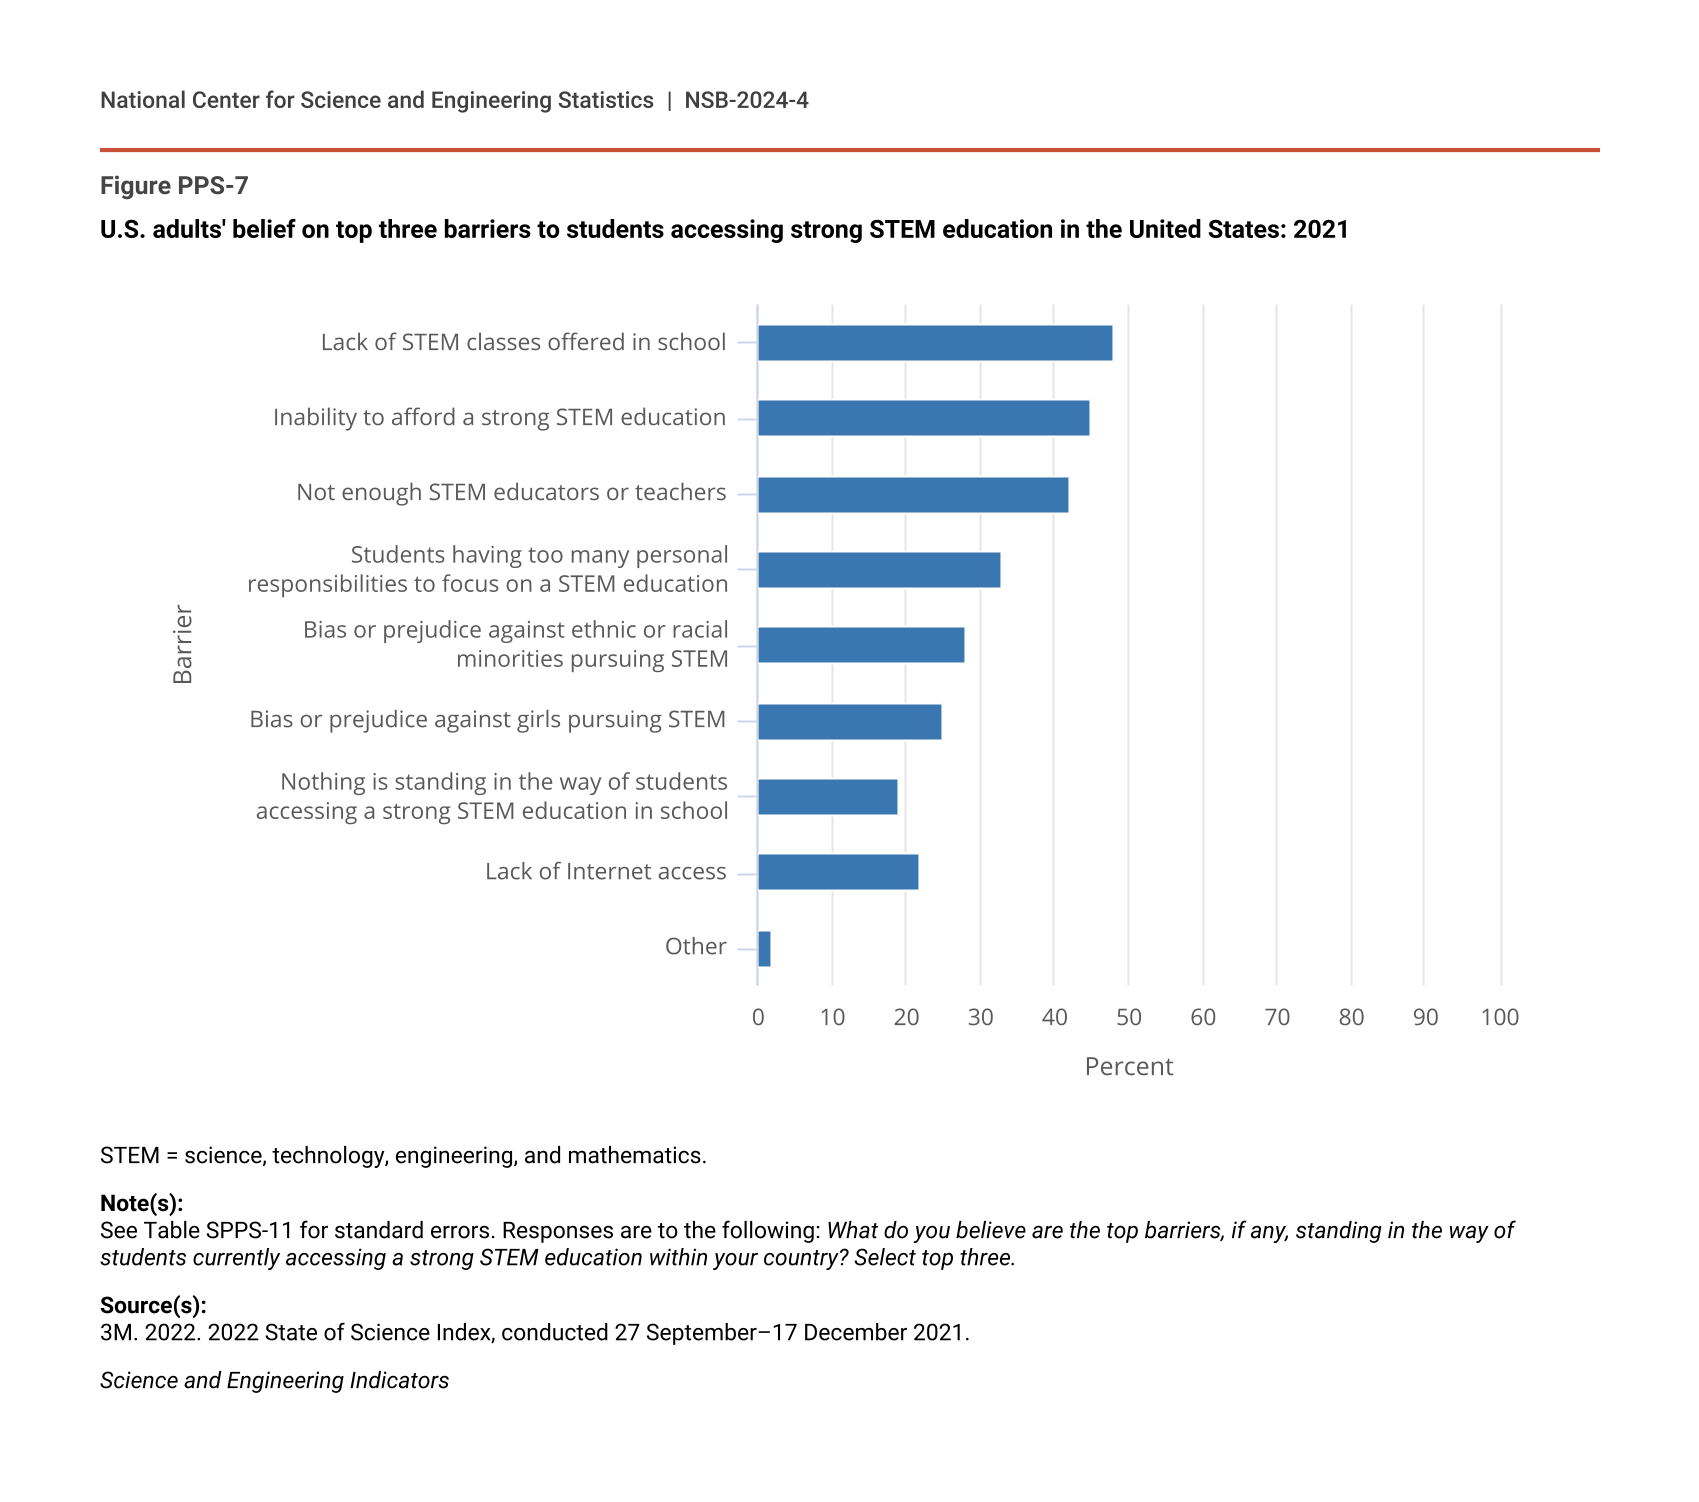
U.S. adults' belief on top three barriers to students accessing strong STEM education in the United States: 2021
| Barrier | All adults (n = 2,523) |
|---|---|
| Lack of STEM classes offered in school | 48 |
| Inability to afford a strong STEM education | 45 |
| Not enough STEM educators or teachers | 42 |
| Students having too many personal responsibilities to focus on a STEM education | 33 |
| Bias or prejudice against ethnic or racial minorities pursuing STEM | 28 |
| Bias or prejudice against girls pursuing STEM | 25 |
| Nothing is standing in the way of students accessing a strong STEM education in school | 19 |
| Lack of Internet access | 22 |
| Other | 2 |
STEM = science, technology, engineering, and mathematics.
Note(s):
See Table SPPS-11 for standard errors. Responses are to the following: What do you believe are the top barriers, if any, standing in the way of students currently accessing a strong STEM education within your country? Select top three.
Source(s):
3M. 2022. 2022 State of Science Index, conducted 27 September–17 December 2021.
Science and Engineering Indicators