 An official website of the United States government
 Information Sources and Involvement
Where and to what extent have Americans encountered information about science? To what extent do they seek information about science? Are U.S. adults involved in any informal activities (i.e., activities outside of a formal school setting) that could affect their understanding or perceptions of science? Recent data offer insights on these questions. (Related Indicators reports explore Americans’ formal STEM training through educational institutions; see Indicators 2024 reports “Elementary and Secondary STEM Education” and “Higher Education in Science and Engineering.”)
Sources of Information about Science
American adults tend to learn about science from general news sources rather than from specialized information sources dedicated to science (see Indicators 2022 report “Science and Technology: Public Perceptions, Awareness, and Information Sources”). Especially in the past decade, U.S. adults also have cited social media platforms as a source of information regarding topics such as COVID-19 (Mitchell et al. 2020). That pattern of attention to general news outlets or social media content, which are often unmoderated by a professional science editor, is notable because that content typically differs substantively from content offered by specialized science information venues. Scientists and professional scientific organizations do participate on social media platforms and share study results and insights on some topics. Nonetheless, specific details about study limitations that appear in an original, peer-reviewed article may not be reported in all related news coverage or highlighted in all social media posts about the topic. Few local news outlets have staff who specialize in covering science, and even large news outlets often rely on press releases about new developments as sources for science news rather than offering continuing thematic discussion of how scientific research occurs over time or covering research topics without highly publicized research results (Schafer 2017). Moreover, in the contemporary American information environment, items reported in general news outlets compete for audience attention with numerous other stories not directly related to science (Lupia 2013).
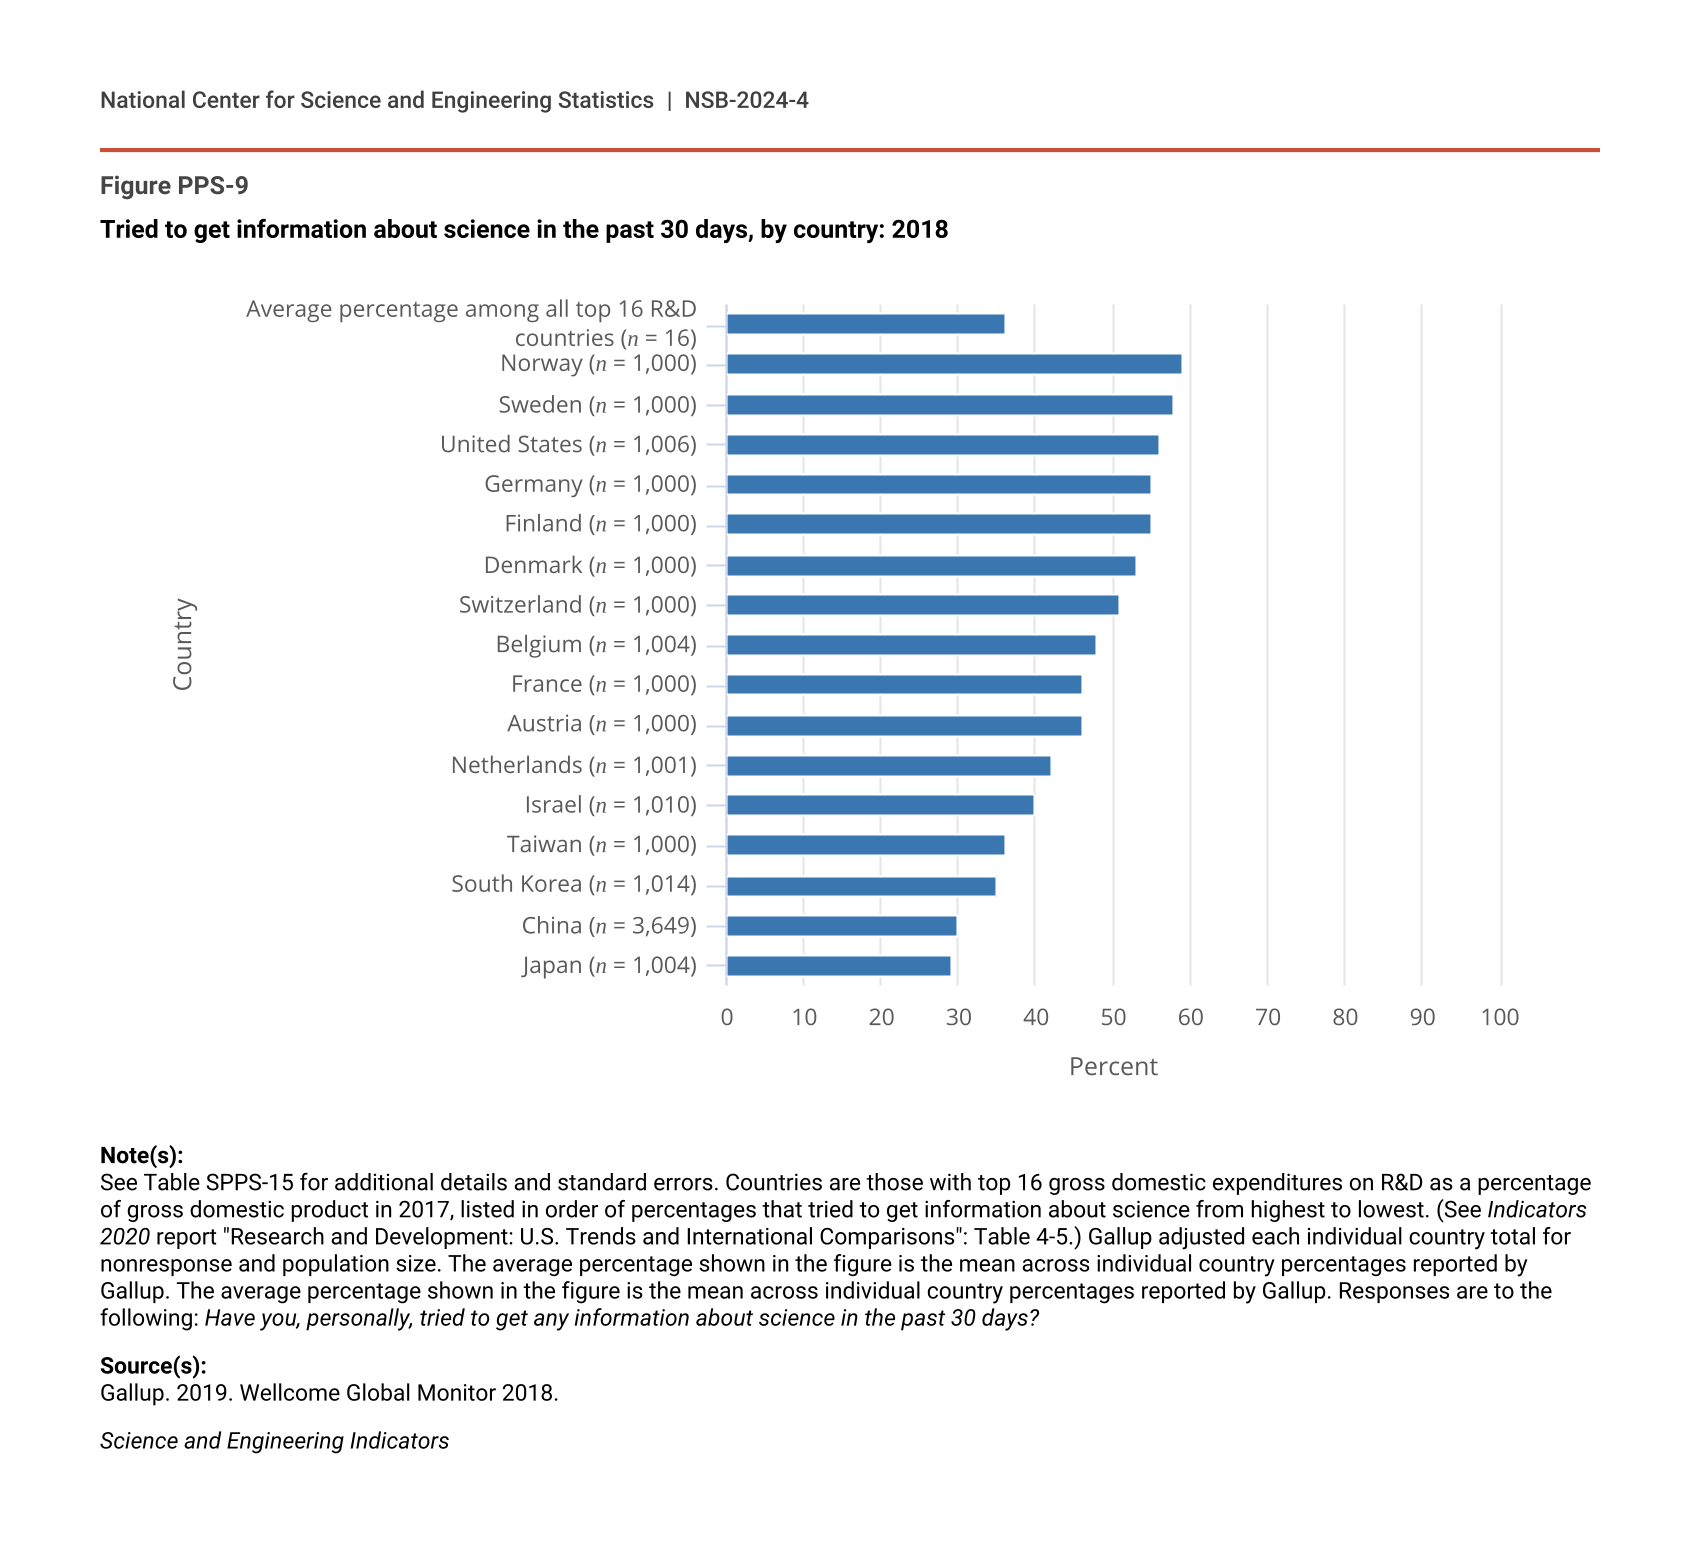
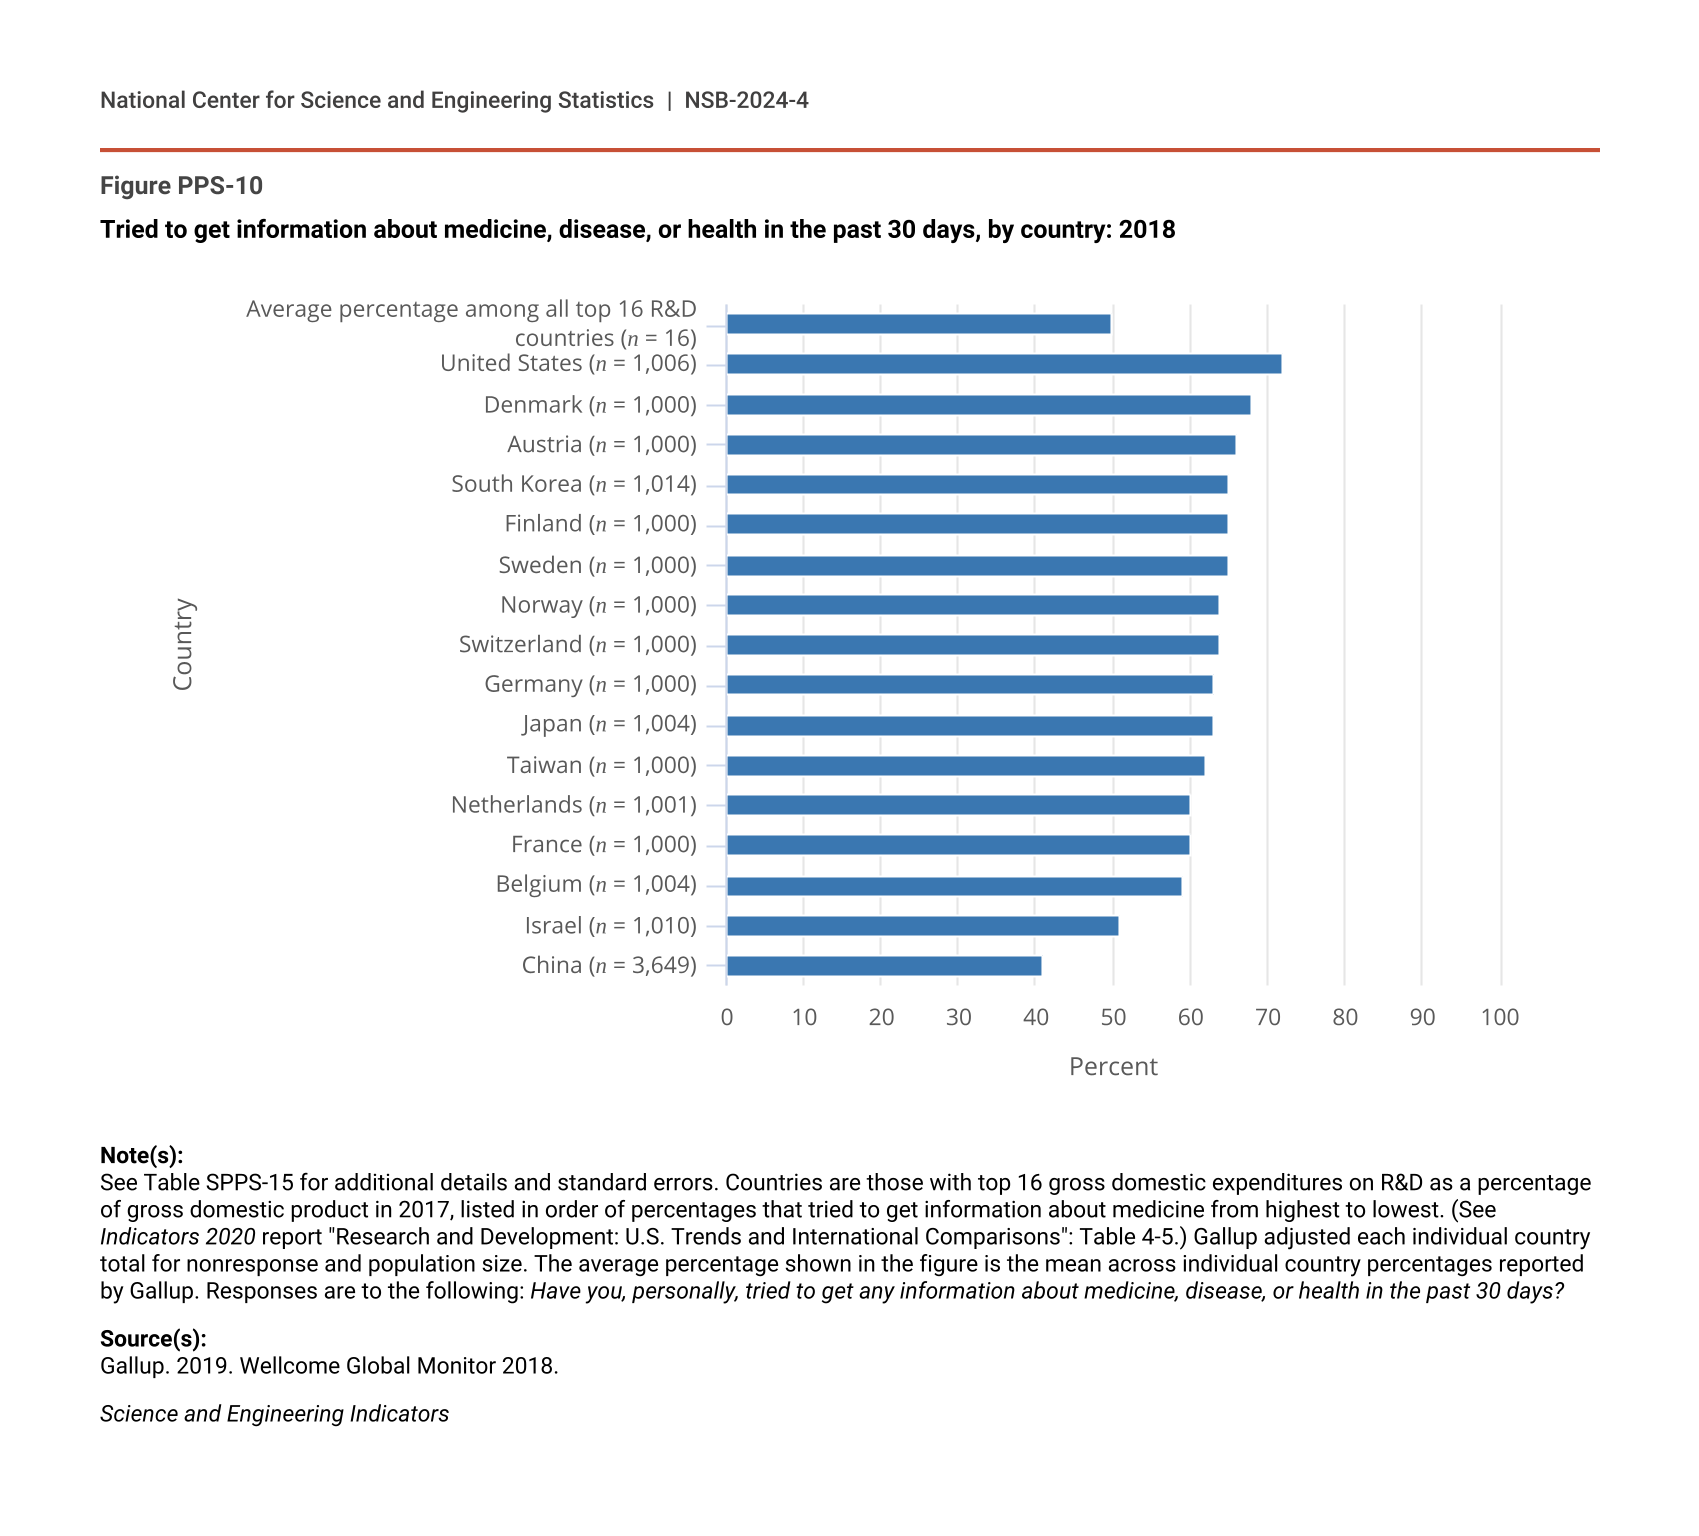
Prior to the COVID-19 pandemic, data indicated that most Americans do look for S&T-related information—at least occasionally—on their own. The Wellcome Global Monitor 2018 survey highlighted the extent to which people around the world had attempted to get information about science in the 30 days before the survey (Gallup 2019). The majority of Americans surveyed (56%) reported having sought such information (Figure PPS-9)—a significantly higher percentage than most of their counterparts in 15 other countries that, like the United States, make substantial investments in S&T R&D. Americans also had sought information about medicine and disease at higher rates than citizens of most other nations in the survey, with 72% having looked for information on medicine, disease, or health in the previous month; the average for citizens seeking similar content in all nations was 50% (Figure PPS-10).
Tried to get information about science in the past 30 days, by country: 2018
| Country | Tried to get information about science in the past 30 days |
|---|---|
| Average percentage among all top 16 R&D countries (n = 16) | 36 |
| Norway (n = 1,000) | 59 |
| Sweden (n = 1,000) | 58 |
| United States (n = 1,006) | 56 |
| Germany (n = 1,000) | 55 |
| Finland (n = 1,000) | 55 |
| Denmark (n = 1,000) | 53 |
| Switzerland (n = 1,000) | 51 |
| Belgium (n = 1,004) | 48 |
| France (n = 1,000) | 46 |
| Austria (n = 1,000) | 46 |
| Netherlands (n = 1,001) | 42 |
| Israel (n = 1,010) | 40 |
| Taiwan (n = 1,000) | 36 |
| South Korea (n = 1,014) | 35 |
| China (n = 3,649) | 30 |
| Japan (n = 1,004) | 29 |
Note(s):
See Table SPPS-15 for additional details and standard errors. Countries are those with top 16 gross domestic expenditures on R&D as a percentage of gross domestic product in 2017, listed in order of percentages that tried to get information about science from highest to lowest. (See Indicators 2020 report "Research and Development: U.S. Trends and International Comparisons": Table 4-5.) Gallup adjusted each individual country total for nonresponse and population size. The average percentage shown in the figure is the mean across individual country percentages reported by Gallup. The average percentage shown in the figure is the mean across individual country percentages reported by Gallup. Responses are to the following: Have you, personally, tried to get any information about science in the past 30 days?
Source(s):
Gallup. 2019. Wellcome Global Monitor 2018.
Science and Engineering Indicators
Tried to get information about medicine, disease, or health in the past 30 days, by country: 2018
| Country | Tried to get information about medicine, disease, or health in the past 30 days |
|---|---|
| Average percentage among all top 16 R&D countries (n = 16) | 50 |
| United States (n = 1,006) | 72 |
| Denmark (n = 1,000) | 68 |
| Austria (n = 1,000) | 66 |
| South Korea (n = 1,014) | 65 |
| Finland (n = 1,000) | 65 |
| Sweden (n = 1,000) | 65 |
| Norway (n = 1,000) | 64 |
| Switzerland (n = 1,000) | 64 |
| Germany (n = 1,000) | 63 |
| Japan (n = 1,004) | 63 |
| Taiwan (n = 1,000) | 62 |
| Netherlands (n = 1,001) | 60 |
| France (n = 1,000) | 60 |
| Belgium (n = 1,004) | 59 |
| Israel (n = 1,010) | 51 |
| China (n = 3,649) | 41 |
Note(s):
See Table SPPS-15 for additional details and standard errors. Countries are those with top 16 gross domestic expenditures on R&D as a percentage of gross domestic product in 2017, listed in order of percentages that tried to get information about medicine from highest to lowest. (See Indicators 2020 report "Research and Development: U.S. Trends and International Comparisons": Table 4-5.) Gallup adjusted each individual country total for nonresponse and population size. The average percentage shown in the figure is the mean across individual country percentages reported by Gallup. Responses are to the following: Have you, personally, tried to get any information about medicine, disease, or health in the past 30 days?
Source(s):
Gallup. 2019. Wellcome Global Monitor 2018.
Science and Engineering Indicators
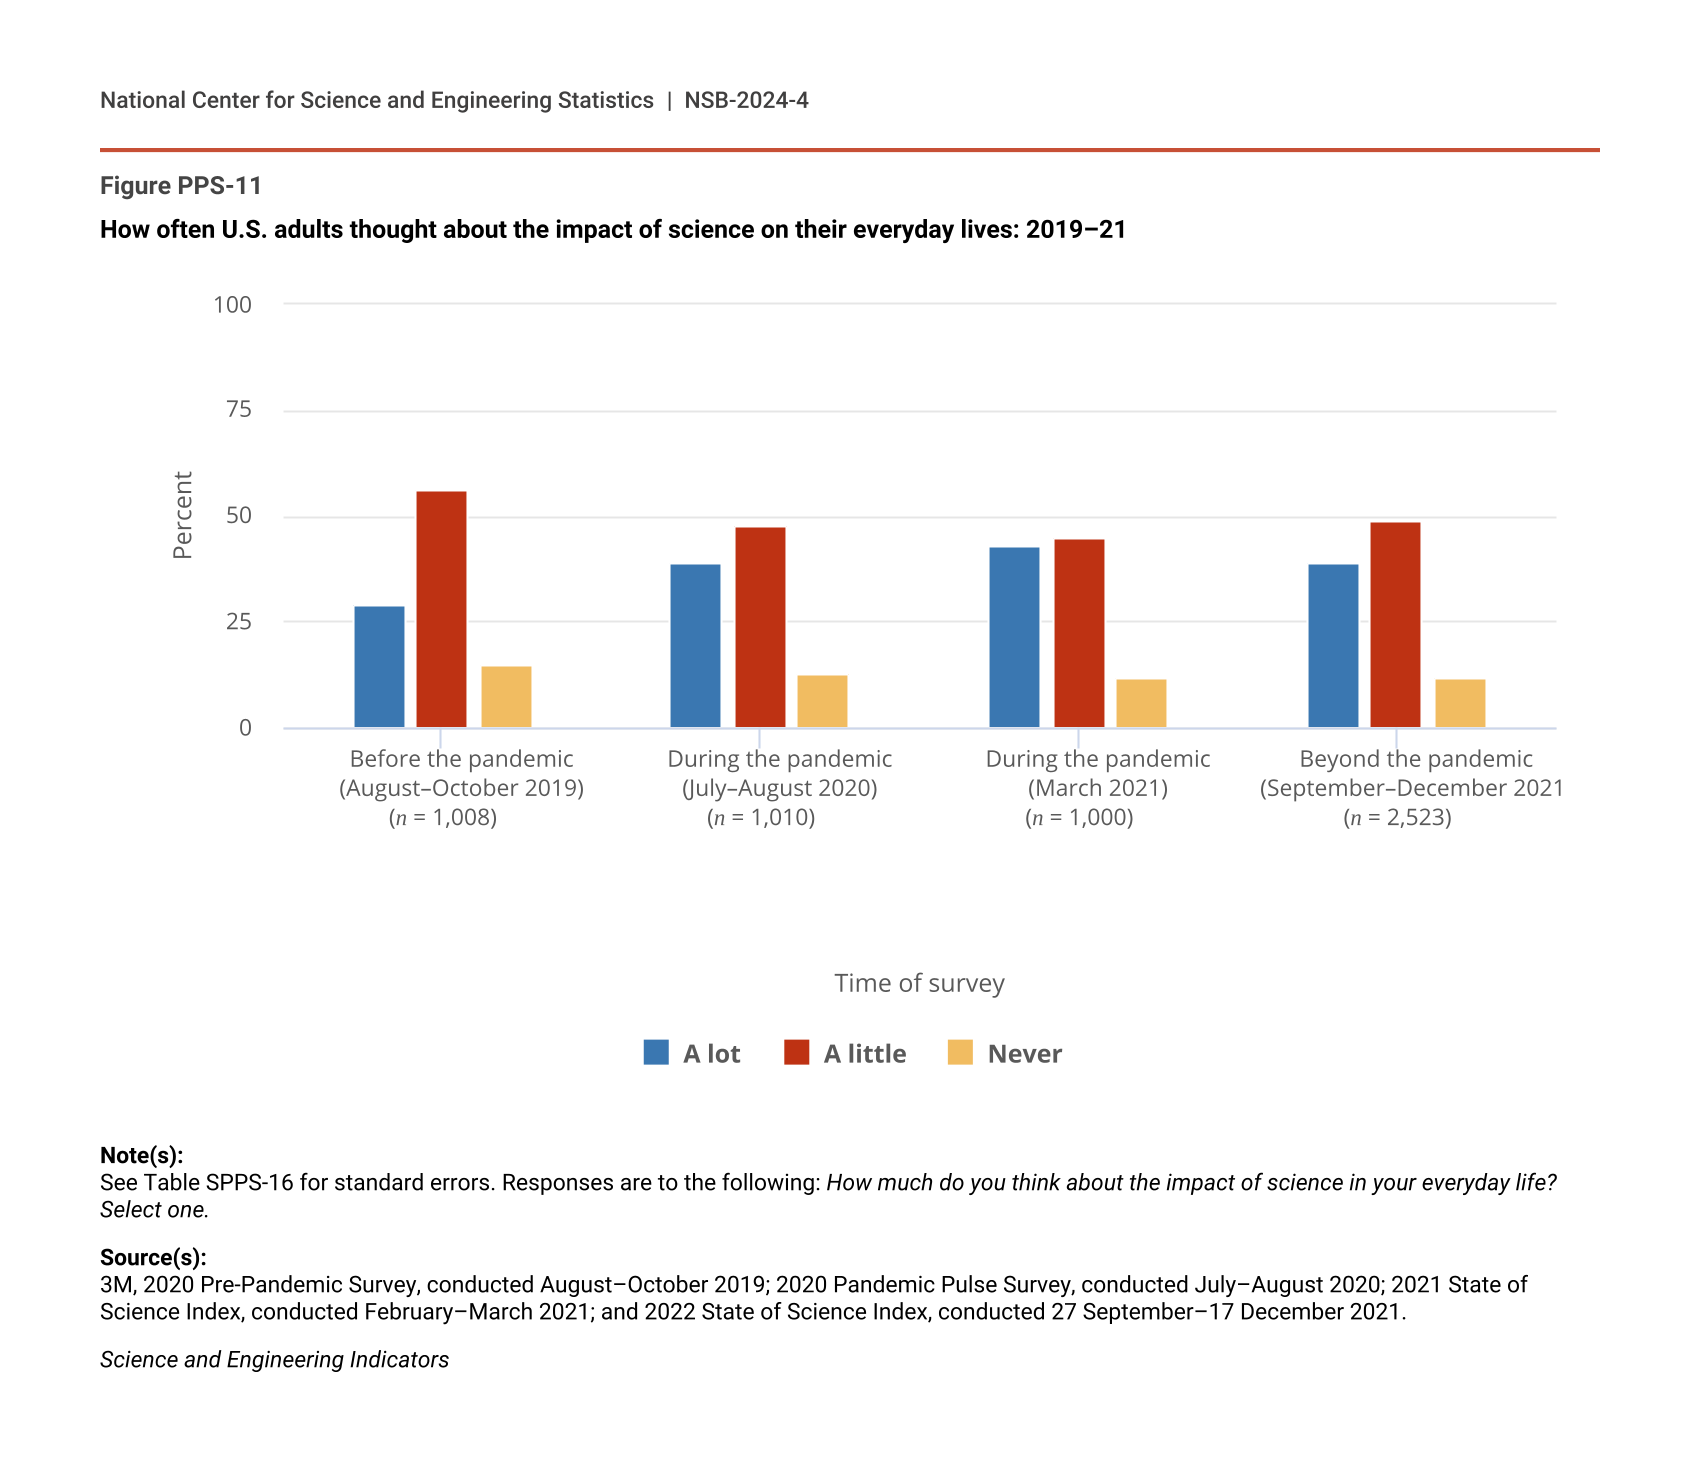
Information seeking regarding science topics can rapidly rise and fall at times. Factors such as news coverage of disease-related scientific research predict online search behavior, for example, as occurred in the United States, Guatemala, and Brazil during the 2016 Zika virus outbreak (Southwell et al. 2016). Media coverage of COVID-19 research and personal experiences during the COVID-19 pandemic also may have increased the salience of science information in the everyday life experiences of Americans—at least temporarily. For its 2020 State of Science Index survey, 3M collected data from around the world, both just before the large-scale spread of COVID-19 (August–October 2019) and during the pandemic (July and August 2020) (3M 2020). In late 2019, 29% of U.S. adults asked about how much they “think about the impact of science in your everyday life” responded that they thought about that topic “a lot”; in 2020, however, that figure jumped to 39% (Figure PPS-11). Although the majority of U.S. adults seek general scientific information on occasion and interest in specific topics sometimes sharply increases, most U.S. adults profess to not having “a lot” of specific scientific knowledge, as discussed earlier (Figure PPS-8).
How often U.S. adults thought about the impact of science on their everyday lives: 2019–21
| Time of survey | A lot | A little | Never |
|---|---|---|---|
| Before the pandemic (August–October 2019) (n = 1,008) |
29 | 56 | 15 |
| During the pandemic (July–August 2020) (n = 1,010) |
39 | 48 | 13 |
| During the pandemic (March 2021) (n = 1,000) |
43 | 45 | 12 |
| Beyond the pandemic (September–December 2021) (n = 2,523) |
39 | 49 | 12 |
Note(s):
See Table SPPS-16 for standard errors. Responses are to the following: How much do you think about the impact of science in your everyday life? Select one.
Source(s):
3M, 2020 Pre-Pandemic Survey, conducted August–October 2019; 2020 Pandemic Pulse Survey, conducted July–August 2020; 2021 State of Science Index, conducted February–March 2021; and 2022 State of Science Index, conducted 27 September–17 December 2021.
Science and Engineering Indicators
Engagement with Science Activities
The extent to which American adults participate in science activities is one aspect of their direct opportunity to learn about scientific logic and processes. Available survey data depict low science activity participation rates among American adults, yet recent academic literature nonetheless describes noteworthy efforts to offer science activities for communities in the United States.
The U.S. governmental website CitizenScience.gov has described opportunities for public participation in the scientific process such as participation in forming research questions, conducting experiments, collecting or analyzing data, or interpreting results (FedCCS 2019). An example of this approach is the Audubon Society’s annual bird count, in which volunteers report counts of various birds (Soykan et al. 2016). At least some American adults have had opportunities to generate science and engineering knowledge through participatory initiatives (Brossard, Lewenstein, and Bonney 2005; Pandya and Dibner 2018).
To date, population-level evidence of the reach of citizen science or participatory science activities has been limited. Researchers also have begun to ask questions about who gets involved in such activities and the extent to which activities are inclusive of various groups of people. Bonney (2021) notes that some projects have begun to use the phrase “community science” instead of “citizen science” to label such activities in recent years to encourage inclusivity in participation. Cooper et al. (2021) also have noted that just switching to “community science” as a label for activities does not necessarily guarantee that scientific activities welcome and include a wide range of people in practice, instead emphasizing the importance of offering accessible and participatory activities to increase the inclusion of people in scientific inquiry.
For more information about the state of citizen science or participatory science and the role of federal agencies as sponsors of such activities, see the sidebar Citizen Science in Federal Agencies and Departments in Indicators 2022 report “Invention, Knowledge Transfer, and Innovation.”
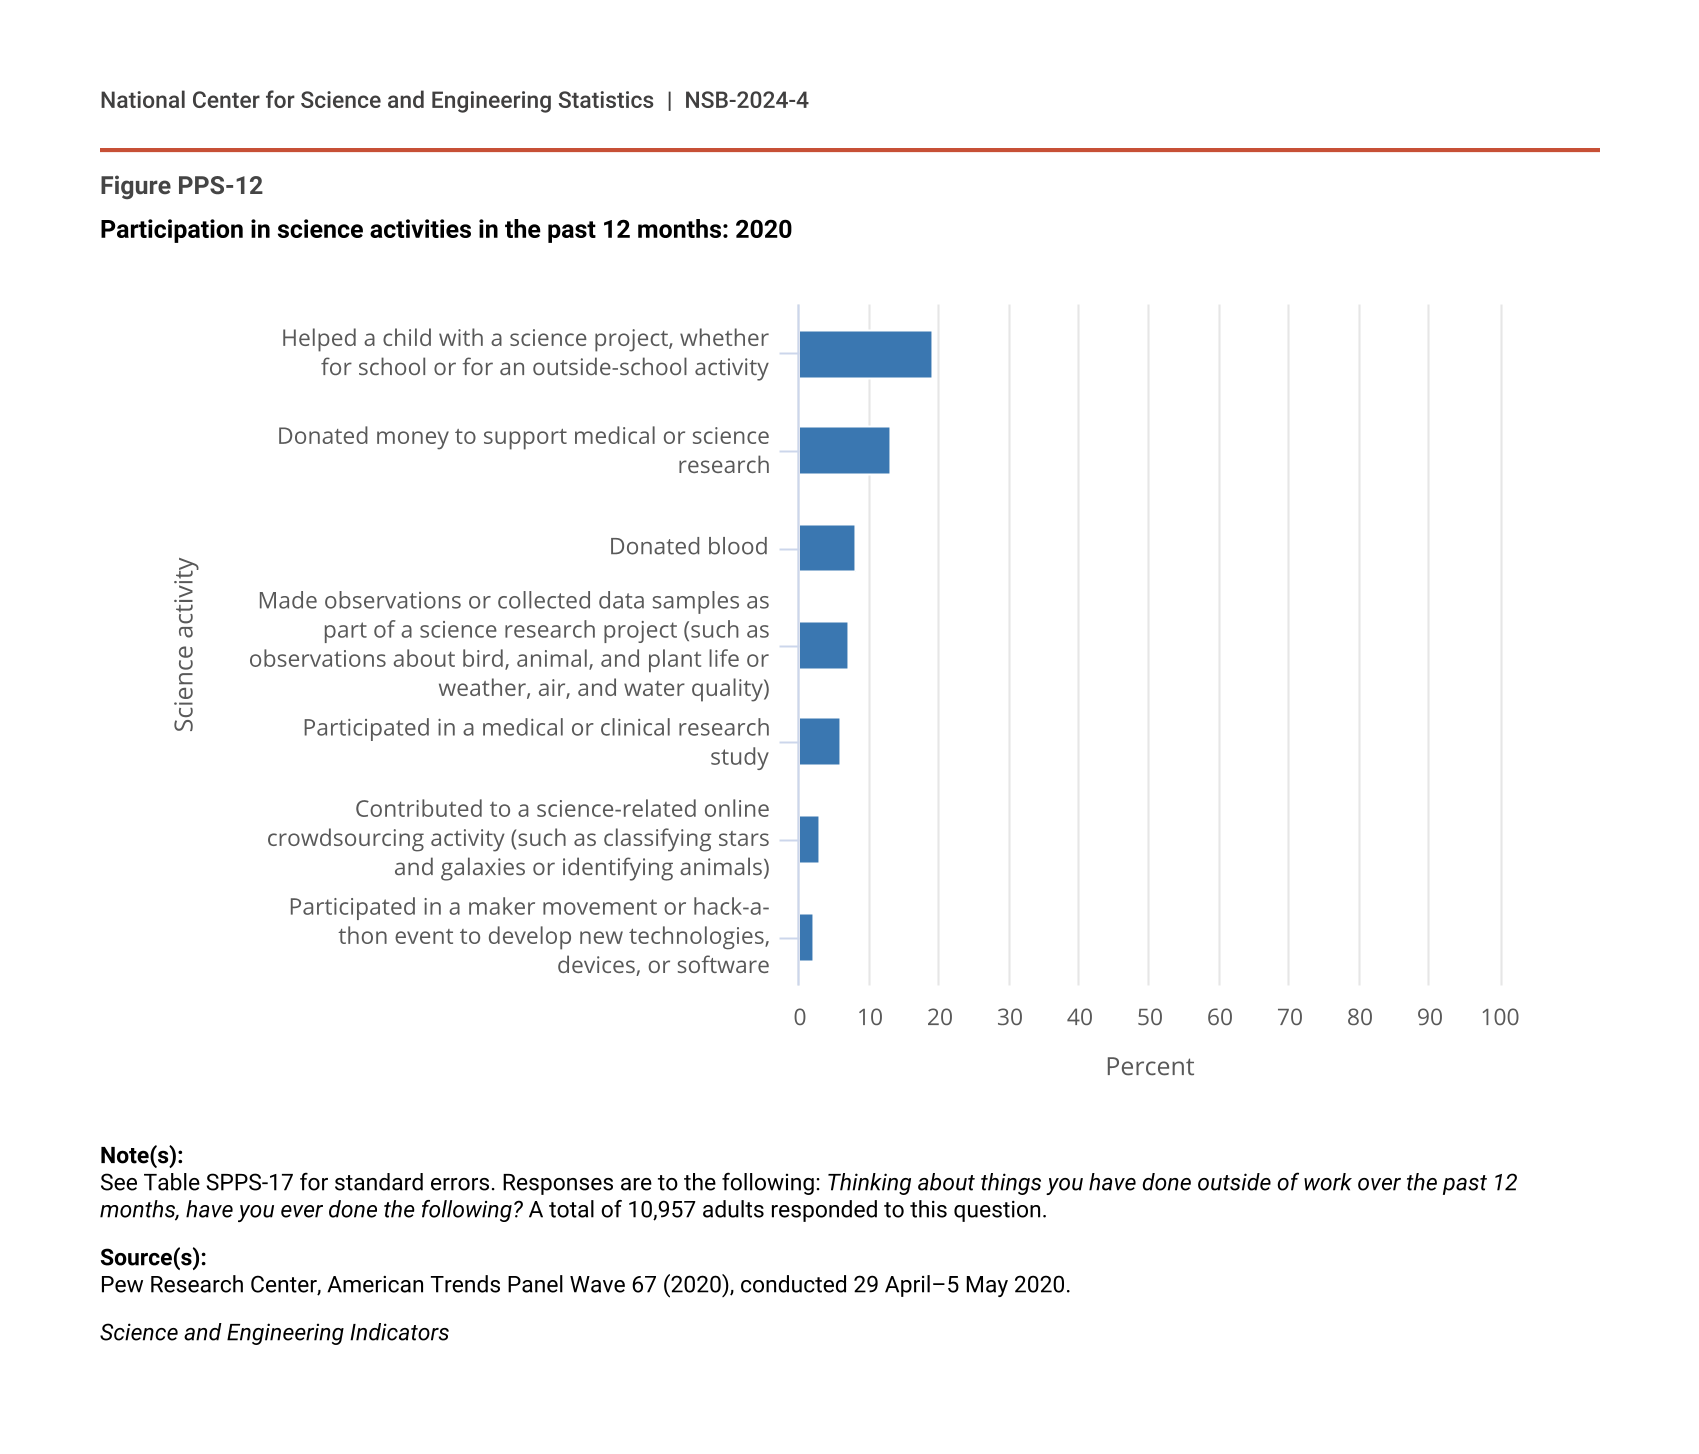
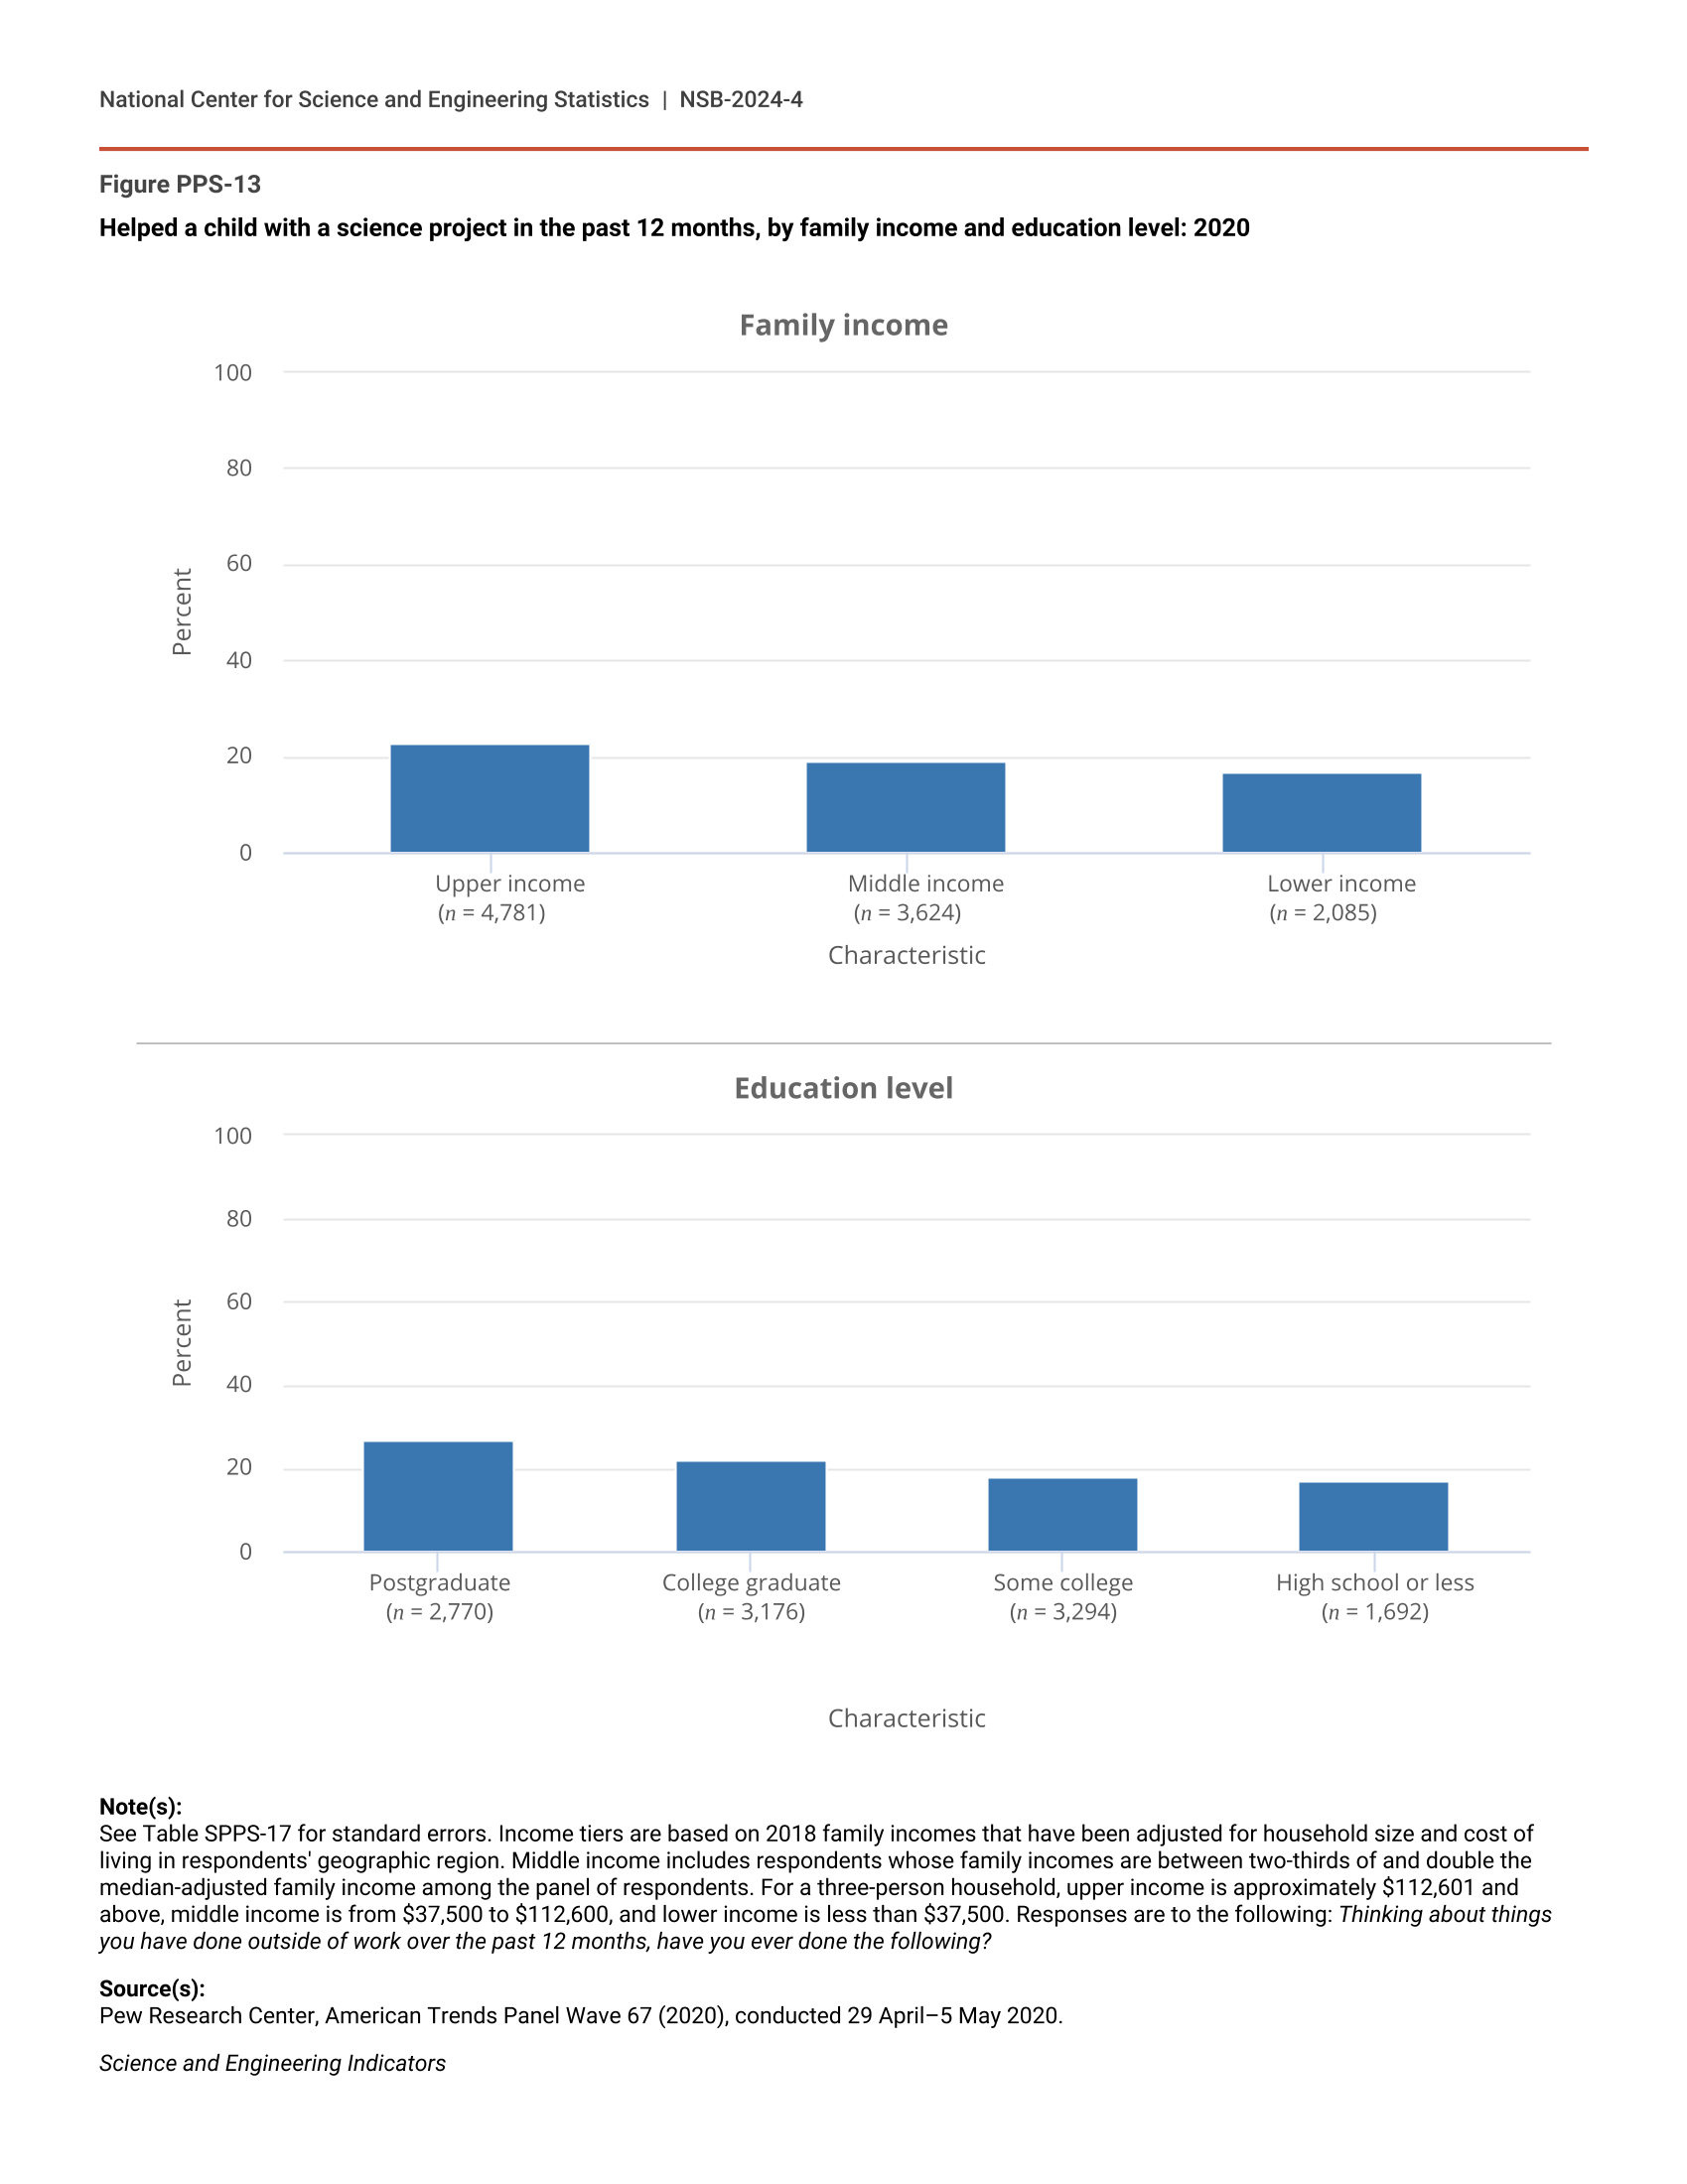
American adults tend to not report direct experience with science activities. The Pew Research Center’s November 2020 ATP survey included questions about whether respondents had participated in a medical or clinical research study, made observations or collected data for a science research project, contributed to online crowdsourcing for a science project, or helped a child with a science project, among other activities. Only a small percentage of U.S. adults had participated in each of those science activities in the past 12 months (Figure PPS-12; Table PPS-5). Approximately 19% had helped a child with a science project either for school or outside of school, suggesting that exposure to science activities through children in the household offers involvement in science for some U.S. adults. Participation in STEM activities also varies as a function of income and education (Figure PPS-13; Table PPS-5). Adults in households with relatively low incomes or with less formal education report less exposure to science activities via school projects with household children. Such differences might reflect inequity in time available to participate or scientific literacy differences (Kalil and Ryan 2020). Evidence directly comparing Americans’ time spent with STEM activities and time spent with a range of education, athletic, and employment activities is lacking.
Participation in science activities in the past 12 months: 2020
| Science activity | All adults (n = 10,957) |
|---|---|
| Helped a child with a science project, whether for school or for an outside-school activity | 19 |
| Donated money to support medical or science research | 13 |
| Donated blood | 8 |
| Made observations or collected data samples as part of a science research project (such as observations about bird, animal, and plant life or weather, air, and water quality) | 7 |
| Participated in a medical or clinical research study | 6 |
| Contributed to a science-related online crowdsourcing activity (such as classifying stars and galaxies or identifying animals) | 3 |
| Participated in a maker movement or hack-a-thon event to develop new technologies, devices, or software | 2 |
Note(s):
See Table SPPS-17 for standard errors. Responses are to the following: Thinking about things you have done outside of work over the past 12 months, have you ever done the following? A total of 10,957 adults responded to this question.
Source(s):
Pew Research Center, American Trends Panel Wave 67 (2020), conducted 29 April–5 May 2020.
Science and Engineering Indicators
Participation in science activities in the past 12 months, by family income and education: 2020
a Income tiers are based on 2018 family incomes that have been adjusted for household size and cost of living in respondents' geographic region. Middle income includes respondents whose family incomes are between two-thirds of and double the median-adjusted family income among the panel of respondents. For a three-person household, upper income is approximately $112,601 and above, middle income is from $37,500 to $112,600, and lower income is less than $37,500.
Note(s):
See Table SPPS-17 for standard errors. Responses are to the following: Thinking about things you have done outside of work over the past 12 months, have you ever done the following?
Source(s):
Pew Research Center, American Trends Panel Wave 67 (2020), conducted 29 April–5 May 2020.
Science and Engineering Indicators
Helped a child with a science project in the past 12 months, by family income and education level: 2020
| Characteristic | Helped a child with a science project, whether for school or for an outside-school activity |
|---|---|
| Upper income (n = 4,781) |
23 |
| Middle income (n = 3,624) |
19 |
| Lower income (n = 2,085) |
17 |
| Characteristic | Helped a child with a science project, whether for school or for an outside-school activity |
|---|---|
| Postgraduate (n = 2,770) |
27 |
| College graduate (n = 3,176) |
22 |
| Some college (n = 3,294) |
18 |
| High school or less (n = 1,692) |
17 |
Note(s):
See Table SPPS-17 for standard errors. Income tiers are based on 2018 family incomes that have been adjusted for household size and cost of living in respondents' geographic region. Middle income includes respondents whose family incomes are between two-thirds of and double the median-adjusted family income among the panel of respondents. For a three-person household, upper income is approximately $112,601 and above, middle income is from $37,500 to $112,600, and lower income is less than $37,500. Responses are to the following: Thinking about things you have done outside of work over the past 12 months, have you ever done the following?
Source(s):
Pew Research Center, American Trends Panel Wave 67 (2020), conducted 29 April–5 May 2020.
Science and Engineering Indicators
According to May and June 2017 Pew Research Center data (Funk, Gottfried, and Mitchell 2017), a majority of U.S. adults (62%) reported having visited at least one type of science-related venue or event in the past year (including venues such as public parks, zoos, aquariums, natural history museums, or S&T centers, or an event such as a science talk). The percentage of U.S. adults who reported having visited reporting specific venues was smaller, however, with only national, state, or county parks garnering reported visits from almost half (47%) of U.S. adults. For example, 30% of U.S. adults reported having visited a zoo or an aquarium in the past year, and 18% reported having visited an S&T center. Although most U.S. adults reported occasional visits to science-related venues or events prior to the COVID-19 pandemic, U.S. adults also have tended to encounter sources of science information such as news media outlets more often than physical venues focused on science topics. Respondents in the 2017 Pew Research Center study were more likely to report getting science-related news from general news outlets that cover a range of topics (54%) or science video programs (45%) than from visits to S&T centers or museums (12%). (A previous version of this report also discusses topics such as visits to museums and zoos; for information, see the Indicators 2020 report “Science and Technology: Public Attitudes, Knowledge, and Interest.”)
Outside the classroom, there are many opportunities for informal science education in the United States. For example, an exhaustive National Research Council report (NRC 2009) found thousands of organizations producing science content in the United States. Whether the availability of that informal content has had a robust effect on Americans’ perceptions of science over time, however, is an important empirical question, especially given the extent to which U.S. adults have not yet engaged with such content. Whether Americans experience equity in access to informal science education, which offers evidence-based content, also is a question that current literature has yet to address extensively.