 An official website of the United States government
 Academic R&D: International Comparisons
The United States spends more in support of academic R&D than any other country. According to data compiled by OECD, the top five countries for such spending in 2020 were the United States ($81 billion), Germany ($28 billion), the United Kingdom ($20 billion), Japan ($20 billion), and France ($15 billion). The 27 European Union nations (EU-27), including Germany and France, spent $100 billion (OECD 2023a, Table 68).
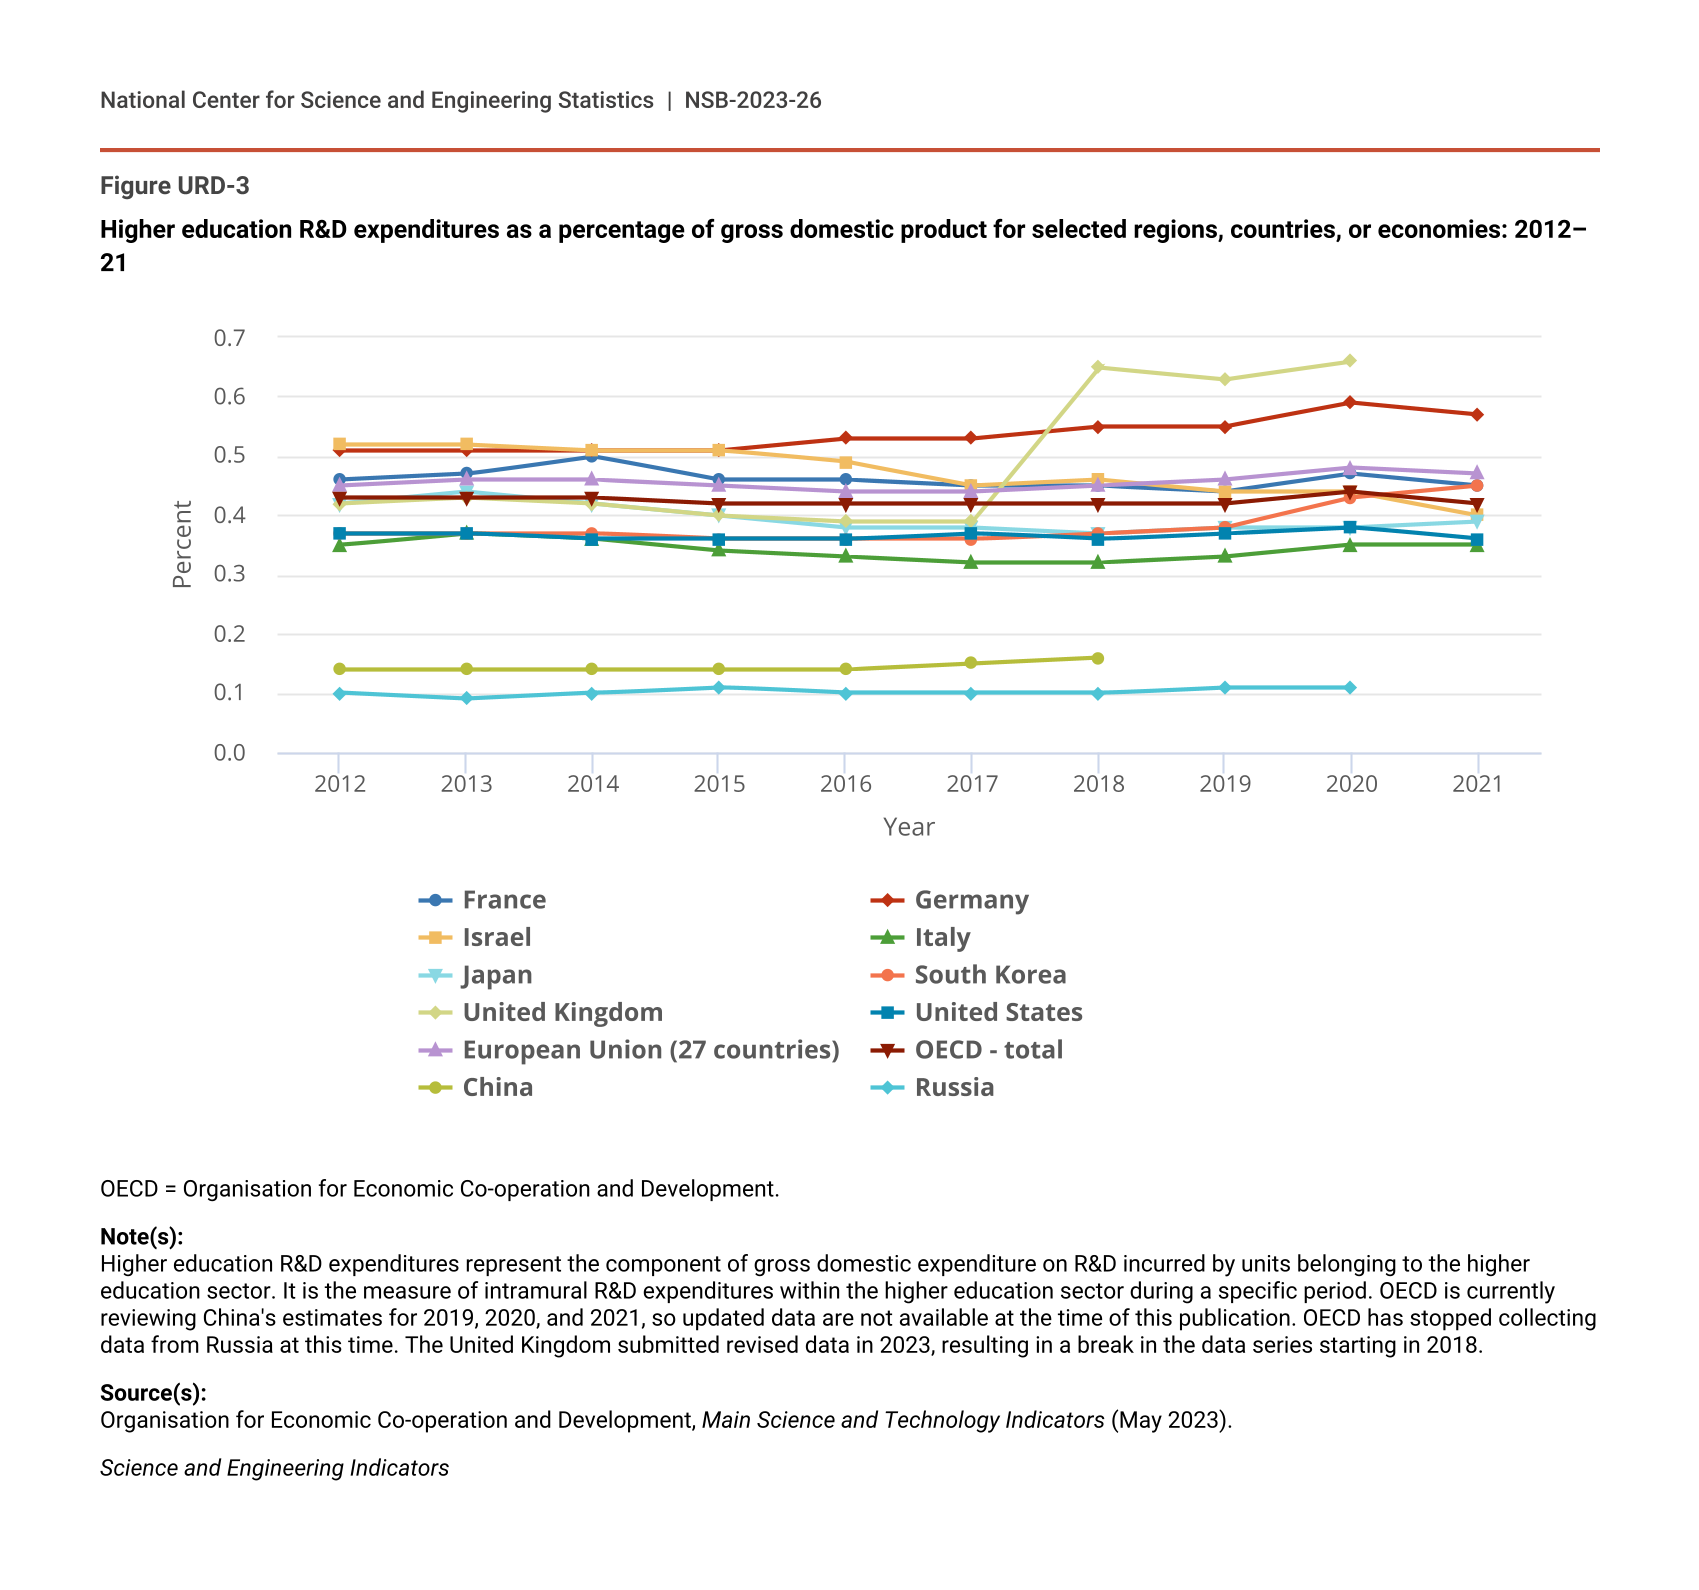
An indicator of the intensity of academic R&D spending by countries is the ratio of such spending to the gross domestic product (GDP) of each country (Figure URD-3). The United States has maintained a ratio ranging between 0.36% and 0.38% since 2012; its ratio of 0.36% in 2021 placed it 23rd among the 32 nations reporting data in that year (OECD 2023a, Table 70). By comparison, Germany has increased its intensity of academic R&D spending from 0.51% to 0.57% over the same time frame. South Korea and the EU-27 have also increased their intensity of academic R&D investments. Other countries, notably Israel and Japan, have reduced their academic R&D intensity over this period. China has rapidly expanded its academic R&D spending, but its GDP has also risen rapidly, so its ratio of academic R&D spending to GDP increased gradually from 0.12% in 2008 to 0.16% in 2018. Russia’s ratio of academic R&D to GDP has increased at a slightly higher pace than China’s, growing from 0.07% in 2008 to 0.11% in 2020, but it lags behind the ratios of other nations that have significant annual investment in R&D (OECD 2023a).
Higher education R&D expenditures as a percentage of gross domestic product for selected regions, countries, or economies: 2012–21
| Year | France | Germany | Israel | Italy | Japan | South Korea | United Kingdom | United States | European Union (27 countries) | OECD - total | China | Russia |
|---|---|---|---|---|---|---|---|---|---|---|---|---|
| 2012 | 0.46 | 0.51 | 0.52 | 0.35 | 0.42 | 0.37 | 0.42 | 0.37 | 0.45 | 0.43 | 0.14 | 0.10 |
| 2013 | 0.47 | 0.51 | 0.52 | 0.37 | 0.44 | 0.37 | 0.43 | 0.37 | 0.46 | 0.43 | 0.14 | 0.09 |
| 2014 | 0.50 | 0.51 | 0.51 | 0.36 | 0.42 | 0.37 | 0.42 | 0.36 | 0.46 | 0.43 | 0.14 | 0.10 |
| 2015 | 0.46 | 0.51 | 0.51 | 0.34 | 0.40 | 0.36 | 0.40 | 0.36 | 0.45 | 0.42 | 0.14 | 0.11 |
| 2016 | 0.46 | 0.53 | 0.49 | 0.33 | 0.38 | 0.36 | 0.39 | 0.36 | 0.44 | 0.42 | 0.14 | 0.10 |
| 2017 | 0.45 | 0.53 | 0.45 | 0.32 | 0.38 | 0.36 | 0.39 | 0.37 | 0.44 | 0.42 | 0.15 | 0.10 |
| 2018 | 0.45 | 0.55 | 0.46 | 0.32 | 0.37 | 0.37 | 0.65 | 0.36 | 0.45 | 0.42 | 0.16 | 0.10 |
| 2019 | 0.44 | 0.55 | 0.44 | 0.33 | 0.38 | 0.38 | 0.63 | 0.37 | 0.46 | 0.42 | NA | 0.11 |
| 2020 | 0.47 | 0.59 | 0.44 | 0.35 | 0.38 | 0.43 | 0.66 | 0.38 | 0.48 | 0.44 | NA | 0.11 |
| 2021 | 0.45 | 0.57 | 0.40 | 0.35 | 0.39 | 0.45 | NA | 0.36 | 0.47 | 0.42 | NA | NA |
OECD = Organisation for Economic Co-operation and Development.
Note(s):
Higher education R&D expenditures represent the component of gross domestic expenditure on R&D incurred by units belonging to the higher education sector. It is the measure of intramural R&D expenditures within the higher education sector during a specific period. OECD is currently reviewing China's estimates for 2019, 2020, and 2021, so updated data are not available at the time of this publication. OECD has stopped collecting data from Russia at this time. The United Kingdom submitted revised data in 2023, resulting in a break in the data series starting in 2018.
Source(s):
Organisation for Economic Co-operation and Development, Main Science and Technology Indicators (May 2023).
Science and Engineering Indicators