 An official website of the United States government
Cross-National Comparisons of R&D Performance
Two key indicators of national R&D performance are gross domestic expenditures on R&D (GERD)—a measure of a country’s total R&D investment—and national R&D intensity (GERD-to-GDP ratio)—a measure of a country’s investment in R&D relative to its overall economic activity. Together, they paint a broad picture of the current distribution of global R&D activities and the changing global R&D landscape as countries build capabilities in science and technology to improve their national economy and society.
This section compares R&D performance in the United States with other major R&D-performing nations globally, including China, Japan, South Korea, France, Germany, India, and the United Kingdom as well as key regional and geopolitical groupings, such as the European Union (EU-27) and East-Southeast and South Asia. It also presents cross-national analyses of trends in the composition of R&D by sector and by R&D type.
The national R&D expenditures presented in this report are from the Organisation for Economic Co-operation and Development’s (OECD) Main Science and Technology Indicators and the United Nations Educational, Scientific and Cultural Organization’s (UNESCO) Institute for Statistics. The global R&D total is estimated by NCSES based on these sources and reflects R&D performance by 119 countries with reported annual R&D expenditures of $50 million or more. These countries account for most of the current global R&D.
R&D expenditures for all countries are reported in current U.S. dollars (not adjusted for inflation) using purchasing power parities (PPPs). PPPs convert different currencies to a common currency while adjusting for differences in price levels between economies. The use of PPPs thus enables direct comparisons of R&D expenditures across countries. (See the Technical Appendix for more details.)
The regional analysis focuses on the regions with the largest R&D expenditures: North America (United States, Canada, and Mexico), Europe (including the EU-27 member countries), and the portion of Asia that includes the regions of East-Southeast Asia (including China, Japan, South Korea, and Taiwan), and South Asia (including India and Pakistan). The groupings of countries into regions are from The World Factbook (CIA 2021).
Patterns and Trends in Total National R&D
Country and Regional Patterns in Total National R&D, 2019
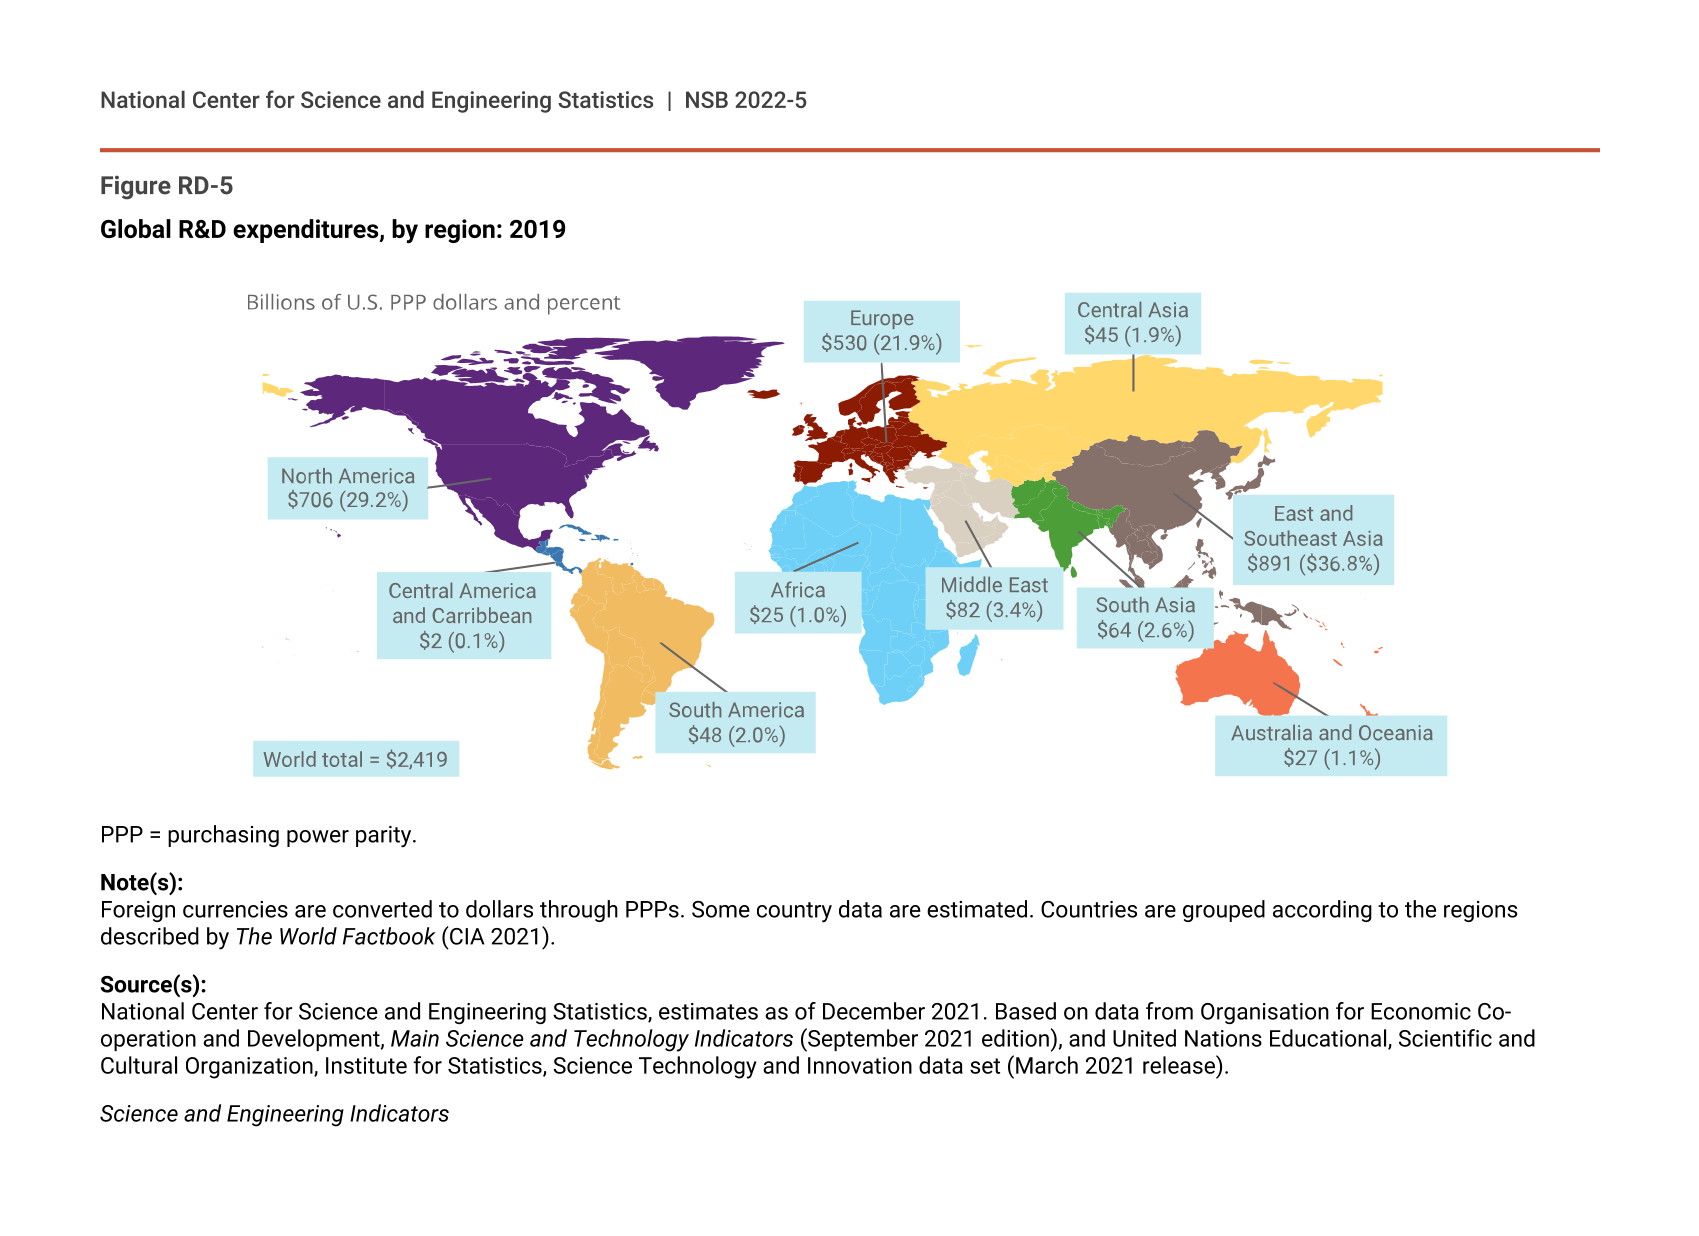
The estimated total for global R&D expenditures in 2019 is just over $2.4 trillion (Figure RD-5). Global R&D performance is concentrated in the following geographic regions: East-Southeast and South Asia (combined R&D expenditures of $955.0 billion, or a 39% share of global R&D), North America ($706.1 billion, or 29%), and Europe ($529.6 billion, or 22%). All other regions combined account for 10% of global R&D performance.
Global R&D expenditures, by region: 2019
PPP = purchasing power parity.
Note(s):
Foreign currencies are converted to dollars through PPPs. Some country data are estimated. Countries are grouped according to the regions described by The World Factbook (CIA 2021).
Source(s):
National Center for Science and Engineering Statistics, estimates as of December 2021. Based on data from Organisation for Economic Co-operation and Development, Main Science and Technology Indicators (September 2021 edition), and United Nations Educational, Scientific and Cultural Organization, Institute for Statistics, Science Technology and Innovation data set (March 2021 release).
Science and Engineering Indicators
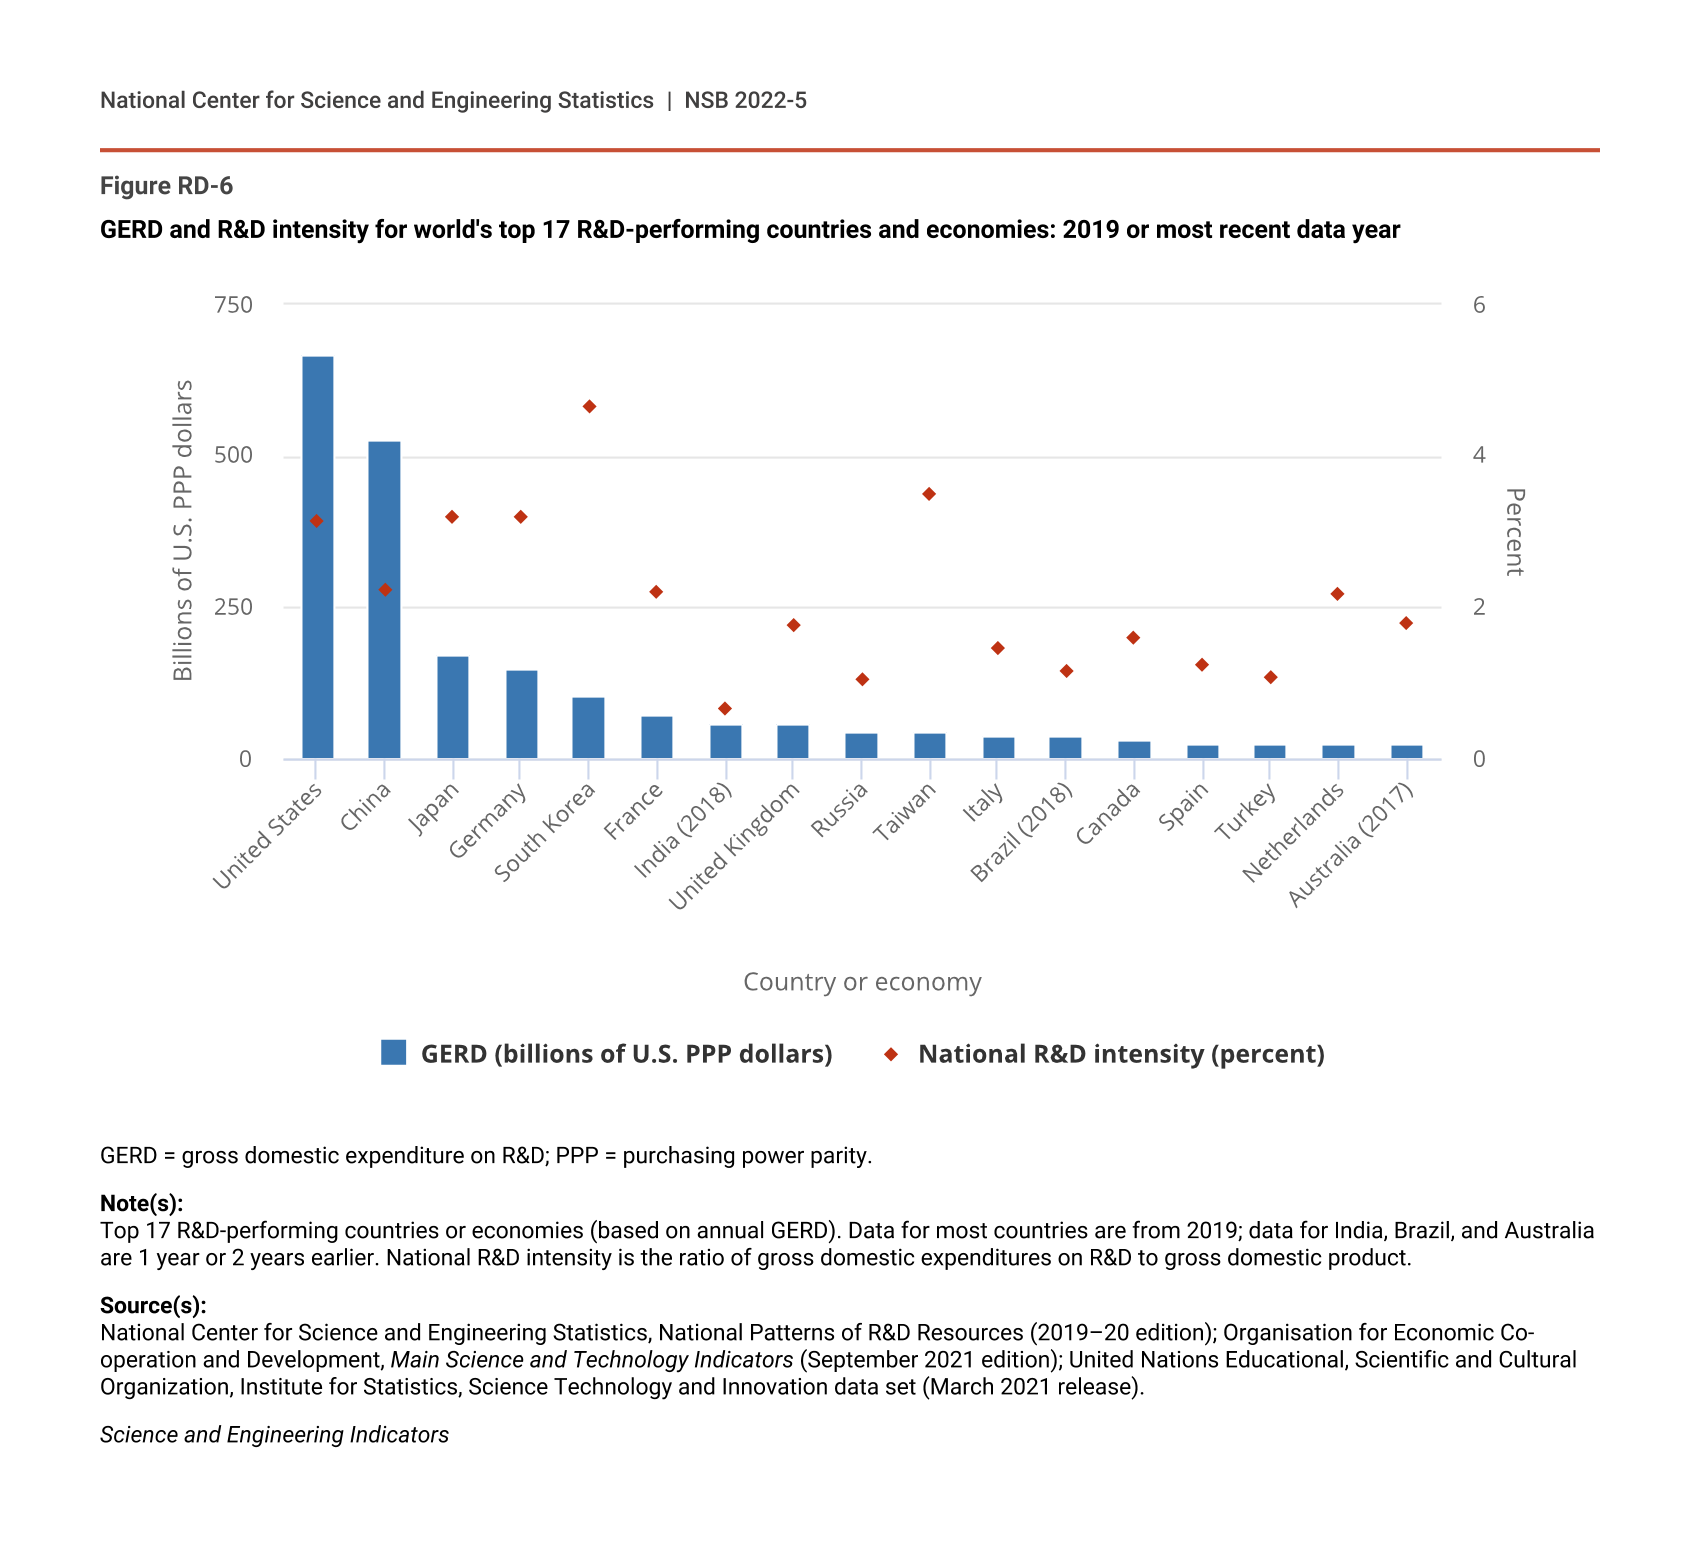
R&D performance is even more concentrated when comparing individual countries. The United States and China lead R&D performance globally, jointly accounting for half of global R&D (Figure RD-6). The United States performed $668.4 billion (28%) of global R&D in 2019. China followed, with $525.7 billion (22%) of global R&D.
GERD and R&D intensity for world's top 17 R&D-performing countries and economies: 2019 or most recent data year
| Country or economy | GERD (billions of U.S. PPP dollars) | National R&D intensity (percent) |
|---|---|---|
| United States | 668.4 | 3.13 |
| China | 525.7 | 2.23 |
| Japan | 173.3 | 3.20 |
| Germany | 148.1 | 3.19 |
| South Korea | 102.5 | 4.64 |
| France | 73.3 | 2.20 |
| India (2018) | 58.7 | 0.65 |
| United Kingdom | 56.9 | 1.76 |
| Russia | 44.5 | 1.04 |
| Taiwan | 44.0 | 3.49 |
| Italy | 39.3 | 1.47 |
| Brazil (2018) | 36.3 | 1.16 |
| Canada | 30.3 | 1.59 |
| Spain | 24.9 | 1.25 |
| Turkey | 24.2 | 1.06 |
| Netherlands | 22.6 | 2.18 |
| Australia (2017) | 22.4 | 1.79 |
GERD = gross domestic expenditure on R&D; PPP = purchasing power parity.
Note(s):
Top 17 R&D-performing countries or economies (based on annual GERD). Data for most countries are from 2019; data for India, Brazil, and Australia are 1 year or 2 years earlier. National R&D intensity is the ratio of gross domestic expenditures on R&D to gross domestic product.
Source(s):
National Center for Science and Engineering Statistics, National Patterns of R&D Resources (2019–20 edition); Organisation for Economic Co-operation and Development, Main Science and Technology Indicators (September 2021 edition); United Nations Educational, Scientific and Cultural Organization, Institute for Statistics, Science Technology and Innovation data set (March 2021 release).
Science and Engineering Indicators
The next tier of top R&D performers includes Japan (7% of global R&D), Germany (6%), and South Korea (4%), each with R&D expenditures above $100 billion. Together with the United States and China, these countries accounted for two-thirds of global R&D in 2019.
France, India, and the United Kingdom make up the third tier of top R&D performers, each with R&D expenditures above $50 billion, or around 2%–3% of the global R&D total. The fourth tier includes Russia, Taiwan, Italy, and Brazil, each with R&D expenditures from $36 billion to $45 billion, or 1.5%–2.0% of the global R&D total. Canada, Spain, Turkey, the Netherlands, and Australia follow, with R&D expenditures between $22 billion and $30 billion, or about 1% of the global R&D total each.
These top 17 R&D-performing countries collectively performed 87% of the global R&D in 2019 (Figure RD-6). Many other countries also perform R&D but do so at a comparatively much smaller scale (Table RD-5).
International comparisons of gross domestic expenditures on R&D and R&D share of gross domestic product, by region, country, or economy: 2019 or most recent year
GDP = gross domestic product; GERD = gross domestic expenditure on R&D; G20 = Group of Twenty; OECD = Organisation for Economic Co-operation and Development; PPP = purchasing power parity.
a Data for U.S. GERD differ slightly from the U.S. total R&D data tabulated earlier in this report. For better consistency with international standards, U.S. GERD includes federal capital funding for federal intramural and nonprofit R&D, in addition to what is reported as U.S. total R&D.
b Data for the European Union (EU) include the 27 EU member countries.
Note(s):
Year of data is listed in parentheses. Foreign currencies are converted to dollars through PPPs. Countries in this table have an annual GERD of $500 million or more. Countries are grouped according to the regions described by The World Factbook (CIA 2021). Data for Israel are civilian R&D only. See sources below for GERD statistics on additional countries.
Source(s):
National Center for Science and Engineering Statistics, National Patterns of R&D Resources (2019–20 edition); Organisation for Economic Co-operation and Development, Main Science and Technology Indicators (September 2021 edition); United Nations Educational, Scientific and Cultural Organization, Institute for Statistics, Science Technology and Innovation data set (March 2021 release).
Science and Engineering Indicators
Trends in Total National R&D
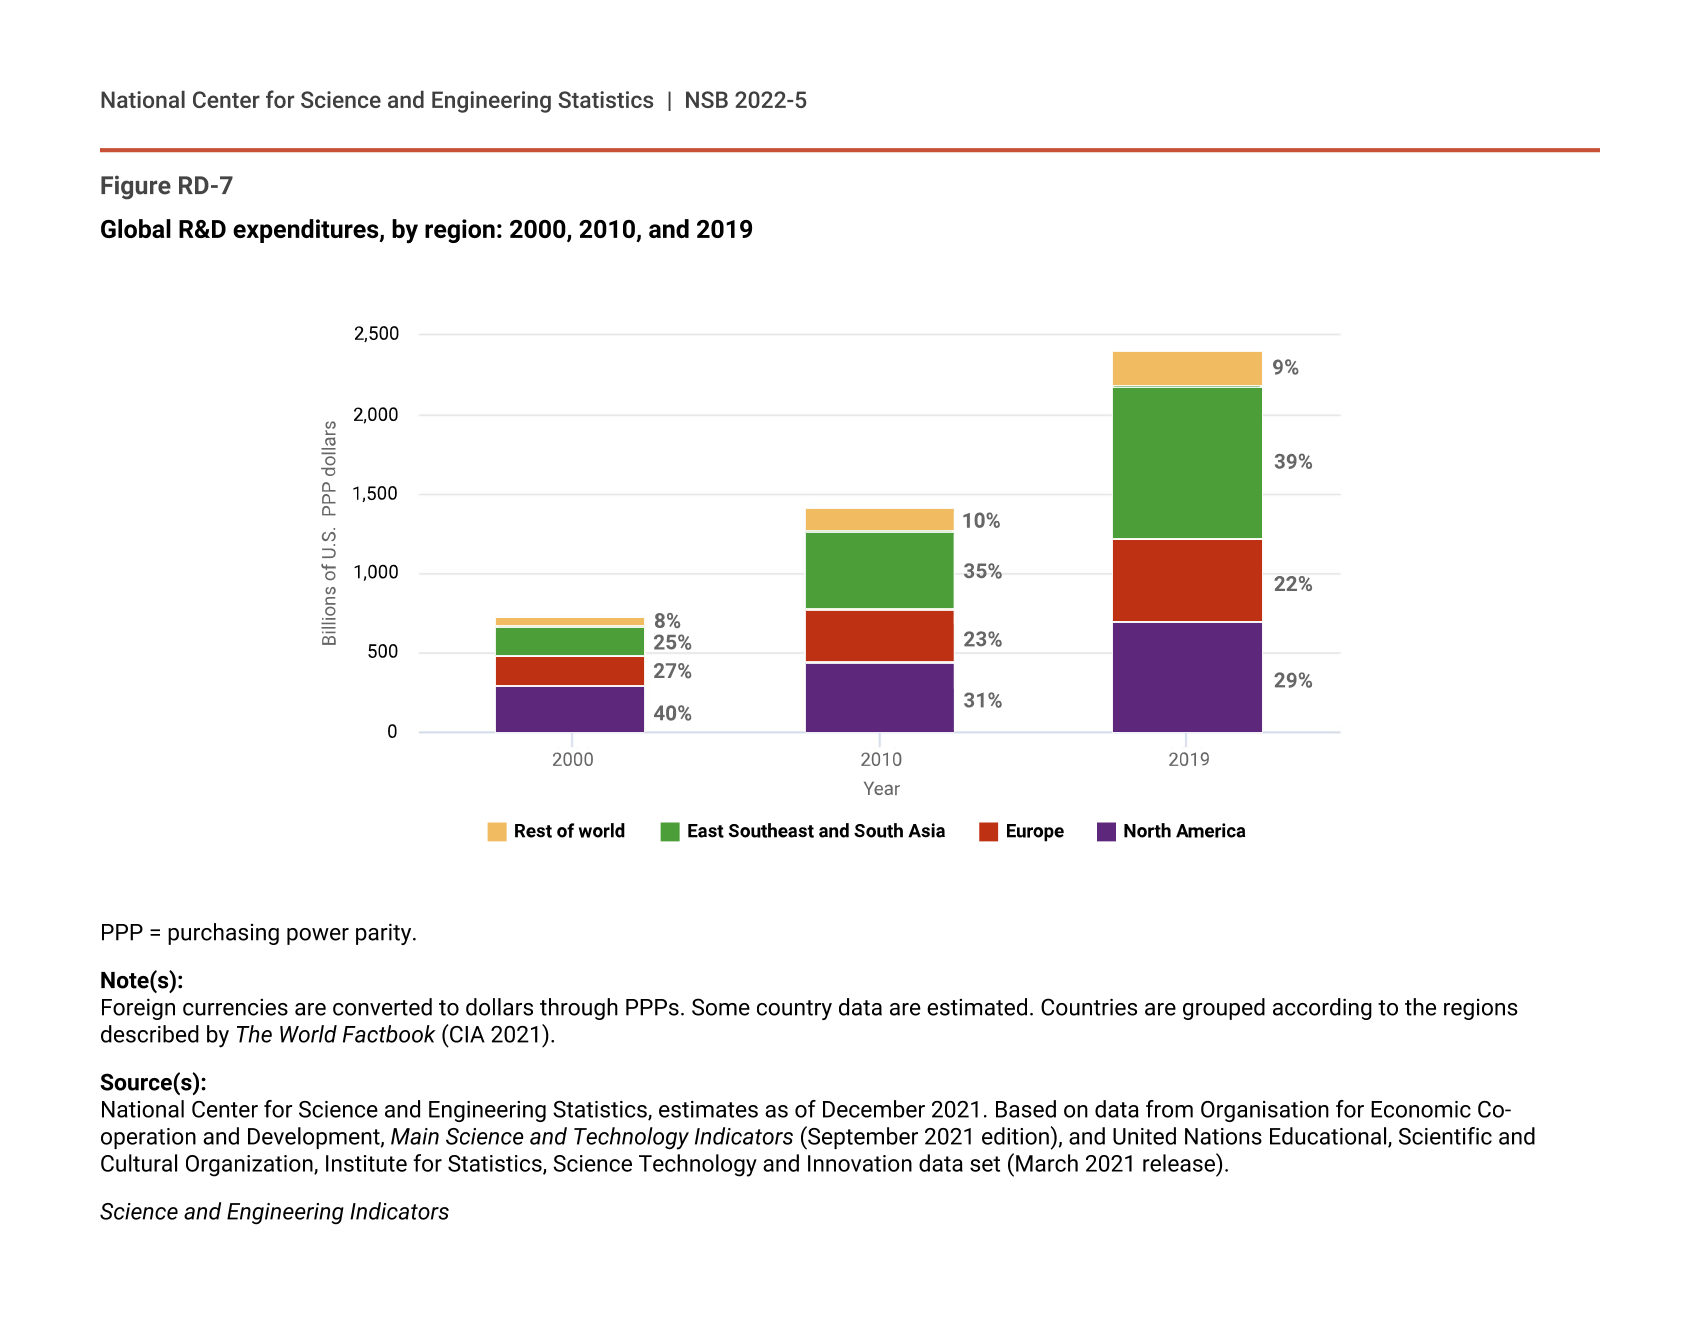
Total global R&D expenditures continue to rise substantially as countries intensify their R&D efforts. Global R&D expenditures increased more than threefold from 2000 ($725.0 billion) to 2019 ($2.4 trillion) (Figure RD-7). The annual increase in global total R&D averaged 6.9% over the 2000–10 period and 6.2% for 2010–19.
Global R&D expenditures, by region: 2000, 2010, and 2019
PPP = purchasing power parity.
Note(s):
Foreign currencies are converted to dollars through PPPs. Some country data are estimated. Countries are grouped according to the regions described by The World Factbook (CIA 2021).
Source(s):
National Center for Science and Engineering Statistics, estimates as of December 2021. Based on data from Organisation for Economic Co-operation and Development, Main Science and Technology Indicators (September 2021 edition), and United Nations Educational, Scientific and Cultural Organization, Institute for Statistics, Science Technology and Innovation data set (March 2021 release).
Science and Engineering Indicators
The global concentration of R&D performance continues to shift from North America and Europe to the East-Southeast and South Asia regions (Figure RD-7). R&D performed in North America accounted for 40% of the global total R&D in 2000 but only 29% in 2019. Europe accounted for 27% of global R&D in 2000 but declined to 22% in 2019. In contrast, the East-Southeast and South Asia regions accounted for 25% of the global total R&D in 2000, and their global share rose to 39% in 2019.
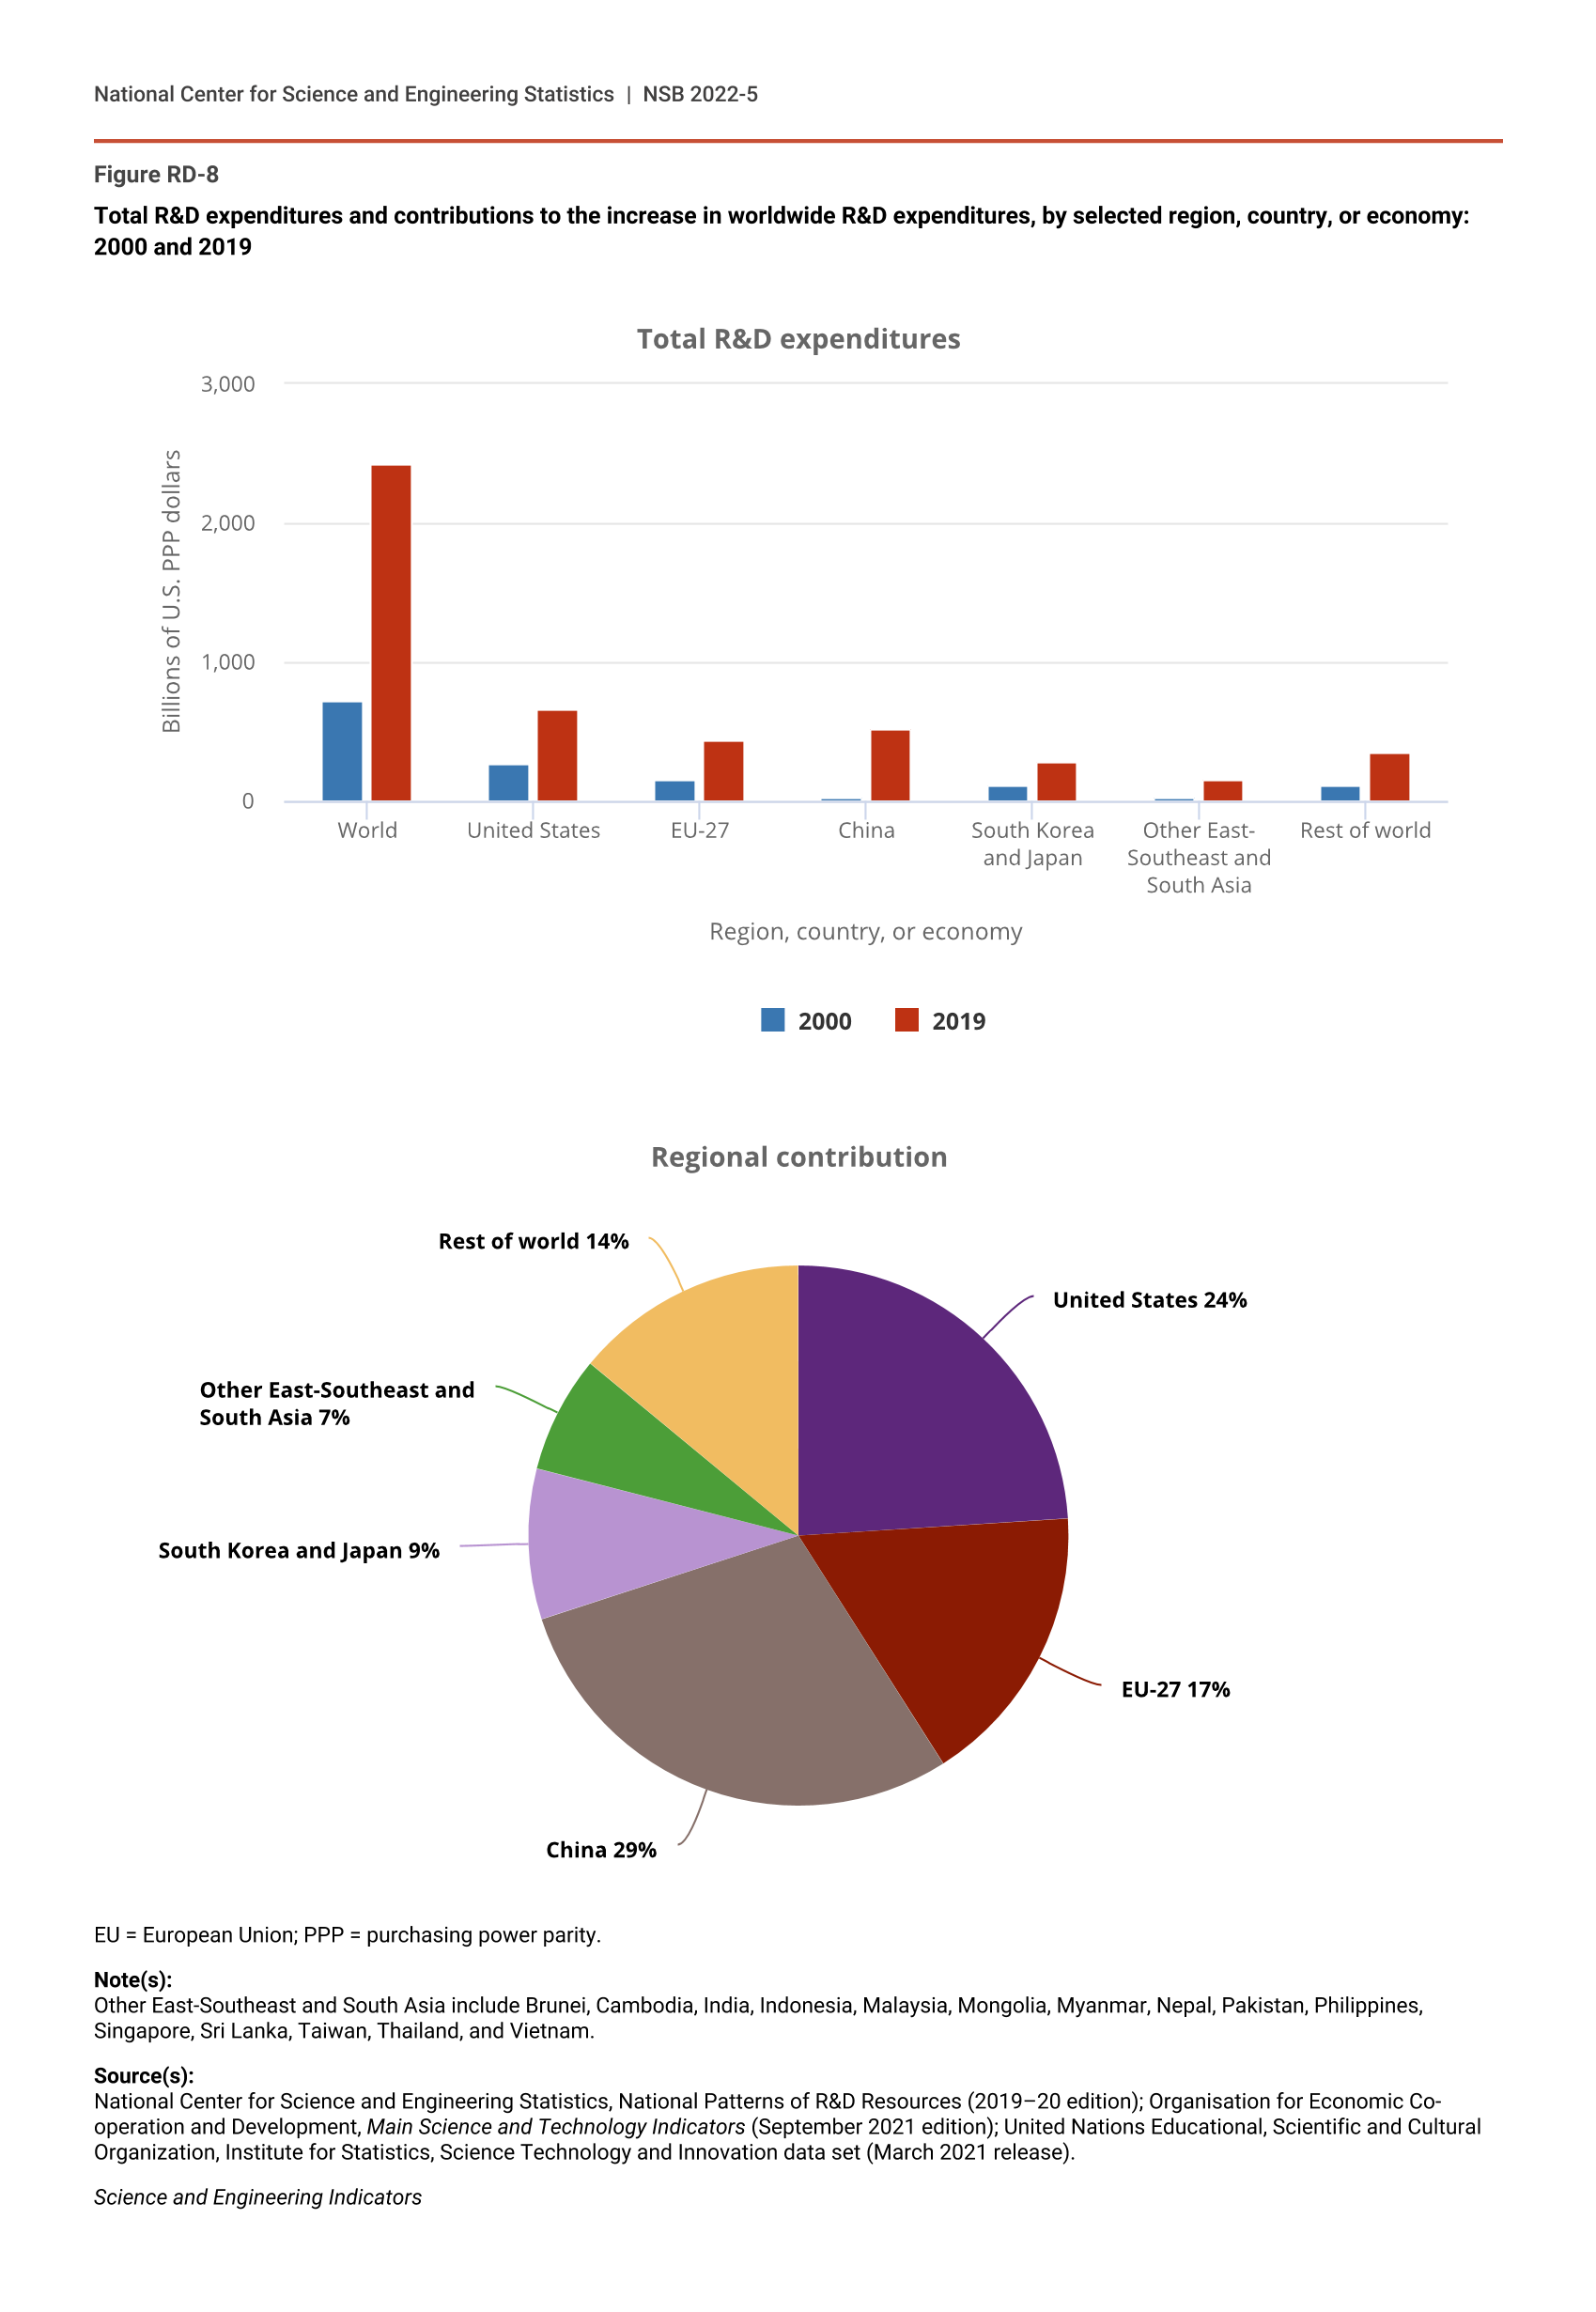
China accounted for 29% ($492.8 billion) of the global increase in R&D since 2000 (Figure RD-8). The United States accounted for 24% ($399.8 billion), and the EU-27 member countries accounted for 17% ($281.5 billion). The increases of several other major Asian R&D performers were also noticeable: South Korea and Japan jointly accounted for 9% of the increase ($158.3 billion).
Total R&D expenditures and contributions to the increase in worldwide R&D expenditures, by selected region, country, or economy: 2000 and 2019
| Region, country, or economy | 2000 | 2019 |
|---|---|---|
| World | 725.0 | 2,419.1 |
| United States | 268.6 | 668.4 |
| EU-27 | 158.9 | 440.3 |
| China | 32.9 | 525.7 |
| South Korea and Japan | 117.4 | 275.8 |
| Other East-Southeast and South Asia | 33.2 | 153.6 |
| Rest of world | 114.0 | 355.4 |
| Region, country, or economy | Percent |
|---|---|
| United States | 24 |
| EU-27 | 17 |
| China | 29 |
| South Korea and Japan | 9 |
| Other East-Southeast and South Asia | 7 |
| Rest of world | 14 |
EU = European Union; PPP = purchasing power parity.
Note(s):
Other East-Southeast and South Asia include Brunei, Cambodia, India, Indonesia, Malaysia, Mongolia, Myanmar, Nepal, Pakistan, Philippines, Singapore, Sri Lanka, Taiwan, Thailand, and Vietnam.
Source(s):
National Center for Science and Engineering Statistics, National Patterns of R&D Resources (2019–20 edition); Organisation for Economic Co-operation and Development, Main Science and Technology Indicators (September 2021 edition); United Nations Educational, Scientific and Cultural Organization, Institute for Statistics, Science Technology and Innovation data set (March 2021 release).
Science and Engineering Indicators
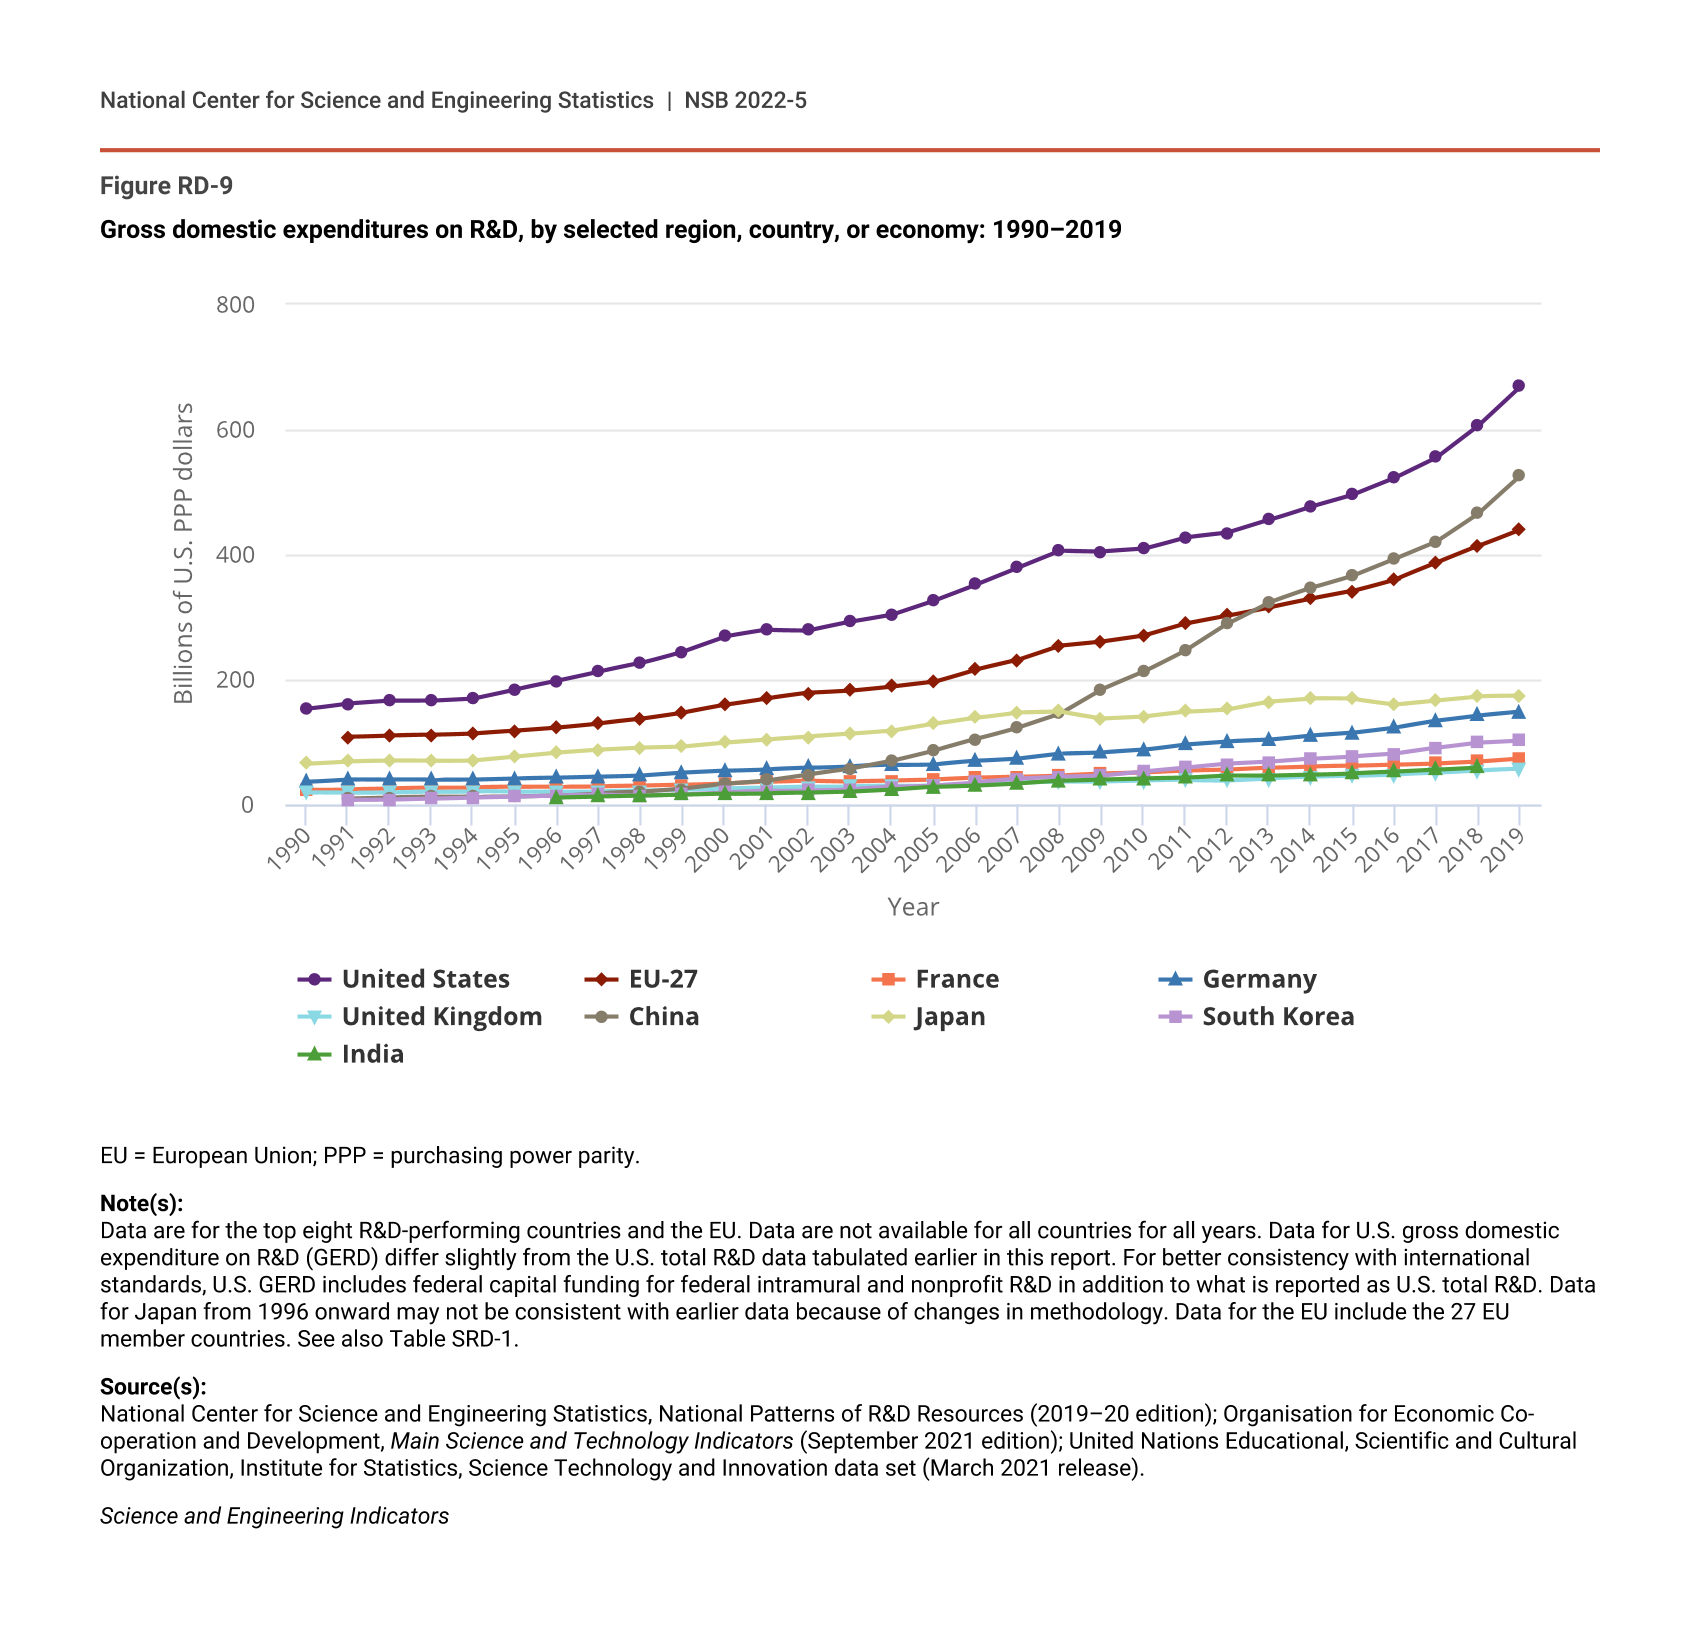
The United States remains the leader among the world’s R&D-performing nations; its rate of increase in R&D expenditures has averaged 4.3% over the 2000–10 period and 5.6% in 2010–19 (Figure RD-9; Table RD-6; Table SRD-1). R&D expenditures in China continue to increase at the world’s fastest pace. The rate of China’s increase in R&D performance has been remarkably high for many years, although it has slowed down in the last decade, averaging 10.6% annually over the 2010–19 period compared to 20.5% over the 2000–10 period.
Gross domestic expenditures on R&D, by selected region, country, or economy: 1990–2019
| Year | United States | EU-27 | France | Germany | United Kingdom | China | Japan | South Korea | India |
|---|---|---|---|---|---|---|---|---|---|
| 1990 | 152.4 | NA | 23.3 | 35.9 | 18.9 | NA | 65.4 | NA | NA |
| 1991 | 161.4 | 108.0 | 24.4 | 40.0 | 18.6 | 9.1 | 69.2 | 7.0 | NA |
| 1992 | 165.8 | 110.3 | 25.4 | 39.7 | 18.8 | 10.7 | 70.0 | 8.0 | NA |
| 1993 | 166.1 | 111.5 | 26.3 | 39.1 | 20.0 | 11.9 | 69.8 | 9.5 | NA |
| 1994 | 169.6 | 113.7 | 26.9 | 39.4 | 20.9 | 12.5 | 70.5 | 11.5 | NA |
| 1995 | 184.1 | 118.1 | 27.7 | 41.0 | 19.6 | 12.8 | 76.6 | 13.1 | NA |
| 1996 | 197.8 | 123.1 | 28.3 | 42.2 | 20.1 | 14.1 | 83.0 | 14.8 | 10.6 |
| 1997 | 212.5 | 129.6 | 28.6 | 44.1 | 20.7 | 17.8 | 87.8 | 16.2 | 12.1 |
| 1998 | 226.2 | 136.6 | 29.4 | 46.1 | 21.4 | 19.7 | 91.1 | 14.6 | 13.3 |
| 1999 | 245.0 | 146.6 | 31.0 | 50.7 | 23.3 | 24.9 | 92.8 | 15.8 | 15.1 |
| 2000 | 268.6 | 158.9 | 33.3 | 53.9 | 25.2 | 32.9 | 98.9 | 18.5 | 16.8 |
| 2001 | 279.1 | 169.3 | 36.1 | 56.2 | 26.3 | 38.4 | 103.8 | 21.3 | 17.5 |
| 2002 | 278.4 | 178.1 | 38.3 | 58.6 | 27.9 | 47.9 | 108.2 | 22.5 | 18.1 |
| 2003 | 292.2 | 181.8 | 37.1 | 61.0 | 28.6 | 56.8 | 112.4 | 24.1 | 19.8 |
| 2004 | 303.8 | 188.6 | 38.1 | 62.9 | 29.4 | 69.7 | 117.5 | 27.9 | 23.1 |
| 2005 | 326.2 | 196.3 | 39.5 | 64.0 | 30.6 | 86.2 | 128.7 | 30.6 | 27.9 |
| 2006 | 351.7 | 216.3 | 42.3 | 69.5 | 33.3 | 104.7 | 138.7 | 35.4 | 30.4 |
| 2007 | 378.5 | 231.5 | 44.2 | 73.4 | 35.2 | 123.3 | 147.5 | 40.6 | 33.6 |
| 2008 | 405.4 | 254.2 | 46.6 | 81.2 | 36.5 | 145.1 | 148.7 | 43.9 | 37.6 |
| 2009 | 404.2 | 260.8 | 49.7 | 82.8 | 36.5 | 184.1 | 137.4 | 45.8 | 39.7 |
| 2010 | 408.5 | 270.4 | 50.9 | 87.0 | 37.6 | 212.1 | 140.6 | 52.2 | 41.2 |
| 2011 | 427.1 | 289.7 | 53.6 | 95.8 | 38.8 | 246.5 | 148.4 | 58.4 | 42.4 |
| 2012 | 434.4 | 302.4 | 55.1 | 100.5 | 38.5 | 289.2 | 152.3 | 64.9 | 45.8 |
| 2013 | 455.1 | 315.6 | 58.4 | 102.9 | 41.5 | 323.4 | 164.7 | 68.2 | 45.8 |
| 2014 | 477.0 | 329.1 | 60.6 | 109.6 | 43.8 | 346.3 | 169.6 | 73.1 | 47.6 |
| 2015 | 495.9 | 341.6 | 61.6 | 114.1 | 45.7 | 366.1 | 168.5 | 76.9 | 49.6 |
| 2016 | 522.6 | 360.1 | 63.7 | 122.5 | 48.1 | 393.0 | 160.3 | 80.8 | 51.8 |
| 2017 | 555.1 | 386.7 | 65.7 | 133.7 | 50.8 | 420.8 | 166.6 | 90.3 | 55.1 |
| 2018 | 606.2 | 413.7 | 68.6 | 142.1 | 54.2 | 465.5 | 172.8 | 99.0 | 58.7 |
| 2019 | 668.4 | 440.3 | 73.3 | 148.1 | 56.9 | 525.7 | 173.3 | 102.5 | NA |
EU = European Union; PPP = purchasing power parity.
Note(s):
Data are for the top eight R&D-performing countries and the EU. Data are not available for all countries for all years. Data for U.S. gross domestic expenditure on R&D (GERD) differ slightly from the U.S. total R&D data tabulated earlier in this report. For better consistency with international standards, U.S. GERD includes federal capital funding for federal intramural and nonprofit R&D in addition to what is reported as U.S. total R&D. Data for Japan from 1996 onward may not be consistent with earlier data because of changes in methodology. Data for the EU include the 27 EU member countries. See also Table SRD-1.
Source(s):
National Center for Science and Engineering Statistics, National Patterns of R&D Resources (2019–20 edition); Organisation for Economic Co-operation and Development, Main Science and Technology Indicators (September 2021 edition); United Nations Educational, Scientific and Cultural Organization, Institute for Statistics, Science Technology and Innovation data set (March 2021 release).
Science and Engineering Indicators
Comparative growth rates for gross domestic expenditures on R&D and gross domestic product, top R&D-performing countries: 2000–10 and 2010–19
GDP = gross domestic product; GERD = gross domestic expenditure on R&D; PPP = purchasing power parity.
a Data for U.S. GERD differ slightly from the U.S. total R&D data tabulated earlier in this report. For better consistency with international standards, U.S. GERD includes federal capital funding for federal intramural and nonprofit R&D in addition to what is reported as U.S. total R&D.
b Most recent data for India are 2018. The listed growth rates for India for both GERD and GDP are 2010–18.
Note(s):
Table shows the top eight R&D-performing countries in 2019. The growth rates are calculated as compound average annual rates. Year of data is listed in parentheses. By way of comparison, the National Center for Science and Engineering Statistics estimates that the average annual pace of growth of the global total of R&D was 6.9% for 2000–10 and 6.2% for 2010–19.
Source(s):
National Center for Science and Engineering Statistics, National Patterns of R&D Resources (2019–20 edition); Organisation for Economic Co-operation and Development, Main Science and Technology Indicators (September 2021 edition); United Nations Educational, Scientific and Cultural Organization, Institute for Statistics, Science Technology and Innovation data set (March 2021 release).
Science and Engineering Indicators
The latest data show a more pronounced gap in R&D expenditures between the United States and China than previously measured. Indicators 2020 reported China’s R&D expenditures for 2017 at $496.0 billion, or 90% of the U.S. level of $549.0 billion (NSB Indicators 2020: Figure 4-7). In comparison, current data place China’s level of annual total R&D expenditures in 2017 at $420.8 billion, or 76% of the U.S. level of $555.1 billion. This reset in China’s R&D expenditure levels stems entirely from the conversion of China’s R&D data to U.S. PPP dollars following the latest release of PPP data by the International Comparison Program (ICP) at the World Bank. This release included benchmark PPP data for the new reference year 2017, revised PPP data for reference year 2011, and annual PPPs for non-benchmark years (2012–16). According to OECD (2020), the revised PPPs for China imply a higher cost of performing R&D because China’s relative price of investment had been previously underestimated. In addition to the reset in China’s R&D expenditure levels, the U.S. R&D expenditure total for 2017 was also revised upward by several billions of dollars as a result of a number of revisions. Even so, China continues to move closer to the United States (Figure RD-9). China’s total R&D expenditures in 2019 were 79% of the U.S. level.
Among other top R&D-performing Asian countries, the rise in R&D expenditures in South Korea has also been quite high, averaging 10.9% annually over 2000–10 and 7.8% for 2010–19 (Figure RD-9; Table RD-6; Table SRD-1). India’s increase in R&D expenditures averaged 9.4% annually over 2000–10 and 4.4% for 2010–19. Japan’s corresponding increases of R&D have been considerably slower, at 3.6% and 2.4%, respectively.
Total R&D expenditures by the EU-27 nations have been increasing at an annual average rate of about 5.5% over both 2000–10 and 2010–19, with Germany at 4.9% and 6.1% and France at 4.3% and 4.1%, respectively (Table SRD-1). Over the same periods, the R&D expenditures in the United Kingdom have been increasing at 4.1% and 4.7%, respectively.
Patterns and Trends in National R&D Intensity
Country Patterns in National R&D Intensity, 2019
Despite ranking at the top of the R&D-performing countries by total R&D expenditures, the United States ranked ninth in national R&D intensity (the GERD-to-GDP ratio) among the economies tracked by OECD and UNESCO data (Table RD-5). The United States is one of ten countries overall and one of five top R&D-performing countries with R&D intensities above 3.0% (Figure RD-6; Table RD-5). Other top R&D-performing countries with R&D intensities above 3.0% are Japan (3.20%), Germany (3.19%), and South Korea (4.64%).
Israel and South Korea have the highest R&D intensities across all countries. Israel continues to hold the top spot, with an R&D intensity of 4.93% (Table RD-5). Israel, however, ranks 19th by total R&D expenditures. South Korea (4.64%) is second and the only country among the largest R&D-performing countries with an R&D intensity above 4.50%. Taiwan comes in third (3.49%), followed by Sweden (3.39%). Other countries with comparatively high R&D intensity ratios are Austria (3.13%) and Switzerland (3.18%). The R&D intensities of the remaining top R&D performers are as follows: China at 2.23%, France at 2.20%, the United Kingdom at 1.76%, and India at 0.65%.
Trends in National R&D Intensity
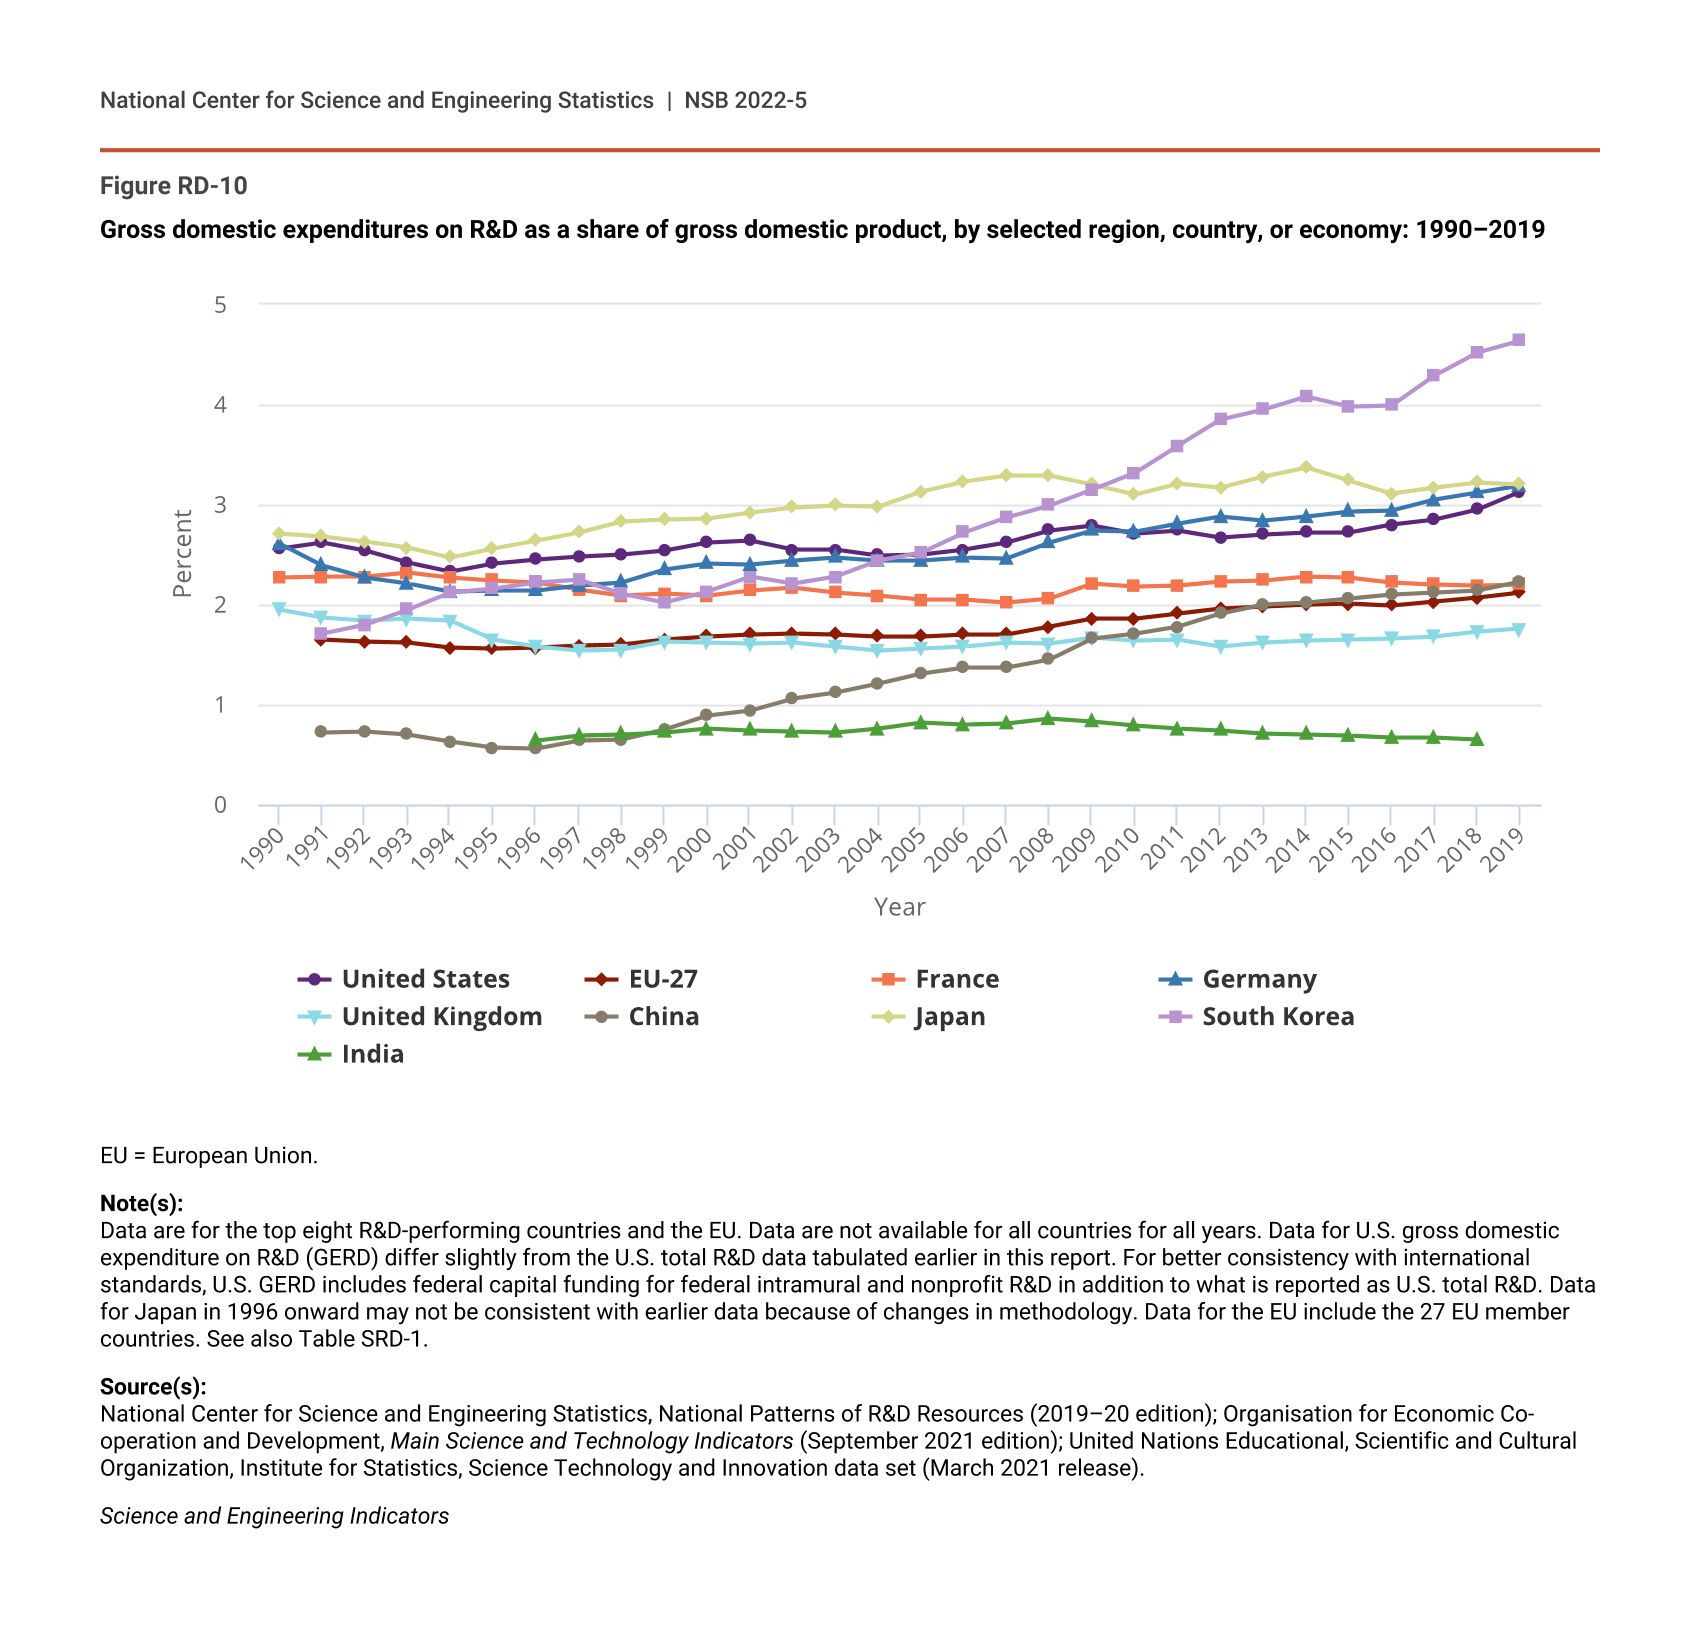
R&D intensity increased across several of the top R&D-performing countries in 2019 (Figure RD-10). U.S. R&D intensity has ranged from 2.5% to under 3.0% since 2000 and, for the first time, reached 3.13% in 2019 (Figure RD-10; Table SRD-1). The U.S. rank in this indicator has changed over time, fluctuating between 8th and 11th (NSB Indicators 2012, Indicators 2014, Indicators 2016, Indicators 2018, Indicators 2020). Despite historically high U.S. R&D intensity levels, these rank changes are not surprising as other countries have been expanding their R&D efforts.
Gross domestic expenditures on R&D as a share of gross domestic product, by selected region, country, or economy: 1990–2019
| Year | United States | EU-27 | France | Germany | United Kingdom | China | Japan | South Korea | India |
|---|---|---|---|---|---|---|---|---|---|
| 1990 | 2.56 | NA | 2.27 | 2.61 | 1.95 | NA | 2.71 | NA | NA |
| 1991 | 2.62 | 1.65 | 2.28 | 2.39 | 1.87 | 0.72 | 2.68 | 1.71 | NA |
| 1992 | 2.54 | 1.63 | 2.28 | 2.27 | 1.84 | 0.73 | 2.63 | 1.80 | NA |
| 1993 | 2.42 | 1.62 | 2.32 | 2.21 | 1.86 | 0.70 | 2.57 | 1.95 | NA |
| 1994 | 2.33 | 1.57 | 2.27 | 2.13 | 1.84 | 0.63 | 2.47 | 2.12 | NA |
| 1995 | 2.41 | 1.56 | 2.24 | 2.14 | 1.65 | 0.57 | 2.56 | 2.16 | NA |
| 1996 | 2.45 | 1.57 | 2.22 | 2.14 | 1.58 | 0.56 | 2.64 | 2.22 | 0.64 |
| 1997 | 2.48 | 1.59 | 2.15 | 2.19 | 1.54 | 0.64 | 2.72 | 2.25 | 0.69 |
| 1998 | 2.50 | 1.60 | 2.09 | 2.22 | 1.55 | 0.65 | 2.83 | 2.11 | 0.70 |
| 1999 | 2.54 | 1.65 | 2.11 | 2.35 | 1.63 | 0.75 | 2.85 | 2.02 | 0.72 |
| 2000 | 2.62 | 1.68 | 2.09 | 2.41 | 1.62 | 0.89 | 2.86 | 2.13 | 0.76 |
| 2001 | 2.64 | 1.70 | 2.14 | 2.40 | 1.61 | 0.94 | 2.92 | 2.28 | 0.74 |
| 2002 | 2.55 | 1.71 | 2.17 | 2.44 | 1.62 | 1.06 | 2.97 | 2.21 | 0.73 |
| 2003 | 2.55 | 1.70 | 2.12 | 2.47 | 1.58 | 1.12 | 2.99 | 2.28 | 0.72 |
| 2004 | 2.49 | 1.68 | 2.09 | 2.44 | 1.54 | 1.21 | 2.98 | 2.44 | 0.76 |
| 2005 | 2.50 | 1.68 | 2.05 | 2.44 | 1.56 | 1.31 | 3.13 | 2.52 | 0.82 |
| 2006 | 2.55 | 1.70 | 2.05 | 2.47 | 1.58 | 1.37 | 3.23 | 2.72 | 0.80 |
| 2007 | 2.62 | 1.70 | 2.02 | 2.46 | 1.62 | 1.37 | 3.29 | 2.87 | 0.81 |
| 2008 | 2.74 | 1.78 | 2.06 | 2.62 | 1.61 | 1.45 | 3.29 | 2.99 | 0.86 |
| 2009 | 2.79 | 1.86 | 2.21 | 2.74 | 1.67 | 1.66 | 3.20 | 3.15 | 0.83 |
| 2010 | 2.71 | 1.86 | 2.18 | 2.73 | 1.64 | 1.71 | 3.10 | 3.32 | 0.79 |
| 2011 | 2.74 | 1.91 | 2.19 | 2.81 | 1.65 | 1.78 | 3.21 | 3.59 | 0.76 |
| 2012 | 2.67 | 1.96 | 2.23 | 2.88 | 1.58 | 1.91 | 3.17 | 3.85 | 0.74 |
| 2013 | 2.70 | 1.98 | 2.24 | 2.84 | 1.62 | 2.00 | 3.28 | 3.95 | 0.71 |
| 2014 | 2.72 | 2.00 | 2.28 | 2.88 | 1.64 | 2.02 | 3.37 | 4.08 | 0.70 |
| 2015 | 2.72 | 2.01 | 2.27 | 2.93 | 1.65 | 2.06 | 3.24 | 3.98 | 0.69 |
| 2016 | 2.80 | 1.99 | 2.22 | 2.94 | 1.66 | 2.10 | 3.11 | 3.99 | 0.67 |
| 2017 | 2.85 | 2.03 | 2.20 | 3.05 | 1.68 | 2.12 | 3.17 | 4.29 | 0.67 |
| 2018 | 2.95 | 2.07 | 2.19 | 3.12 | 1.73 | 2.14 | 3.22 | 4.52 | 0.65 |
| 2019 | 3.13 | 2.12 | 2.20 | 3.19 | 1.76 | 2.23 | 3.20 | 4.64 | NA |
EU = European Union.
Note(s):
Data are for the top eight R&D-performing countries and the EU. Data are not available for all countries for all years. Data for U.S. gross domestic expenditure on R&D (GERD) differ slightly from the U.S. total R&D data tabulated earlier in this report. For better consistency with international standards, U.S. GERD includes federal capital funding for federal intramural and nonprofit R&D in addition to what is reported as U.S. total R&D. Data for Japan in 1996 onward may not be consistent with earlier data because of changes in methodology. Data for the EU include the 27 EU member countries. See also Table SRD-1.
Source(s):
National Center for Science and Engineering Statistics, National Patterns of R&D Resources (2019–20 edition); Organisation for Economic Co-operation and Development, Main Science and Technology Indicators (September 2021 edition); United Nations Educational, Scientific and Cultural Organization, Institute for Statistics, Science Technology and Innovation data set (March 2021 release).
Science and Engineering Indicators
R&D intensity has been rising gradually for European countries. For EU-27 member countries, R&D intensity has increased from about 1.68% in 2000 to 2.12% in 2019 (Figure RD-10; Table SRD-1). For the largest R&D performers among the EU-27 countries, Germany’s ratio has risen the most over this period, from 2.41% to 3.19%, while France’s ratio has had modest increases, from 2.09% to 2.20%. The R&D intensity for the United Kingdom has also increased modestly from 1.62% to 1.76%.
Among top R&D-performing Asian countries, China and South Korea have had the largest increases in R&D intensity in the last two decades (Figure RD-10; Table SRD-1). China’s ratio more than doubled, from 0.89% in 2000 to 2.23% in 2019. South Korea’s ratio has also more than doubled from 2.13% in 2000 to 4.64% in 2019; its growth in R&D intensity has been particularly rapid since the late 1990s (Figure RD-10). Japan’s R&D intensity has fluctuated around 3.10%–3.30% for most of the last decade, having increased from 2.86% in 2000.
Comparisons of the Composition of Country R&D Performance and Funding
Trends in Composition, by Sector
The business sector dominates R&D performance in seven of the eight top R&D-performing nations (Table RD-7). This sector accounted for three-fourths of R&D performance in the United States (75%) in 2019. Business shares were even larger among the leading Asian R&D performers: China (76%), Japan (79%), and South Korea (80%). The European countries had comparatively lower shares, with Germany at 69%, France at 66%, and the United Kingdom at 67%. India’s business share was the lowest at 37%.
Gross expenditures on R&D for selected countries, by performing sector and source of funds: 2019 or most recent year
na = not applicable; country does not recognize the category or does not report the data item. NA = not available.
GERD = gross domestic expenditure on R&D; PPP = purchasing power parity.
a The private nonprofit sector comprises all nonprofit institutions serving households except those classified as part of the higher education sector.
b Data for U.S. GERD differ slightly from the U.S. total R&D data tabulated earlier in this report. For better consistency with international standards, U.S. GERD includes federal capital funding for federal intramural and nonprofit R&D in addition to what is reported as U.S. total R&D. The data for U.S. funding from the rest of the world include funding for business R&D and academic R&D.
c For India, the most recent year of available data on GERD and the distribution of R&D performance is 2018, whereas the most recent year available for data on distribution of R&D expenditures by source of funds is 2017.
d For the United Kingdom, the most recent year available for data on distribution of R&D expenditures by source of funds is 2018.
Note(s):
Table shows the top eight R&D-performing countries in 2019. Year of data is listed in parentheses. Percentages may not add to 100% because of rounding. Germany's expenditures of the nonprofit sector are included in data for other performing sectors. Classification of sectors follows Organisation for Economic Co-operation and Development surveys.
Source(s):
National Center for Science and Engineering Statistics, National Patterns of R&D Resources (2019–20 edition); Organisation for Economic Co-operation and Development, Main Science and Technology Indicators (September 2021 edition); United Nations Educational, Scientific and Cultural Organization, Institute for Statistics, Science Technology and Innovation data set (March 2021 release).
Science and Engineering Indicators
The government sector performed more than half of India’s R&D (56%) (Table RD-7). Government-performed R&D ranged from about 7% to 15% for the remaining top eight R&D-performing countries, with China (15%) and Germany (14%) on the higher end and the United Kingdom (7%) and Japan (8%) on the lower end. The higher education sector accounted for 20% or more of R&D performance in France (20%) and the United Kingdom (23%) and for 7%–17% of R&D performance in the remaining top eight countries. India (7%), China (8%), and South Korea (8%) had the lowest shares of R&D performance by this sector.
The business sector is also the predominant source of R&D funding for most top R&D-performing countries; government is the second-largest source (Table RD-7). The business sector accounted for 55%–79% of R&D funding, while the government sector accounted for 15%–33% among the top eight countries, except for India. The government sector is the largest source of R&D funding in India (63%), with the rest (37%) funded by the business sector.
Funding from rest of world refers to funding from businesses, universities, governments, nonprofits, and other organizations located outside of the country. The United Kingdom is the most notable in this category, with about 14% of R&D funding in 2018 coming from foreign sources. Foreign funding was also sizable in France, Germany, and the United States (around 7%–8%), while the rest of the top R&D-performing countries had much lower shares for this funding source.
The distributions of R&D performance and funding have been relatively stable for these countries since 2011 (NSB Indicators 2012, Indicators 2014, Indicators 2016, Indicators 2018, Indicators 2020).
Trends in Composition, by Type of R&D
Cross-national comparisons of R&D levels and shares of national R&D performance devoted to basic research, applied research, and experimental development provide useful insights into how countries prioritize their allocation of resources for R&D.
France leads the top eight R&D-performing countries in the share of basic research (23%), although France’s R&D expenditures spent on basic research ($15.6 billion) are relatively low compared to other top R&D-performing countries (Table RD-8). In contrast, China’s basic research share is the lowest among the top R&D-performing countries (6%), but the R&D expenditures for basic research in China ($31.7 billion) are higher than in France. By volume of spending, the United States leads performance of global basic research with $102.9 billion in R&D expenditures in 2019, which accounts for 15% of its total R&D expenditures.
Gross expenditures on R&D for selected countries, by type of R&D: 2019 or most recent year
NA = not available.
GERD = gross domestic expenditure on R&D; nec = not elsewhere classified; PPP = purchasing power parity.
a Expressed as a share of GDP, the country expenditures for basic research are United States (0.49%), China (0.12%), Japan (0.41%), Germany (NA), South Korea (0.64%), France (0.50%), India (0.09%), and United Kingdom (0.32%).
b This category includes capital expenditures nec. Capital expenditures are the annual gross amount paid for the acquisition of fixed assets such as R&D plant and equipment.
c Data for U.S. GERD differ slightly from the U.S. total R&D data tabulated earlier in this report. For better consistency with international standards, U.S. GERD includes federal capital funding for federal intramural and nonprofit R&D in addition to what is reported as U.S. total R&D.
Note(s):
Table shows the top eight R&D-performing countries in 2019. Year of data is listed in parentheses. Detail may not add to total because of rounding. Data are not presently available for Germany.
Source(s):
National Center for Science and Engineering Statistics, National Patterns of R&D Resources (2019–20 edition); Organisation for Economic Co-operation and Development, Main Science and Technology Indicators (September 2021 edition); United Nations Educational, Scientific and Cultural Organization, Institute for Statistics, Science Technology and Innovation data set (March 2021 release).
Science and Engineering Indicators
The United Kingdom and France have the largest shares of R&D expenditures devoted to applied research among these countries (each above 40%). Shares for the remaining countries range from 11% (China) to 22%–23% (India and South Korea). By volume of spending, the United States also dominates this category with $132.0 billion of applied research spending in 2019, which accounts for 20% of its total R&D expenditures. The overall volume of spending by the second- and third-ranked countries in this category are comparatively far behind: China, at $59.3 billion, and Japan, at $32.2 billion.
China has the highest share of experimental development by far—83% of its R&D total in 2019, or $434.7 billion of spending in this category. For the United States, the experimental development share was 65%, although the amount of spending was virtually identical to China ($432.0 billion). Other countries with comparatively high shares for experimental development are Japan (65%) and South Korea (63%); the dollar amounts of these countries’ performances, however, were well below the levels for China and the United States.
The R&D expenditure shares by type of R&D reported by the countries have been largely stable over the past several years (NSB Indicators 2012, Indicators 2014, Indicators 2016, Indicators 2018, Indicators 2020).