 An official website of the United States government
 U.S. Business R&D
The business sector plays an integral role in the U.S. R&D system. It is diverse in its industrial composition, products, production processes, and input requirements, including requirements for R&D. It drives many of the nation’s R&D activities as the largest performer and funder of U.S. R&D. Importantly, the business sector is also a major contributor to U.S. basic research.
This section provides a more detailed account of the R&D performance and funding roles of the business sector, and it is organized in two parts. It first discusses key characteristics of U.S. business R&D, including R&D performance and R&D intensity by top R&D-performing industries, sources of funding, and a breakdown of R&D performance by company size and by type of R&D. It then contrasts the U.S. business R&D data with broadly comparable data for the largest R&D-performing countries.
Key Characteristics of Domestic Business R&D Performance
U.S. business R&D is the R&D performed by companies that are resident in the United States. It includes the R&D performed by the company and paid for by the company itself (from company-owned, U.S.-located units or from subsidiaries overseas). It also includes the R&D performed by the company and paid for by others, such as other companies (domestic or foreign, including parent companies of foreign-owned subsidiaries located in the United States), the U.S. federal government, nonfederal governments (state and local or foreign), and nonprofit or other organizations (domestic or foreign).
The primary source for U.S. business R&D data is NCSES’s Business Enterprise Research and Development Survey (BERD) and its predecessors, the Business Research and Development Survey (BRDS) and the Business R&D and Innovation Survey (BRDIS). The BERD sample represents all for-profit, nonfarm companies with 10 or more domestic employees, publicly or privately held in the United States that perform or fund R&D domestically or abroad. Data on R&D activities of microbusinesses—businesses with less than 10 employees—are collected by NCSES’s Annual Business Survey (ABS). The ABS was recently established to collect annual data on microbusiness R&D as well as data on innovation, intellectual property, technology, business owners, and business structure for all businesses located in the United States.
The data presented in this section classify a company’s total R&D into a single industry according to the dominant business activity for domestic R&D performance. For a company with R&D expenses in multiple lines of business, all R&D expenses are assigned to the industry with the largest R&D expenditures. Most companies, however, perform R&D in one line of business (Shackelford 2012; Jankowski and Shackelford 2019).
Analyses of U.S. business R&D performance in the last edition (NSB Indicators 2020) of this report focused solely on R&D performed by businesses with 10 or more employees. These businesses perform nearly 99% of U.S. business R&D, and their R&D performance data are comparable with the international business statistics discussed later in the section. Furthermore, until recently, there were no data consistently collected on microbusiness R&D.
Microbusinesses are a small but important segment of the business sector due to their contribution to economic growth and innovation. While the focus of the analysis remains on the R&D performance by larger businesses, this report provides new analysis on microbusiness R&D for a more comprehensive account of the R&D activities of the business sector.
Industries That Perform the Most U.S. Business R&D
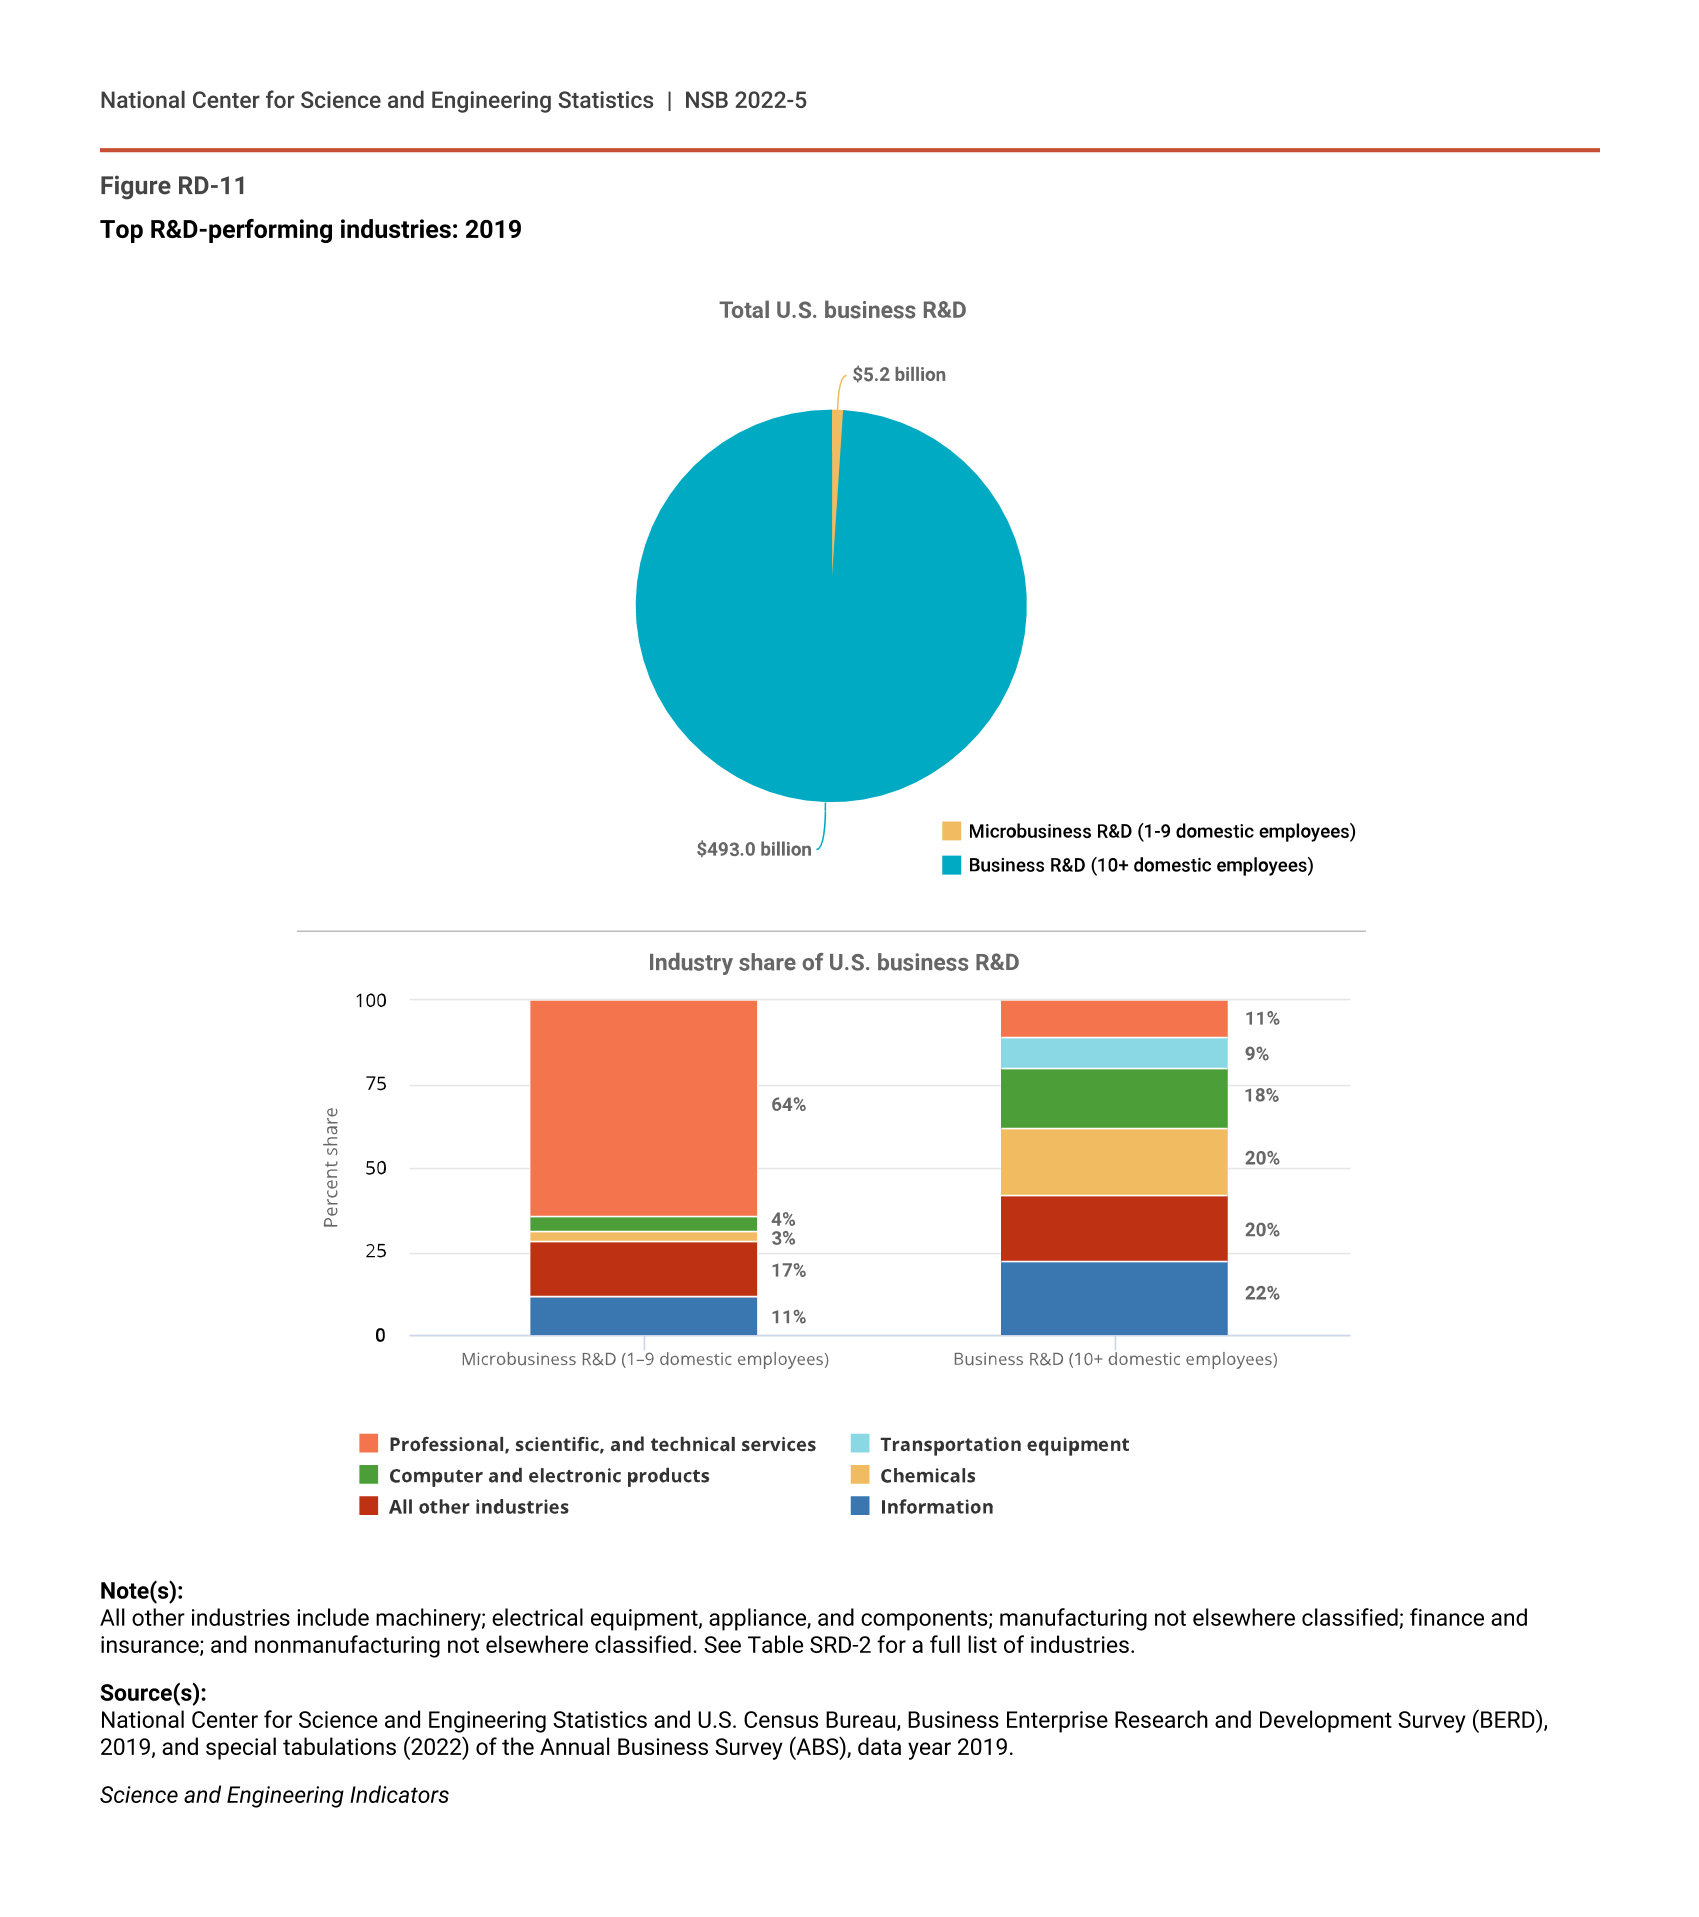
Overall, the U.S. business sector performed $498.2 billion of R&D in 2019. The total U.S. business R&D performance consisted of $493.0 billion of R&D performed by businesses with 10 or more employees and $5.2 billion of R&D performed by microbusinesses (Figure RD-11). In the next several paragraphs, the analysis focuses on industry composition and trends of R&D performed by businesses with 10 or more employees, followed by a discussion of the industry composition of microbusiness R&D.
Top R&D-performing industries: 2019
Note(s):
All other industries include machinery; electrical equipment, appliance, and components; manufacturing not elsewhere classified; finance and insurance; and nonmanufacturing not elsewhere classified. See Table SRD-2 for a full list of industries.
Source(s):
National Center for Science and Engineering Statistics and U.S. Census Bureau, Business Enterprise Research and Development Survey (BERD), 2019, and special tabulations (2022) of the Annual Business Survey (ABS), data year 2019.
Science and Engineering Indicators
Almost 60% of the R&D performed by businesses with 10 or more employees was in the manufacturing sector, with the remaining 40% in the nonmanufacturing sector, which includes services (Table RD-9). Within these sectors, business R&D is concentrated in a few industries. Five industries accounted for 80% of the R&D performance by these businesses in 2019 (Figure RD-11; Table RD-9).
Funds spent for business R&D performed in the United States, by source of funds and selected industry: 2019
D = suppressed to avoid disclosure of confidential information; i = more than 50% of the estimate is a combination of imputation and reweighting to account for nonresponse.
NAICS = North American Industry Classification System; nec = not elsewhere classified.
a All R&D is the cost of R&D paid for and performed by the respondent company and paid for by others outside of the company and performed by the respondent company.
b Includes foreign subsidiaries of U.S. companies ($27.1 billion).
c Includes foreign parent companies of U.S. subsidiaries ($17.6 billion) and unaffiliated companies ($2.0 billion). Excludes funds from foreign subsidiaries to U.S. companies paid for through intercompany transactions ($27.1 billion).
d Includes U.S. state government agencies and laboratories (< $0.2 billion); U.S. universities, colleges, and academic researchers ($0.05 billion); and all other organizations located inside (< $0.8 billion) and outside the United States (< $0.05 billion).
Note(s):
Detail may not add to total because of rounding. Beginning in survey year 2018, companies that performed or funded less than $50,000 of R&D were excluded from tabulation. These companies in aggregate represented a very small share of total R&D expenditures in prior years. Had the companies under this threshold been included in the 2018 estimates, they would have contributed approximately $90 million to overall R&D expenditures. Industry classification was based on the dominant business code for domestic R&D performance, where available. For companies that did not report business codes, the classification used for sampling was assigned. Excludes data for federally funded research and development centers. An estimate range may be displayed in place of a single estimate to avoid disclosing operations of individual companies. The Business Enterprise Research and Development Survey includes only companies with 10 or more domestic employees.
Source(s):
National Center for Science and Engineering Statistics and U.S. Census Bureau, Business Enterprise Research and Development Survey, 2019.
Science and Engineering Indicators
- Chemicals manufacturing (North American Industry Classification System [NAICS] 325) accounted for nearly 20% ($97.1 billion) of business R&D performance, most of which was in the pharmaceuticals and medicines industry ($87.6 billion).
- Computer and electronic products manufacturing (NAICS 334) accounted for 18% ($86.7 billion) of business R&D performance.
- Transportation equipment manufacturing (NAICS 336, which includes the automobiles and aerospace industries) accounted for 9% ($45.4 billion) of business R&D performance.
- Information (NAICS 51) accounted for over 22% ($110.2 billion) of business R&D performance, about a third of which was in software publishing ($33.0 billion).
- Professional, scientific, and technical (PST) services (NAICS 54) accounted for 11% ($53.2 billion) of business R&D performance. Most of the R&D performed by the PST services industry was in scientific R&D services ($21.7 billion) and in computer systems design and related services ($21.0 billion).
Increases in R&D performed by businesses with 10 or more employees in recent years (2018 and 2019) have been large compared to earlier years (Table SRD-2). The $493.0 billion in R&D performance in 2019 represents a 12% increase (or $52 billion) over the 2018 level ($441.0 billion), and the latter is a 10% increase (or $41 billion) over the 2017 level ($400.1 billion). To put this into context, R&D performed by these businesses increased, on average, 5% annually from 2010 to 2017. Among the top R&D-performing industries, the largest increases in 2019 were in PST services, information, and chemicals manufacturing. R&D performance in the computer and electronic products and machinery manufacturing industries also increased. In contrast, R&D performance in the transportation equipment industry declined.
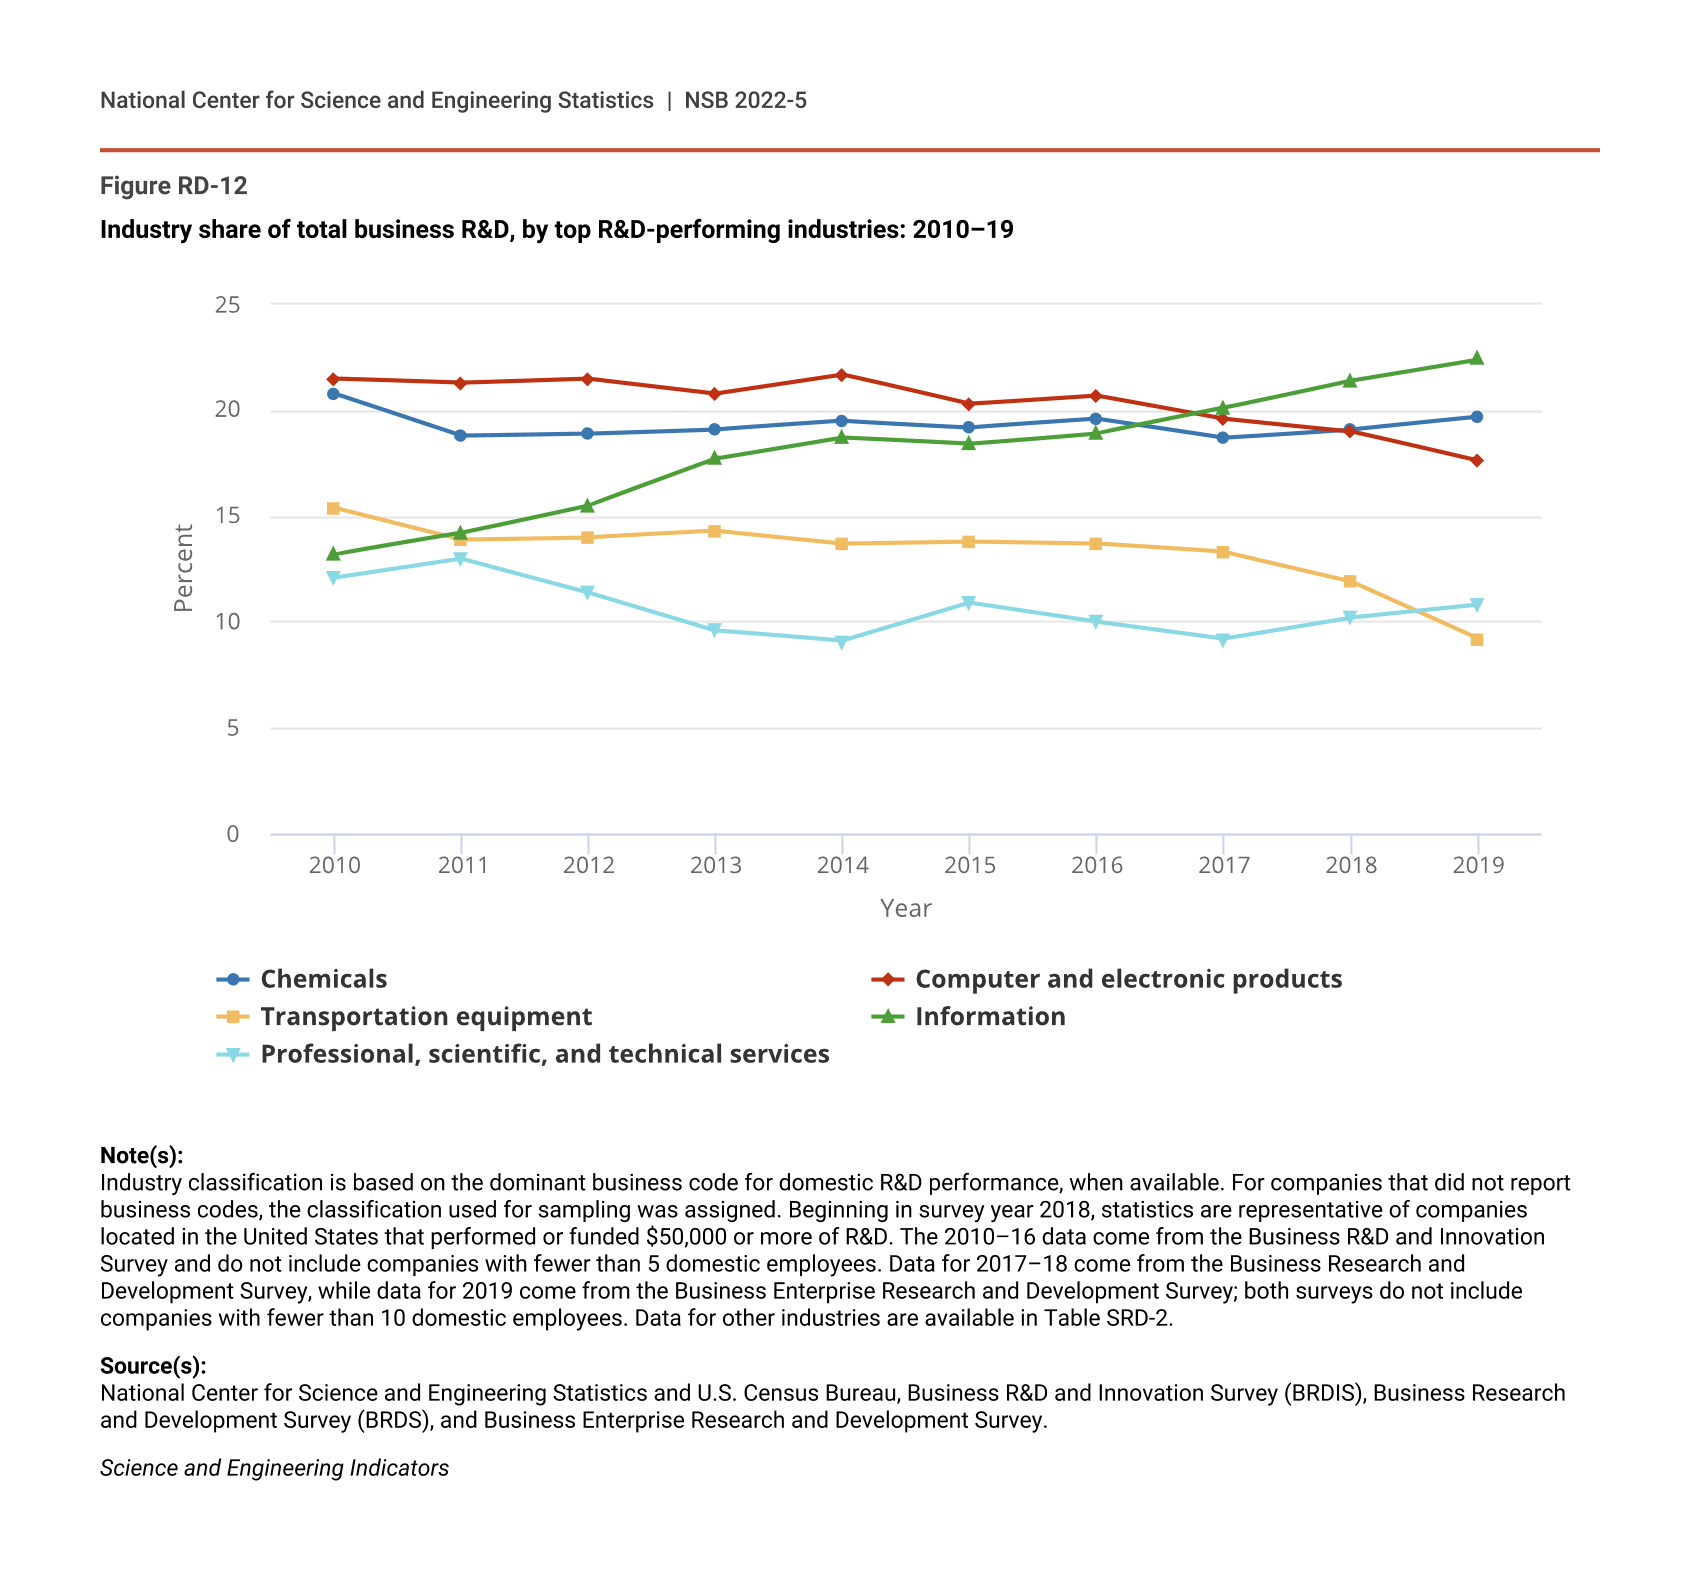
The distribution of R&D performed by businesses with 10 or more employees across industries has been stable for many industries since 2010 with a few notable exceptions (Figure RD-12; Table SRD-2). The industry share of total business R&D for the information industry increased by more than 9 percentage points during this period. In contrast, the share of the transportation equipment and computer and electronic products industries declined by 6 percentage points and 4 percentage points, respectively.
Industry share of total business R&D, by top R&D-performing industries: 2010–19
| Year | Chemicals | Computer and electronic products | Transportation equipment | Information | Professional, scientific, and technical services |
|---|---|---|---|---|---|
| 2010 | 20.8 | 21.5 | 15.4 | 13.2 | 12.1 |
| 2011 | 18.8 | 21.3 | 13.9 | 14.2 | 13.0 |
| 2012 | 18.9 | 21.5 | 14.0 | 15.5 | 11.4 |
| 2013 | 19.1 | 20.8 | 14.3 | 17.7 | 9.6 |
| 2014 | 19.5 | 21.7 | 13.7 | 18.7 | 9.1 |
| 2015 | 19.2 | 20.3 | 13.8 | 18.4 | 10.9 |
| 2016 | 19.6 | 20.7 | 13.7 | 18.9 | 10.0 |
| 2017 | 18.7 | 19.6 | 13.3 | 20.1 | 9.2 |
| 2018 | 19.1 | 19.0 | 11.9 | 21.4 | 10.2 |
| 2019 | 19.7 | 17.6 | 9.2 | 22.4 | 10.8 |
Note(s):
Industry classification is based on the dominant business code for domestic R&D performance, when available. For companies that did not report business codes, the classification used for sampling was assigned. Beginning in survey year 2018, statistics are representative of companies located in the United States that performed or funded $50,000 or more of R&D. The 2010–16 data come from the Business R&D and Innovation Survey and do not include companies with fewer than 5 domestic employees. Data for 2017–18 come from the Business Research and Development Survey, while data for 2019 come from the Business Enterprise Research and Development Survey; both surveys do not include companies with fewer than 10 domestic employees. Data for other industries are available in Table SRD-2.
Source(s):
National Center for Science and Engineering Statistics and U.S. Census Bureau, Business R&D and Innovation Survey (BRDIS), Business Research and Development Survey (BRDS), and Business Enterprise Research and Development Survey.
Science and Engineering Indicators
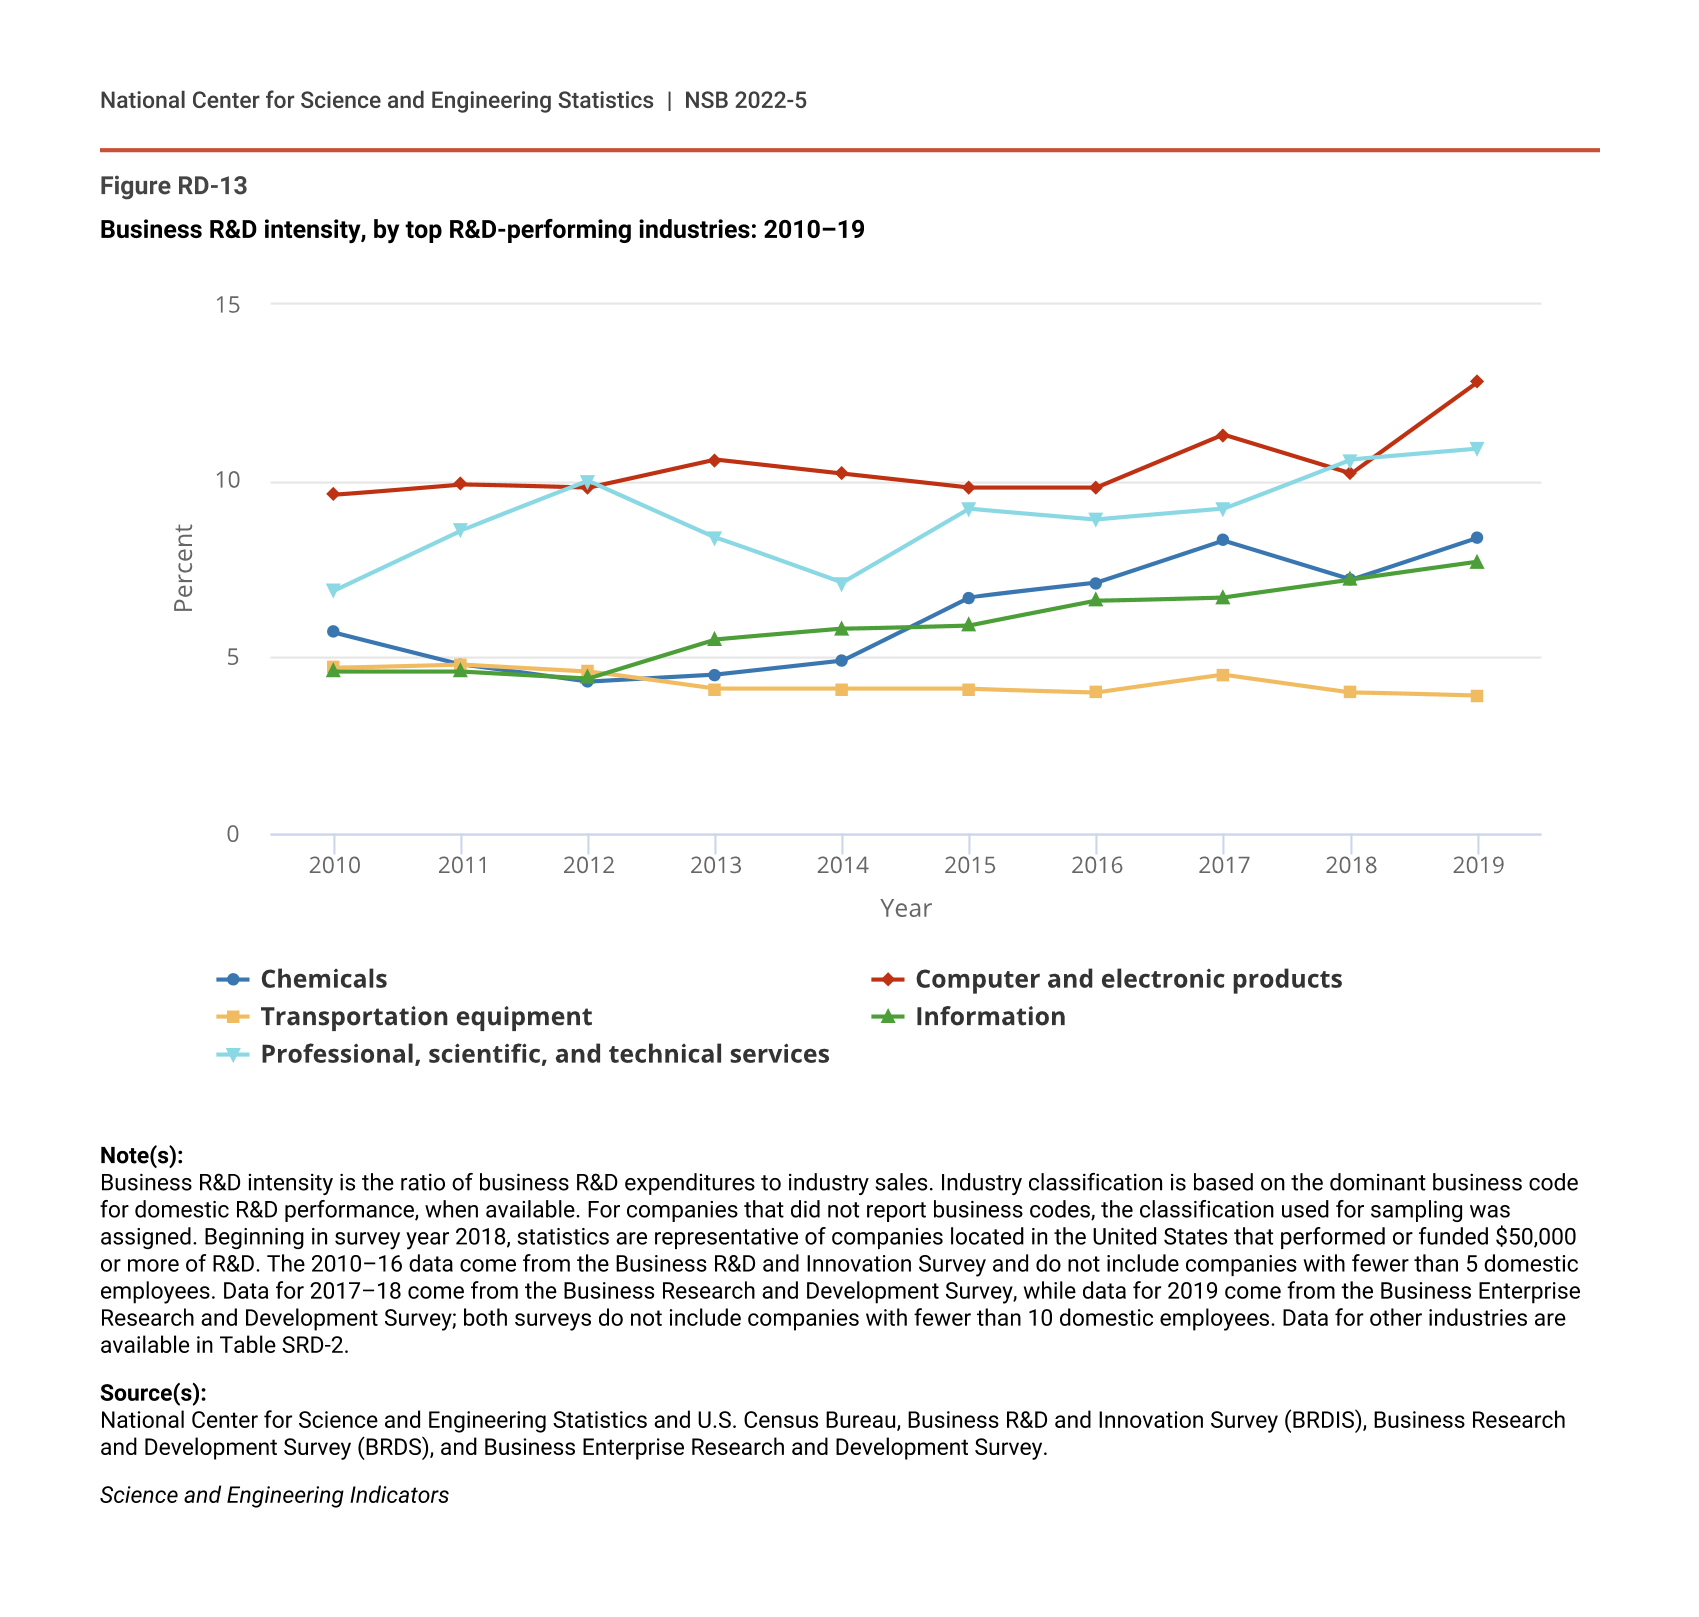
The top R&D-performing industries stand out not only by R&D performance levels but also by R&D intensities. Business R&D intensity—the share of a company’s sales spent on R&D activities—is a key indicator of R&D investment and varies widely across industries. For the businesses with 10 or more employees, R&D intensity across all industries averaged 4.4% in 2019 (Table RD-10).
Sales, R&D intensity, and employment for companies that performed or funded R&D, by selected industry: 2019
NAICS = North American Industry Classification System; nec = not elsewhere classified.
a Dollar values are for goods sold or services rendered by R&D-performing or R&D-funding companies located in the United States to customers outside of the company, including the U.S. federal government, foreign customers, and the company's foreign subsidiaries. Included are revenues from a company's foreign operations and subsidiaries and from discontinued operations. If a respondent company is owned by a foreign parent company, sales to the parent company and to affiliates not owned by the respondent company are included. Excluded are intracompany transfers, returns, allowances, freight charges, and excise, sales, and other revenue-based taxes.
b R&D intensity is the cost of domestic R&D paid for by the respondent company and others outside of the company and performed by the company divided by domestic net sales of companies that performed or funded R&D.
c Data recorded on 12 March represent employment figures for the year.
d Includes researchers, R&D managers, technicians, clerical staff, and others assigned to R&D groups.
Note(s):
Detail may not add to total because of rounding. Beginning in survey year 2018, companies that performed or funded less than $50,000 of R&D were excluded from tabulation. These companies in aggregate represented a very small share of total R&D expenditures in prior years. Had the companies under this threshold been included in the 2018 estimates, they would have contributed approximately $90 million to overall R&D expenditures. Estimates of aggregate sales and total domestic employment would have been similarly affected. Industry classification was based on the dominant business code for domestic R&D performance, where available. For companies that did not report business codes, the classification used for sampling was assigned. Excludes data for federally funded research and development centers. The Business Enterprise Research and Development Survey includes only companies with 10 or more domestic employees.
Source(s):
National Center for Science and Engineering Statistics and U.S. Census Bureau, Business Enterprise Research and Development Survey, 2019.
Science and Engineering Indicators
In comparison, R&D intensities for the top five R&D-performing industries were nearly double or more than the average R&D intensity except for transportation equipment manufacturing, which was near the average (Table RD-10). The transportation equipment manufacturing industry has a lower R&D intensity compared to other top R&D-performing industries, largely due to its composition. Only one of its underlying industries—the aerospace product and parts manufacturing—has a higher-than-average R&D intensity (6.5% in 2019). Among the detailed industries underlying the top five R&D-performing industries, scientific R&D services had the highest R&D intensity (26.7%). Software publishing, pharmaceuticals and medicines manufacturing, computer and electronic products manufacturing, and computer systems design and related services also had R&D intensities in the double digits.
R&D intensities of the top R&D-performing industries have increased since 2010, except for the transport equipment industry, whose R&D intensity has been relatively stable around 4% (Figure RD-13). The largest increase was in PST services, whose R&D intensity was 4 percentage points higher in 2019 compared to 2010, primarily due to an increase of nearly 13 percentage points in the R&D intensity of the scientific R&D services industry.
Business R&D intensity, by top R&D-performing industries: 2010–19
| Year | Chemicals | Computer and electronic products | Transportation equipment | Information | Professional, scientific, and technical services |
|---|---|---|---|---|---|
| 2010 | 5.7 | 9.6 | 4.7 | 4.6 | 6.9 |
| 2011 | 4.8 | 9.9 | 4.8 | 4.6 | 8.6 |
| 2012 | 4.3 | 9.8 | 4.6 | 4.4 | 10.0 |
| 2013 | 4.5 | 10.6 | 4.1 | 5.5 | 8.4 |
| 2014 | 4.9 | 10.2 | 4.1 | 5.8 | 7.1 |
| 2015 | 6.7 | 9.8 | 4.1 | 5.9 | 9.2 |
| 2016 | 7.1 | 9.8 | 4.0 | 6.6 | 8.9 |
| 2017 | 8.3 | 11.3 | 4.5 | 6.7 | 9.2 |
| 2018 | 7.2 | 10.2 | 4.0 | 7.2 | 10.6 |
| 2019 | 8.4 | 12.8 | 3.9 | 7.7 | 10.9 |
Note(s):
Business R&D intensity is the ratio of business R&D expenditures to industry sales. Industry classification is based on the dominant business code for domestic R&D performance, when available. For companies that did not report business codes, the classification used for sampling was assigned. Beginning in survey year 2018, statistics are representative of companies located in the United States that performed or funded $50,000 or more of R&D. The 2010–16 data come from the Business R&D and Innovation Survey and do not include companies with fewer than 5 domestic employees. Data for 2017–18 come from the Business Research and Development Survey, while data for 2019 come from the Business Enterprise Research and Development Survey; both surveys do not include companies with fewer than 10 domestic employees. Data for other industries are available in Table SRD-2.
Source(s):
National Center for Science and Engineering Statistics and U.S. Census Bureau, Business R&D and Innovation Survey (BRDIS), Business Research and Development Survey (BRDS), and Business Enterprise Research and Development Survey.
Science and Engineering Indicators
This distribution across industries differs considerably in terms of the R&D performed by microbusinesses, the businesses with less than 10 employees. Microbusinesses added $5.2 billion to U.S. business R&D in 2019 (Figure RD-11). Most microbusiness R&D performance was in the nonmanufacturing sector. This is in stark contrast to the manufacturing emphasis of the R&D performed by larger businesses. (Almost 60% of R&D performance by businesses with 10 or more employees was in the manufacturing sector in 2019.)
Three-quarters of all microbusiness R&D was performed by microbusinesses in the PST services and information services industries (Figure RD-11). Within these two industries, scientific R&D services and computer systems design and related services accounted for more than half of microbusiness R&D in 2019.
Sources of Funding for U.S. Business R&D
The R&D performed by businesses with 10 or more employees was funded primarily by companies’ own funds (87% in 2019) (Table RD-11). Most of the funds came from company units located in the United States (82%), with a small amount (6%) from companies’ foreign subsidiaries. The remaining (13%) was R&D performed by the company but paid for by others. The federal government, other domestic companies, and foreign-located companies (foreign parent and unaffiliated companies) each funded about 4% of business R&D performance in 2019.
Funds spent for business R&D performed in the United States, by source of funds: 2010–19
i = more than 50% of the estimate is a combination of imputation and reweighting to account for nonresponse.
a Includes companies located in the United States that performed or funded R&D. Data in this table represent an aggregate of all industries in the North American Industry Classification System codes 21–33 and 42–81.
b Parent companies of foreign-owned subsidiaries located in the United States.
c Includes U.S. state government agencies and laboratories, foreign agencies and laboratories, and all other organizations located inside and outside the United States.
d Consists of funds paid for by company-owned, U.S.-located units; domestically located companies; U.S. federal government; and all other organizations in the United States.
e Consists of funds paid by foreign-located subsidiaries, foreign parent, unaffiliated companies, and all other organizations outside of the United States.
Note(s):
Detail may not add to total because of rounding. Industry classification was based on the dominant business code for domestic R&D performance, where available. For companies that did not report business codes, the classification used for sampling was assigned. This table excludes data for federally funded R&D centers. Data for 2010–16 come from the National Center for Science and Engineering Statistics' (NCSES's) annual Business Research and Development and Innovation Survey, which covered all publicly or privately held companies with 5 or more employees. Data for 2017 and 2018 come from NCSES's annual Business Research and Development Survey, which covers all publicly or privately held companies with 10 or more employees. Data for 2019 come from NCSES's annual Business Enterprise Research and Development Survey, which also covers all publicly or privately held companies with 10 or more employees. An estimate range may be displayed in place of a single estimate to avoid disclosing operations of individual companies.
Source(s):
National Center for Science and Engineering Statistics, Business Research and Development and Innovation Survey (BRDIS), Business Research and Development Survey (BRDS), Business Enterprise Research and Development Survey (BERD).
Science and Engineering Indicators
The most notable change in the sources of funds for the R&D performed by these businesses since 2010 has been the declining role of federal funding, falling from over 12% in 2010 to about 4% in 2019 (Table RD-11). The decline in federal funding coincides with an increase in funding by companies’ own funds from both domestic units and foreign subsidiaries. During this period, funding from companies’ domestic units and foreign subsidiaries increased by more than 3 percentage points and 4 percentage points, respectively.
Funding from all domestically located sources accounted for just over 90% of the U.S. business R&D performed by businesses with 10 or more employees in 2019 (Table RD-11). Foreign-located sources accounted for a substantially smaller but growing share of business R&D. Since 2010, the funding from domestic sources declined by more than 4 percentage points, from about 95% in 2010 to about 90% in 2019, while funding from foreign sources increased from 5% to almost 10%.
There are also notable differences in sources of funds for the R&D performed by the top R&D-performing industries (Table RD-9). In 2019, companies’ own funds almost exclusively funded R&D performance in the information sector and most of the R&D performed in the chemicals manufacturing, computer and electronic products, and transportation equipment industries.
The federal government funded over 20% of the R&D performed in transportation equipment manufacturing, including nearly half of the R&D performance in aerospace product and parts manufacturing. Almost half of the funding for the R&D performance in PST services came from external sources, with 28% coming from other domestic businesses. Within PST services, a substantial amount (63%) of R&D performance in scientific R&D services was funded by other domestic businesses.
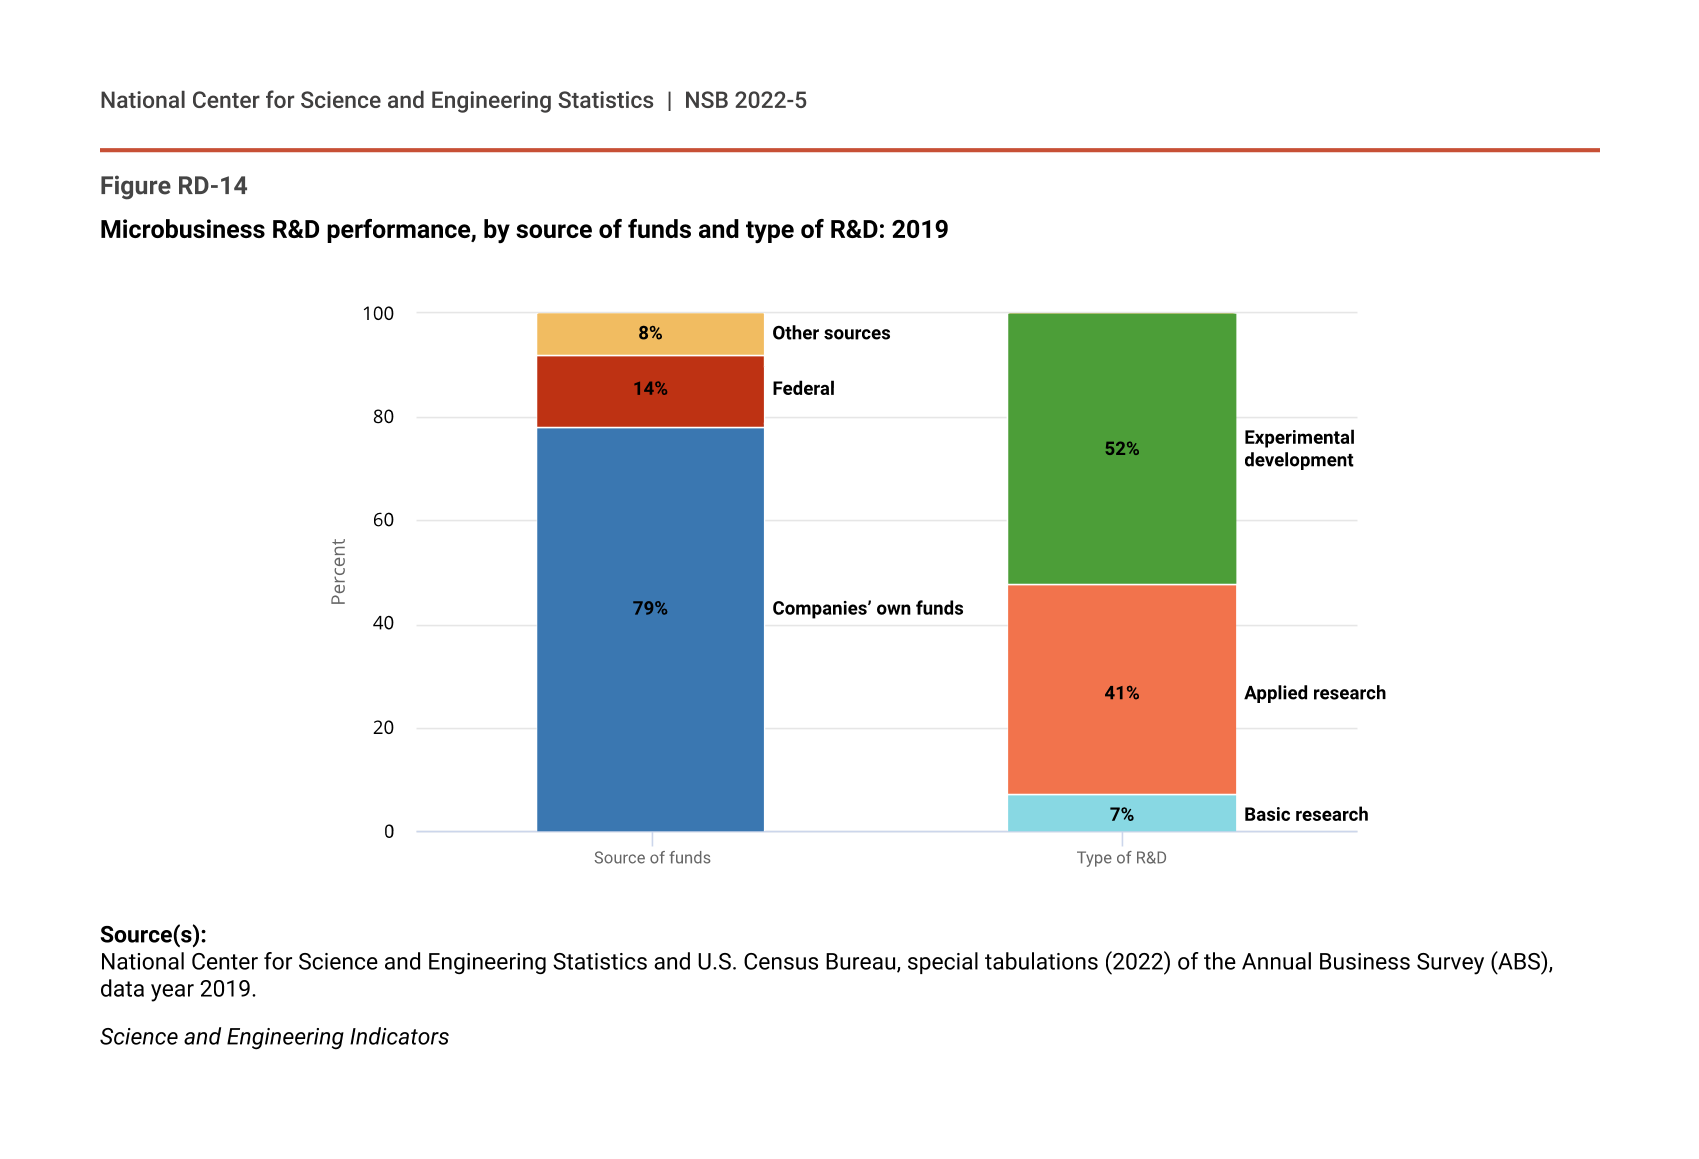
The business R&D performed by microbusinesses was also funded primarily from companies’ own funds (79% in 2019) (Figure RD-14). Microbusinesses, however, received larger funding support from the federal government compared to other businesses (14% vs. 4%). Almost three-fourths (74%) of all federal government R&D funding to microbusinesses in 2019 went to companies in scientific R&D services (NCSES ABS, data year 2019). The remaining 8% of microbusiness R&D performance was funded from other sources, including other companies, nonfederal governments, and nonprofit and other organizations.
Microbusiness R&D performance, by source of funds and type of R&D: 2019
Source(s):
National Center for Science and Engineering Statistics and U.S. Census Bureau, special tabulations (2022) of the Annual Business Survey (ABS), data year 2019.
Science and Engineering Indicators
Company Size and U.S. Business R&D
The distribution of R&D performance by company size class has not changed much in recent years. Large companies with 250 or more employees performed about 85%–90% of business R&D in any given year from 2010 to 2019 (Table RD-12). Among these, the largest companies—those with 25,000 or more employees—performed over a third of business R&D each year. Medium companies—those with 50–249 employees—performed, on average, about 7%–8% of annual business R&D. The remaining 2%–8% are attributable to small companies with fewer than 50 employees, including microbusinesses.
Funds spent for business R&D performed in the United States, by size of company: 2010–19
i = more than 50% of value imputed; NA = not available.
a R&D performed by companies in the domestic United States. Includes industries in NAICS 21–33, 42–81.
b Data for 2010–15 come from the National Center for Science and Engineering Statistics' (NCSES's) annual Business Research and Development and Innovation Survey (BRDIS), which covered all publicly or privately held companies with 5 or more employees. Data for 2016 included the BRDIS data for that year plus the data from the 2016 Business R&D and Innovation Survey–Microbusiness, which collected statistics on the R&D activities of companies with 1–4 employees ($4.8 billion in 2016). Data for 2017 and 2018 come from NCSES's annual Business Research and Development Survey, which covers all publicly or privately held companies with 10 or more employees, plus the Annual Business Surveys (ABS) for 2017 and 2018, which collected statistics on the R&D activities of businesses with 1–9 employees ($5.7 billion in 2017 and $4.5 billion in 2018). Data for 2019 come from NCSES's annual Business Enterprise Research and Development Survey, which covers all publicly or privately held companies with 10 or more employees, plus the ABS for 2019, which collected statistics on the R&D activities of businesses with 1–9 employees ($5.2 billion in 2019).
c Employee size categories have been revised to match international classifications starting in 2015.
Note(s):
Detail may not add to total because of rounding. This table excludes data for federally funded R&D centers.
Source(s):
National Center for Science and Engineering Statistics, Business Research and Development and Innovation Survey (BRDIS), Business Research and Development Survey (BRDS), Business Enterprise Research and Development Survey (BERD), Business Research and Development and Innovation Survey–Microbusiness (BRDI-M), Annual Business Survey (ABS), data years 2017 and 2018, and special tabulations (2022) of the ABS, data year 2019.
Science and Engineering Indicators
There have been changes over this period in how the business R&D surveys have defined and included small companies. Through 2016, the reference population for BRDIS excluded companies with fewer than 5 employees. The Business R&D and Innovation Survey–Microbusiness (BRDI-M) collected one-time data on these companies (1–4 employees) for 2016. Starting in 2017, the reference population for BRDS (and its successor BERD) excluded companies with fewer than 10 employees. The ABS was established to collect—among other business data—data on R&D activities of microbusinesses (companies with 1–9 employees), starting with reference year 2017.
Despite stability in distribution of R&D performance by company size class, the R&D performance for each size class has varied over time. A recent NCSES analysis of R&D performance by company size class showed, for instance, that R&D performance by larger-sized companies rebounded from the Great Recession considerably better than small and medium companies whose R&D performance in 2015 had yet to recover to 2009 levels (Anderson and Kindlon 2019).
U.S. Business R&D, by Type
Businesses vary in their relative efforts to perform different types of R&D. Experimental development and applied research have historically dominated R&D performance in the business sector. In 2019, 78% of the R&D performed by businesses with 10 or more employees was in experimental development, accounting for 90% of U.S. experimental development across all R&D-performing sectors (Table RD-13). Applied research was a much smaller share (15%) of the R&D performed by these businesses but accounted for more than half (56%) of U.S. applied research. Similarly, basic research was a small share of business R&D (7%) but accounted for almost a third (31%) of U.S. basic research.
Funds spent for business R&D performed in the United States, by type of R&D: 2010–19
a Includes companies located in the United States that performed or funded R&D. Data in this table represent an aggregate of all industries in the North American Industry Classification System codes 21–33 and 42–81.
Note(s):
Detail may not add to total because of rounding. Industry classification is based on the dominant business code for domestic R&D performance, where available. For companies that did not report business codes, the classification used for sampling was assigned. Beginning in survey year 2018, statistics are representative of companies located in the United States that performed or funded $50,000 or more of R&D. Data for 2010–16 come from the National Center for Science and Engineering Statistics' (NCSES's) annual Business Research and Development and Innovation Survey, which covered all publicly or privately held companies with 5 or more employees. Data for 2017 and 2018 come from NCSES's annual Business Research and Development Survey, which covers all publicly or privately held companies with 10 or more employees. Data for 2019 come from NCSES's annual Business Enterprise Research and Development Survey, which also covers all publicly or privately held companies with 10 or more employees. The total U.S. R&D data come from National Patterns of R&D Resources (2019–20 edition).
Source(s):
National Center for Science and Engineering Statistics, Business Research and Development and Innovation Survey (BRDIS), Business Research and Development Survey (BRDS), Business Enterprise Research and Development Survey (BERD), and National Patterns of R&D Resources (2019–20 edition).
Science and Engineering Indicators
The applied research and experimental development performed by businesses with 10 or more employees has increased steadily since 2010 (Table RD-13). Business basic research declined earlier in the period but has since recovered. The business share of the U.S. total basic research has increased from about 20% early in the period to 31% in 2019. While business-performed basic research accounts for an increasing share of U.S. basic research, basic research as a share of U.S. total R&D has been on a path of decline (from 19% in 2010 to 15% in 2019). This is largely a result of the faster growth in business R&D compared to other R&D-performing sectors, most of which goes to experimental development.
The distribution of R&D performance by R&D type varies across industries. More than 40% of business basic research performed by businesses with 10 or more employees in 2019 was in chemicals manufacturing, including manufacturing of pharmaceuticals, and about a fourth was in information and PST services (Table SRD-4). A large share (26%) of business applied research was also in chemicals manufacturing, including pharmaceuticals. Nearly 45% of business experimental development was in information (25%) and computer and electronic products (19%) industries. Other top R&D-performing industries also had sizable shares of all three types of business R&D.
By funding source, the most notable trend in funding of different types of R&D performed by businesses with 10 or more employees is the decline in federal funding. This decline is more evident for business experimental development (Table SRD-3). Federal funding accounted for 4% of business experimental development funding in 2019, compared to 13% in 2010.
For microbusinesses, just over half (52%) of R&D performance in 2019 was on experimental development, while 41% was on applied research, and 7% was on basic research (Figure RD-14). Compared to other businesses, microbusinesses perform relatively less experimental development and more applied research.
Cross-National Comparisons of Business R&D
This section compares the industrial composition of business R&D in the United States with that of other major R&D performing countries—France, Germany, the United Kingdom, China, Japan, and South Korea. Corresponding statistics for India are not presently available. The data come from the OECD’s Analytical Business Enterprise R&D (ANBERD) database.
The international industry data are classified based on the fourth revision of the International Standard Industrial Classification of All Economic Activities (ISIC, Rev.4). The ISIC differs somewhat from NAICS, used elsewhere in this report to analyze U.S. trends. The results from the analysis for the United States presented in this section, however, are similar to those reported earlier in this report based on NAICS.
Only industries with comparatively higher levels of annual R&D performance are included in the analysis. The analysis focuses on comparisons of industry shares of business R&D performance across countries for the year 2018 or the most recent year of available data; the associated dollar amounts are listed in Table RD-14. All amounts and calculations are in current PPP dollars.
Business expenditures for R&D, by selected countries and top R&D performing industries: 2018 or most recent year
NA = not available.
ISIC, Rev.4 = International Standard Industrial Classification, 4th Revision; PPP = purchasing power parity.
Note(s):
Detail may not add to total because of rounding. Industry classifications for all countries are based on main activity. The U.S. business R&D data are from the U.S. Business Research and Development survey 2018 (crosswalked to the ISIC, Rev.4, classifications). In general, the table includes industries with annual R&D expenditures of $10 billion or more (i.e., each country's largest R&D performers). See the Organisation for Economic Co-operation and Development's Analytical Business Enterprise Research and Development database for a more detailed set of industries by country.
Source(s):
National Center for Science and Engineering Statistics, Business Research and Development Survey (BRDS); Organisation for Economic Co-operation and Development, Analytical Business Enterprise Research and Development (ANBERD) database, http://www.oecd.org/sti/inno/anberdanalyticalbusinessenterpriseresearchanddevelopmentdatabase.htm, accessed 22 December 2021.
Science and Engineering Indicators
Manufacturing is the focus of business R&D performance in many, but not all, of the top R&D-performing countries. The manufacturing sector accounted for more than half of the total business R&D in the United States (62%) in 2018 (Table RD-14). Germany (85%), China (91%), Japan (87%), and South Korea (89%) had even higher manufacturing shares of business R&D compared to the United States.
France and the United Kingdom were exceptions to the manufacturing emphasis. In the United Kingdom, the services sector accounted for the larger share (59%) of business R&D. In France, R&D performance was virtually equally split between the manufacturing and services sectors.
Within manufacturing, R&D performance was concentrated in a few industries. In the United States, the computer, electronic, and optical products (ISIC 26) and the pharmaceuticals, medicinal chemical, and botanical products (ISIC 21) were the two largest R&D-performing industries, with 19% and 17% industry shares, respectively, of U.S. total business R&D. Air and spacecraft and related machinery (ISIC 30) and motor vehicles, trailers, and semi-trailers (ISIC 29) followed, each with 6% industry shares of U.S. total business R&D.
Motor vehicles, trailers, and semi-trailers and computer and electronic and optical products were the two largest R&D-performing industries in Germany, Japan, South Korea, and China. Chemicals and chemical products (ISIC 20) followed as the next-largest R&D-performing industry in China and South Korea and performed a sizable share of business R&D in Japan and Germany. The pharmaceuticals industry was among the three largest R&D-performing industries in Japan and performed a sizable share of business R&D in Germany. The air and spacecraft industry performed a sizable share of business R&D in France and the United Kingdom.
The services sector (ISIC 45–99) is an important performer of business R&D in some of the top R&D-performing countries. The services sector accounted for more than a third of U.S. business R&D in 2018. Within services, business R&D performance was concentrated in two industries: information and communication (ISIC 58–63), and PST activities (ISIC 69–75) (Table RD-14). A quarter of U.S. business R&D was in information and communication, and 7% was in PST activities.
This sector also led business R&D performance in the United Kingdom (59%) and performed a notable share of business R&D in France (49%). In the United Kingdom, 32% of business R&D was in PST activities, and 16% was in information and communication. Similarly, 26% of business R&D in France was in PST activities, and 14% was in information and communication.