 An official website of the United States government
 U.S. STEM Workforce: Definition, Size, and Growth
New advancements and discoveries in science and technology, such as quantum technologies, space exploration, and medical vaccines, are rapidly changing the world of work and, as a result, continue to challenge the traditional framework used to define the U.S. STEM labor force. The constant stream of innovative technologies that improve work activities, such as automation and artificial intelligence, further disrupt and blur the growing boundaries of the science & engineering (S&E) enterprise. Those who work in the S&E enterprise fuel the nation’s innovative capacity through their work in research and development (R&D) and other technologically advanced activities. As a range of workers with STEM knowledge and skills becomes increasingly central to innovation and economic growth, a new definition of the STEM workforce that encompasses the “diversity and inclusivity of science and engineering is vital to the future of the S&E enterprise and crucial to maintain the broad public support for S&E” (NSB 2019a:6). This report continues to measure employed workers with a bachelor’s degree or higher in S&E and S&E-related occupations and workers with S&E or S&E-related degrees. It also broadens the definition of STEM workers to include workers with at least a bachelor’s degree and workers without a bachelor’s degree.
In past Science and Engineering Indicators reports, the focus was on a subset of the STEM workforce with a bachelor’s degree or higher who work primarily in STEM occupations, such as computer, life, physical, and social scientists and engineers (i.e., S&E occupations). Analyses also included workers in health care and S&E managerial occupations (i.e., S&E-related occupations). These reports introduced a limited analysis of the skilled technical workforce (STW), which includes occupations that require a high level of knowledge in a technical domain but do not require a bachelor’s degree. While not defined as the STW at the time, the Indicators 2016 and Indicators 2018 reports analyzed workers in S&E and S&E-related occupations without a bachelor’s degree. The Indicators 2020 “Science and Engineering Labor Force” report expanded the analysis to include STEM workers in middle-skill occupations such as construction, extraction, and production. While middle-skill occupations include STEM and non-STEM workers, the usage of “middle-skill occupations” generally refers only to STEM workers in the context of this report. However, these reports did not provide a framework that included the STW within the STEM workforce, primarily because one had not yet been developed.
In recent years, several organizations and researchers—including the National Academies of Sciences, Engineering, and Medicine (NASEM 2017), the National Science Board (NSB 2015, 2019a), and NCSES (2020a), among others—have recognized that workers with less than a bachelor’s degree who have S&E skills and technical expertise are integral to the overall R&D capabilities of the U.S. STEM labor force. Although U.S. workforce experts may know these STEM workers as middle-skill workers (Carnevale et al. 2018; Fuller et al. 2014; Holzer and Lerman 2007; NASEM 2017), this report identifies them as the STW. To provide a more calibrated understanding of the U.S. STEM labor force, this report introduces a comprehensive definition of the STEM workforce that explicitly integrates the STW with STEM workers with a bachelor’s degree or higher.
The discussion that follows in this section will address three primary goals. First, this section will explain the expanded definition of the STEM workforce and delineate how this definition departs from the narrower definition of the U.S. S&E labor force that was the focus of prior Indicators reports. Second, the most recent statistics on the size and growth of the U.S. STEM workforce will be discussed. This discussion will include both the new, expanded definition of the STEM workforce and also the S&E workforce definition used in past Indicators reports. NCSES collects data on S&E workers with a bachelor’s degree or higher that offer unique insight into this important segment of the STEM workforce, and these analyses of the S&E workforce continue even as the report is evolving to include the expanded STEM workforce definition. The third and final goal is to lay a foundation for future reports to explore themes relevant to the expanded U.S. STEM workforce. As new data become available, future research will become more inclusive of all workers who inform, support, and advance the U.S. S&E enterprise.
A Traditional Definition: S&E Workers in the STEM Workforce
Past and current Indicators analyses focus on a subset of the STEM workforce: individuals with at least a bachelor’s degree working in S&E occupations. S&E occupations encompass five major categories: (1) computer and mathematics scientists; (2) biological, agricultural, and environmental life scientists; (3) physical scientists; (4) social scientists, and (5) engineers. Analyses of workers who also utilize science and technological expertise may include those employed in S&E-related occupations, including doctors, nurses, engineering managers, computer programmers, and biological technologists.
To provide a comprehensive understanding of U.S. workers utilizing STEM skills and knowledge at the bachelor’s degree level or higher, past Indicators reports primarily focused on those in S&E occupations with at least a bachelor’s degree, with a degree in an S&E field of study or those who use a bachelor’s degree level of S&E expertise in their job. Data on these S&E skills and knowledge provide insights on the R&D and technology impact of these workers, the education and training required to support the workers in S&E, and the pervasiveness of S&E skills, regardless of occupation type. The category of scientists and engineers includes individuals who have an S&E or S&E-related degree or work in an S&E or S&E-related occupation; it yields the largest number of S&E workers with a bachelor’s degree or higher in this report. Collectively, these approaches have been used by Indicators to define and analyze the S&E workforce with a bachelor’s degree or higher.
NCSES’s National Survey of College Graduates (NSCG) and the Survey of Doctorate Recipients (SDR) provide detailed data on those with a bachelor’s degree or higher in S&E and S&E-related occupations or with S&E and S&E-related degrees and those in the workforce with science, engineering, or health (SEH) research doctorates, respectively. The NSCG and SDR collect education and occupation data on adults up to age 75. The NSCG (NCSES 2021b) focuses on adults with a bachelor’s degree or higher living in the United States, whereas the SDR (NCSES 2021d) focuses on U.S.-trained S&E doctorate recipients living in the United States and abroad. To classify the occupations, this Indicators report continues to use the NCSES Taxonomy of Occupations. (See NCSES NSCG 2017: Technical Table A-1 for taxonomy.) The NCSES occupation taxonomy does not allow middle-skill occupations to be identified separately from non-STEM occupations. Hence, analysis based on NSCG or SDR data in this report will continue to focus on workers in S&E, S&E-related, and non-S&E occupations, the latter of which include middle-skill and non-STEM occupations.
Focusing narrowly on workers with a bachelor’s degree or higher who are employed in S&E occupations, this S&E workforce definition yields about 6.6 million–7.5 million workers, depending on the data source (Table LBR-1). This estimate almost quadruples to nearly 29 million when using another definition for scientists and engineers, which includes those who have an S&E or S&E-related degree or work in an S&E or S&E-related occupation. Nearly 20 million individuals attained their highest degree—a bachelor’s, master’s, professional, or doctoral degree—in an S&E field.
Measures and size of U.S. S&E workforce with a bachelor's degree or higher: 2019
ACS = American Community Survey; NSCG = National Survey of College Graduates.
Note(s):
The data source is NSCG unless otherwise noted. The NSCG estimate of the number of workers in S&E occupations includes postsecondary teachers of S&E fields, and the ACS estimate excludes them. The totals for at least one degree in S&E field and highest degree in S&E field include individuals who are employed and those who are unemployed and out of the labor force. Scientists and engineers are individuals under the age of 76 with a bachelor's degree or higher, are living in the United States, and have an S&E or S&E-related degree or occupation.
Source(s):
National Center for Science and Engineering Statistics, NSCG, 2019; U.S. Census Bureau, ACS, 2019, Public Use Microdata Sample (PUMS), data as of 25 October 2020.
Science and Engineering Indicators
Based on the NCSES’s (2021a) 2019 NSCG, S&E degree holders outnumber those currently employed in S&E occupations. (See NCSES SDR 2019: Technical Table A-1 for Taxonomy of Disciplines.) In 2019, social sciences and engineering were the most common degree fields overall, whereas the life sciences and social sciences fields were prominent fields of study for doctorate holders (Figure LBR-1).
Individuals with their highest degree in S&E, by field and level of highest degree: 2019
| Level of highest degree | Biological, agricultural, and environmental life sciences | Computer and mathematical sciences | Physical sciences | Social sciences | Engineering |
|---|---|---|---|---|---|
| All highest degree levels | 16.2 | 17.8 | 5.7 | 37.4 | 22.9 |
| Bachelor's | 16.1 | 16.9 | 4.9 | 40.0 | 22.1 |
| Master's | 12.3 | 24.3 | 4.8 | 31.2 | 27.4 |
| Doctorate | 28.6 | 8.9 | 16.3 | 27.8 | 18.4 |
Note(s):
All highest degree levels include professional degrees not shown separately.
Source(s):
National Center for Science and Engineering Statistics, National Survey of College Graduates (NSCG), 2019.
Science and Engineering Indicators
The extensive use of S&E expertise in the workplace is also evident from the number of workers with a bachelor’s degree or higher who indicate that their job requires technical expertise at the bachelor’s degree level in S&E fields. Among workers with a bachelor’s degree or higher, regardless of occupation or degree type, almost 22 million reported that their jobs required at least this level of technical expertise in one or more S&E fields (Table LBR-1). This estimate is almost three times as large as the 7.5 million college graduates employed in S&E occupations.
Understanding workers with a bachelor’s degree or higher in S&E occupations has been instrumental in describing the STEM workforce; however, the increasing prevalence of advanced technologies in the workplace has raised the importance of understanding workers in occupations that also require significant STEM expertise but do not require a bachelor’s degree. These occupations, referred to as middle-skill occupations or, in the context of this report, middle-skill occupations in STEM, are critical in adapting and maintaining new processes and technologies that are integral to the U.S. S&E enterprise. The expanded definition of the U.S. STEM workforce introduced here recognizes the increasing use of these skills across a broad range of STEM occupational groups—S&E, S&E-related, and middle-skill occupations—by workers at all education levels.
A New Expanded Definition of the STEM Workforce
The effect of expanding the STEM workforce definition to include individuals at all education levels and in middle-skill occupations is a major change for this report. According to the U.S. Census Bureau’s (2020a) 2019 American Community Survey (ACS), the number of STEM workers in middle-skill occupations is nearly the same as the number of workers in S&E and S&E-related occupations combined. Most of the nearly 20 million STEM workers without a bachelor’s degree work in middle-skill occupations (12.7 million), followed by S&E-related occupations (5.2 million) and S&E occupations (2 million) (Figure LBR-2). Most of the middle-skill occupations are held by nearly 13 million STEM workers who make up the STW. Of the more than 16 million STEM workers with a bachelor’s degree or higher, most work in S&E or S&E-related occupations.
U.S. workforce, by STEM occupational group and education level: 2019
STEM = science, technology, engineering, and mathematics.
Note(s):
Data include workers ages 16–75 and exclude those in military occupations or currently enrolled in primary or secondary school. The STEM workforce without a bachelor's degree is also known as the skilled technical workforce (STW). S&E occupations include computer and mathematical scientists; biological, agricultural, and environmental life scientists; physical scientists; social scientists; and engineers. S&E-related occupations include health-related occupations (e.g., health practitioners and health technicians); S&E managers; S&E teachers; and S&E technologists. Middle-skill occupations include those in construction and extraction; installation, maintenance, and repair; production; and other middle-skill occupations. Middle-skill occupations include the STW and STEM workers with a bachelor's degree or higher. Numbers are rounded to the nearest 1,000.
Source(s):
U.S. Census Bureau, American Community Survey (ACS), 2019, Public Use Microdata Sample (PUMS), data as of 25 October 2020.
Science and Engineering Indicators
This report builds on the methodology used by NASEM to identify middle-skill occupations (NASEM 2017). The methodology is derived from a skills-based data set of self-reported information provided by workers on how heavily they rely on certain knowledge domains to conduct their work. Middle-skill occupations are those in which STEM workers scored highly in selected STEM knowledge domains such as biology, engineering and technology, and computers and electronics, among others, and in which greater than 50% of the workers did not have a bachelor’s degree.
By most federal STEM taxonomies, the middle-skill occupations are not categorized as STEM fields or occupations. While middle-skill occupations have been used to describe the STW in previous editions of this report, these occupations are new in the context of classifying them as part of the STEM workforce. Occupations in this STEM occupational group include aircraft mechanics and service technicians, first-line supervisors of construction trades and extraction workers, and heavy vehicle and mobile equipment service technicians and mechanics, among others (Table SLBR-1). Thus, the STEM workforce described in this report not only includes occupations that are historically known to require S&E skills and expertise (e.g., life sciences, physical sciences, engineering, mathematics and computer sciences, social sciences, and health care) but also occupations that require STEM skills but are not historically considered STEM occupations (e.g., installation, maintenance, and repair; construction trades; and production occupations).
Moving forward, Indicators reports will continue to provide information on workers with a bachelor’s degree or higher in S&E and S&E-related occupations as has been done in previous reports for continuity and the important insight that can be gleaned from such analyses. Much of the analysis in this report focuses on these workers. Despite current data limitations, information on middle-skill occupations and the STW will be presented, when possible, to provide insight of the expanded STEM workforce introduced in this report.
Size of the STEM Workforce
The size of the STEM workforce greatly increases with the inclusion of middle-skill occupations and workers without a bachelor’s degree relative to the S&E workforce definitions used in prior Indicators reports that focused primarily on S&E workers with a bachelor’s degree or higher. In 2019, the ACS showed approximately 6.6 million workers with a bachelor’s degree or higher in S&E occupations (Figure LBR-2; Table SLBR-1). However, with the definition of the STEM workforce expanded to include workers without a bachelor’s degree who are employed in S&E, S&E-related, and middle-skill occupations (i.e., the STW), there are approximately 36 million STEM workers, representing 23% of the total U.S. workforce. Within this expanded STEM workforce, 55% of workers do not have a bachelor’s degree (STW), and 45% of workers have a bachelor’s degree.
On examination of the STEM workforce by education, a clear difference emerges among the occupations pursued by those with at least a bachelor’s degree and those without a bachelor’s degree. Among STEM workers with a bachelor’s degree or higher, most (89%) are employed in S&E or S&E-related occupations that typically require a bachelor’s degree for entry (Figure LBR-3; Table SLBR-1). These workers are employed predominantly (73%) in three broad occupational categories: (1) health practitioner and technical occupations, (2) computer and mathematical occupations, and (3) architecture and engineering occupations (Table SLBR-1). Within these broad occupational categories, the principal detailed occupations include registered nurses (2.2 million), software developers (1.4 million), physicians (894,000), other engineers (492,000), and computer and information systems managers (486,000).
Employment in STEM occupations, by occupational category and education level: 2019
| Education level | S&E occupations | S&E-related occupations | Middle-skill occupations |
|---|---|---|---|
| All degree levels | 23.8 | 36.3 | 40.0 |
| Without a bachelor's degree (STW) | 10.2 | 26.1 | 63.8 |
| With a bachelor's degree or higher | 40.4 | 48.7 | 10.9 |
STEM = science, technology, engineering, and mathematics; STW = skilled technical workforce.
Note(s):
Data include workers ages 16–75 and exclude those in military occupations or currently enrolled in primary or secondary school.
Source(s):
U.S. Census Bureau, American Community Survey (ACS), 2019, Public Use Microdata Sample (PUMS), data as of 25 October 2020.
Science and Engineering Indicators
While a majority of STEM workers with a bachelor’s degree or higher are employed in S&E or S&E-related occupations, nearly two-thirds (64%) of the STW are employed in middle-skill occupations that do not require a bachelor’s degree for entry (Figure LBR-3; Table SLBR-1). The remaining 36% of the STW is employed in S&E occupations that normally require a bachelor’s degree for entry or in S&E-related occupations. About 74% of the STW is employed in four broad occupational categories: (1) construction trades; (2) installation, maintenance, and repair workers; (3) health care practitioners and technical occupations; and (4) production occupations (Table SLBR-1). Like STEM workers with a bachelor’s degree, one of the common roles for the STEM workers without a bachelor’s degree (STW) is registered nurses (1.2 million). Other principal detailed occupations among the STW include carpenters (1.2 million), miscellaneous production workers (1.2 million), and electricians (872,000)
As the data show, health care-related occupations are popular among STEM workers with a bachelor’s degree or higher as well as the STW. These occupations are projected to grow faster than most other occupations in the next 10 years, and there are many opportunities in these occupations that do not require a bachelor’s degree for entry. (See sidebar Projected Growth of Employment in STEM Occupations.)
Growth of the STEM Workforce
As scientific and technical expertise becomes increasingly critical for sustained economic growth, occupations that require this expertise can also be expected to grow. (For future projections of employment in STEM occupations for 2019–29, see sidebar Projected Growth of Employment in STEM Occupations.) Using the expanded definition of the U.S. STEM workforce, the ACS shows that employment in these occupations grew by 2.3% annually between 2010 and 2019, outpacing the 1.4% annual growth in total U.S. employment (Figure LBR-4). Those with a bachelor’s degree or higher within the STEM workforce experienced the greatest employment growth during this time (3.9%), followed by their non-STEM counterparts (2.5%). A similar trend is observed for workers without a bachelor’s degree; the STW saw higher employment growth (1.2%) than non-STEM workers without a bachelor’s degree (0.6%).
Growth rate of employed adults in the United States, by workforce and degree level: 2010–19
STEM = science, technology, engineering, and mathematics.
Note(s):
Data include workers ages 16–75 and exclude those in military occupations or currently enrolled in primary or secondary school.
Source(s):
U.S. Census Bureau, American Community Survey (ACS), 2019, Public Use Microdata Sample (PUMS), data as of 25 October 2020.
Science and Engineering Indicators
The composition of the total workforce has slowly shifted away from non-STEM employment to STEM employment. Between 2010 and 2019, the proportion of non-STEM employment declined roughly 2 percentage points (Table SLBR-2). However, over three-quarters of the total U.S. workforce were non-STEM workers between 2010 and 2019, while the STEM workforce was less than a quarter of the workforce in these years.
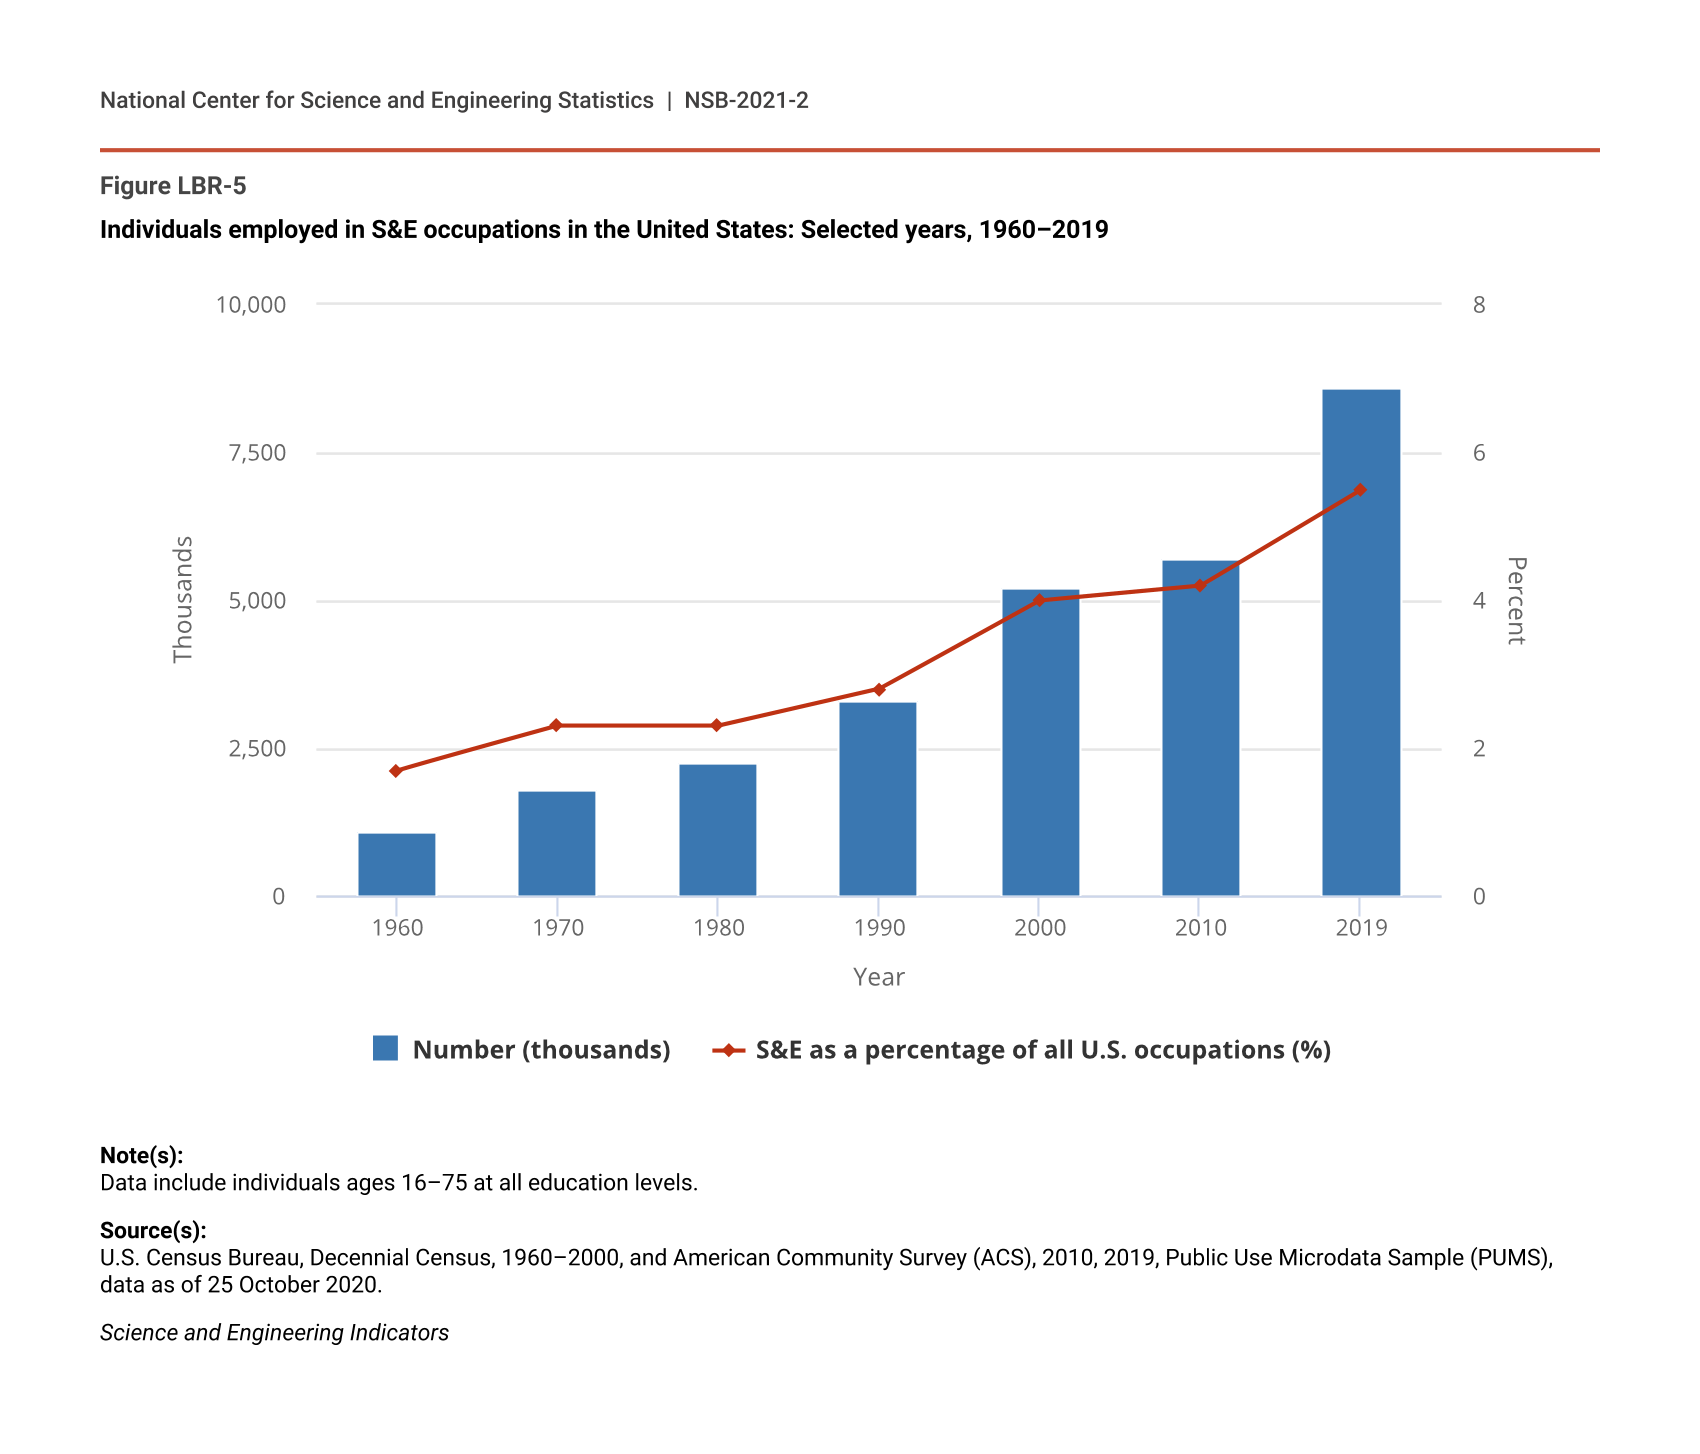
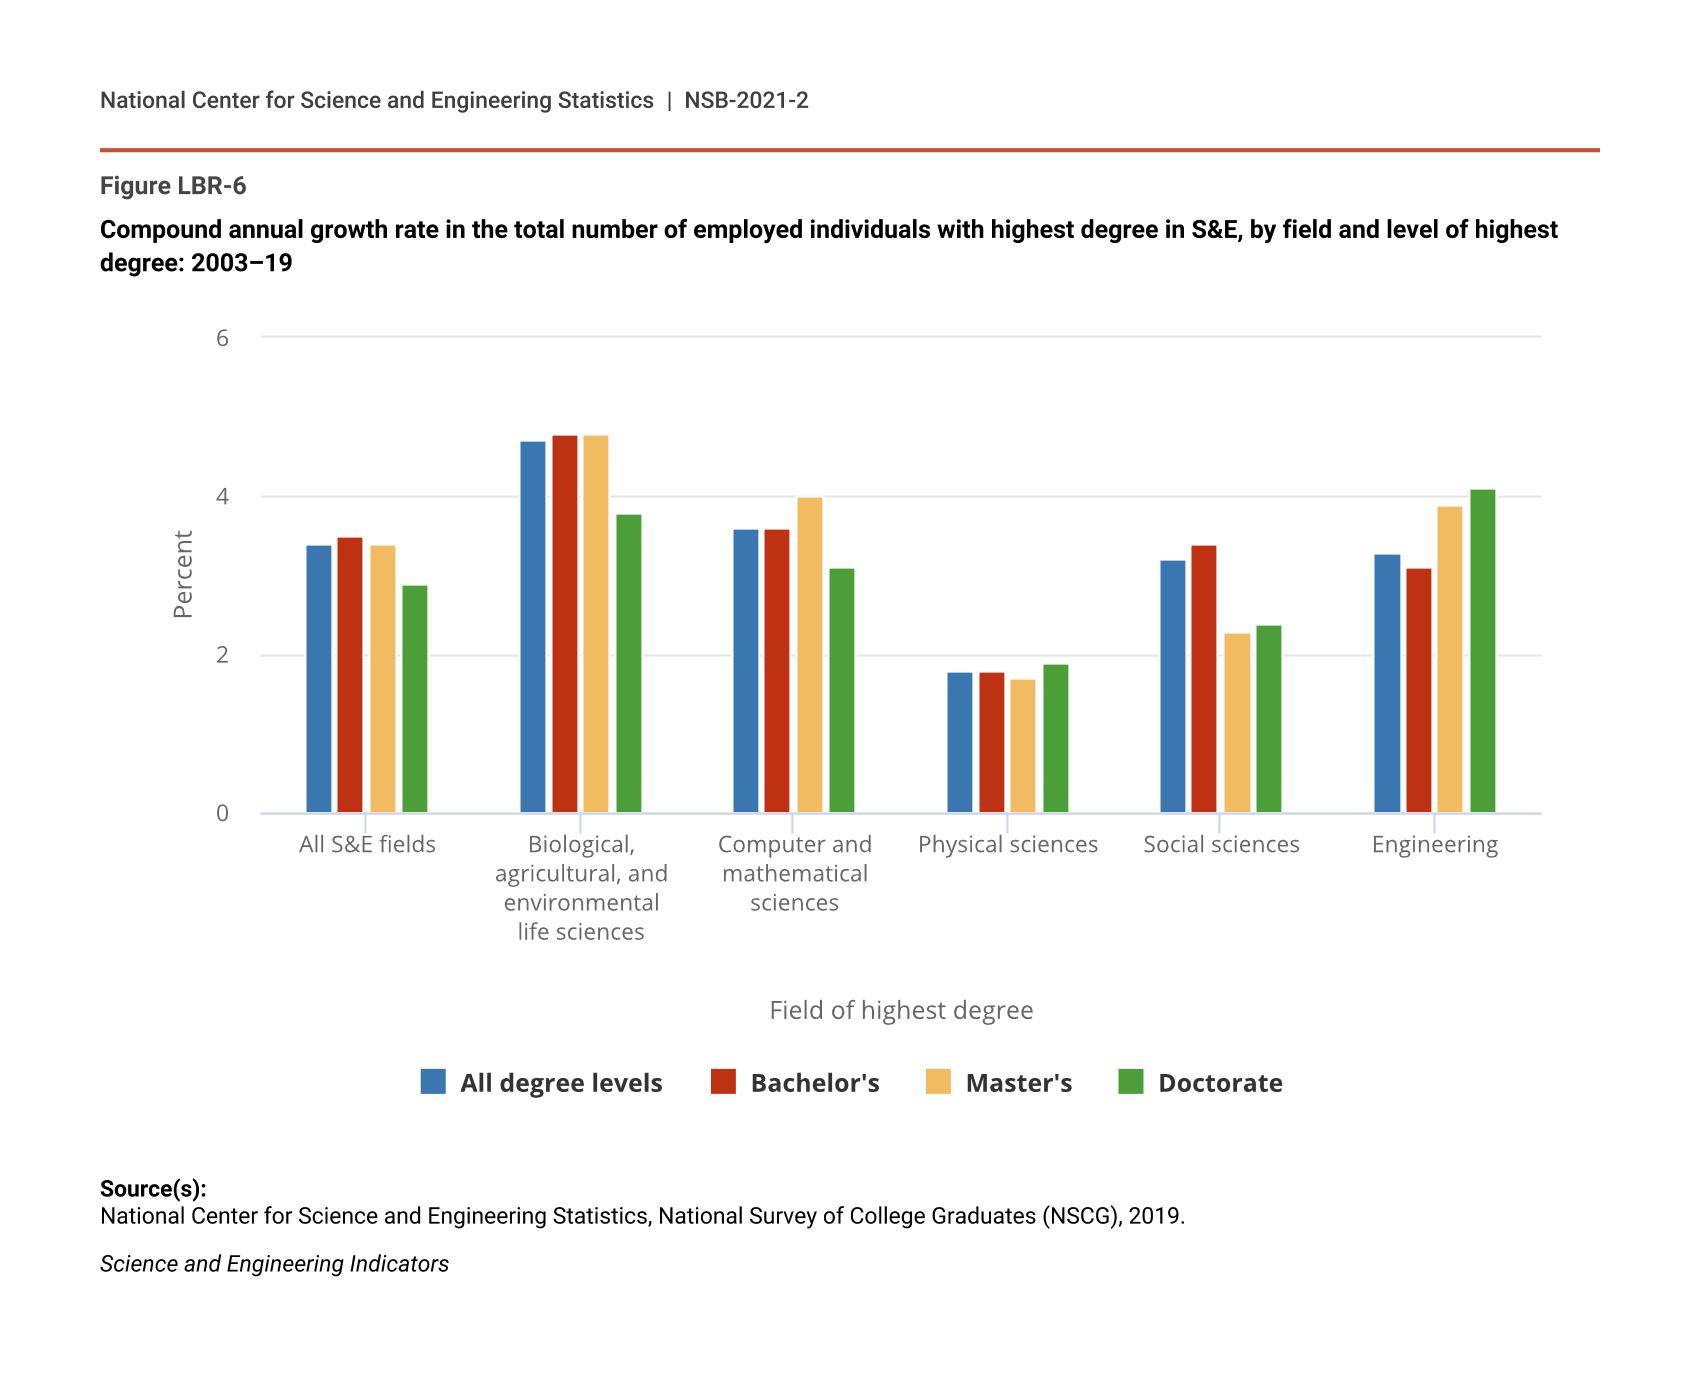
The long-run dynamics of workers in STEM occupations are important to identify because they may provide insight on workforce trends that could affect U.S. economic competitiveness in STEM-intensive industries. To understand these dynamics within the STEM workforce, a subset of workers in S&E occupations at all education levels was evaluated using U.S. Census Bureau data from 1960 to 2019. Employment in these selected S&E occupations grew from about 1.1 million in 1960 to about 8.6 million in 2019, with a compound annual growth rate of 4%, compared to a 1% rate for total employment during this period (Figure LBR-5). As a proportion of total U.S. employment, these occupations more than tripled, increasing from 1.7% in 1960 to 5.5% in 2019. Workers with their highest degree in an S&E field similarly grew an average of 3.4% between 2003 and 2019 (Figure LBR-6).
Individuals employed in S&E occupations in the United States: Selected years, 1960–2019
Figure data not available.
Note(s):
Data include individuals ages 16–75 at all education levels.
Source(s):
U.S. Census Bureau, Decennial Census, 1960–2000, and American Community Survey (ACS), 2010, 2019, Public Use Microdata Sample (PUMS), data as of 25 October 2020.
Science and Engineering Indicators
Compound annual growth rate in the total number of employed individuals with highest degree in S&E, by field and level of highest degree: 2003–19
| Field of highest degree | All degree levels | Bachelor's | Master's | Doctorate |
|---|---|---|---|---|
| All S&E fields | 3.4 | 3.5 | 3.4 | 2.9 |
| Biological, agricultural, and environmental life sciences | 4.7 | 4.8 | 4.8 | 3.8 |
| Computer and mathematical sciences | 3.6 | 3.6 | 4.0 | 3.1 |
| Physical sciences | 1.8 | 1.8 | 1.7 | 1.9 |
| Social sciences | 3.2 | 3.4 | 2.3 | 2.4 |
| Engineering | 3.3 | 3.1 | 3.9 | 4.1 |
Source(s):
National Center for Science and Engineering Statistics, National Survey of College Graduates (NSCG), 2019.
Science and Engineering Indicators