 An official website of the United States government
 Knowledge Transfer Indicators: Putting Information to Use
Both formal R&D and informal activities like learning-by-doing produce new knowledge. Knowledge transfer encompasses the many activities whereby newly created knowledge is shared with those who can apply it, develop it, or transform it into new outputs, inventions, and innovations. That knowledge can be transferred through the dissemination of the information embedded in documented R&D outputs, such as publications, patents, and software; through direct organization-to-organization interaction and collaboration; and via both formal and informal interaction among individuals. Coauthorship of research publications across business, academia, and government is used to measure the transfer of knowledge across sectors. Citations to the peer-reviewed scientific literature appearing in patents provide evidence of the application of scientific knowledge in inventions and highlight knowledge transfer within and between sectors (such as between universities and businesses).
Knowledge embedded in technology constitutes a special case of knowledge transfer often referred to as technology transfer and is tracked for universities as well as for the federal government. Indicators discussed in this thematic report include both the narrower case of technology transfer and the broader category of knowledge transfer.
The institutional performers of R&D activity are covered in detail in the forthcoming Indicators 2024 report “Research and Development: U.S. Trends and International Comparisons” and the Indicators 2024 report “Academic Research and Development.” Knowledge transfer also includes transfer between individuals, transfer from one organization to another, and transfer to new fields of study and domains of application.
Business Collaborations and Patent Citations to Published Literature
All parties have the potential to benefit when business, academia, and government agencies collaborate. Through collaboration, the participants share access to advanced tools, emerging technologies, unpublished or private data, and technical expertise. Coauthorship of peer-reviewed publications in the Scopus database is an indicator of such collaborations. The Scopus database is an abstract and citation database of scholarly literature that is also used in the Indicators 2024 report “Publications Output: U.S. Trends and International Comparisons.”
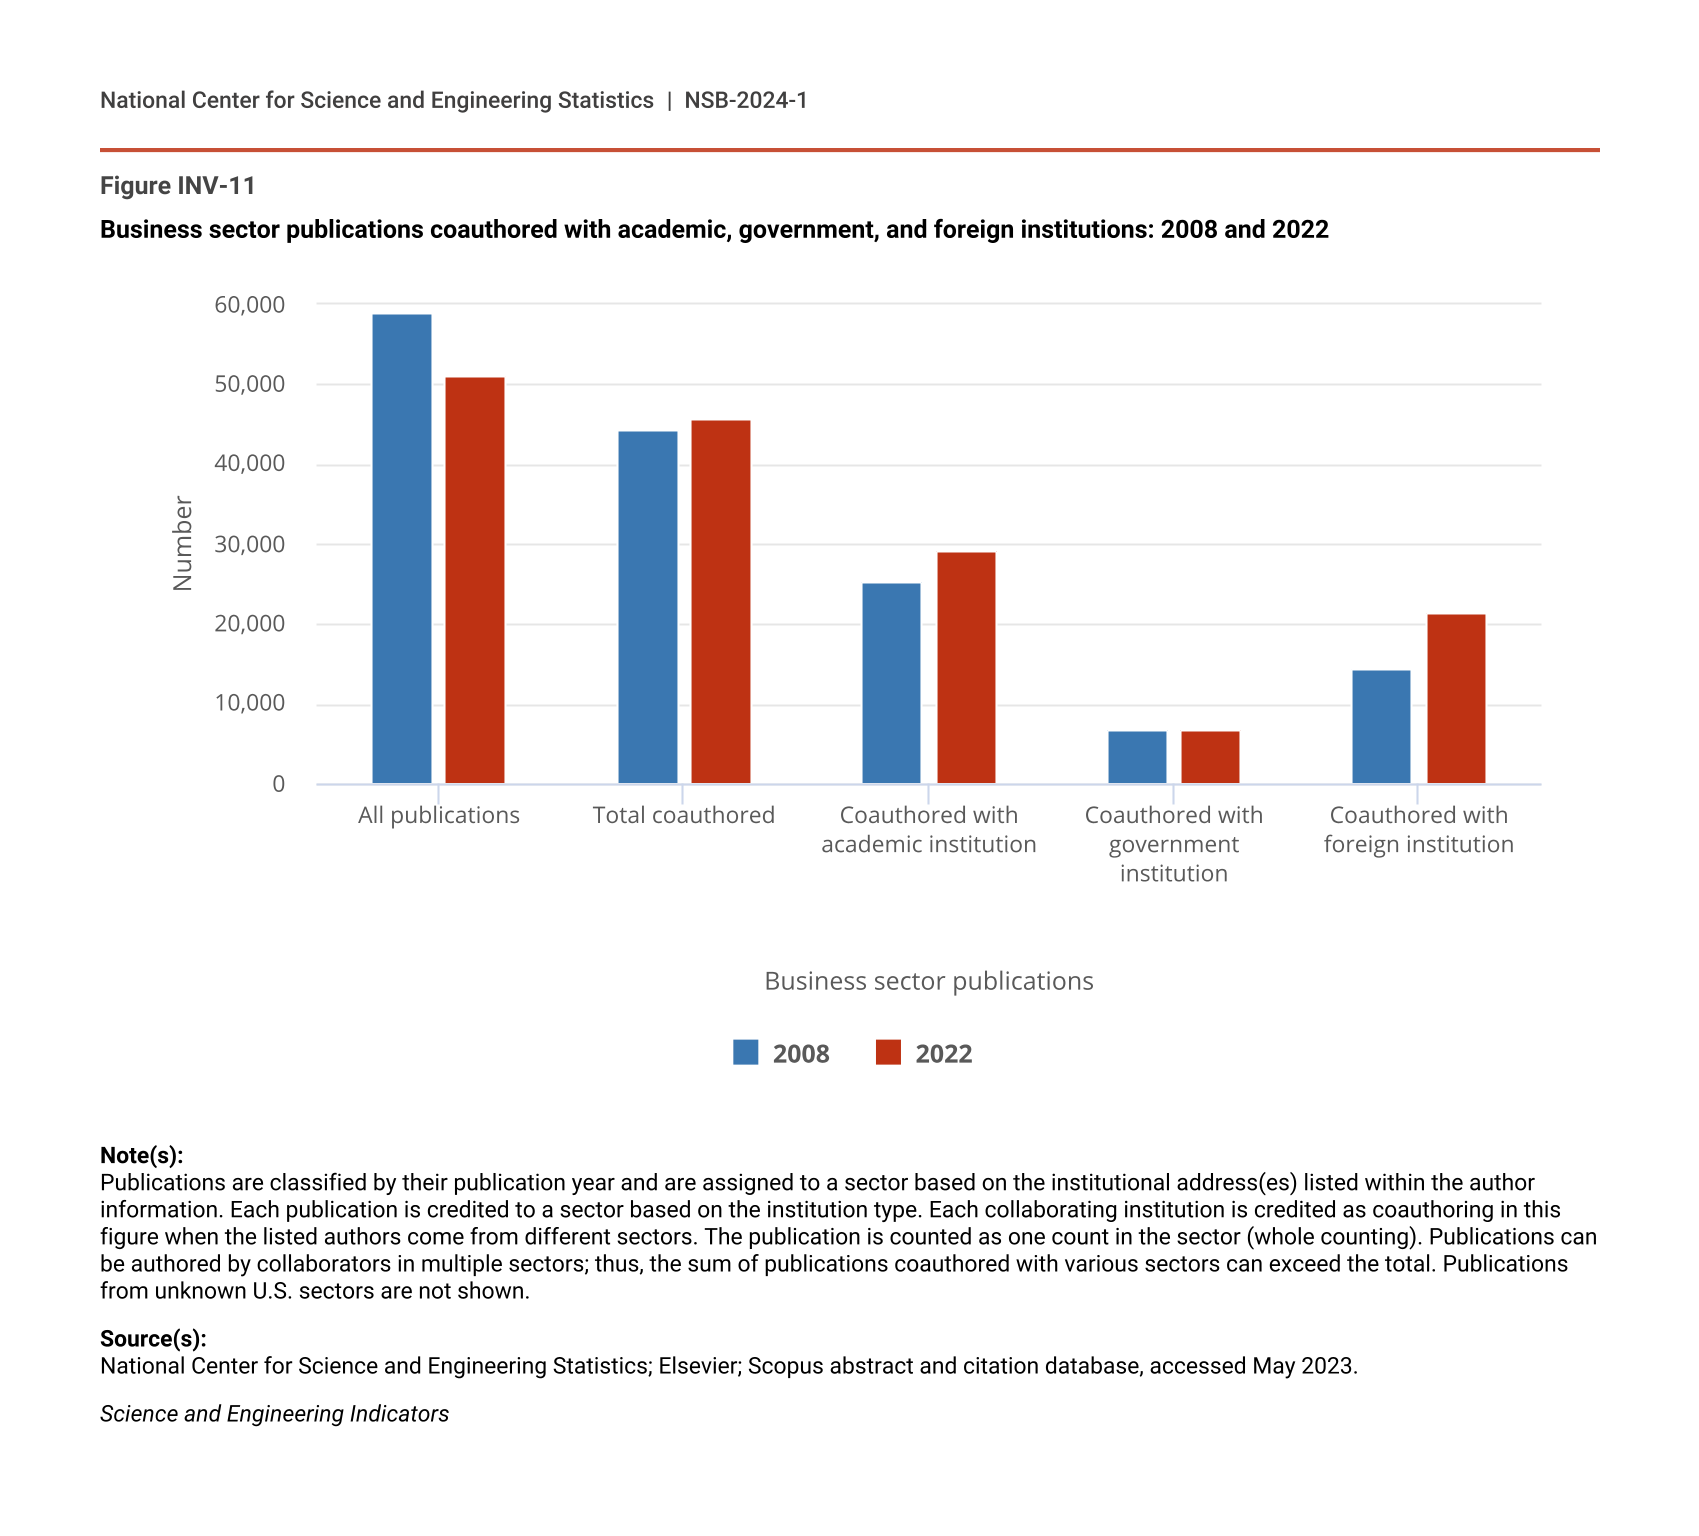
To calculate collaboration activity, each author is credited once for their participation in the article. On this basis, more than 51,000 publications included authors with U.S. business affiliations. In 2022, over 45,600 (90%) of business-authored publications were coauthored with authors from other institutions, up from about 44,000 (75%) in 2008 (Figure INV-11). Collaborations between U.S. business authors and U.S. academic authors grew by almost 4,000 publications to more than 29,000 in 2022 (Figure INV-11). There were about 7,000 coauthored publications with U.S. government and U.S. business institutions, about 13% of all business-authored publications in 2022 (Figure INV-11).
Business sector publications coauthored with academic, government, and foreign institutions: 2008 and 2022
| Business sector publications | 2008 | 2022 |
|---|---|---|
| All publications | 58,874 | 51,144 |
| Total coauthored | 44,311 | 45,655 |
| Coauthored with academic institution | 25,356 | 29,308 |
| Coauthored with government institution | 6,709 | 6,871 |
| Coauthored with foreign institution | 14,405 | 21,402 |
Note(s):
Publications are classified by their publication year and are assigned to a sector based on the institutional address(es) listed within the author information. Each publication is credited to a sector based on the institution type. Each collaborating institution is credited as coauthoring in this figure when the listed authors come from different sectors. The publication is counted as one count in the sector (whole counting). Publications can be authored by collaborators in multiple sectors; thus, the sum of publications coauthored with various sectors can exceed the total. Publications from unknown U.S. sectors are not shown.
Source(s):
National Center for Science and Engineering Statistics; Elsevier; Scopus abstract and citation database, accessed May 2023.
Science and Engineering Indicators
Consistent with the overall increase of international collaboration in peer-reviewed literature (NSB 2021a), the largest increase in collaboration for business-authored publications is with international authors. Among the business-coauthored publications, this category of cooperation grew the most. From 2008 to 2022, the number and proportion of publications coauthored between U.S. businesses and foreign collaborators increased, reaching about 21,500 (42%) of all business-authored publications in 2022 versus about 14,500 in 2008 (25%) (Figure INV-11). Publications, citations, and collaborations in peer-reviewed literature are covered in greater depth in the Indicators 2024 report “Publications Output: U.S. Trends and International Comparisons.”
Publications Cited in Patents
When peer-reviewed publications from any author are cited in the reference section of patent documents, the linkage between the two documents indicates that the scientific literature may have contributed knowledge to the patented invention. Analyses of these citations show the disproportionately large role of academic publications in the nonpatent literature cited in patents, pointing to the importance of academic research in invention (Table SINV-21). Of almost 634,000 citations to S&E articles in patents in 2022, about 30% were to articles from the U.S. academic sector (Table SINV-21).
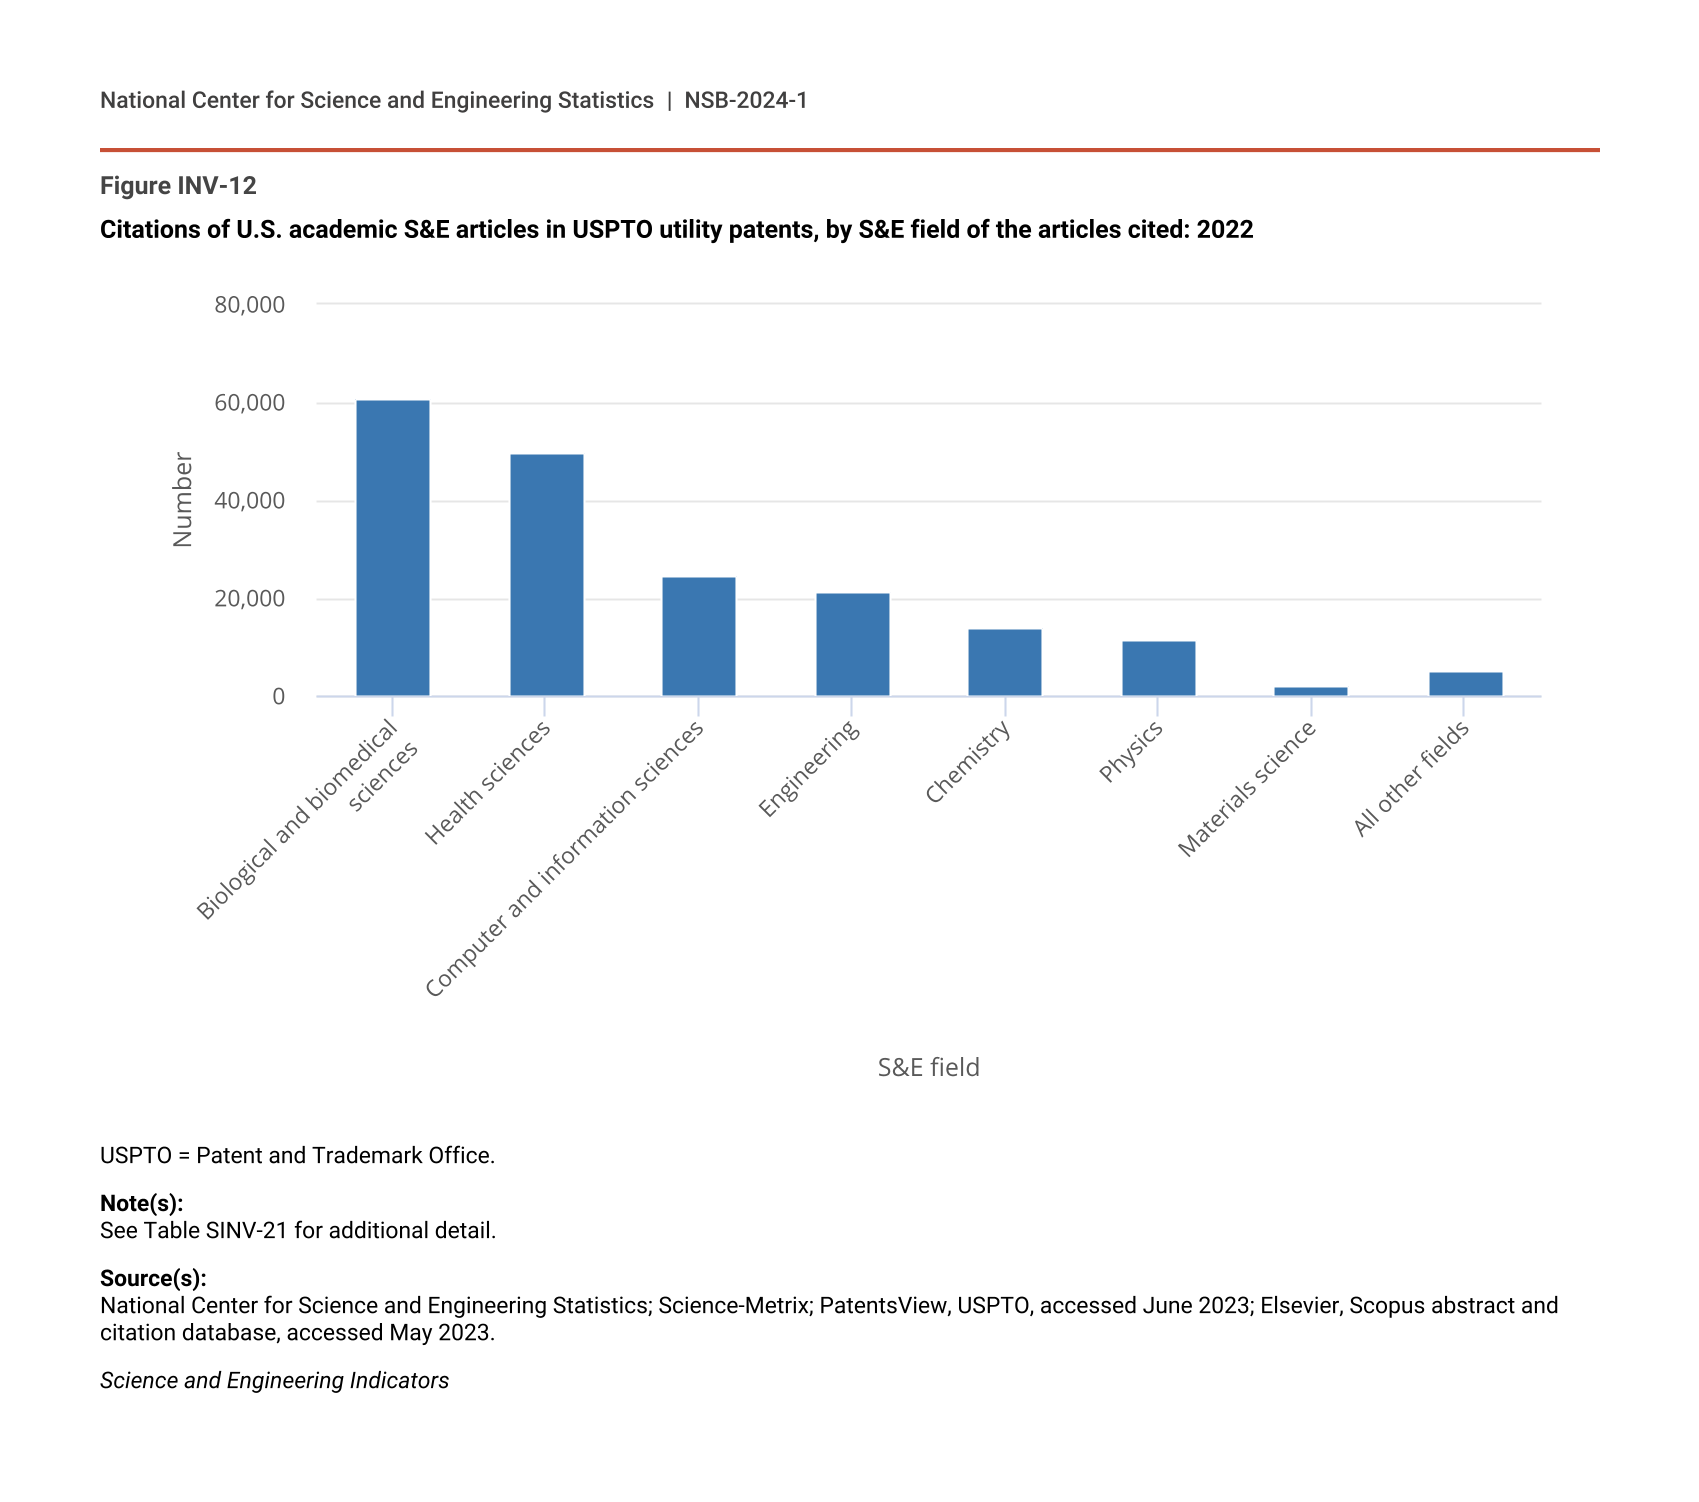
By field of science, biological and biomedical sciences are cited more often than any other S&E field in U.S.-granted patents; this is true for U.S. authors affiliated with academia, business, or federal laboratories. However, the scale of these citations varies substantially among sectors: for S&E publications in the biological and biomedical sciences, those with academic authors were cited by patents 61,000 times, while those publications with business authors were cited 13,000 times and those with federal authors were cited 5,000 times (Table SINV-21). In addition to biological and biomedical sciences, health sciences publications are cited next most frequently in patent documents. U.S. academic authors accounted for almost 50,000 health sciences citations in patent documents (Figure INV-12).
Citations of U.S. academic S&E articles in USPTO utility patents, by S&E field of the articles cited: 2022
| S&E field | Number |
|---|---|
| Biological and biomedical sciences | 60,742 |
| Health sciences | 49,923 |
| Computer and information sciences | 24,703 |
| Engineering | 21,086 |
| Chemistry | 14,014 |
| Physics | 11,536 |
| Materials science | 2,249 |
| All other fields | 4,994 |
USPTO = Patent and Trademark Office.
Note(s):
See Table SINV-21 for additional detail.
Source(s):
National Center for Science and Engineering Statistics; Science-Metrix; PatentsView, USPTO, accessed June 2023; Elsevier, Scopus abstract and citation database, accessed May 2023.
Science and Engineering Indicators
Federal Publications Cited in Patents
At the department or agency level and across disciplines, the Department of Energy (DOE) has the highest number of peer-reviewed publications by federal government authors, about 19,100 in 2022, followed by Department of Health and Human Services (HHS) with 14,000. Publications by federal government authors affiliated with HHS received about 16,000 citations in patent documents in 2022, and those affiliated with DOE authors received the next highest number of citations with about 11,100 citations (Table INV-2). The role of these agencies in knowledge transfer is illustrated by the relative magnitudes of these publications and patent citations compared with the magnitude of USPTO patents granted to inventors from federal departments or agencies. Only inventors affiliated with the Department of Defense (DOD) and DOE were granted more than 400 utility patents in 2022 (Table INV-2).
USPTO utility patent and publication metrics for selected federal departments or agencies: 2022
DHS = Department of Homeland Security; DOC = Department of Commerce; DOD = Department of Defense; DOE = Department of Energy; DOI = Department of the Interior; DOT = Department of Transportation; EPA = Environmental Protection Agency; HHS = Department of Health and Human Services; NASA = National Aeronautics and Space Administration; USDA = Department of Agriculture; USPTO = Patent and Trademark Office; VA = Department of Veterans Affairs.
Note(s):
Data are presented by calendar year. Patents are credited on a whole-count basis (i.e., each participating federal agency on a patent is credited for the entire patent, regardless of coassignments). Articles are credited on a whole-count basis (i.e., each participating federal agency on an article receives credit for the entire article, regardless of coauthors). The sum of the individual federal agencies may exceed the total across agencies because articles may have authors from multiple federal agencies.
Source(s):
Science-Metrix using USPTO data indexed in PatentsView, accessed June 2023; Science-Metrix from data provided in Scopus (Elsevier) database, accessed May 2023.
Science and Engineering Indicators
Startup Companies and University Knowledge Transfer Activities
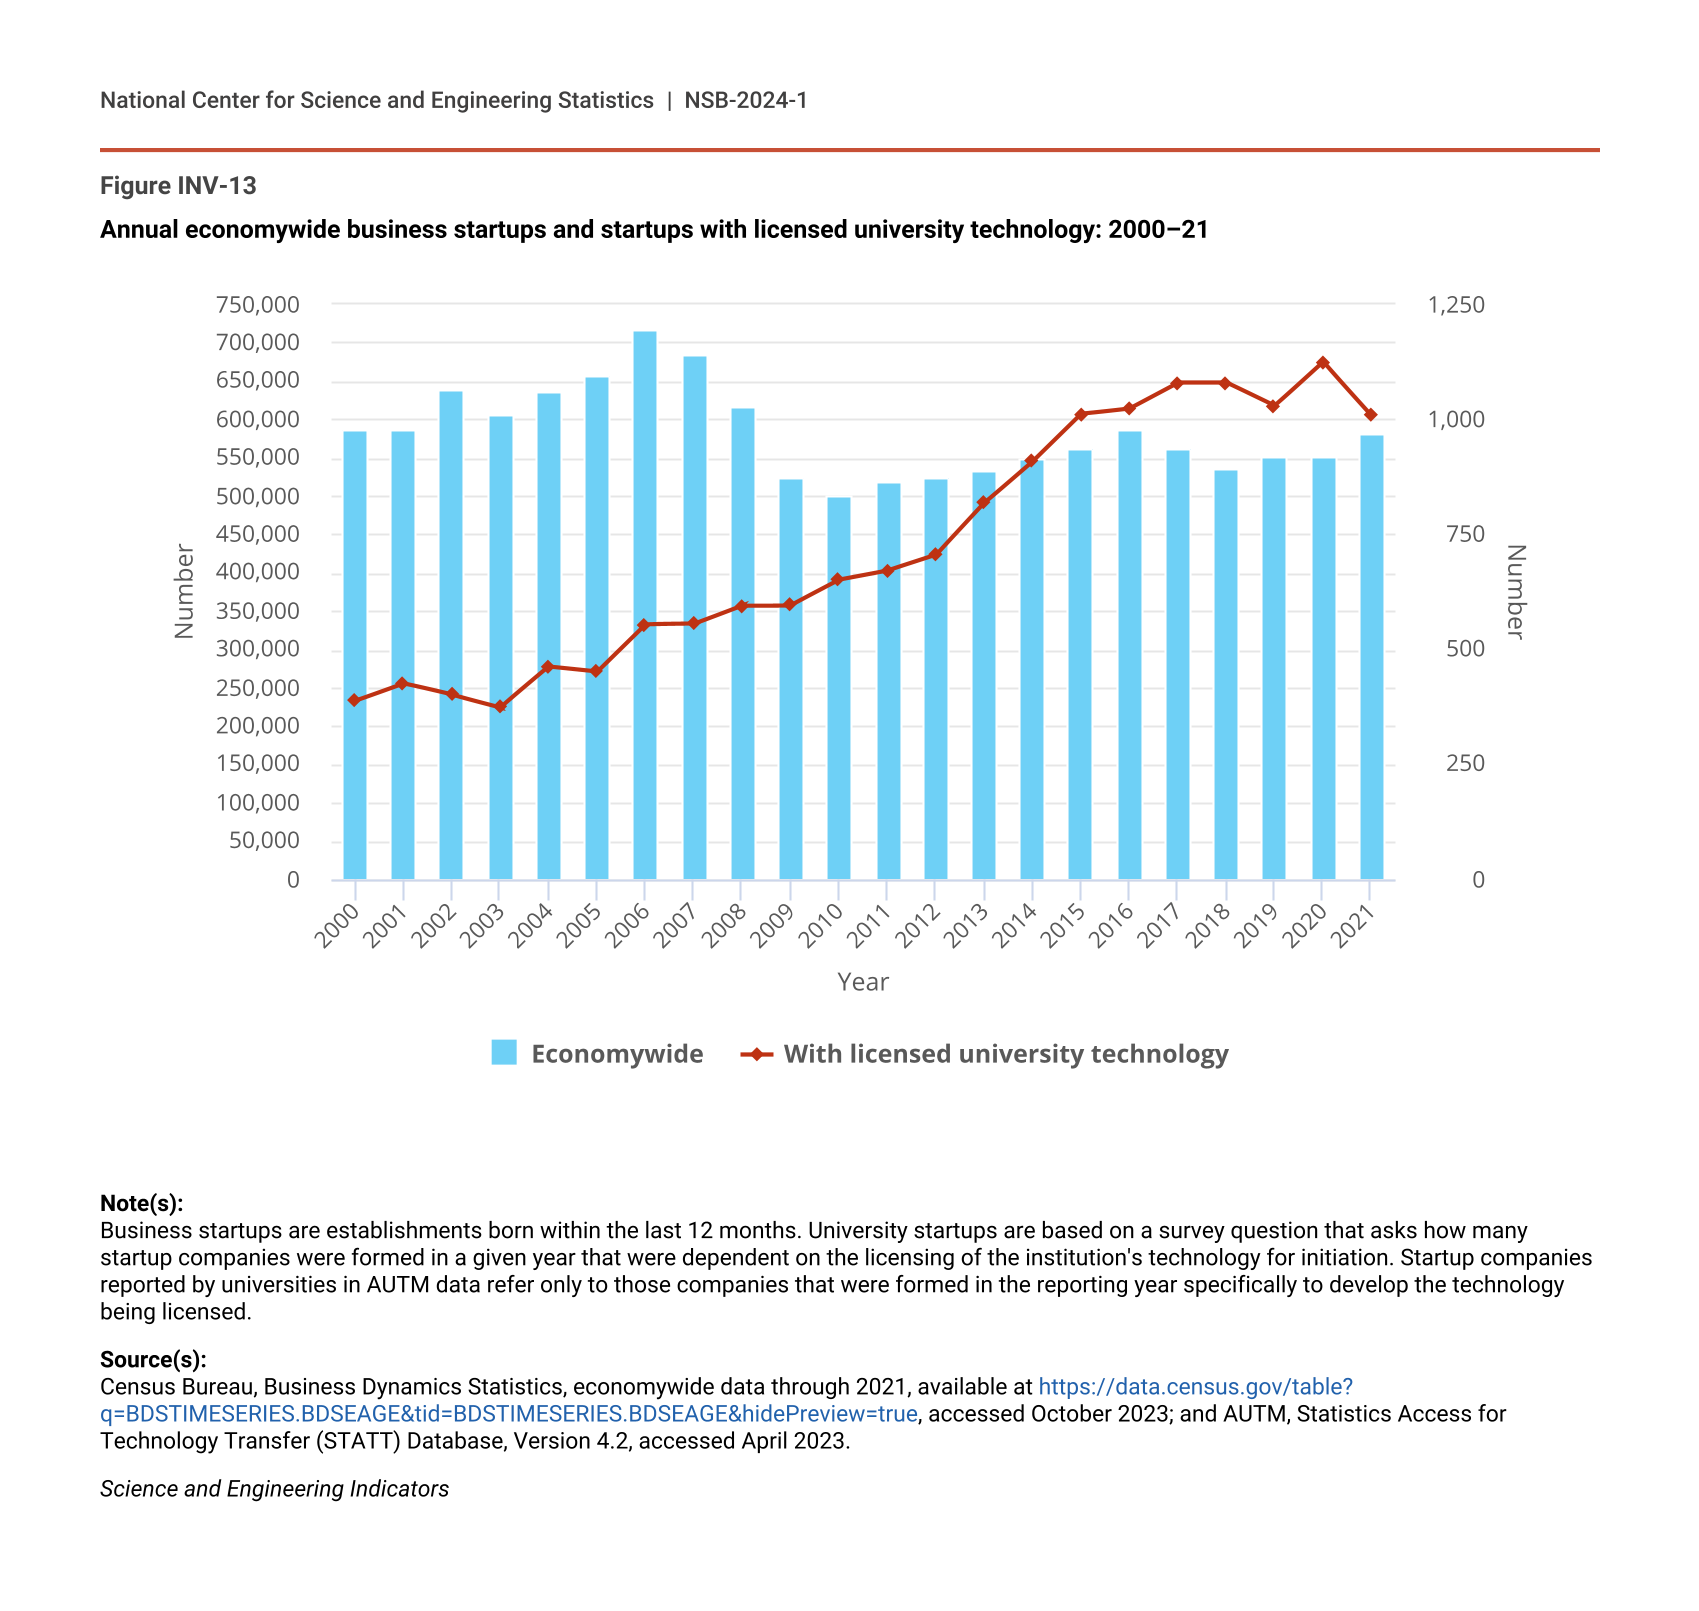
Change in the number of business establishments created in a given year is an aspect of business dynamism that reflects both broad economic factors as well as the impact of technology transfer to the business sector. For example, in several of the years preceding the global financial crisis, more than 600,000 U.S. establishments were less than 1 year old; that number of new establishments has not been reached in any year since 2008 (Figure INV-13).
Annual economywide business startups and startups with licensed university technology: 2000–21
| Year | Economywide | With licensed university technology |
|---|---|---|
| 2000 | 586,389 | 388 |
| 2001 | 586,734 | 426 |
| 2002 | 637,374 | 401 |
| 2003 | 607,129 | 374 |
| 2004 | 636,760 | 462 |
| 2005 | 656,947 | 451 |
| 2006 | 717,206 | 554 |
| 2007 | 685,024 | 555 |
| 2008 | 617,725 | 595 |
| 2009 | 523,529 | 596 |
| 2010 | 500,377 | 651 |
| 2011 | 518,668 | 671 |
| 2012 | 524,440 | 705 |
| 2013 | 532,856 | 818 |
| 2014 | 547,683 | 909 |
| 2015 | 562,172 | 1,012 |
| 2016 | 586,847 | 1,024 |
| 2017 | 562,583 | 1,080 |
| 2018 | 534,747 | 1,080 |
| 2019 | 550,837 | 1,029 |
| 2020 | 552,971 | 1,125 |
| 2021 | 581,064 | 1,009 |
Note(s):
Business startups are establishments born within the last 12 months. University startups are based on a survey question that asks how many startup companies were formed in a given year that were dependent on the licensing of the institution's technology for initiation. Startup companies reported by universities in AUTM data refer only to those companies that were formed in the reporting year specifically to develop the technology being licensed.
Source(s):
Census Bureau, Business Dynamics Statistics, economywide data through 2021, available at https://data.census.gov/table?q=BDSTIMESERIES.BDSEAGE&tid=BDSTIMESERIES.BDSEAGE&hidePreview=true, accessed October 2023; and AUTM, Statistics Access for Technology Transfer (STATT) Database, Version 4.2, accessed April 2023.
Science and Engineering Indicators
A small subset of those startups is formed specifically to develop and license university technology. These startups represent a technology commercialization component of knowledge transfer by university faculty, staff, and students. In addition, for many technology-based startups, possession of a patent or an exclusive option to license a patent is an important factor in attracting external financing. In each year between 2015 and 2021, more than 1,000 businesses were reported as startups by universities in AUTM data (Figure INV-13). These startup companies reported by universities in AUTM data refer to companies that were formed in the reporting year specifically to develop the technology being licensed (AUTM 2022).
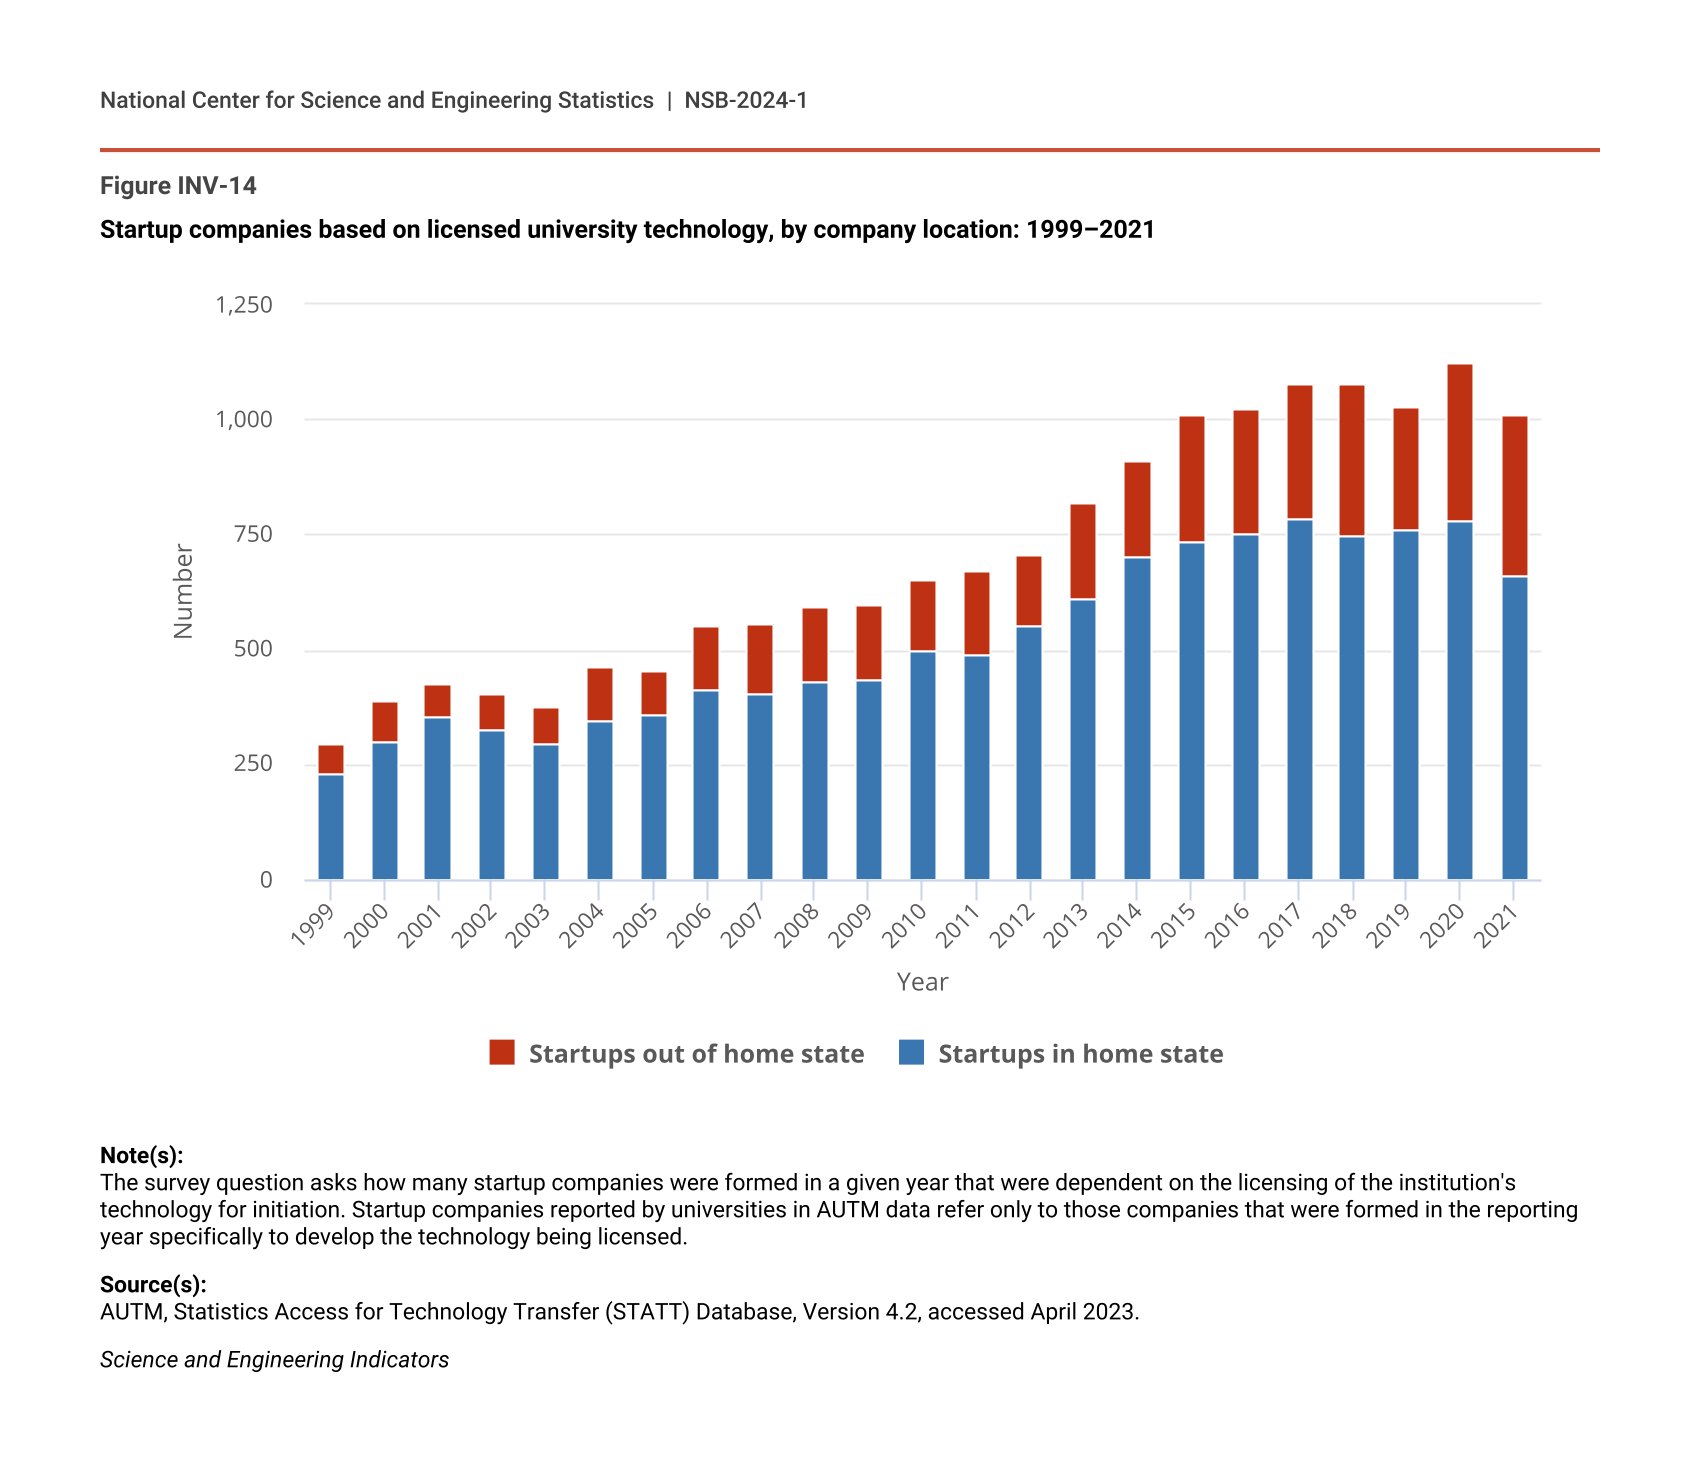
Patented inventions can be licensed directly to an external party, or an exclusive option can be granted for licensing rights at a future date. According to AUTM, U.S. universities issued almost 8,800 new licenses or options in 2021. Increasingly, university technology licenses or license options are executed by startups and small firms (those with fewer than 500 employees). In 2011, startups and small businesses accounted for 69% of new licenses or options—by 2021, this portion had increased to 78% (Table INV-3). Most university-related startups are in the home state of the research university (66%) (Figure INV-14). The number of university-related startups launched annually increased steadily through 2017 and reached a peak of 1,125 in 2020 before declining slightly in 2021 (Figure INV-14).
University technology licenses or license options executed, by company characteristic: 2011, 2016, and 2021
Note(s):
AUTM collects data on invention and patent-related activities of its member universities and hospitals. Responding institutions may report for any 12-month period ending in the identified year. Startup companies reported by universities in AUTM data refer only to those companies that were formed in the reporting year specifically to develop the technology being licensed. Counts of licenses to startups and small companies are mutually exclusive. Small companies are those with fewer than 500 employees.
Source(s):
AUTM, AUTM Licensing Survey (various years), accessed April 2023.
Science and Engineering Indicators
Startup companies based on licensed university technology, by company location: 1999–2021
| Year | Startups in home state | Startups out of home state |
|---|---|---|
| 1999 | 230 | 64 |
| 2000 | 299 | 89 |
| 2001 | 353 | 73 |
| 2002 | 325 | 76 |
| 2003 | 295 | 79 |
| 2004 | 344 | 118 |
| 2005 | 357 | 94 |
| 2006 | 410 | 144 |
| 2007 | 402 | 153 |
| 2008 | 430 | 165 |
| 2009 | 435 | 161 |
| 2010 | 498 | 153 |
| 2011 | 487 | 184 |
| 2012 | 554 | 151 |
| 2013 | 611 | 207 |
| 2014 | 702 | 207 |
| 2015 | 735 | 277 |
| 2016 | 752 | 272 |
| 2017 | 782 | 298 |
| 2018 | 749 | 331 |
| 2019 | 763 | 266 |
| 2020 | 778 | 347 |
| 2021 | 663 | 346 |
Note(s):
The survey question asks how many startup companies were formed in a given year that were dependent on the licensing of the institution's technology for initiation. Startup companies reported by universities in AUTM data refer only to those companies that were formed in the reporting year specifically to develop the technology being licensed.
Source(s):
AUTM, Statistics Access for Technology Transfer (STATT) Database, Version 4.2, accessed April 2023.
Science and Engineering Indicators
Federal Government Knowledge Transfer Support
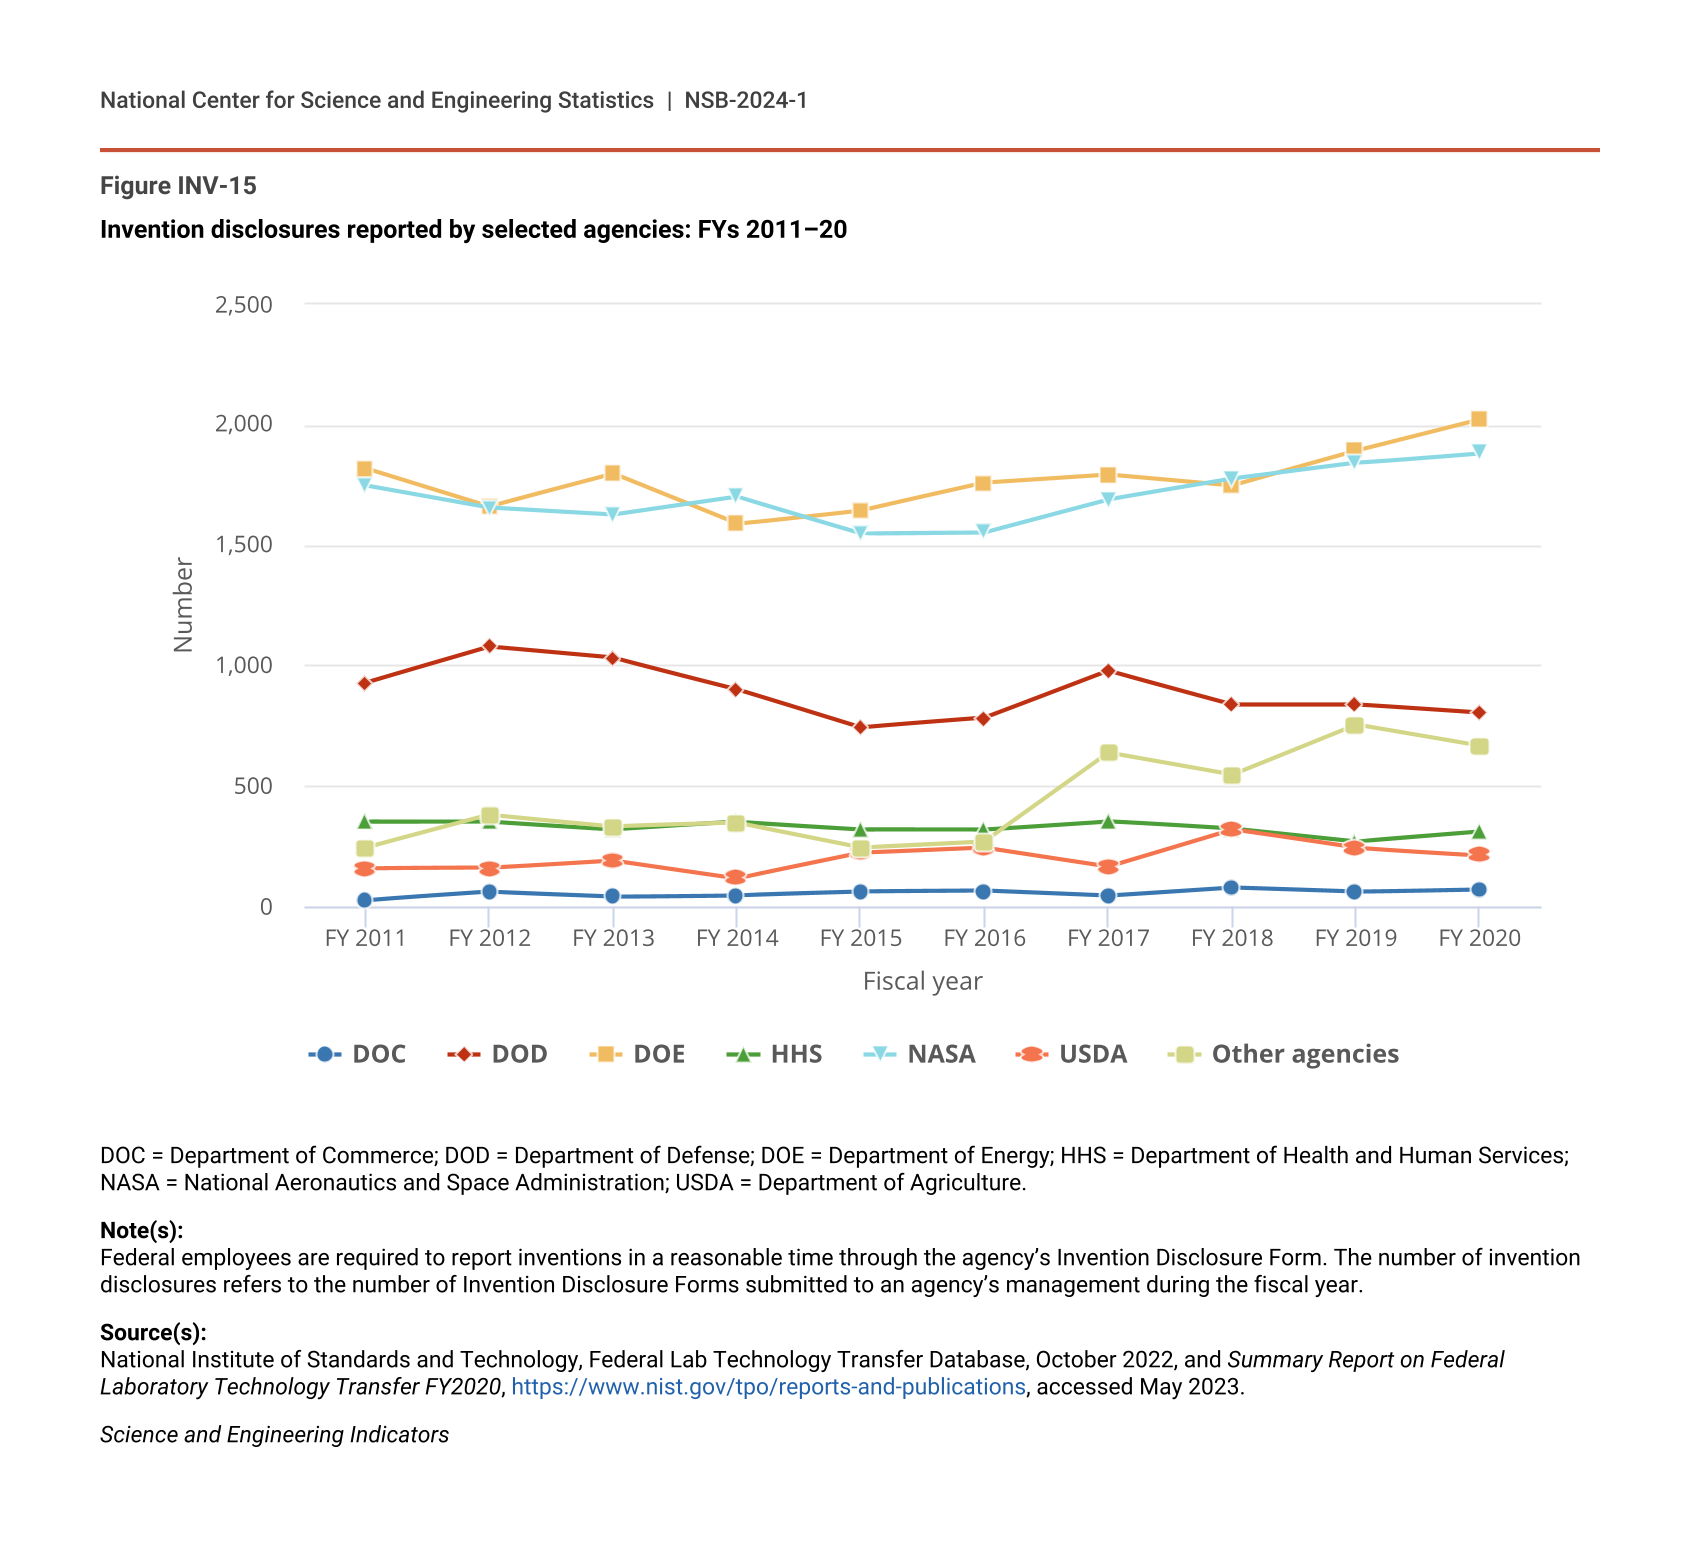
Multiple indicators provide insight into how federal R&D contributes to innovation through knowledge transfer. Federal laboratories facilitate knowledge transfer in various ways, with several measures reported annually by congressional mandate. These measures include R&D spending, invention disclosures, patenting, licensing, and peer-reviewed publications (NIST 2022). Additionally, federal laboratories and federal science-funding agencies support startups in many ways, including through material transfer agreements and collaborative research. Researchers at these laboratories are required to report the development of novel techniques and technologies to laboratory management as invention disclosure. While each federal agency has its own process for determining when a researcher is required to file an invention disclosure, the disclosure form is designed to provide the laboratories with sufficient notice to file for patent protection on promising inventions. Two agencies (DOE and National Aeronautics and Space Administration) accounted for over 60% of federal agency invention disclosures in each year from 2011 to 2020, with collectively more than 3,000 disclosures each year (Figure INV-15).
Invention disclosures reported by selected agencies: FYs 2011–20
| Fiscal year | DOC | DOD | DOE | HHS | NASA | USDA | Other agencies |
|---|---|---|---|---|---|---|---|
| FY 2011 | 26 | 929 | 1,820 | 351 | 1,748 | 158 | 244 |
| FY 2012 | 60 | 1,078 | 1,661 | 352 | 1,656 | 160 | 380 |
| FY 2013 | 41 | 1,032 | 1,796 | 320 | 1,627 | 191 | 333 |
| FY 2014 | 47 | 902 | 1,588 | 351 | 1,701 | 117 | 347 |
| FY 2015 | 61 | 743 | 1,645 | 321 | 1,550 | 222 | 245 |
| FY 2016 | 64 | 782 | 1,760 | 320 | 1,554 | 244 | 270 |
| FY 2017 | 43 | 978 | 1,794 | 354 | 1,690 | 166 | 637 |
| FY 2018 | 77 | 839 | 1,748 | 322 | 1,775 | 320 | 546 |
| FY 2019 | 60 | 839 | 1,891 | 268 | 1,841 | 243 | 754 |
| FY 2020 | 70 | 804 | 2,021 | 309 | 1,882 | 213 | 666 |
DOC = Department of Commerce; DOD = Department of Defense; DOE = Department of Energy; HHS = Department of Health and Human Services; NASA = National Aeronautics and Space Administration; USDA = Department of Agriculture.
Note(s):
Federal employees are required to report inventions in a reasonable time through the agency’s Invention Disclosure Form. The number of invention disclosures refers to the number of Invention Disclosure Forms submitted to an agency’s management during the fiscal year.
Source(s):
National Institute of Standards and Technology, Federal Lab Technology Transfer Database, October 2022, and Summary Report on Federal Laboratory Technology Transfer FY2020, https://www.nist.gov/tpo/reports-and-publications, accessed May 2023.
Science and Engineering Indicators
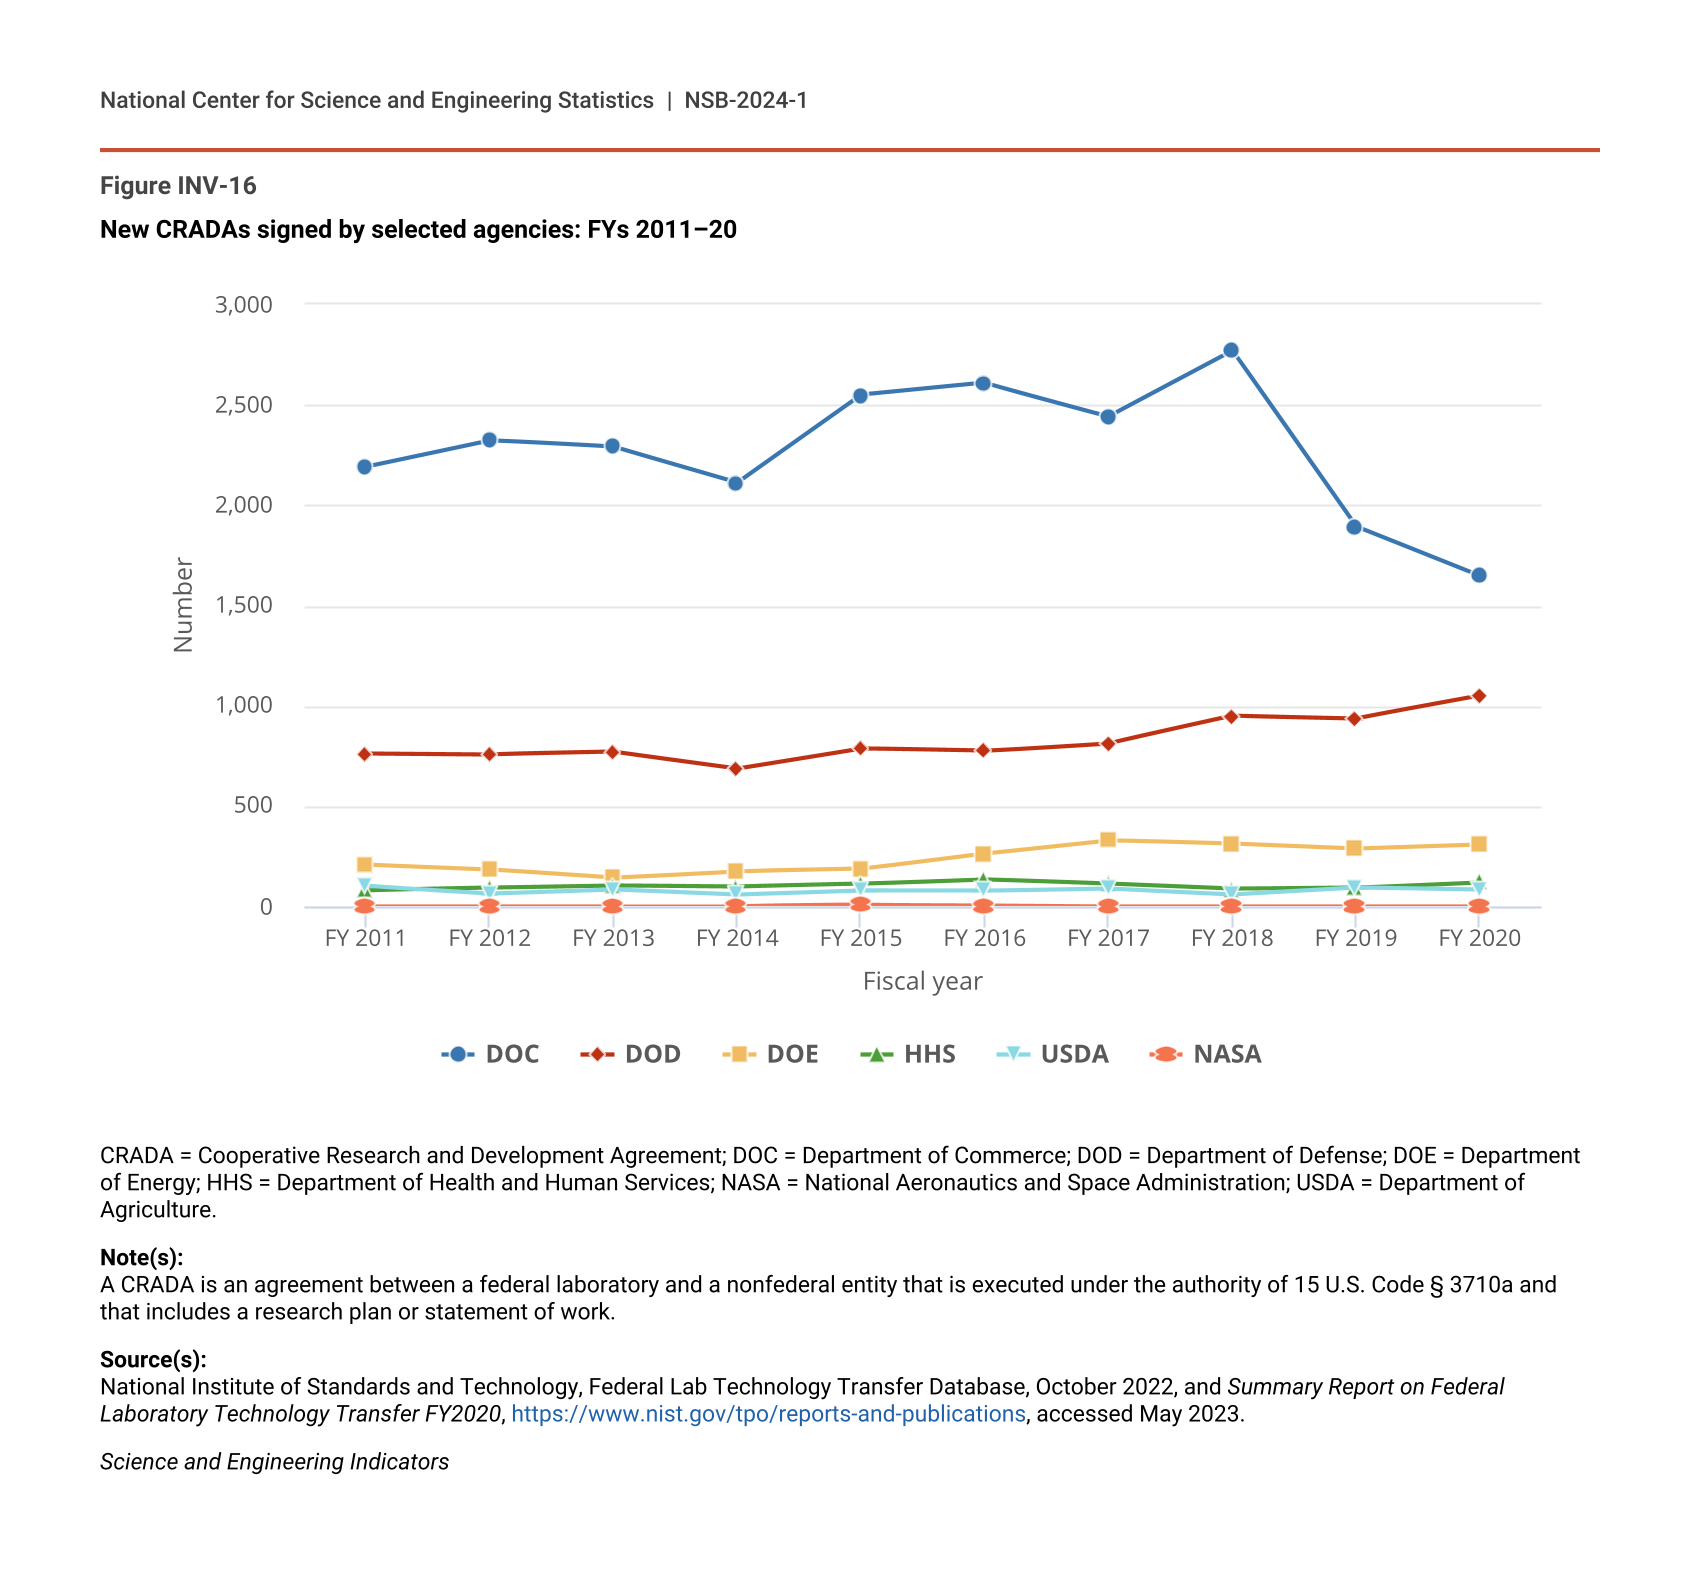
Collaborative relationships include cooperative R&D agreements (CRADAs), of which the traditional type involves an agreement between a federal agency or laboratory and one or more nonfederal organizations. The nonfederal organization (a business, nonprofit, or other government entity) provides some of its own resources for research activity. In exchange, the nonfederal organization is granted the option for an exclusive license to the resulting technologies, if any. Nontraditional CRADAs provide material transfer or other forms of federal technical assistance that may result in protected information. The Department of Commerce (DOC) consistently enters into the highest number of CRADAs (Figure INV-16) due to the cooperative research activity at the National Institute of Standards and Technology, which works closely with industry on standards development, metrology techniques, and other research areas with high commercial relevance (DOC 2020). In addition to the technology transfer metrics described here, federal agencies also release data sets and open-source software, and they engage in science activities with the public (see sidebar Federal Support for Open Science and Public Engagement in Science).
New CRADAs signed by selected agencies: FYs 2011–20
| Fiscal year | DOC | DOD | DOE | HHS | USDA | NASA |
|---|---|---|---|---|---|---|
| FY 2011 | 2,192 | 762 | 208 | 81 | 102 | 0 |
| FY 2012 | 2,323 | 757 | 184 | 93 | 65 | 0 |
| FY 2013 | 2,289 | 769 | 142 | 104 | 86 | 0 |
| FY 2014 | 2,111 | 686 | 174 | 98 | 60 | 1 |
| FY 2015 | 2,548 | 786 | 186 | 112 | 80 | 7 |
| FY 2016 | 2,608 | 774 | 264 | 134 | 79 | 5 |
| FY 2017 | 2,443 | 813 | 330 | 112 | 91 | 0 |
| FY 2018 | 2,770 | 949 | 312 | 87 | 61 | 0 |
| FY 2019 | 1,893 | 936 | 287 | 93 | 95 | 0 |
| FY 2020 | 1,647 | 1,048 | 307 | 120 | 84 | 0 |
CRADA = Cooperative Research and Development Agreement; DOC = Department of Commerce; DOD = Department of Defense; DOE = Department of Energy; HHS = Department of Health and Human Services; NASA = National Aeronautics and Space Administration; USDA = Department of Agriculture.
Note(s):
A CRADA is an agreement between a federal laboratory and a nonfederal entity that is executed under the authority of 15 U.S. Code § 3710a and that includes a research plan or statement of work.
Source(s):
National Institute of Standards and Technology, Federal Lab Technology Transfer Database, October 2022, and Summary Report on Federal Laboratory Technology Transfer FY2020, https://www.nist.gov/tpo/reports-and-publications, accessed May 2023.
Science and Engineering Indicators
As individual contributors, developers with federal agency or department affiliations have also made extensive contributions to open-source software, based on information from the GitHub platform (Table SINV-29). The Indicators 2022 report “Invention, Knowledge Transfer, and Innovation” provides more extensive discussion of agency-specific information on open-source repositories (NSB Indicators 2022: Table INV-4) as well as information about international collaboration in the development of open-source software (NSB Indicators 2022: Figure INV-A).