 An official website of the United States government
 Recent Trends in Federal Support for U.S. R&D
This section provides a more detailed account of the federal government’s present roles as performer and as funder of the U.S. R&D enterprise. At the time of this report, the most recent fiscal year for which complete and final funding data are available is FY 2020. Data cited for FY 2021 are preliminary and may be revised in a subsequent survey edition. The trend comparisons discussed refer mainly to the period of FYs 2008–21. There is also a concluding discussion that compares indicators of U.S. federal R&D with those of the largest other R&D-performing countries.
The data discussed throughout this section are the obligations of federal agencies for R&D and R&D plant by federal fiscal year. Obligations represent the monetary amount of orders placed, contracts awarded, services received, and other similar transactions, regardless of when the funds were appropriated and when future payments may be required. Obligations typically provide a better measure of actual agency spending than the budget appropriations granted to agencies by Congress in advance of agency spending actions.
Total of Federal Funding for R&D and for Major Agencies
Currently, 33 federal agencies (14 departments, 19 independent agencies) perform or fund R&D in support of their mission. Over the years, one of the federal government’s most significant roles in supporting U.S. science and engineering (S&E) has been to provide a regular stream of funding for R&D performed by both federal entities (agency intramural laboratories and facilities and FFRDCs) and external, nonfederal organizations, such as businesses, academic institutions, state and local governments, and nonprofit organizations.
For many years, most all of the yearly federal R&D funding total is accounted for by a relatively small group of departments and agencies: the Department of Defense (DOD), the Department of Health and Human Services (HHS, which includes the National Institutes of Health [NIH]), the Department of Energy (DOE), the National Aeronautics and Space Administration (NASA), the National Science Foundation (NSF), the Department of Agriculture (USDA), the Department of Commerce (DOC), the Department of Veterans Affairs (VA), and the Department of Transportation (DOT) (Table RD-15).
Federal obligations for R&D and R&D plant, by agency: FYs 2008–21
na = not applicable.
a Beginning in FY 2016 (and continuing in subsequent years), agency reports of obligations for R&D reflect the application of a definition for development that is narrowed to experimental development. This revision was introduced to align federal R&D budget formulation consistent with the Office of Management and Budget's Circular A-11, Section 84. This change in definition applies to all agencies, but the predominant impact is that the Department of Defense's (DOD's) Operational Systems Development (Budget Activity 7) is no longer included as development. DOD Operational Systems Development was about $24.6 billion in FY 2016, $26.0 billion in FY 2017, $26.7 billion in FY 2018, $35.2 billion in FY 2019, and $37.3 billion in FY 2020. Accordingly, the All agencies and DOD R&D obligations totals listed above for FYs 2016–21 are not directly comparable with those for FY 2015 and earlier years.
b The data for FY 2021 are preliminary and may later be revised. Obligations for FYs 2020 and 2021 include the additional funding provided by supplemental COVID-19 related appropriations in these years (i.e., the Coronavirus Aid, Relief, and Economic Security Act of March 2020, the American Rescue Plan Act of March 2021, and several other enacted spending authorizations in these fiscal years).
Note(s):
Table lists (in general) agencies with R&D and R&D plant obligations greater than $100 million in FY 2020. Agency rankings are based on the FY 2020 data. All other agencies includes the Department of Housing and Urban Development, Department of Labor, Department of State, Department of the Treasury, Administrative Office of the U.S. Courts, Appalachian Regional Commission, Consumer Product Safety Commission, Federal Communications Commission, Federal Trade Commission, Library of Congress, National Archives and Records Commission, Nuclear Regulatory Commission, Tennessee Valley Authority, RESTORE Act Centers, U.S. Agency for Global Media, and U.S. Postal Service.
Source(s):
National Center for Science and Engineering Statistics, Survey of Federal Funds for Research and Development, Volume 70, FYs 2020–21.
Science and Engineering Indicators
In FY 2020, the nine agencies mentioned above each obligated near or well above $1 billion (current dollars) annually on R&D and R&D plant (Table RD-15). These nine agencies accounted for 98% of the federal R&D and R&D plant total that year. Another four agencies obligated funding in the $500 million–$900 million range: the Department of the Interior, the Department of Homeland Security, the Environmental Protection Agency, and the Patient-Centered Outcomes Research Trust Fund.
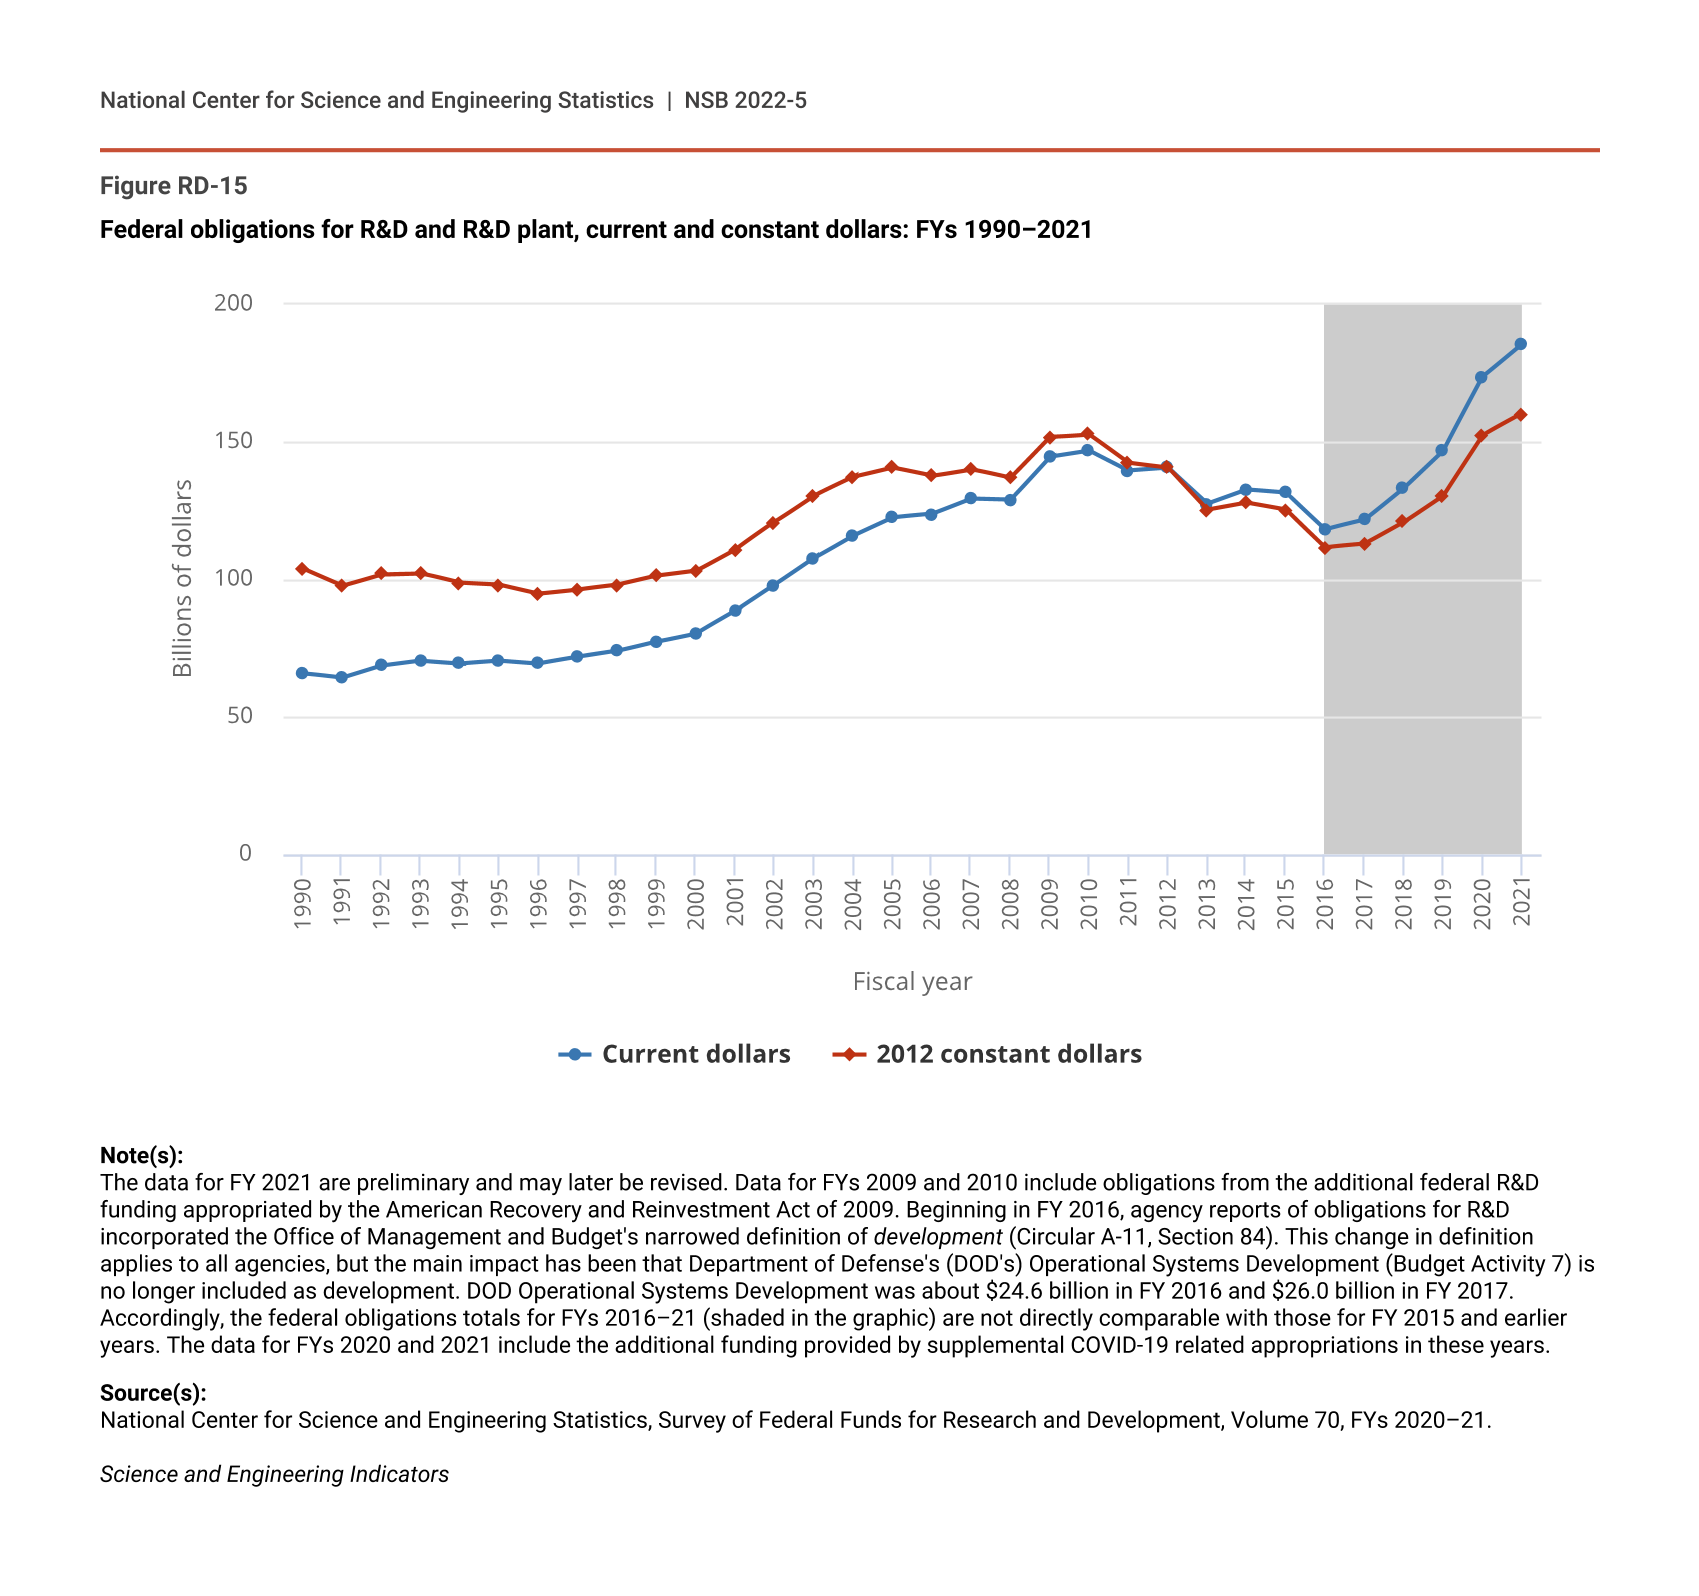
The level of overall federal support for R&D (including for both R&D conduct and R&D plant) has, for the most part, increased annually since the early 1950s (Figure RD-15; Table SRD-5). The $2 billion–$5 billion obligated to R&D in the mid-1950s increased to around $130 billion in FYs 2007 and 2008. The levels moved higher still, to what were then historical peaks in FYs 2009 and 2010, largely a result of the $18.7 billion of incremental funding for R&D authorized by the American Recovery and Reinvestment Act of 2009 (ARRA) (Figure RD-15).
Federal obligations for R&D and R&D plant, current and constant dollars: FYs 1990–2021
| Fiscal year | Current dollars | 2012 constant dollars |
|---|---|---|
| 1990 | 65.83 | 103.83 |
| 1991 | 64.15 | 97.70 |
| 1992 | 68.58 | 101.90 |
| 1993 | 70.41 | 102.23 |
| 1994 | 69.45 | 98.68 |
| 1995 | 70.44 | 98.00 |
| 1996 | 69.40 | 94.77 |
| 1997 | 71.75 | 96.27 |
| 1998 | 73.91 | 97.95 |
| 1999 | 77.39 | 101.25 |
| 2000 | 80.40 | 103.08 |
| 2001 | 88.56 | 110.92 |
| 2002 | 98.01 | 120.83 |
| 2003 | 107.79 | 130.50 |
| 2004 | 116.07 | 137.23 |
| 2005 | 122.62 | 140.68 |
| 2006 | 123.85 | 137.69 |
| 2007 | 129.43 | 140.08 |
| 2008 | 129.05 | 136.84 |
| 2009 | 144.76 | 151.74 |
| 2010 | 146.97 | 152.74 |
| 2011 | 139.70 | 142.35 |
| 2012 | 140.67 | 140.67 |
| 2013 | 127.63 | 125.32 |
| 2014 | 132.78 | 127.92 |
| 2015 | 131.58 | 125.36 |
| 2016 | 118.27 | 111.69 |
| 2017 | 121.63 | 112.86 |
| 2018 | 133.28 | 120.88 |
| 2019 | 146.80 | 130.56 |
| 2020 | 173.55 | 152.44 |
| 2021 | 185.41 | 160.14 |
Note(s):
The data for FY 2021 are preliminary and may later be revised. Data for FYs 2009 and 2010 include obligations from the additional federal R&D funding appropriated by the American Recovery and Reinvestment Act of 2009. Beginning in FY 2016, agency reports of obligations for R&D incorporated the Office of Management and Budget's narrowed definition of development (Circular A-11, Section 84). This change in definition applies to all agencies, but the main impact has been that Department of Defense's (DOD's) Operational Systems Development (Budget Activity 7) is no longer included as development. DOD Operational Systems Development was about $24.6 billion in FY 2016 and $26.0 billion in FY 2017. Accordingly, the federal obligations totals for FYs 2016–21 (shaded in the graphic) are not directly comparable with those for FY 2015 and earlier years. The data for FYs 2020 and 2021 include the additional funding provided by supplemental COVID-19 related appropriations in these years.
Source(s):
National Center for Science and Engineering Statistics, Survey of Federal Funds for Research and Development, Volume 70, FYs 2020–21.
Science and Engineering Indicators
A less favorable trend ensued in FYs 2011–15, however, with the level of federal R&D funding generally dropping over that period (Figure RD-15). Adjusted for inflation, the FY 2015 level was 18% below the FY 2010 level (Table SRD-5). Some of this post–FY 2010 drop in federal R&D funding reflected a normal waning of the incremental funding provided by ARRA, which showed up as R&D obligations mainly in FYs 2009 and 2010. Some of the decreased funding can also be attributed to the slow post–Great Recession expansion of the U.S. economy. But, in addition, emerging pressures on federal discretionary spending and the more challenging policy setting for federal budget decisions in 2011 and after also played roles. These factors all took a toll on the federal funding approved for R&D as part of the larger federal budget picture.
The large, continued drop in the FY 2016 level of funding may appear to be a continuation of the substantial falloff of federal funding starting in FY 2011, but it mainly reflects an important technical change in the official data. Beginning in FY 2016, federal agencies reported R&D spending using a narrowed definition of development adopted by the Office of Management and Budget (OMB) (and consistent with international standards). As issued, this refined definition covered all agencies. But, as a practical matter, only a few agencies experienced noticeable effects: NASA, to a modest degree, with a decline in reported development (and, correspondingly, the R&D total) of $2 billion in FY 2016 and similar thereafter, but DOD, in a rather large way, with $25 billion of formerly reported development excluded in FY 2016 and somewhat larger amounts in more recent years. No other agencies indicated that the change in OMB’s official definition of R&D resulted in revisions to their reported R&D totals.
A trend of annual funding increases returned in FYs 2017–21, although now starting from a lower baseline, given the adoption of the revised development definition in FY 2016. The $147 billion of R&D obligations reported in FY 2019 returned to the prior peak in FY 2010, which was then exceeded by the $174 billion in FY 2020 and $185 billion (preliminary) in FY 2021 (Figure RD-15). When adjusted for inflation, the FY 2019 level was still well below the FY 2010 peak; the FY 2020 level nearly matched that of FY 2010, however, and the FY 2021 level surpassed the FY 2010 peak (Table SRD-5). Nonetheless, whether tracked in current or constant dollars, federal funding has consistently increased in FYs 2017–21.
The federal budget-making process continued to be tested by competing interests during these years. But when the final spending bills emerged, Congress had conferred significant year-over-year increases in R&D funding. A second consideration, and a main reason for the large year-over-year federal funding increases in FYs 2020 and 2021, has been the regular agency and supplemental funding enacted by Congress to enable R&D responsive to the COVID-19 pandemic.
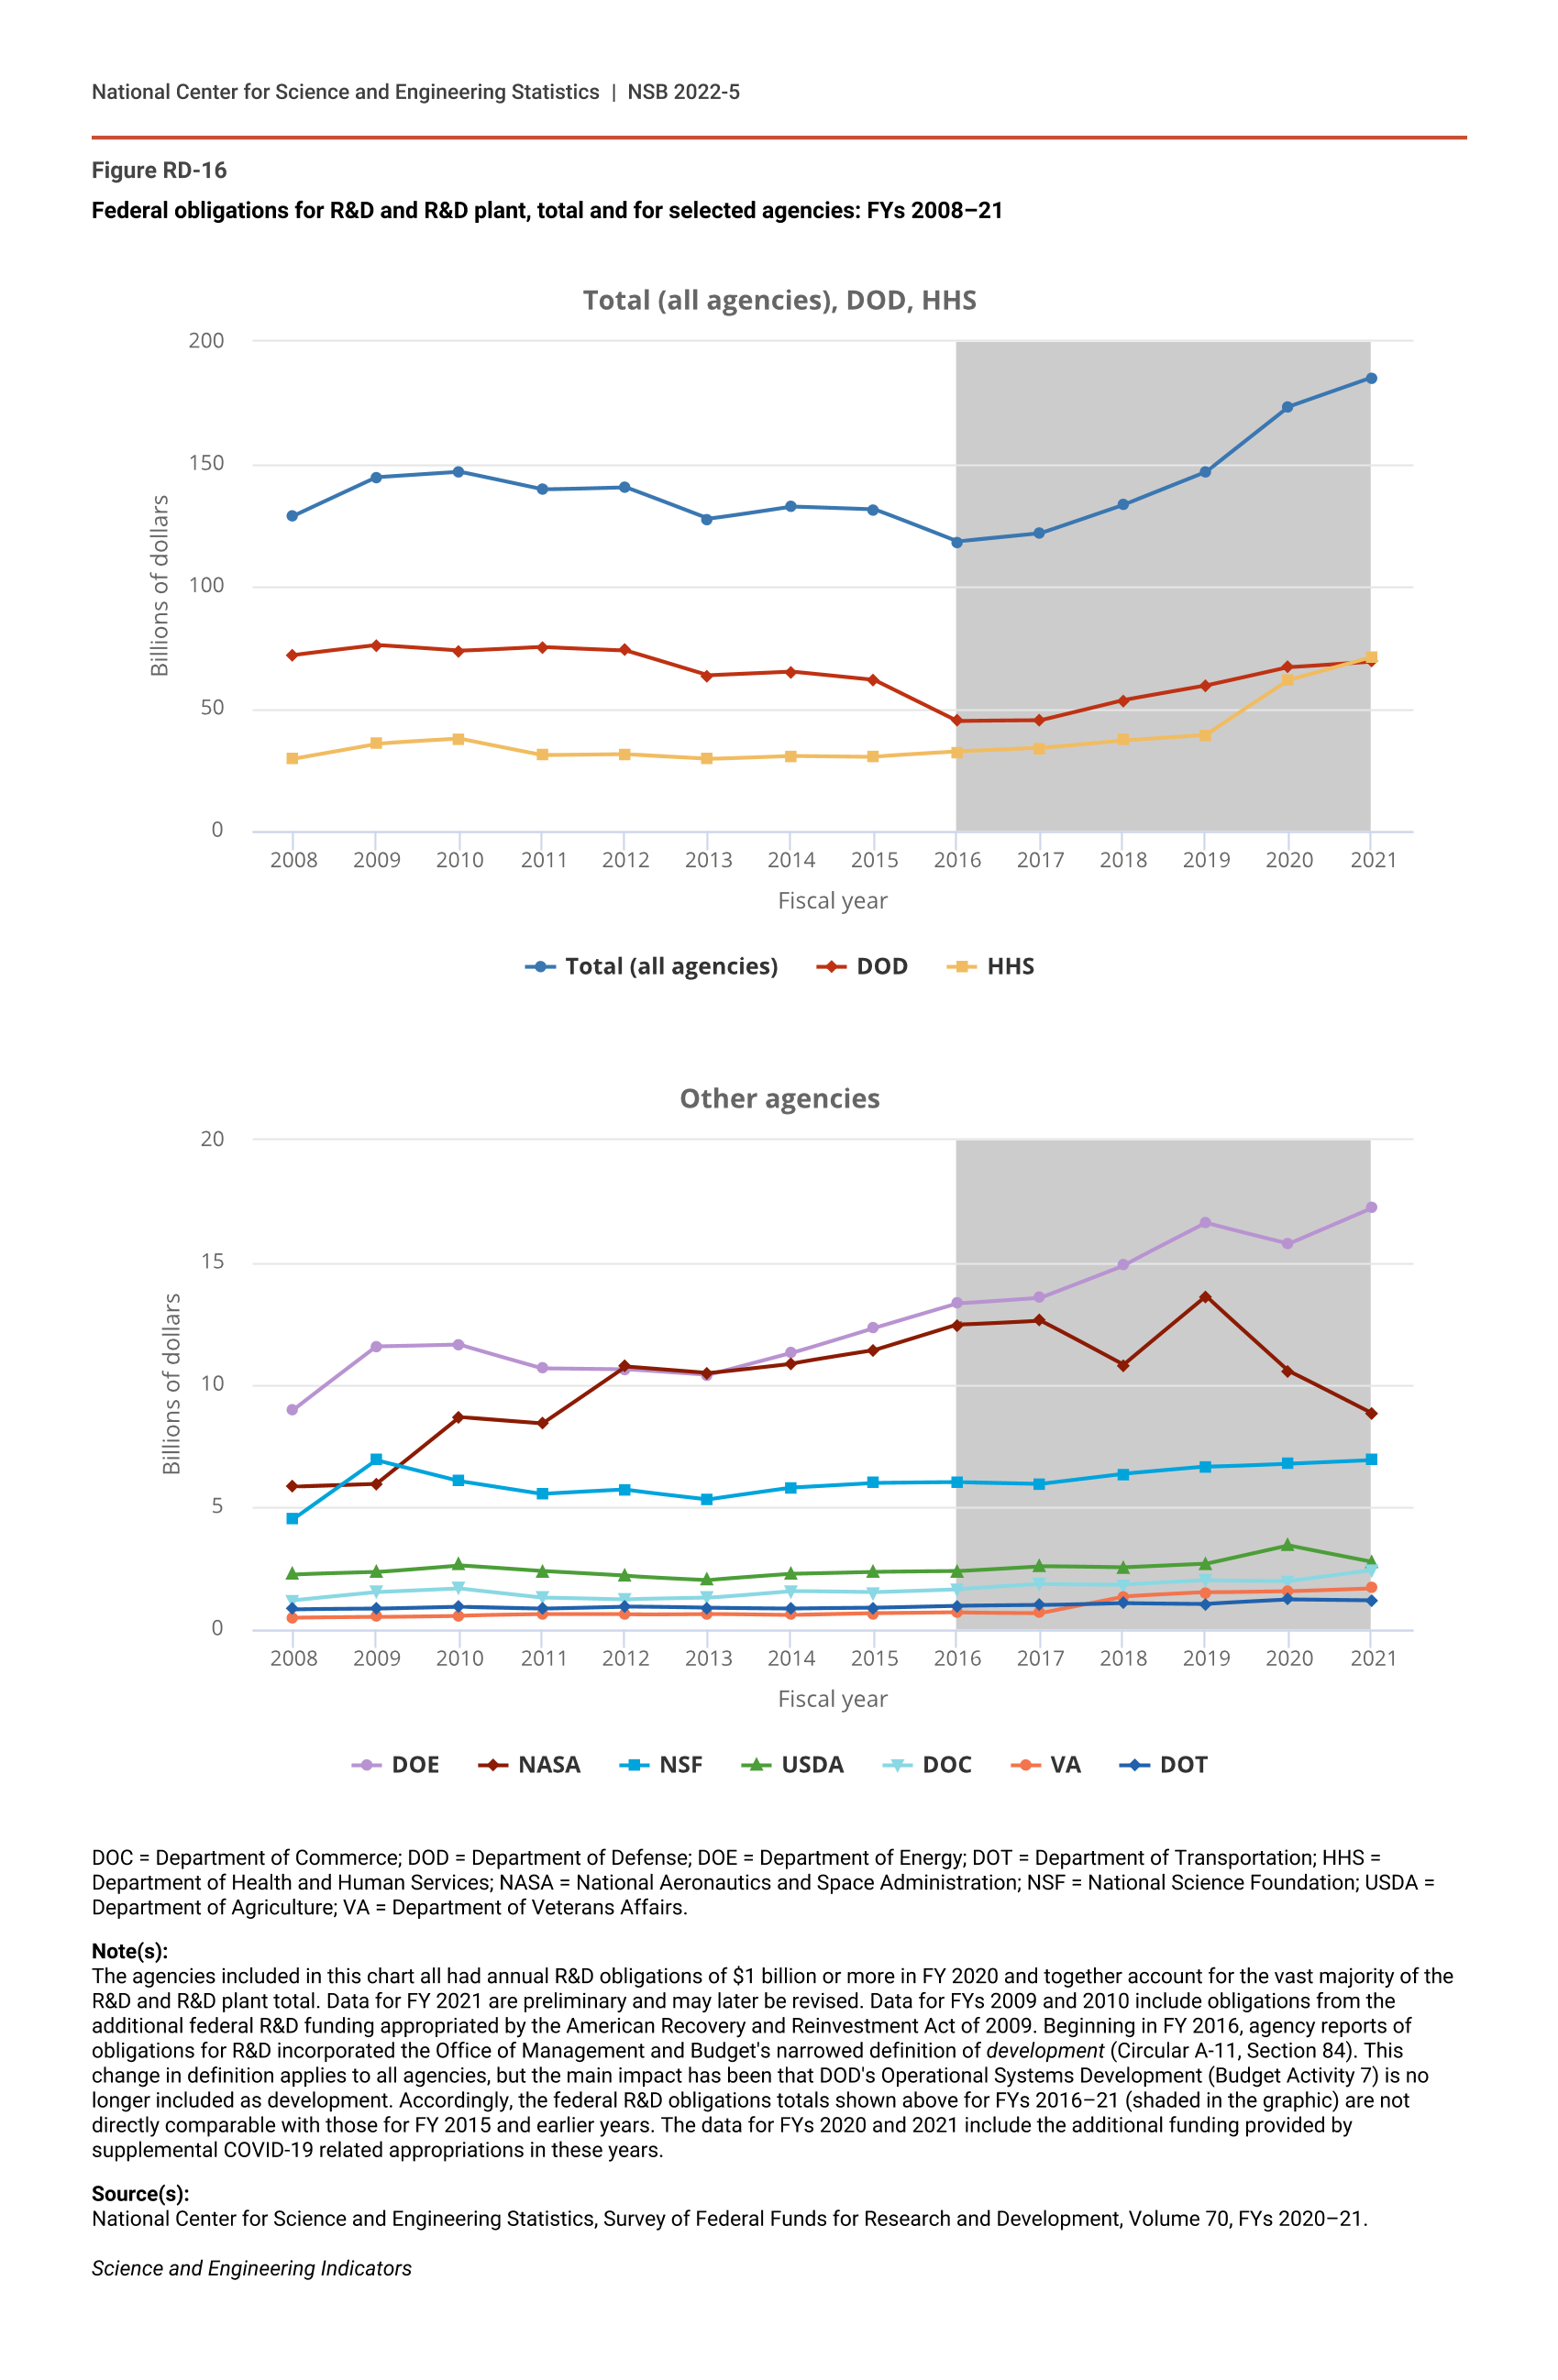
Finally, Figure RD-16 charts federal funding for R&D and R&D plant for each of the nine agencies from FY 2008 to FY 2021. (Note that the abovementioned change in the official data to account for the narrowed definition of development—particularly affecting DOD—are reflected in the data for FYs 2016–21.)
Federal obligations for R&D and R&D plant, total and for selected agencies: FYs 2008–21
| Fiscal year | Total (all agencies) | DOD | HHS |
|---|---|---|---|
| 2008 | 129.05 | 72.00 | 29.70 |
| 2009 | 144.76 | 75.97 | 35.74 |
| 2010 | 146.97 | 73.62 | 37.62 |
| 2011 | 139.70 | 75.33 | 30.93 |
| 2012 | 140.67 | 73.97 | 31.34 |
| 2013 | 127.63 | 63.65 | 29.51 |
| 2014 | 132.78 | 65.13 | 30.80 |
| 2015 | 131.58 | 61.68 | 30.43 |
| 2016 | 118.27 | 44.93 | 32.37 |
| 2017 | 121.63 | 45.16 | 33.90 |
| 2018 | 133.28 | 53.44 | 37.12 |
| 2019 | 146.80 | 59.39 | 39.43 |
| 2020 | 173.55 | 67.01 | 61.77 |
| 2021 | 185.41 | 69.46 | 71.19 |
| Fiscal year | DOE | NASA | NSF | USDA | DOC | VA | DOT |
|---|---|---|---|---|---|---|---|
| 2008 | 8.99 | 5.85 | 4.51 | 2.25 | 1.20 | 0.48 | 0.83 |
| 2009 | 11.56 | 5.96 | 6.92 | 2.34 | 1.53 | 0.51 | 0.85 |
| 2010 | 11.64 | 8.69 | 6.07 | 2.62 | 1.68 | 0.56 | 0.93 |
| 2011 | 10.68 | 8.43 | 5.54 | 2.38 | 1.31 | 0.61 | 0.86 |
| 2012 | 10.64 | 10.76 | 5.71 | 2.19 | 1.23 | 0.61 | 0.94 |
| 2013 | 10.40 | 10.49 | 5.33 | 2.03 | 1.29 | 0.64 | 0.88 |
| 2014 | 11.30 | 10.88 | 5.80 | 2.27 | 1.57 | 0.59 | 0.85 |
| 2015 | 12.34 | 11.41 | 5.99 | 2.35 | 1.52 | 0.66 | 0.88 |
| 2016 | 13.34 | 12.46 | 6.02 | 2.38 | 1.64 | 0.70 | 0.96 |
| 2017 | 13.58 | 12.64 | 5.95 | 2.58 | 1.85 | 0.68 | 0.99 |
| 2018 | 14.89 | 10.81 | 6.36 | 2.52 | 1.83 | 1.35 | 1.08 |
| 2019 | 16.62 | 13.62 | 6.65 | 2.67 | 2.00 | 1.51 | 1.05 |
| 2020 | 15.78 | 10.57 | 6.79 | 3.43 | 1.98 | 1.57 | 1.22 |
| 2021 | 17.24 | 8.83 | 6.94 | 2.77 | 2.43 | 1.69 | 1.18 |
DOC = Department of Commerce; DOD = Department of Defense; DOE = Department of Energy; DOT = Department of Transportation; HHS = Department of Health and Human Services; NASA = National Aeronautics and Space Administration; NSF = National Science Foundation; USDA = Department of Agriculture; VA = Department of Veterans Affairs.
Note(s):
The agencies included in this chart all had annual R&D obligations of $1 billion or more in FY 2020 and together account for the vast majority of the R&D and R&D plant total. Data for FY 2021 are preliminary and may later be revised. Data for FYs 2009 and 2010 include obligations from the additional federal R&D funding appropriated by the American Recovery and Reinvestment Act of 2009. Beginning in FY 2016, agency reports of obligations for R&D incorporated the Office of Management and Budget's narrowed definition of development (Circular A-11, Section 84). This change in definition applies to all agencies, but the main impact has been that DOD's Operational Systems Development (Budget Activity 7) is no longer included as development. Accordingly, the federal R&D obligations totals shown above for FYs 2016–21 (shaded in the graphic) are not directly comparable with those for FY 2015 and earlier years. The data for FYs 2020 and 2021 include the additional funding provided by supplemental COVID-19 related appropriations in these years.
Source(s):
National Center for Science and Engineering Statistics, Survey of Federal Funds for Research and Development, Volume 70, FYs 2020–21.
Science and Engineering Indicators
The substantial decline of DOD’s R&D obligations in the period of FYs 2011–15 was mainly an intended result of the Budget Control Act of 2011 and related agreements central to the policy debate surrounding the federal spending bills for FYs 2011–15. Both DOE and NASA had some funding increases over this period, but the gains were generally more modest for the other agencies.
In the FYs 2016–21 period (against the reset FY 2016 baseline), the large and consistent year-over-year increases for DOD and HHS are evident—and particularly, the COVID-19-related FYs 2020 and 2021. DOE R&D was also on a rising path throughout this period, but NASA’s expansion faltered later in the period. The levels of federally funded R&D by the other major agencies have exhibited only gradual increases.
Distribution of Federal Funding of R&D, by Performer and Type of R&D
Table RD-16 and Table RD-17 (and Table SRD-6) provide a breakdown by agency of the $173.6 billion of federal dollars obligated for R&D and R&D plant in FY 2020 according to purpose (R&D conduct and R&D plant), performers funded (intramural and extramural), and type of R&D (basic research, applied research, and experimental development).
Federal obligations for R&D and R&D plant, by agency and performer: FY 2020
FFRDC = federally funded research and development center.
Note(s):
Table lists all agencies covered in Table RD-15 and as ranked there. R&D is basic research, applied research, and experimental development, and it does not include R&D plant. Intramural activities include actual intramural R&D performance and costs associated with planning and administration of both intramural and extramural programs by federal personnel. Extramural performers includes federally funded R&D performed in the United States and U.S. territories by businesses, universities and colleges, other nonprofit institutions, state and local governments, and foreign organizations. All other agencies includes Department of Housing and Urban Development, Department of Labor, Department of State, Department of the Treasury, Administrative Office of the U.S. Courts, Appalachian Regional Commission, Consumer Product Safety Commission, Federal Communications Commission, Federal Trade Commission, Library of Congress, National Archives and Records Commission, Nuclear Regulatory Commission, Tennessee Valley Authority, RESTORE Act Centers, U.S. Agency for Global Media, and U.S. Postal Service.
Source(s):
National Center for Science and Engineering Statistics, Survey of Federal Funds for Research and Development, Volume 70, FYs 2020–21.
Science and Engineering Indicators
Federal obligations for R&D, by agency and type of R&D: FY 2020
Note(s):
Table lists all agencies covered in Table RD-15 and as ranked there. Detail may not add to total due to rounding. All other agencies includes the Department of Housing and Urban Development, Department of Labor, Department of State, Department of the Treasury, Administrative Office of the U.S. Courts, Appalachian Regional Commission, Consumer Product Safety Commission, Federal Communications Commission, Federal Trade Commission, Library of Congress, National Archives and Records Commission, Nuclear Regulatory Commission, Tennessee Valley Authority, RESTORE Act Centers, U.S. Agency for Global Media, and U.S. Postal Service.
Source(s):
National Center for Science and Engineering Statistics, Survey of Federal Funds for Research and Development, Volume 70, FYs 2020–21.
Science and Engineering Indicators
For all the agencies together, nearly all of the obligations total was for the purpose of R&D conduct ($167.4 billion, or 96%) (Table RD-16; Table SRD-6). Spending on R&D plant was just 3% of the annual total ($6.2 billion), with most of the obligations in this category coming from a few agencies (mainly DOE and HHS, but also NSF, DOD, and DOC).
The agencies differ considerably in the extent to which their R&D is conducted by their own intramural laboratories and affiliated FFRDCs rather than funding provided to extramural R&D performers (e.g., businesses, universities and colleges, nonprofit organizations, state and local governments, and foreign organizations). In FY 2020, for all of the agencies together, 40% of the R&D funding was to agency intramural R&D facilities and FFRDCs, and 60% was to extramural performers (Table RD-16). But some agencies are mainly funders of extramural R&D: for example, NSF (96%), HHS (65%), and DOT (76%). Some agencies fund mainly intramural R&D and FFRDCs: VA (100%), DOC (80%), and DOE (66%). The others rely on a mix of intramural and extramural. (Greater detail on the split of the FY 2020 obligated funds for R&D across the agencies and by type of performer can be found in Table SRD-6.)
Regarding the split among type of R&D, the largest share of federal funding in FY 2020 was for experimental development (49%); next was applied research (26%), and then basic research (25%) (Table RD-17). These proportions vary widely, however, from agency to agency—mainly reflecting differences in agency missions and priorities. For example, the share of basic research for NSF in 2020 was 86% and 36% for HHS, but its share was only 4% for DOD and close to 0% for DOT.
Corresponding data tables in earlier editions of Indicators (NSB Indicators 2016, Indicators 2018, Indicators 2020) show largely the same picture for these distributions of federal funding by agency, performer, and type of R&D.
Distribution of Federal Funding for Research, by S&E Fields
The basic research and applied research conducted or funded by the federal government span a full range of S&E fields: computer sciences and mathematics, environmental sciences, life sciences, physical sciences, psychology, social sciences, engineering, and other S&E fields. Experimental development has not to date been classifiable by S&E field; accordingly, the available data cover only research.
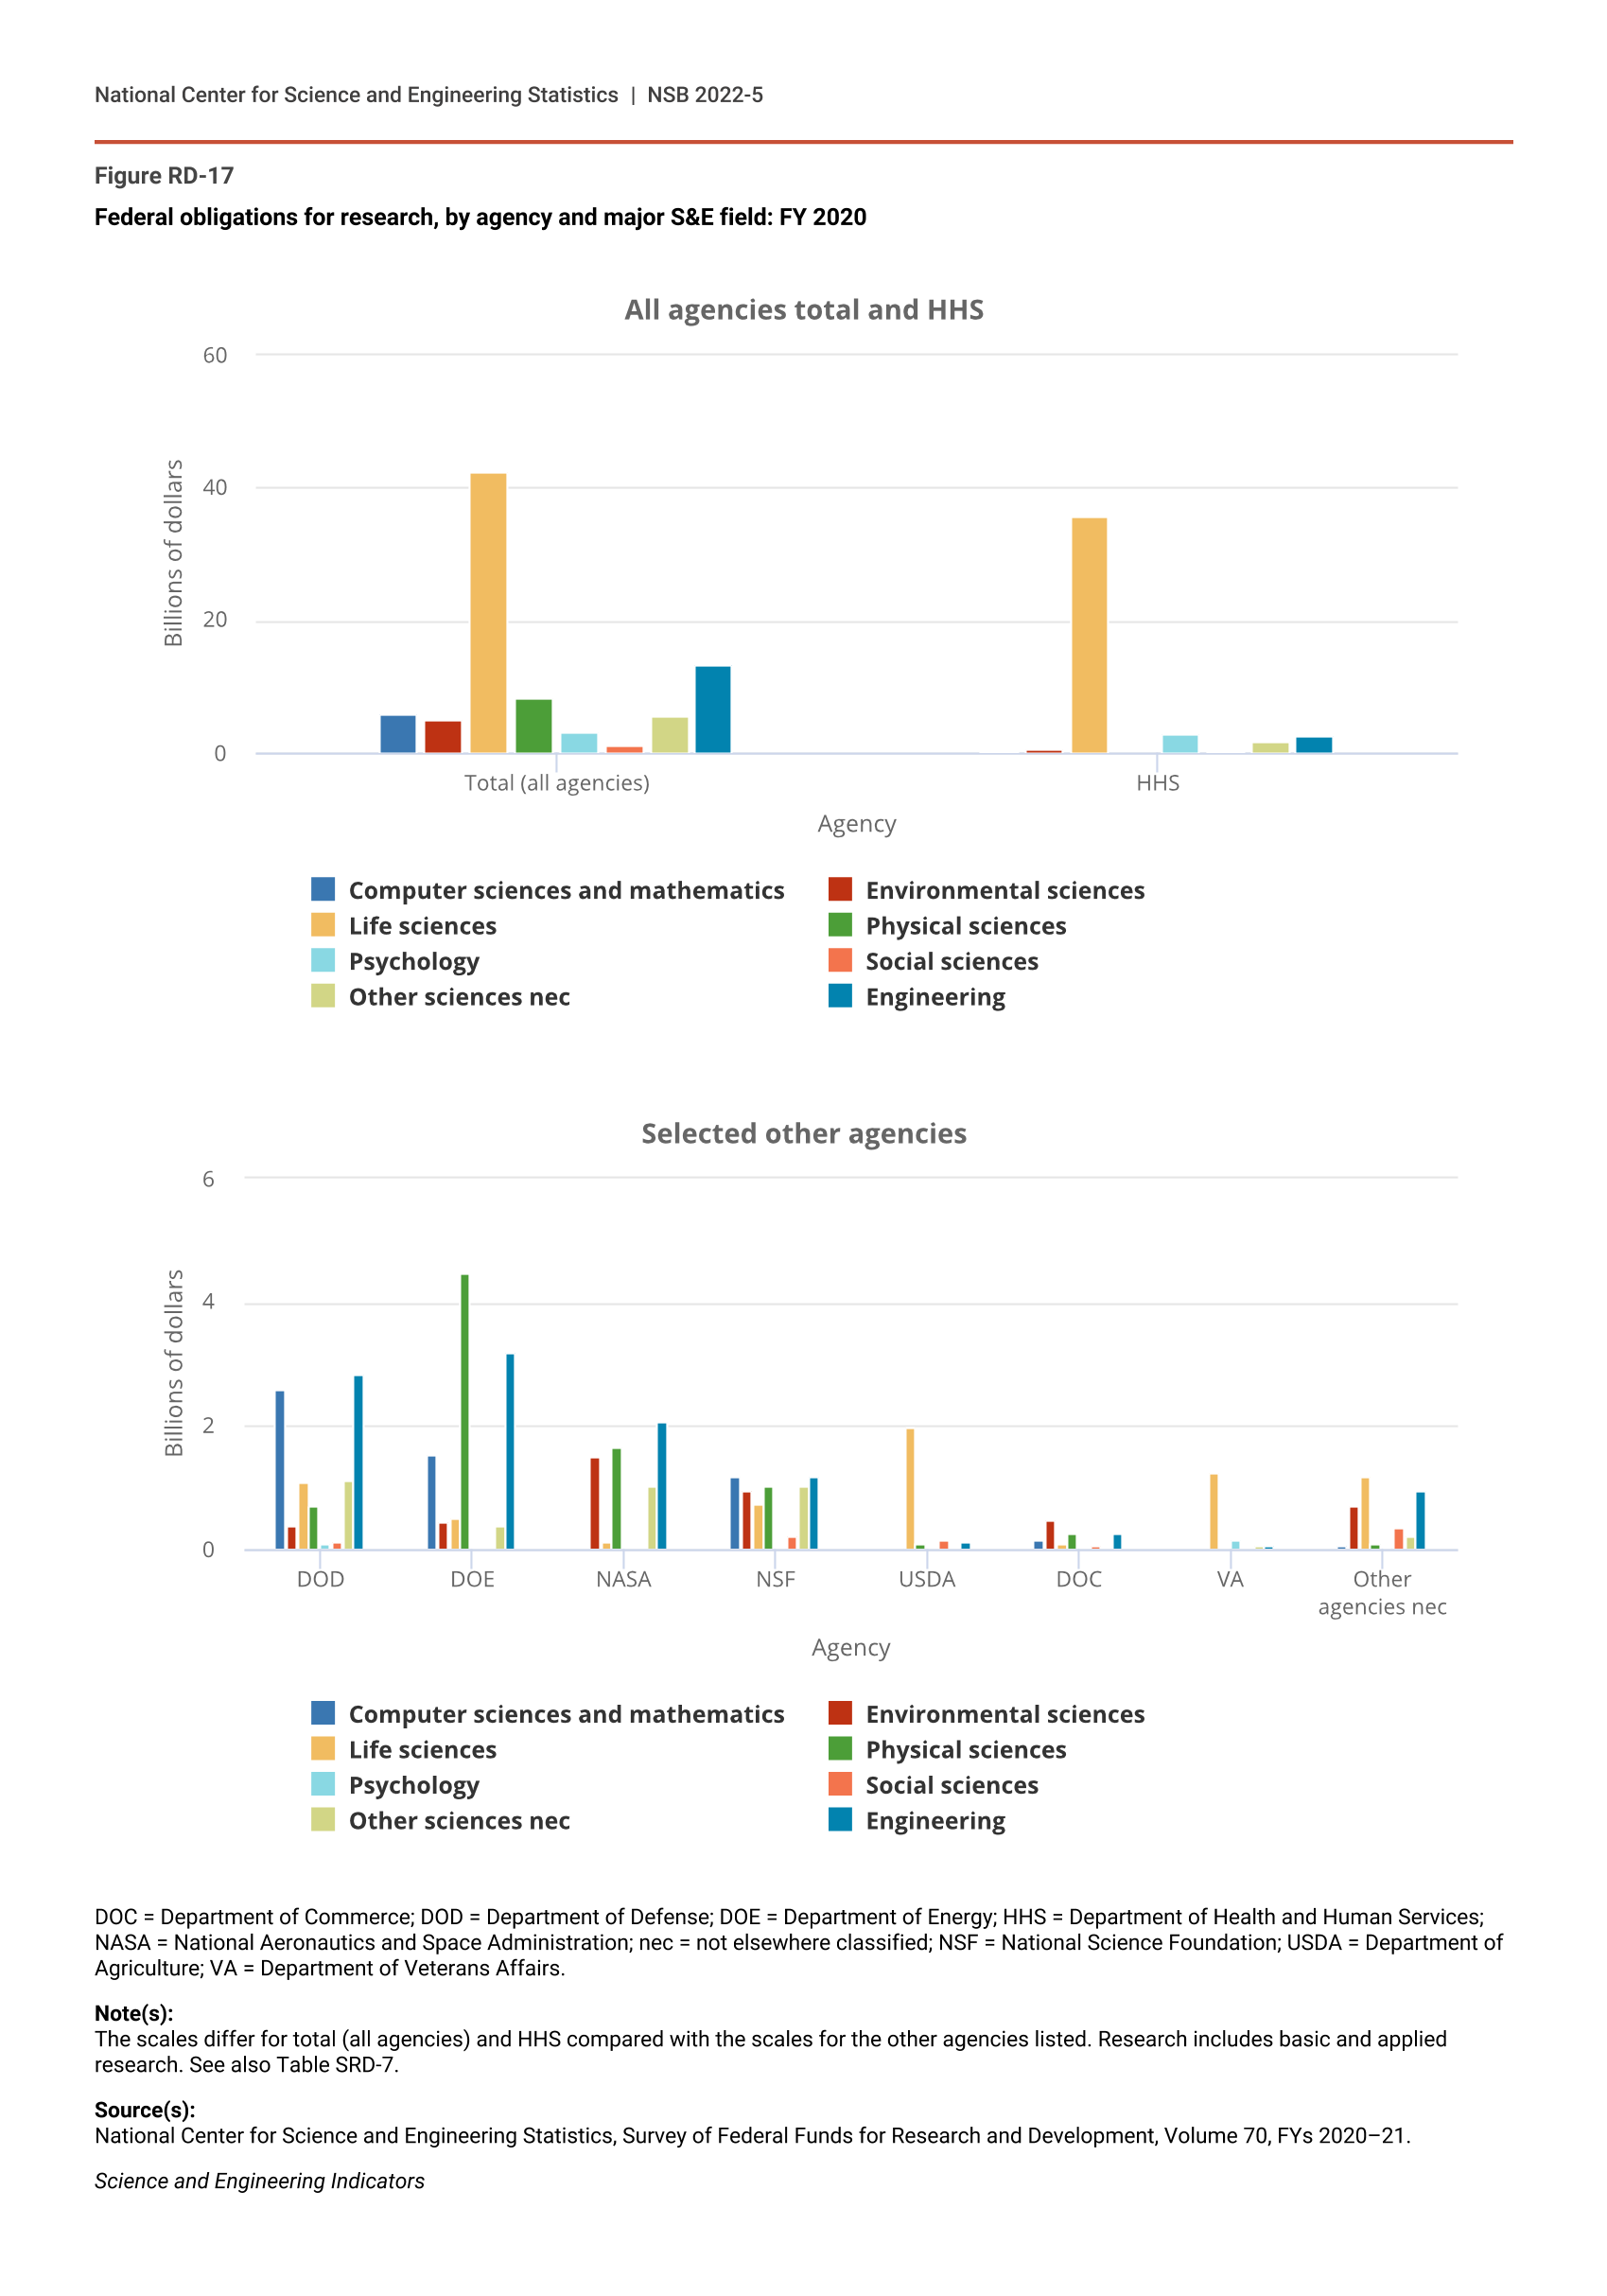
In FY 2020, funding for basic and applied research combined accounted for $85.3 billion of the $167.4 billion total of federal obligations for R&D (Table RD-17). Nearly 50% of this amount, $42.5 billion, supported research in life sciences (Table SRD-7). The fields with the next-largest amounts were engineering ($13.2 billion, or 16%) and physical sciences ($8.4 billion, or 10%), followed by computer sciences and mathematics ($5.9 billion, or 7%), and environmental sciences ($5.0 billion, or 6%). The balance of federal obligations for research in FY 2020 supported psychology, social sciences, and all other sciences ($10.2 billion overall, or 12% of the total for research).
The differences in federal funding for research across agencies and fields reflect the varied agency missions (Figure RD-17; Table SRD-7). HHS accounted for the largest share (52%) of federal obligations for research in FY 2020. Most of this amount funded research in life sciences, primarily through the National Institutes of Health (NIH). The seven next-largest federal agencies for research funding that year were DOE (12%), DOD (11%), NASA (8%), NSF (7%), USDA (3%), VA (2%), and DOC (2%).
Federal obligations for research, by agency and major S&E field: FY 2020
| Agency | Computer sciences and mathematics | Environmental sciences | Life sciences | Physical sciences | Psychology | Social sciences | Other sciences nec | Engineering |
|---|---|---|---|---|---|---|---|---|
| Total (all agencies) | 5.91 | 5.04 | 42.52 | 8.42 | 3.28 | 1.14 | 5.77 | 13.22 |
| HHS | 0.34 | 0.55 | 35.57 | 0.11 | 2.96 | 0.25 | 1.92 | 2.54 |
| Agency | Computer sciences and mathematics | Environmental sciences | Life sciences | Physical sciences | Psychology | Social sciences | Other sciences nec | Engineering |
|---|---|---|---|---|---|---|---|---|
| DOD | 2.60 | 0.39 | 1.08 | 0.69 | 0.10 | 0.13 | 1.11 | 2.83 |
| DOE | 1.54 | 0.44 | 0.51 | 4.47 | 0.00 | 0.00 | 0.38 | 3.18 |
| NASA | 0.00 | 1.51 | 0.13 | 1.65 | 0.00 | 0.00 | 1.02 | 2.09 |
| NSF | 1.18 | 0.95 | 0.75 | 1.03 | 0.04 | 0.21 | 1.02 | 1.17 |
| USDA | 0.01 | 0.02 | 1.99 | 0.10 | 0.00 | 0.15 | 0.00 | 0.12 |
| DOC | 0.17 | 0.48 | 0.09 | 0.26 | 0.00 | 0.05 | 0.04 | 0.26 |
| VA | 0.00 | 0.00 | 1.23 | 0.00 | 0.17 | 0.00 | 0.07 | 0.07 |
| Other agencies nec | 0.07 | 0.71 | 1.17 | 0.10 | 0.02 | 0.35 | 0.21 | 0.97 |
DOC = Department of Commerce; DOD = Department of Defense; DOE = Department of Energy; HHS = Department of Health and Human Services; NASA = National Aeronautics and Space Administration; nec = not elsewhere classified; NSF = National Science Foundation; USDA = Department of Agriculture; VA = Department of Veterans Affairs.
Note(s):
The scales differ for total (all agencies) and HHS compared with the scales for the other agencies listed. Research includes basic and applied research. See also Table SRD-7.
Source(s):
National Center for Science and Engineering Statistics, Survey of Federal Funds for Research and Development, Volume 70, FYs 2020–21.
Science and Engineering Indicators
DOE primarily funded research in the physical sciences ($4.5 billion), engineering ($3.2 billion), and computer sciences and mathematics ($1.5 billion). DOD’s research focuses included engineering ($2.8 billion), computer sciences and mathematics ($2.6 billion), life sciences ($1.1 billion), and physical sciences ($0.7 billion). NASA focused primarily on engineering ($2.1 billion), physical sciences ($1.7 billion), and environmental sciences ($1.5 billion).
NSF (charged with “promoting the progress of science”) had a comparatively diverse $6.4 billion research portfolio that allocated about $0.8 billion–$1.2 billion to each of the following fields: computer sciences and mathematics, environmental sciences, engineering, physical sciences, and life sciences. Smaller amounts were allocated to psychology, social sciences, and other sciences. USDA’s $2.4 billion was directed primarily at life (agricultural) sciences ($2.0 billion). The VA’s $1.5 billion was also primarily directed at life sciences ($1.2 billion). DOC’s $1.4 billion was distributed mainly in the fields of environmental sciences, physical sciences, engineering, and computer sciences and mathematics.
Adjusted for inflation, the total of federal funds obligated for research across all S&E fields grew, on average, by 3.8% annually during 1990–2000 and by 3.0% during 2000–10 (Table SRD-8). More recently, however, the rate of annual growth in the total of research obligations has noticeably slowed. During the period of 2010–20, research obligations increased, on average, by only 1.2% annually, adjusted for inflation. In this most recent period, the average annual growth of research funding in computer sciences and mathematics (3.9%), environmental sciences (2.5%), psychology (2.5%), and physical sciences (1.9%) each outpaced the rate for research as a whole (1.2%)—and, in some cases, considerably so. The average pace of expansion for research obligations for both the life sciences (0.6%) and engineering (0.1%) has been slower over the period than for research as a whole, although the dollar levels in these two categories are much larger than the others. Research obligations in the social sciences have generally been on a declining path over the period (-2.2%).
Cross-National Comparisons of Government R&D Priorities
Government funding is a feature of most countries’ overall R&D systems, where the levels and priorities are typically significant national policy choices. Member countries of the OECD routinely report statistics on government funding of R&D through the government budget allocations for R&D (GBARD) indicator, which distinguishes more than a dozen differing socioeconomic objectives.
Defense is an objective for government funding of R&D for all of the top R&D-performing countries, but the shares vary considerably (Table RD-18). Defense accounted for 47% of U.S. federal R&D support in 2019, while South Korea (16%) and the United Kingdom (11%) were a distant second and third. The remaining countries’ shares were 4% or lower.
Government R&D support, by major socioeconomic objectives, for selected countries or regions: Selected years, 2000–19
** = included in other categories; na = not applicable.
EU = European Union; GBARD = government budget allocations for R&D; PPP = purchasing power parity.
Note(s):
The most recent year for which all the selected countries could provide complete data is 2019. Foreign currencies are converted to U.S. dollars through PPPs. The GBARD statistics reported for the United States are federal budget authority data. GBARD data are not yet available for China or India. The socioeconomic objective categories are aggregates of the 14 categories identified by Eurostat's 2007 Nomenclature for the Analysis and Comparison of Scientific Programs and Budgets (NABS) (Eurostat 2007). The figures are as reported by the Organisation for Economic Co-operation and Development.
Source(s):
Organisation for Economic Co-operation and Development, Main Science and Technology Indicators (September 2021 edition).
Science and Engineering Indicators
Nondefense R&D priorities also vary by country. For the United States and the United Kingdom in 2019, health and the environment have been the largest shares of nondefense spending, at 56% and 30%, respectively. These shares have remained at these relatively high levels since 2000.
South Korea has consistently allocated about half of its nondefense R&D support to economic development programs, which for them encompass agriculture, energy, fisheries and forestry, industry, transportation, telecommunications, and other infrastructure. Japan has allocated around a third of its nondefense R&D support to this objective. The shares devoted by other countries are markedly less.
The civil space objective accounted for about 13% of nondefense federal R&D funding in the United States in 2019. The share was 21% in 2000 and declined thereafter to 13% in 2010. The corresponding share in France was 12% for 2019, although it was somewhat higher, around 13%, in both 2000 and 2010. The civil space share is 6% or below for the rest of the top R&D-performing countries.
Both the non-oriented research funding and general university funds (GUF) objectives reflect government support for R&D by academic, government, and other performers directed chiefly at the “general advancement of knowledge” in the natural sciences, engineering, social sciences, humanities, and related fields. For some of the countries, the sum of these two objectives represents by far the largest part of nondefense GBARD: in 2019, Germany (57%), France (46%), Japan (47%), the United Kingdom (40%), and South Korea (26%). While the corresponding 2019 share for the United States (17%) is substantially smaller, it requires interpretive caution. Cross-national comparisons of these two indicators can be difficult because some countries (notably the United States) do not use the GUF mechanism to fund R&D for general advancement of knowledge or do not separately account for GUF (like South Korea). More typically, these countries direct R&D funding to project-specific grants or contracts, which are then assigned to more specific socioeconomic objectives.
Finally, the education and society objective amounts to a comparatively small component of nondefense government R&D funding for the top R&D-performing countries. This objective comprised 2% of nondefense GBARD in the United States in 2019, compared to a lower share in Japan (1%) and to higher shares in Germany (5%), the United Kingdom (6%), and South Korea (8%).