 An official website of the United States government
 Impact of Published Research
Data from citations provide a window into the impact of specific articles and authors, as well as the return on a country’s scientific investment (Narin and Hamilton 1996). Research embodied in publications also impacts invention through patent citations, which will be covered in the forthcoming Indicators 2022 report “Invention, Knowledge Transfer, and Innovation.”
Publications with more citations are considered to have more impact (Garfield 1955; Waltman, van Eck, and Wouters 2013). A small subset within the count of cited articles is categorized as highly cited articles (HCA), or the publications most frequently cited in other articles. This report presents data on the top 1% of HCA. The index of a country’s number of HCA relative to the world’s HCA (i.e., the HCA score) creates a comparable cross-country measure. Conference proceedings are excluded from the HCA count because proceedings are not cited as often as journal articles. In addition, conference papers are often later converted into articles in journals, and then it is the journal article that receives the majority of the citations. A minimum of 2 years from the publication date is required for calculation of HCA. This delay provides an opportunity for articles to accumulate citations after the publication (Wang 2012). This report provides data for articles published through 2018 because citations are calculated based on data up to 2020.
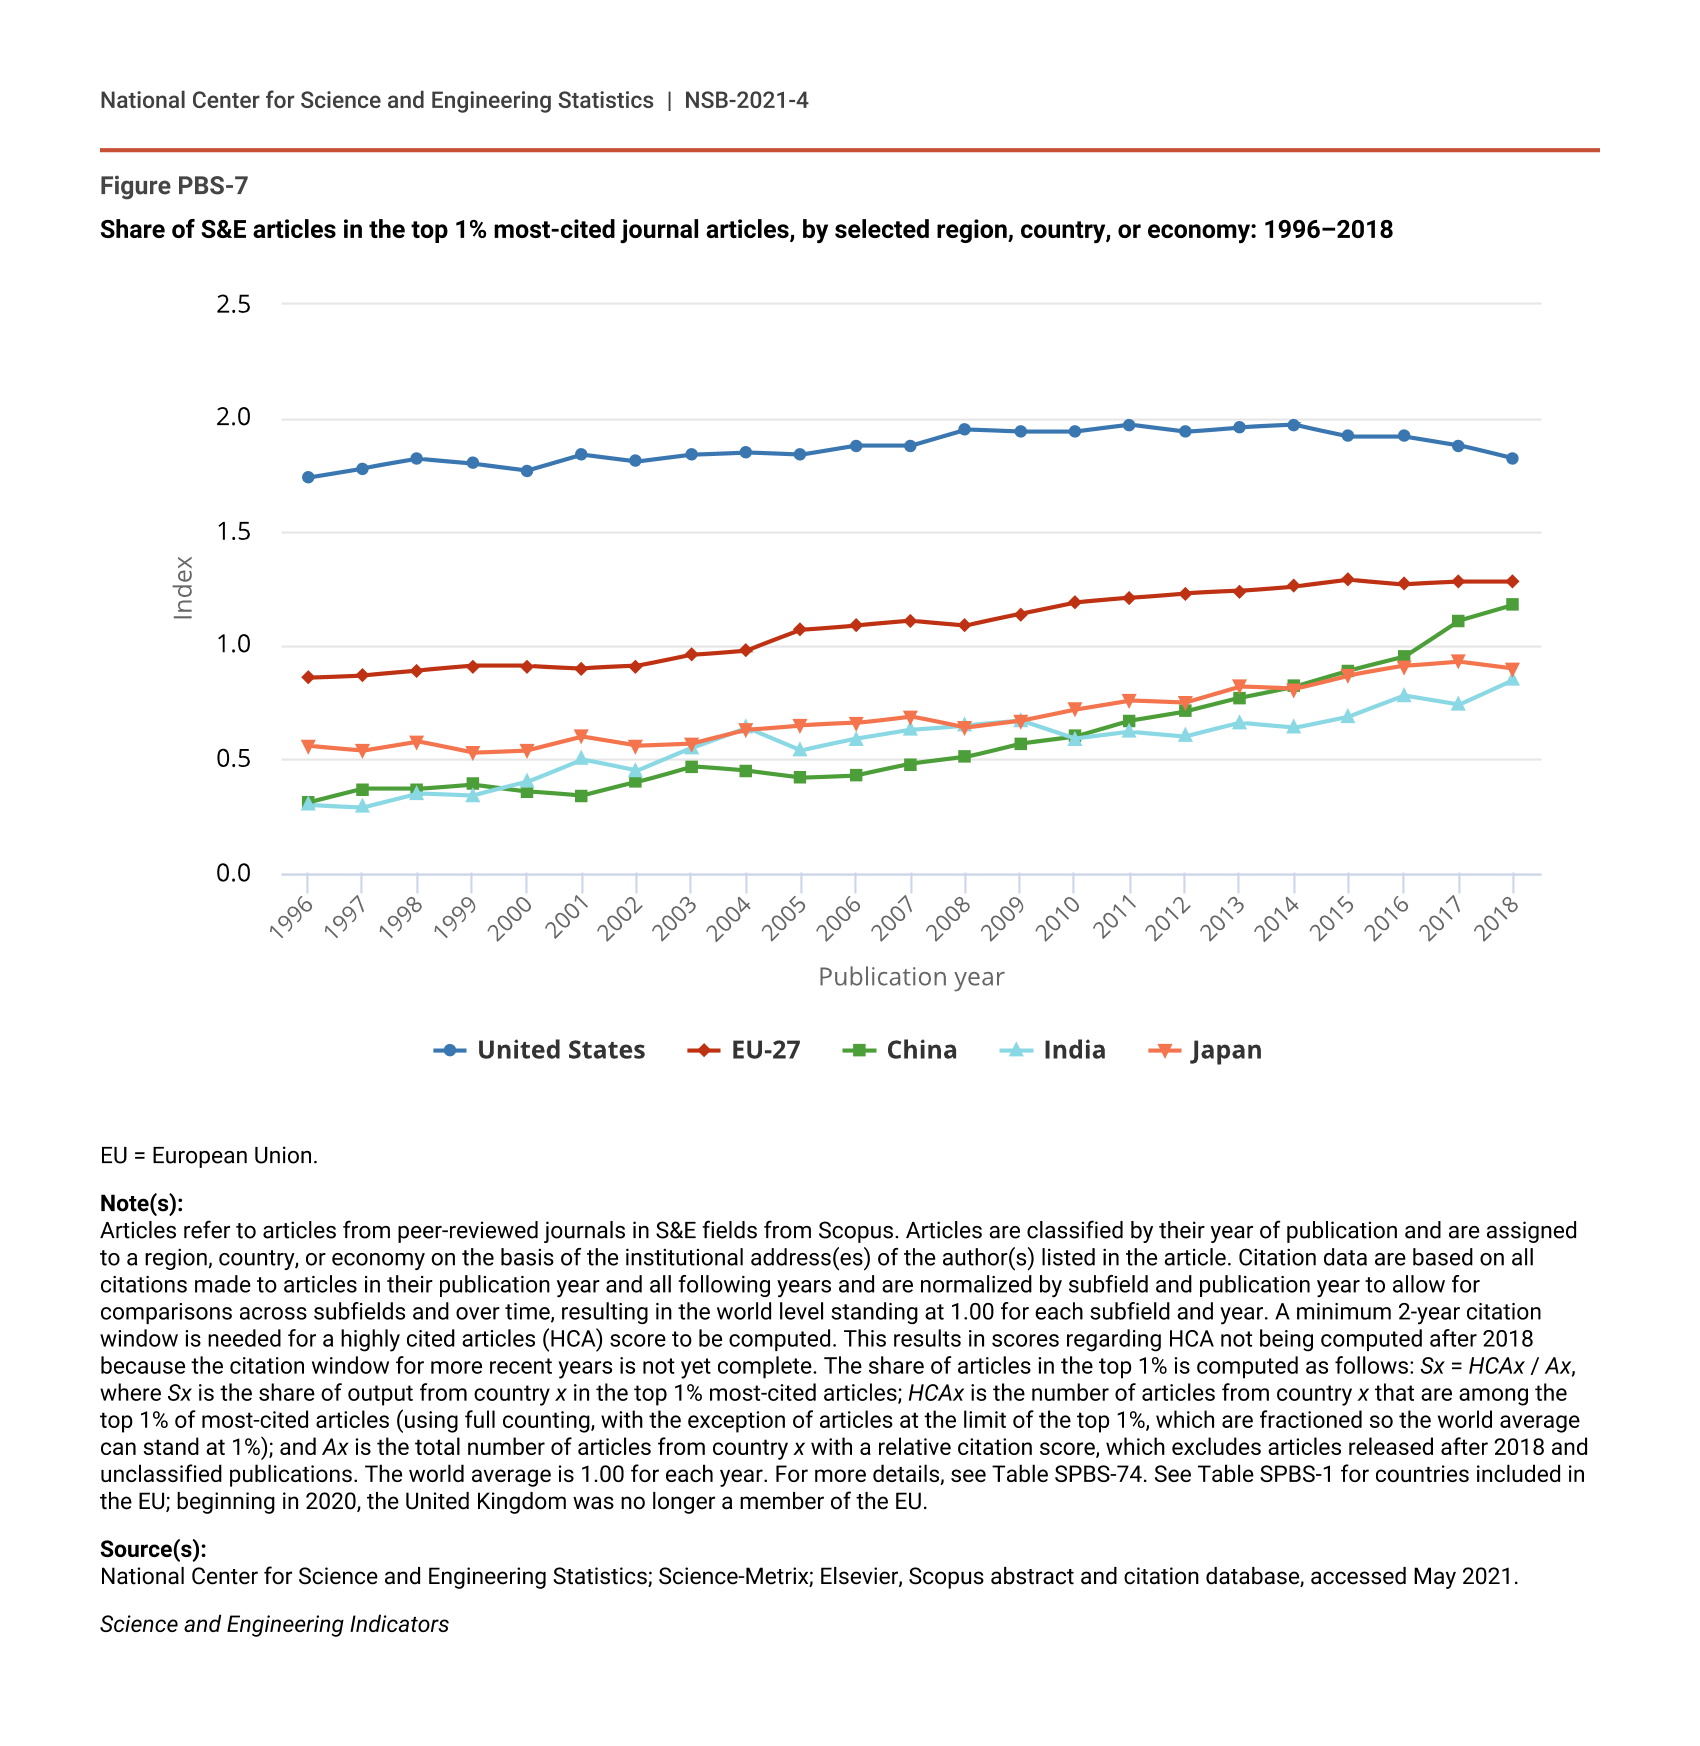
The United States contributed more than the expected number of articles to the world’s pool of HCA in 2018 (HCA score of 1.8) (Figure PBS-7). China’s HCA score is above the expected share of HCA given their level of 2018 articles (HCA score of 1.2). The HCA scores for China track its emergence as a major S&E research country; the HCA for China in 1996 was 0.3. Not all major article-producing countries received above the expected HCA score; Japan and India each had HCA scores less than 1.0 in 2018 (both with a score of 0.9).
Share of S&E articles in the top 1% most-cited journal articles, by selected region, country, or economy: 1996–2018
| Publication year | United States | EU-27 | China | India | Japan |
|---|---|---|---|---|---|
| 1996 | 1.74 | 0.86 | 0.31 | 0.30 | 0.56 |
| 1997 | 1.78 | 0.87 | 0.37 | 0.29 | 0.54 |
| 1998 | 1.82 | 0.89 | 0.37 | 0.35 | 0.58 |
| 1999 | 1.80 | 0.91 | 0.39 | 0.34 | 0.53 |
| 2000 | 1.77 | 0.91 | 0.36 | 0.40 | 0.54 |
| 2001 | 1.84 | 0.90 | 0.34 | 0.50 | 0.60 |
| 2002 | 1.81 | 0.91 | 0.40 | 0.45 | 0.56 |
| 2003 | 1.84 | 0.96 | 0.47 | 0.55 | 0.57 |
| 2004 | 1.85 | 0.98 | 0.45 | 0.64 | 0.63 |
| 2005 | 1.84 | 1.07 | 0.42 | 0.54 | 0.65 |
| 2006 | 1.88 | 1.09 | 0.43 | 0.59 | 0.66 |
| 2007 | 1.88 | 1.11 | 0.48 | 0.63 | 0.69 |
| 2008 | 1.95 | 1.09 | 0.51 | 0.65 | 0.64 |
| 2009 | 1.94 | 1.14 | 0.57 | 0.67 | 0.67 |
| 2010 | 1.94 | 1.19 | 0.60 | 0.59 | 0.72 |
| 2011 | 1.97 | 1.21 | 0.67 | 0.62 | 0.76 |
| 2012 | 1.94 | 1.23 | 0.71 | 0.60 | 0.75 |
| 2013 | 1.96 | 1.24 | 0.77 | 0.66 | 0.82 |
| 2014 | 1.97 | 1.26 | 0.82 | 0.64 | 0.81 |
| 2015 | 1.92 | 1.29 | 0.89 | 0.69 | 0.87 |
| 2016 | 1.92 | 1.27 | 0.95 | 0.78 | 0.91 |
| 2017 | 1.88 | 1.28 | 1.11 | 0.74 | 0.93 |
| 2018 | 1.82 | 1.28 | 1.18 | 0.85 | 0.90 |
EU = European Union.
Note(s):
Articles refer to articles from peer-reviewed journals in S&E fields from Scopus. Articles are classified by their year of publication and are assigned to a region, country, or economy on the basis of the institutional address(es) of the author(s) listed in the article. Citation data are based on all citations made to articles in their publication year and all following years and are normalized by subfield and publication year to allow for comparisons across subfields and over time, resulting in the world level standing at 1.00 for each subfield and year. A minimum 2-year citation window is needed for a highly cited articles (HCA) score to be computed. This results in scores regarding HCA not being computed after 2018 because the citation window for more recent years is not yet complete. The share of articles in the top 1% is computed as follows: Sx = HCAx / Ax, where Sx is the share of output from country x in the top 1% most-cited articles; HCAx is the number of articles from country x that are among the top 1% of most-cited articles (using full counting, with the exception of articles at the limit of the top 1%, which are fractioned so the world average can stand at 1%); and Ax is the total number of articles from country x with a relative citation score, which excludes articles released after 2018 and unclassified publications. The world average is 1.00 for each year. For more details, see Table SPBS-74. See Table SPBS-1 for countries included in the EU; beginning in 2020, the United Kingdom was no longer a member of the EU.
Source(s):
National Center for Science and Engineering Statistics; Science-Metrix; Elsevier, Scopus abstract and citation database, accessed May 2021.
Science and Engineering Indicators
The trends in HCA scores provide an opportunity to understand the changes in a country’s research impact. From 2008 to 2018, the impact of Chinese researchers grew faster than the impact of researchers in the United States and other countries (Conte et al. 2017; Xie and Freeman 2018). The HCA score of the United States was 2.0 for 2008 and 1.8 for 2018. Over the same decade, China’s HCA score more than doubled (from 0.5 in 2008 to 1.2 in 2018). The HCA scores for articles with authors in India and Japan also increased from 2008 to 2018; India’s HCA score increased from 0.7 to 0.9, and Japan increased from 0.6 to 0.9.
Changes over time in the HCA by field of science provide a more nuanced story of research across countries. The normalization of the HCA by output and scientific field using fractional counting spotlights countries with relatively low publication output but consistently high rankings among the most cited articles in a field: for example, agricultural sciences in Ireland (2.51), engineering in Singapore (2.87), and materials science in the Netherlands (2.43) (Table SPBS-59, Table SPBS-64, Table SPBS-67).