 An official website of the United States government
 Infrastructure for Academic R&D
Physical infrastructure is an essential resource for the performance of R&D at academic institutions. The principal indicators of this infrastructure are the square footage of designated research space and research instrumentation expenditures. Two fields of research have primarily driven the continual increases in academic S&E research space: biological and biomedical sciences and engineering. These two fields accounted for 60% of total research space growth from 2007 to 2019. Research equipment expenditures have fluctuated over the past 15 years in constant dollars but stand at levels similar to those of a decade ago. Federal funding of research equipment declined to less than 50% in 2014 for the first time in decades and has remained below 50% since.
Research Facilities
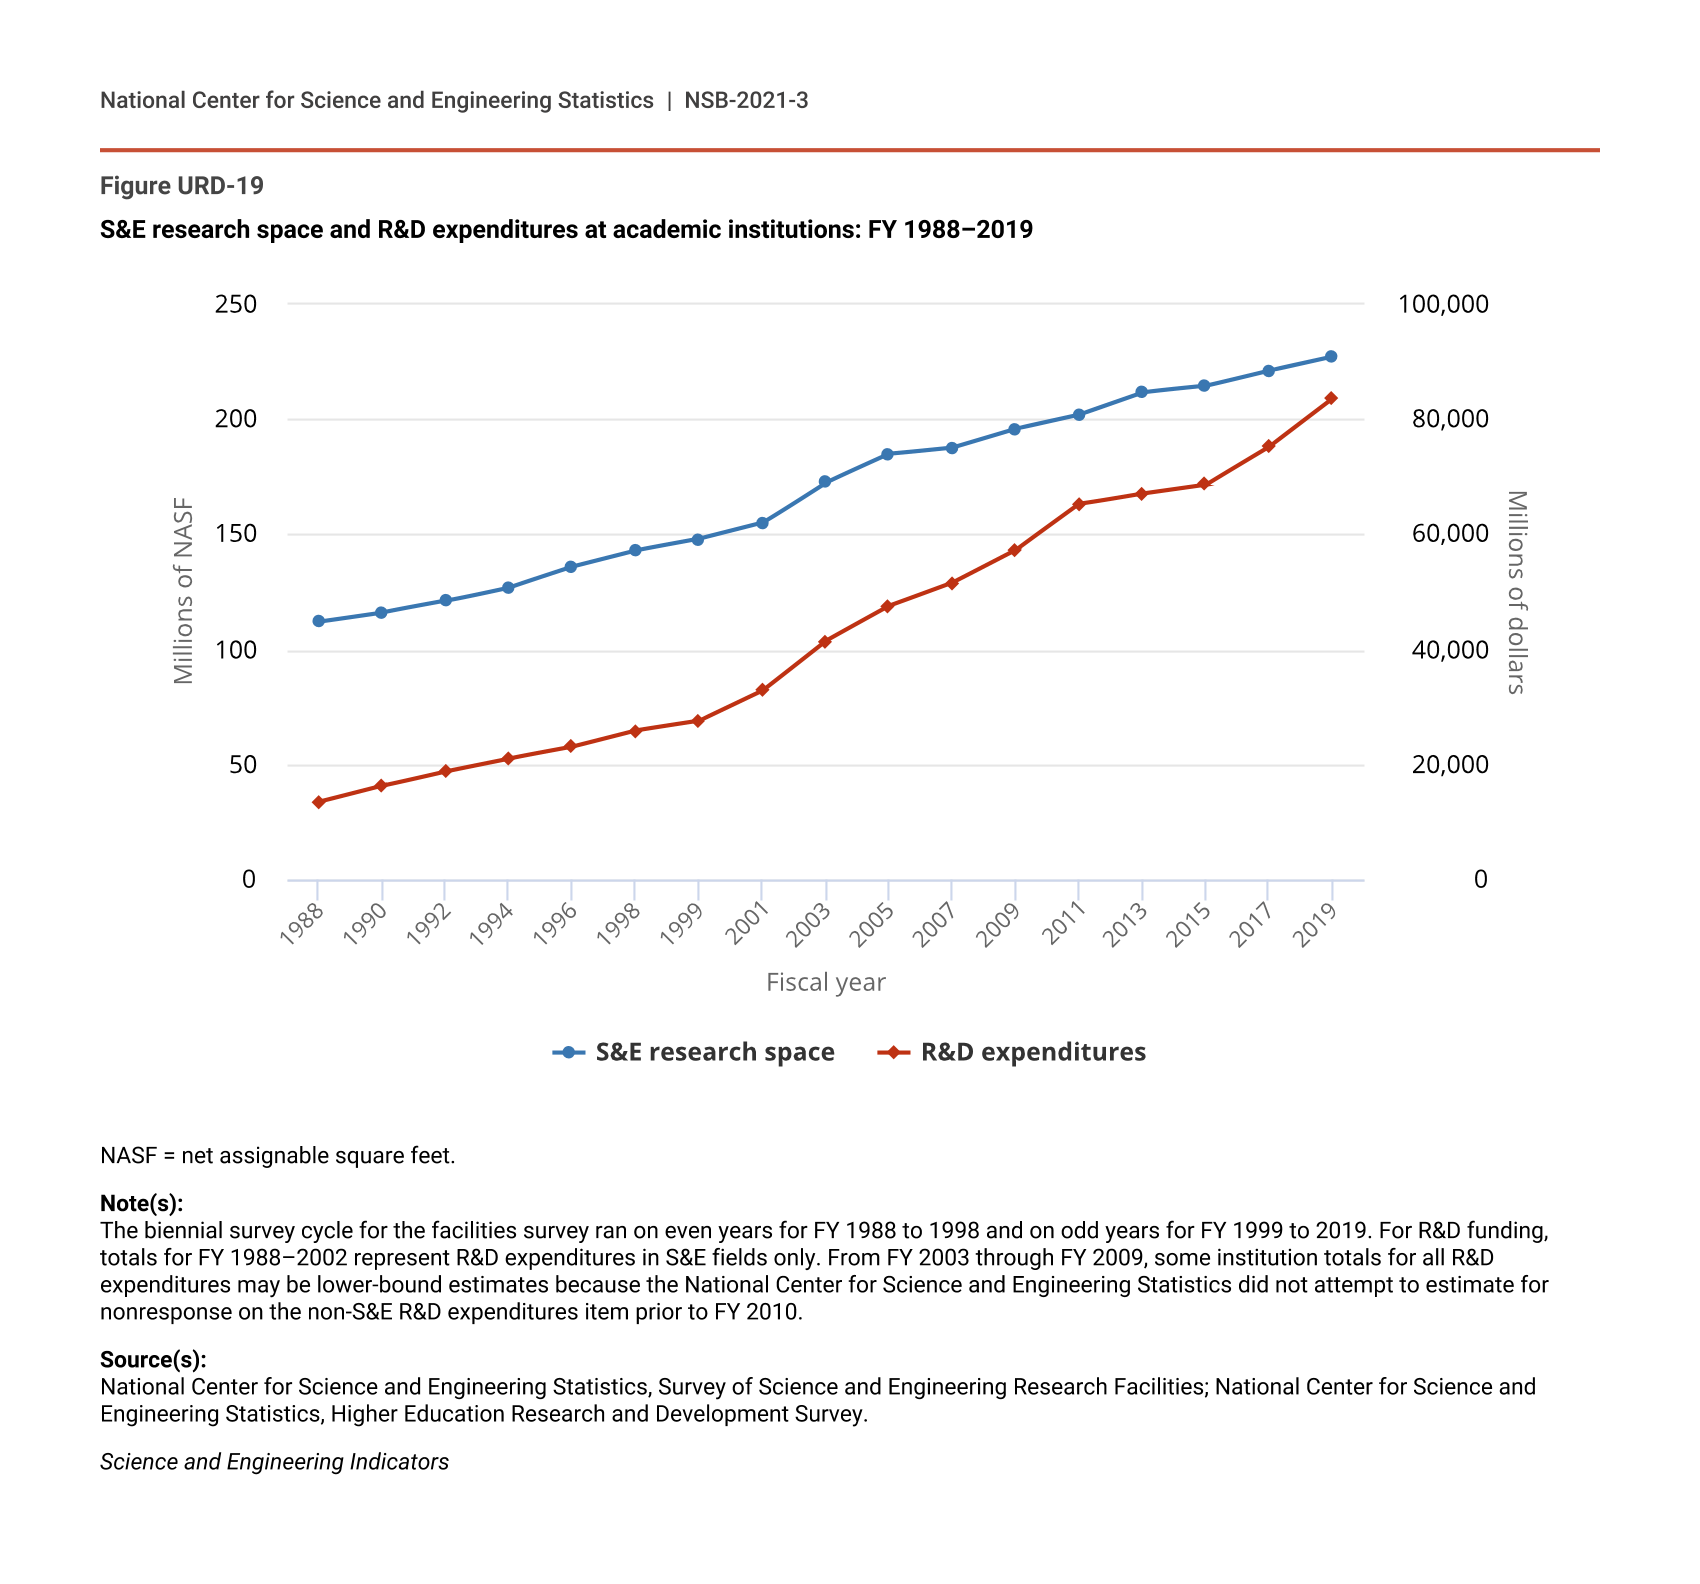
Research-performing universities and colleges in the United States had 227.3 million net assignable square feet (NASF) of research space available in 2019, up 6.1 million NASF (2.8%) from 2017 (Figure URD-19). The total increase in research space between 2017 and 2019 was slightly less than the square footage of space added between 2015 and 2017 (6.7 million NASF) (NCSES Facilities 2019: Table 1). Growth in research space and total academic R&D show similar upward trajectories over time.
S&E research space and R&D expenditures at academic institutions: FY 1988–2019
| Fiscal year | S&E research space | R&D expenditures |
|---|---|---|
| 1988 | 112.0 | 13463 |
| 1990 | 116.0 | 16290 |
| 1992 | 121.0 | 18821 |
| 1994 | 127.0 | 21035 |
| 1996 | 136.0 | 23055 |
| 1998 | 143.0 | 25867 |
| 1999 | 148.0 | 27544 |
| 2001 | 155.0 | 32801 |
| 2003 | 172.7 | 41470 |
| 2005 | 185.1 | 47535 |
| 2007 | 187.9 | 51590 |
| 2009 | 196.1 | 57288 |
| 2011 | 202.2 | 65274 |
| 2013 | 211.8 | 67145 |
| 2015 | 214.5 | 68694 |
| 2017 | 221.2 | 75278 |
| 2019 | 227.3 | 83653 |
NASF = net assignable square feet.
Note(s):
The biennial survey cycle for the facilities survey ran on even years for FY 1988 to 1998 and on odd years for FY 1999 to 2019. For R&D funding, totals for FY 1988–2002 represent R&D expenditures in S&E fields only. From FY 2003 through FY 2009, some institution totals for all R&D expenditures may be lower-bound estimates because the National Center for Science and Engineering Statistics did not attempt to estimate for nonresponse on the non-S&E R&D expenditures item prior to FY 2010.
Source(s):
National Center for Science and Engineering Statistics, Survey of Science and Engineering Research Facilities; National Center for Science and Engineering Statistics, Higher Education Research and Development Survey.
Science and Engineering Indicators
Research space in most S&E fields increased overall between 2007 and 2019. The exception to this norm was computer and information sciences, which declined by about 4% (from 4.8 million to 4.6 million NASF); however, the amount of space devoted to these fields increased from 2017 to 2019 (by 0.4 million NASF) (NCSES Facilities 2019: Table 1). Engineering is the only major field in which total research space steadily increased during this 12-year interval.
Overall, biological and biomedical sciences accounted for 35% of total S&E research space growth over the past 12 years. The 58.7 million NASF of biological and biomedical sciences research space also accounted for the largest share of research space, with 26% of the total. Health sciences (18%), engineering (17%), agricultural sciences (12%), and physical sciences (10%) comprised the next-largest shares of S&E research space (NCSES Facilities 2019: Table 1).
The distribution of research space across fields, as well as the total amount of research space, varies between institutions. For example, in 2019, the 25 institutions with the most research space were all very high research activity doctoral universities and contained around 31% of total research space. A ranking of institutions by NASF, showing the breakdown by field, is available at NCSES Facilities 2019: Table 3 (see also Gibbons 2020).
New research space is added each year through construction projects and the repurposing of existing space. According to Gibbons (2020), most new construction of research space is supported by institutional funds and other sources, including operating funds, endowments, private donations, tax-exempt bonds and other debt financing, and recovered indirect costs. Over the past two decades, state and local governments typically funded between a fifth and a third of new research construction. Federal government sources generally provide a lower proportion, often under 10%.
Academic institutions broke ground on 5.6 million NASF of new S&E research space construction projects in 2018–2019, which was smaller than the amount of new research space construction started in 2016–2017 (6.7 million NASF) (NCSES Facilities 2019: Table 8). Institutions reported $5.1 billion in completion costs for these new construction projects, which were largely funded by the institutions’ internal funds (76%) (NCSES Facilities 2019: Table 24). Academic institutions also expended $5.5 billion on major repairs and renovation of S&E research space in 2018 or 2019 (NCSES Facilities 2019: Table 25).
Research Equipment
In 2019, universities spent about $2.4 billion on capitalized equipment necessary to conduct academic research projects (Table SURD-1). This spending accounted for close to 3% of the $83.7 billion in total academic R&D expenditures and represented a 12% increase from 2018 when adjusted for inflation. Annual equipment spending has generally ranged between $1.9 billion and $2.3 billion over the last 15 years when adjusted for inflation. The inflation-adjusted total in the previous (2018) cycle was the lowest during this period.
Research equipment expenditures continue to be concentrated in three fields: life sciences (40%), engineering (32%), and physical sciences (16%). While shares for these three fields have consistently accounted for about 80% or more of total equipment expenditures, the combined shares have been at or near the highest on record for the past several years. Also noteworthy is that more than a third of all research equipment expenditures stemmed from two life sciences subfields: biological and biomedical sciences (19%) and health sciences (16%) (NCSES HERD 2019: Table 17).
When adjusted for inflation, the 2019 level of equipment spending in engineering was the highest in the last 15 years (Table SURD-1). The 2019 level of science equipment spending was roughly equivalent to the level in FY 2015 and FY 2016, although lower than it was 10 years ago.
Unlike funding for new construction of research space, which relies heavily on institutional funds, the federal government typically plays a larger role in providing funding for academic research equipment. Before 2014, the share of research equipment expenditures funded by federal sources remained above 50% since data were initially collected in 1981. Since 2014, the federal government has funded 44% to 47% of research equipment expenditures (Table SURD-2).
The federal share of research equipment funding varied significantly by R&D field and subfield. Atmospheric sciences and meteorology (71%), ocean sciences and marine sciences (77%), physics (73%), and industrial and manufacturing engineering (71%) were the only fields receiving 70% or more of their R&D equipment funding from federal sources. Economics (8%) and anthropology (18%) were the only S&E subfields receiving less than 20% federal support for R&D equipment. Several non-S&E fields also received less than 20% federal support for R&D equipment.