 An official website of the United States government
 STEM Labor Market Conditions and the Economy
Indicators of labor market conditions and salaries provide information on economic rewards and the overall attractiveness of STEM careers. Data suggest that labor market outcomes are generally favorable for workers in STEM occupations compared to workers in non-STEM occupations. Despite variation by occupation and level of education, workers in STEM occupations tend to have higher salaries and lower unemployment rates than their non-STEM counterparts.
This section examines the unemployment, working involuntarily part time or in a position not in one’s degree field, salary, and distribution of STEM workers throughout the U.S. economy. It also presents data on the labor market outcomes of workers with a bachelor’s degree or higher in a subset of STEM occupations—that is, S&E and S&E-related occupations. (See the Glossary section for definitions of S&E occupations and S&E-related occupations.) The primary data source for the analysis of STEM workers with a bachelor’s degree or higher, NCSES’s NSCG, does not separately identify workers in middle-skill occupations from those in non-STEM occupations. (See the Glossary section for definitions of middle-skill occupations and non-STEM occupations.) Hence, workers with a bachelor’s degree or higher in non-S&E occupations include those in middle-skill and non-STEM occupations. (See the Glossary section for definition of non-S&E occupations.)
Unemployment
The unemployment rate is a long-standing key labor market indicator used to measure the performance of the labor market and the strength of the economy (ILO 2019). The unemployment rate is defined as the proportion of the labor force—people who are either working or actively looking for work—who are not working (BLS 2020b). People who are not looking for a job, such as a stay-at-home parent, are not included in the labor force.
Many factors contribute to unemployment. Frictional unemployment causes the unemployment rate to be nonzero and is the result of temporary transitions in workers’ lives, such as when a worker moves to a new city and must find a job or a recent college graduate enters the job market (Dubina 2017). Structural unemployment can be caused by a mismatch in worker skills and available jobs, such as occurs in industries undergoing technological advancements. Seasonal unemployment is caused by different industries or parts of the labor market being available during different seasons or times of the year, such as agricultural jobs during the fall, when crops are harvested, or retail sales jobs during the winter holiday season. Cyclical unemployment is caused by declining demand and is usually associated with times of recession in the business cycle.
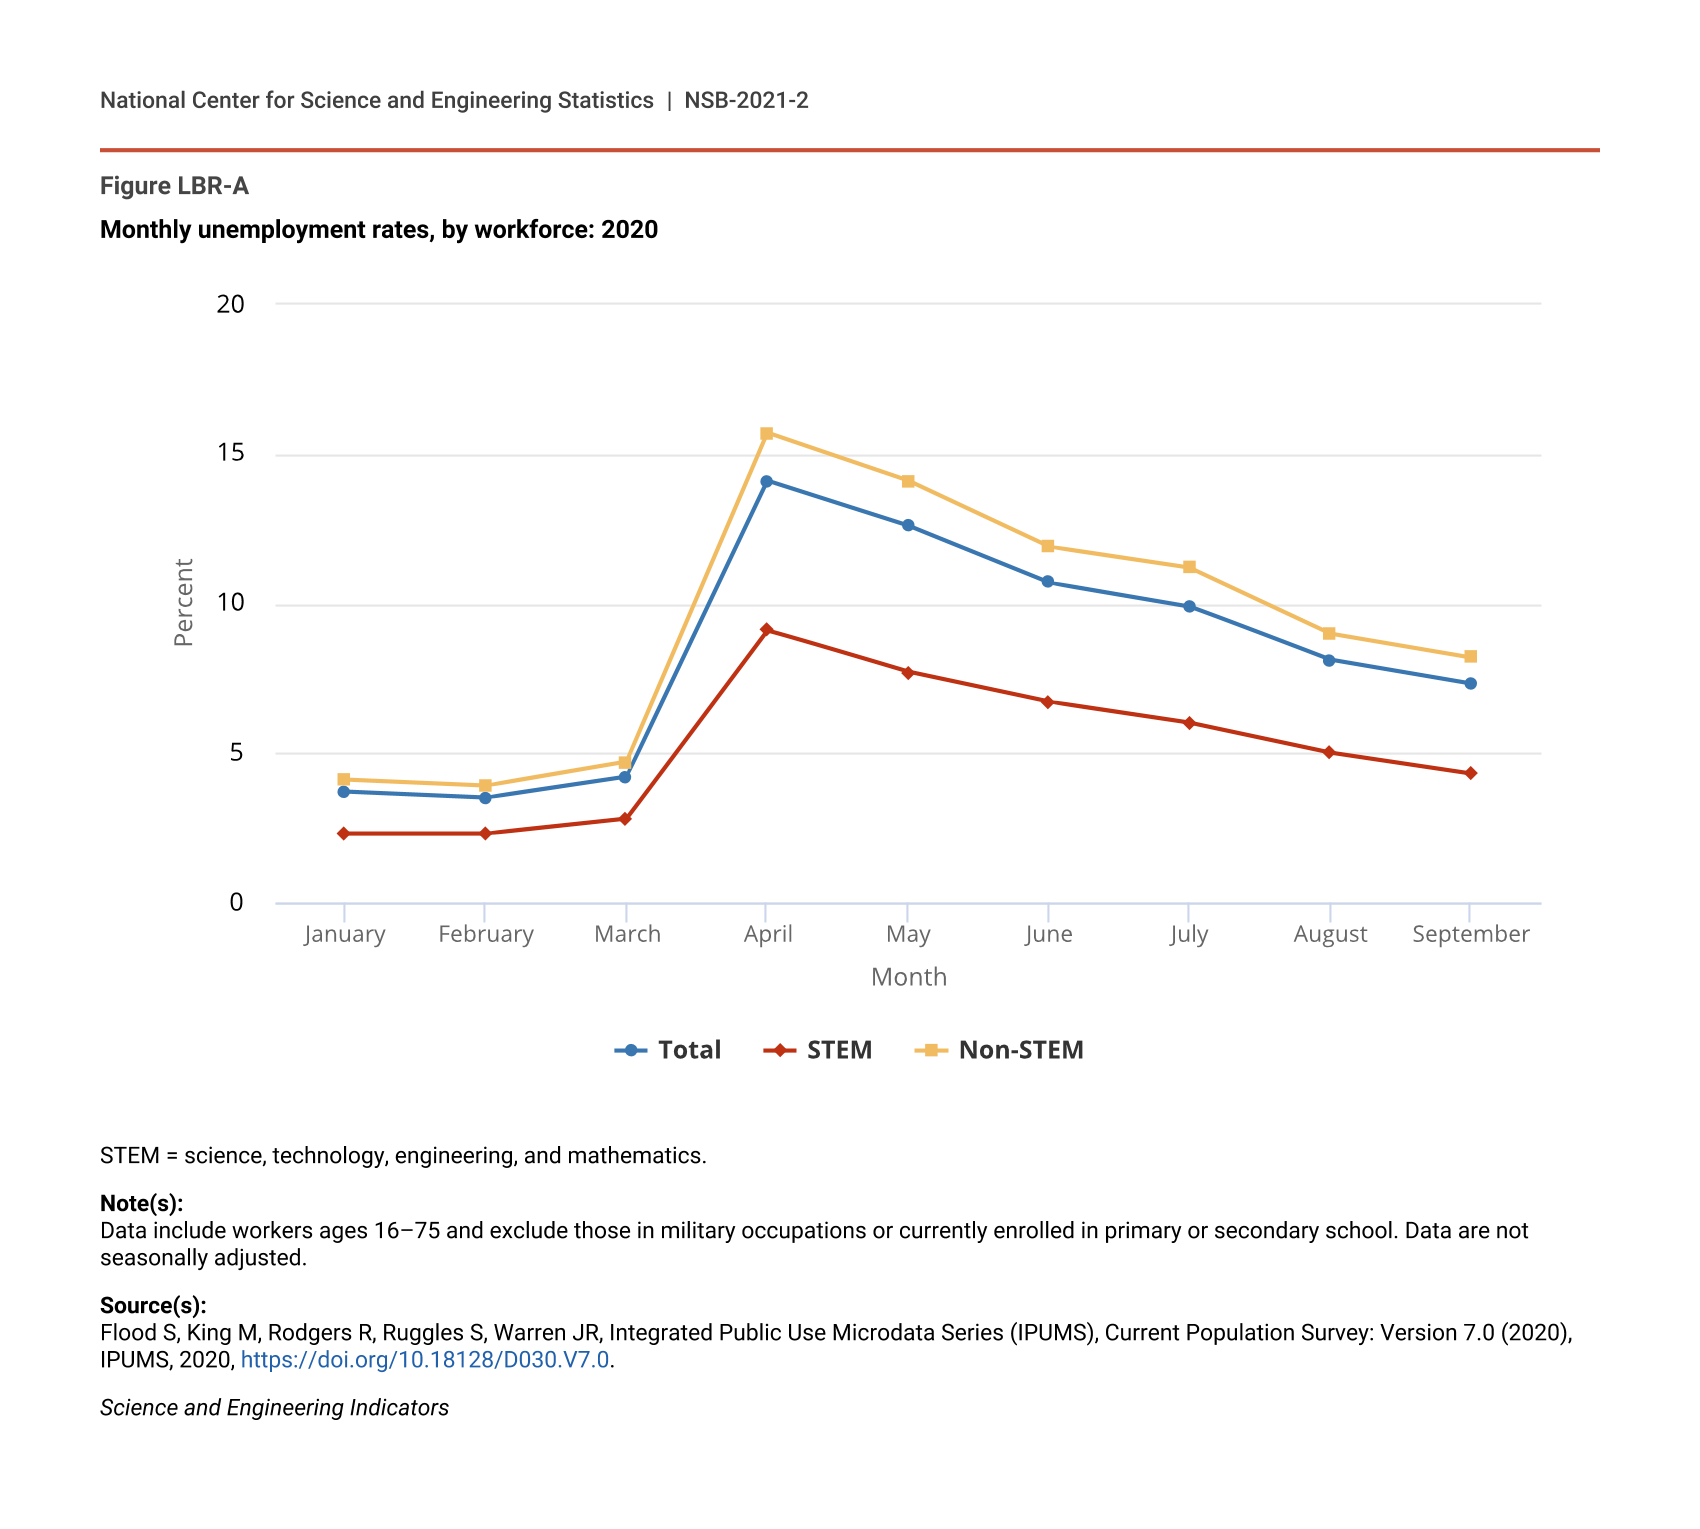
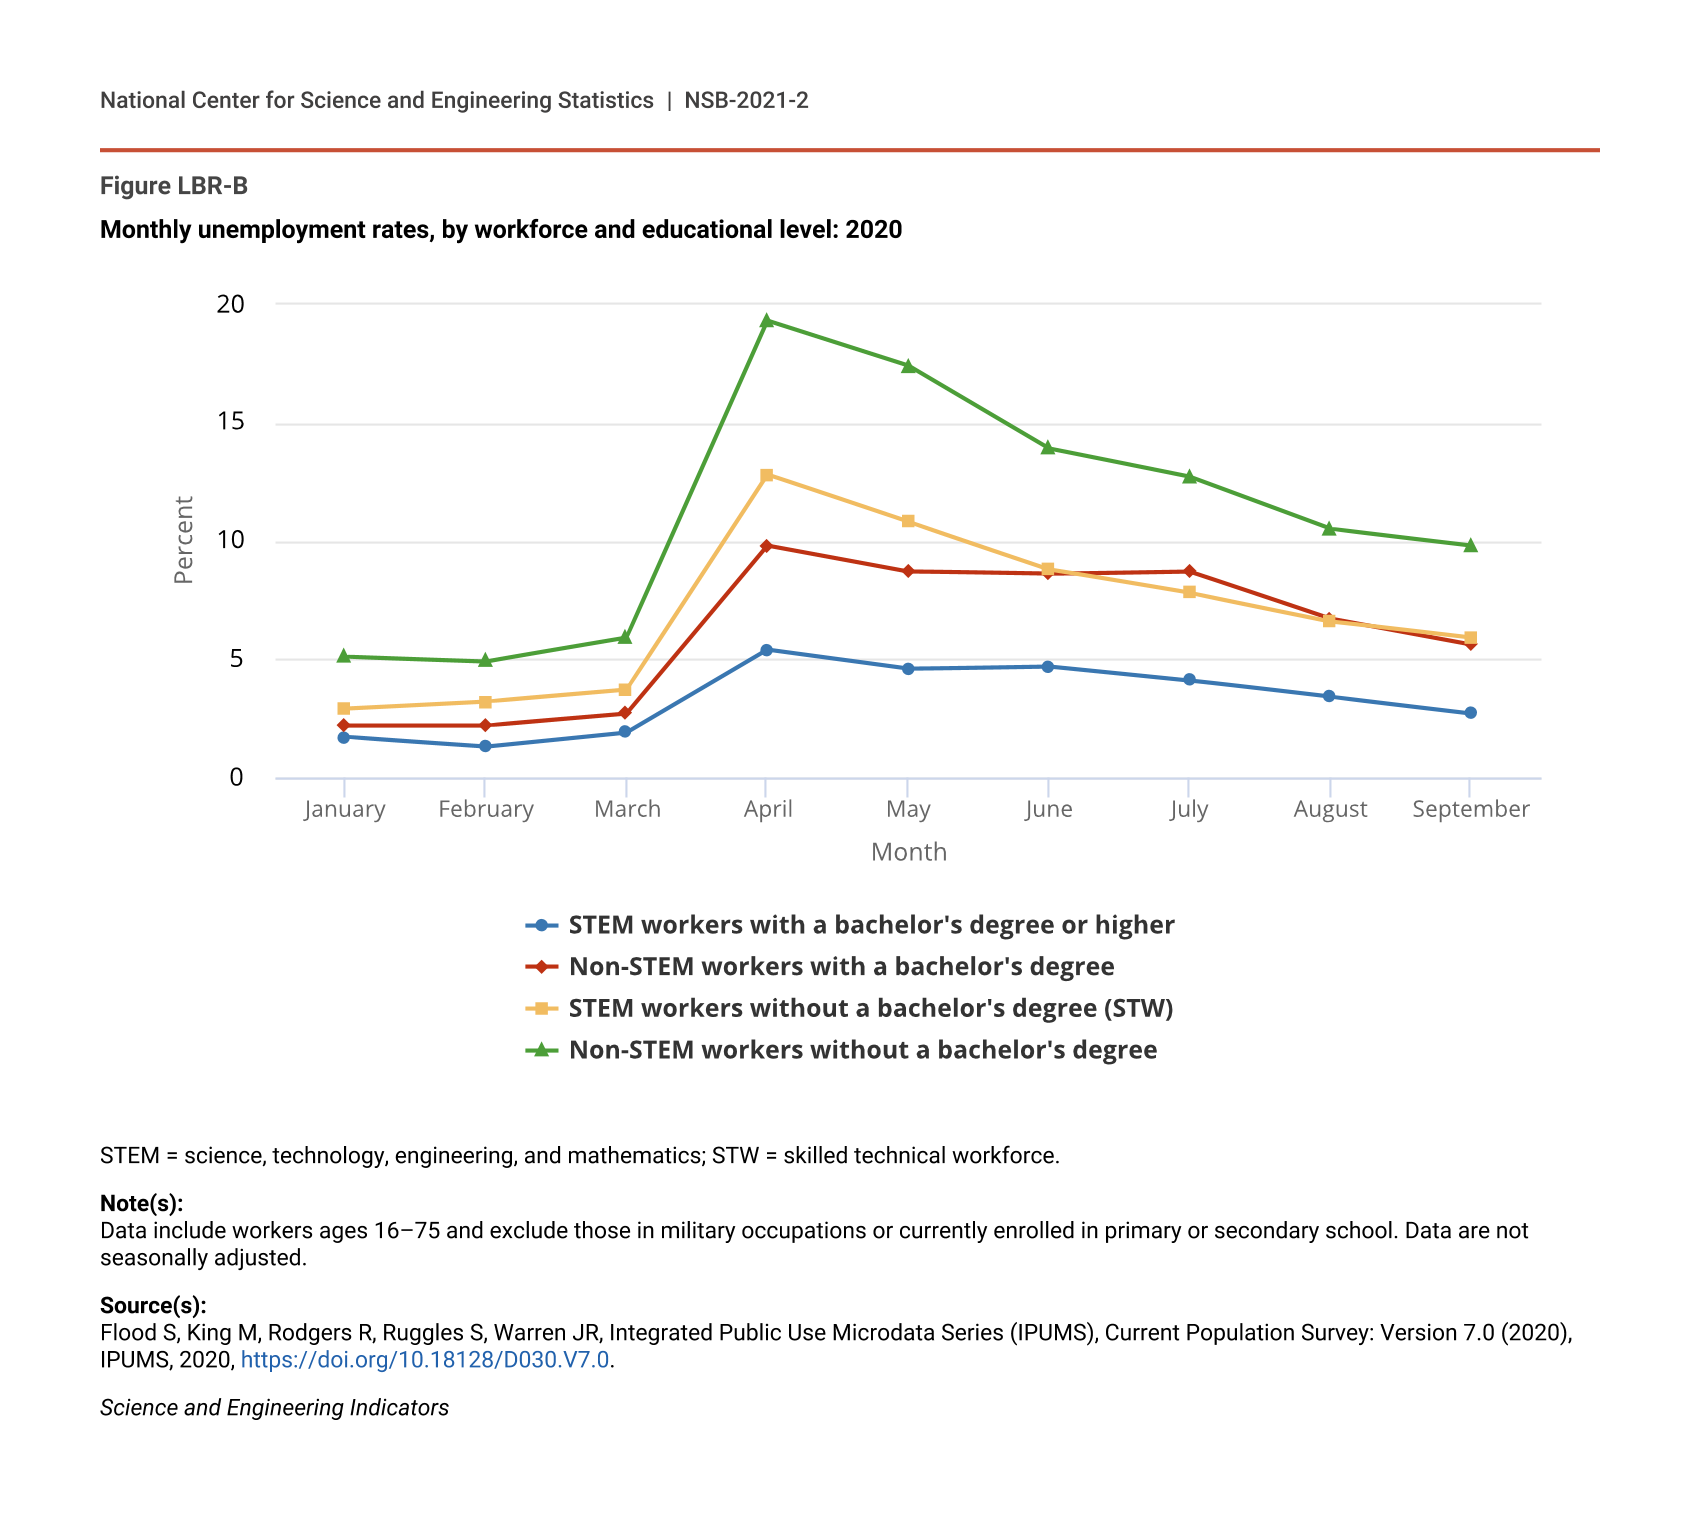
Although the COVID-19 pandemic was not part of the business cycle, it caused short-term unemployment similar to cyclical unemployment. The long-term, structural impact of the crisis has yet to be determined. Beginning around April 2020, unemployment rose in the United States as many businesses, and society in general, shut down or self-quarantined to prevent the rapid spread of COVID-19. However, unemployment rates differed by occupation and level of education. (See sidebar STEM and Non-STEM Unemployment in the Time of COVID-19.)
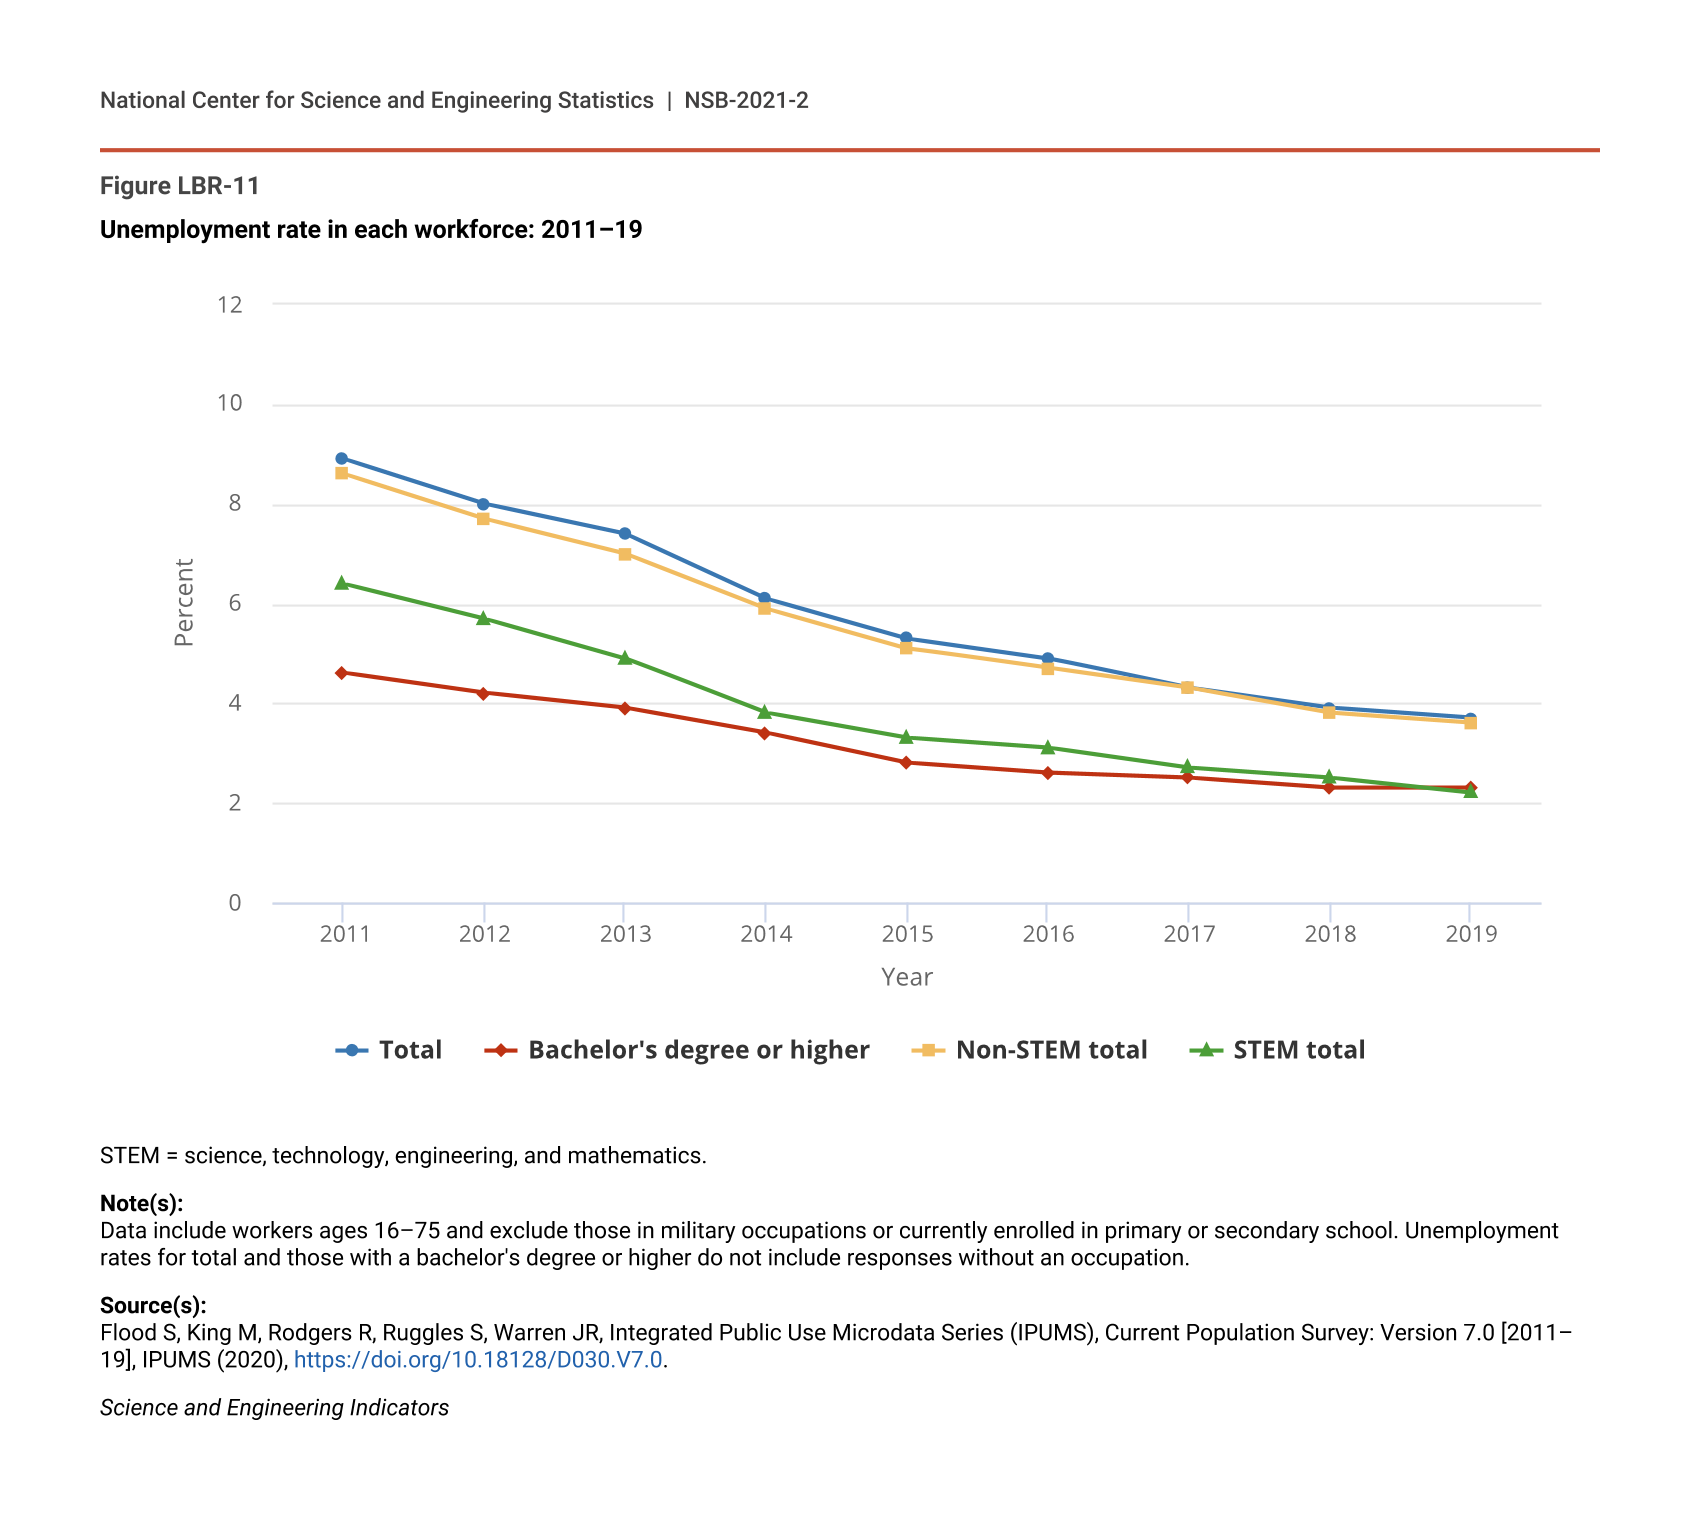
The STEM labor force has historically experienced lower annual unemployment rates than the overall labor force (Figure LBR-11). The BLS CPS (Flood et al. 2020) shows that although all groups experienced relatively high unemployment rates following the Great Recession (2007–2009), the unemployment rate for the STEM labor force was consistently less than that for the total and non-STEM labor forces. By 2019, unemployment rates declined for all broadly defined occupational groups but were lowest for the STEM labor force (2.2%) and for those with a bachelor’s degree or higher (2.3%). Unemployment was highest for workers in the total (3.7%) and non-STEM labor forces (3.6%).
Unemployment rate in each workforce: 2011–19
| Year | Total | Bachelor's degree or higher | Non-STEM total | STEM total |
|---|---|---|---|---|
| 2011 | 8.9 | 4.6 | 8.6 | 6.4 |
| 2012 | 8.0 | 4.2 | 7.7 | 5.7 |
| 2013 | 7.4 | 3.9 | 7.0 | 4.9 |
| 2014 | 6.1 | 3.4 | 5.9 | 3.8 |
| 2015 | 5.3 | 2.8 | 5.1 | 3.3 |
| 2016 | 4.9 | 2.6 | 4.7 | 3.1 |
| 2017 | 4.3 | 2.5 | 4.3 | 2.7 |
| 2018 | 3.9 | 2.3 | 3.8 | 2.5 |
| 2019 | 3.7 | 2.3 | 3.6 | 2.2 |
STEM = science, technology, engineering, and mathematics.
Note(s):
Data include workers ages 16–75 and exclude those in military occupations or currently enrolled in primary or secondary school. Unemployment rates for total and those with a bachelor's degree or higher do not include responses without an occupation.
Source(s):
Flood S, King M, Rodgers R, Ruggles S, Warren JR, Integrated Public Use Microdata Series (IPUMS), Current Population Survey: Version 7.0 [2011–19], IPUMS (2020), https://doi.org/10.18128/D030.V7.0.
Science and Engineering Indicators
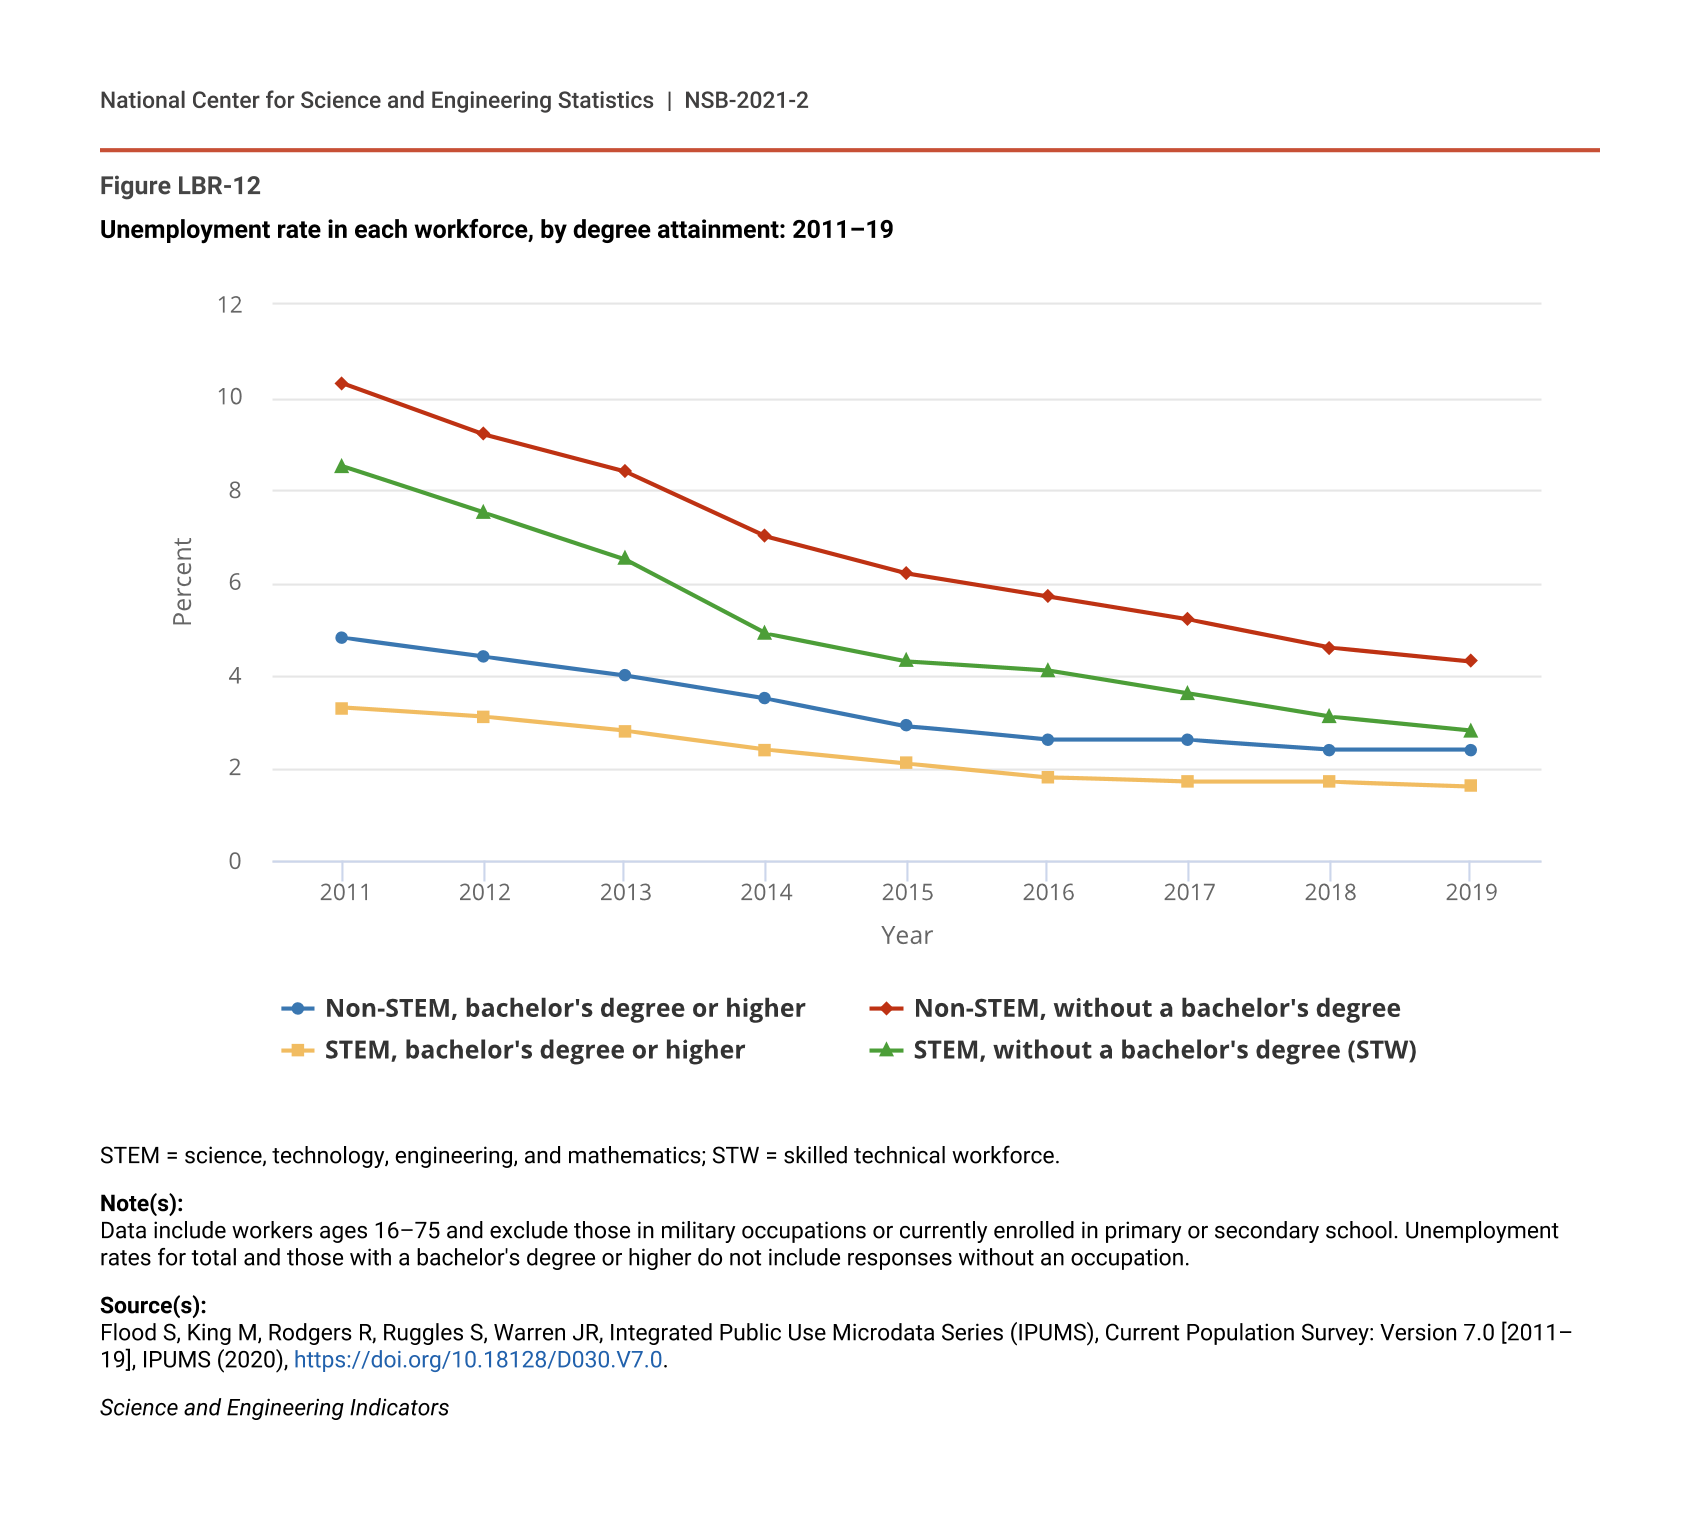
On average, the STEM labor force at all education levels experienced lower unemployment rates compared to their non-STEM counterparts. The STEM labor force with a bachelor’s degree or higher had lower rates throughout the decade than the non-STEM labor force with a bachelor’s degree (Figure LBR-12). The NSCG further indicates that unemployment rates for the labor force with a bachelor’s degree or higher varied within major occupational categories in S&E and by degree levels. For example, individuals with their highest degree at the doctoral or professional level were generally less vulnerable to unemployment than those with a bachelor’s as their highest degree (Table SLBR-7). The STEM labor force without a bachelor’s degree also had lower rates than their non-STEM counterparts. By 2019, 2.8% of the STEM labor force without a bachelor’s degree, or the STW, were unemployed compared to 4.3% of non-STEM labor force without a bachelor’s degree, indicating the relative strength of jobs requiring technical skills and expertise (Figure LBR-12).
Unemployment rate in each workforce, by degree attainment: 2011–19
| Year | Non-STEM, bachelor's degree or higher | Non-STEM, without a bachelor's degree | STEM, bachelor's degree or higher | STEM, without a bachelor's degree (STW) |
|---|---|---|---|---|
| 2011 | 4.8 | 10.3 | 3.3 | 8.5 |
| 2012 | 4.4 | 9.2 | 3.1 | 7.5 |
| 2013 | 4.0 | 8.4 | 2.8 | 6.5 |
| 2014 | 3.5 | 7.0 | 2.4 | 4.9 |
| 2015 | 2.9 | 6.2 | 2.1 | 4.3 |
| 2016 | 2.6 | 5.7 | 1.8 | 4.1 |
| 2017 | 2.6 | 5.2 | 1.7 | 3.6 |
| 2018 | 2.4 | 4.6 | 1.7 | 3.1 |
| 2019 | 2.4 | 4.3 | 1.6 | 2.8 |
STEM = science, technology, engineering, and mathematics; STW = skilled technical workforce.
Note(s):
Data include workers ages 16–75 and exclude those in military occupations or currently enrolled in primary or secondary school. Unemployment rates for total and those with a bachelor's degree or higher do not include responses without an occupation.
Source(s):
Flood S, King M, Rodgers R, Ruggles S, Warren JR, Integrated Public Use Microdata Series (IPUMS), Current Population Survey: Version 7.0 [2011–19], IPUMS (2020), https://doi.org/10.18128/D030.V7.0.
Science and Engineering Indicators
Working Involuntarily Part Time or Out of One’s Field of Highest Degree
Working involuntarily out of field (IOF) or involuntarily part time (IPT) can sometimes indicate underutilization of labor and can be viewed as one indicator of economic inefficiencies that arise from labor market stress. Individuals work outside of their highest degree field or part time for a variety of reasons. Labor market conditions, such as availability of suitable work or career and personal reasons, influence these employment choices (NSB 2016; NSB 2018; Stenard and Sauermann 2016). Those who reported working outside of the field of their highest degree because suitable work in their degree field was not available are referred to as IOF workers, and their number compared to all employed individuals is the IOF rate.
Another dimension of labor underutilization is working part time because full-time employment was not available. The IPT rate is the number of workers working part time because full-time work was unavailable compared to all employed individuals. The IOF rate applies only to workers with a bachelor’s degree or higher, whereas the IPT rate applies more generally to all workers regardless of educational attainment. However, the IOF and IPT rates discussed in this report are only for workers with a bachelor’s degree or higher reported in the 2019 NSCG.
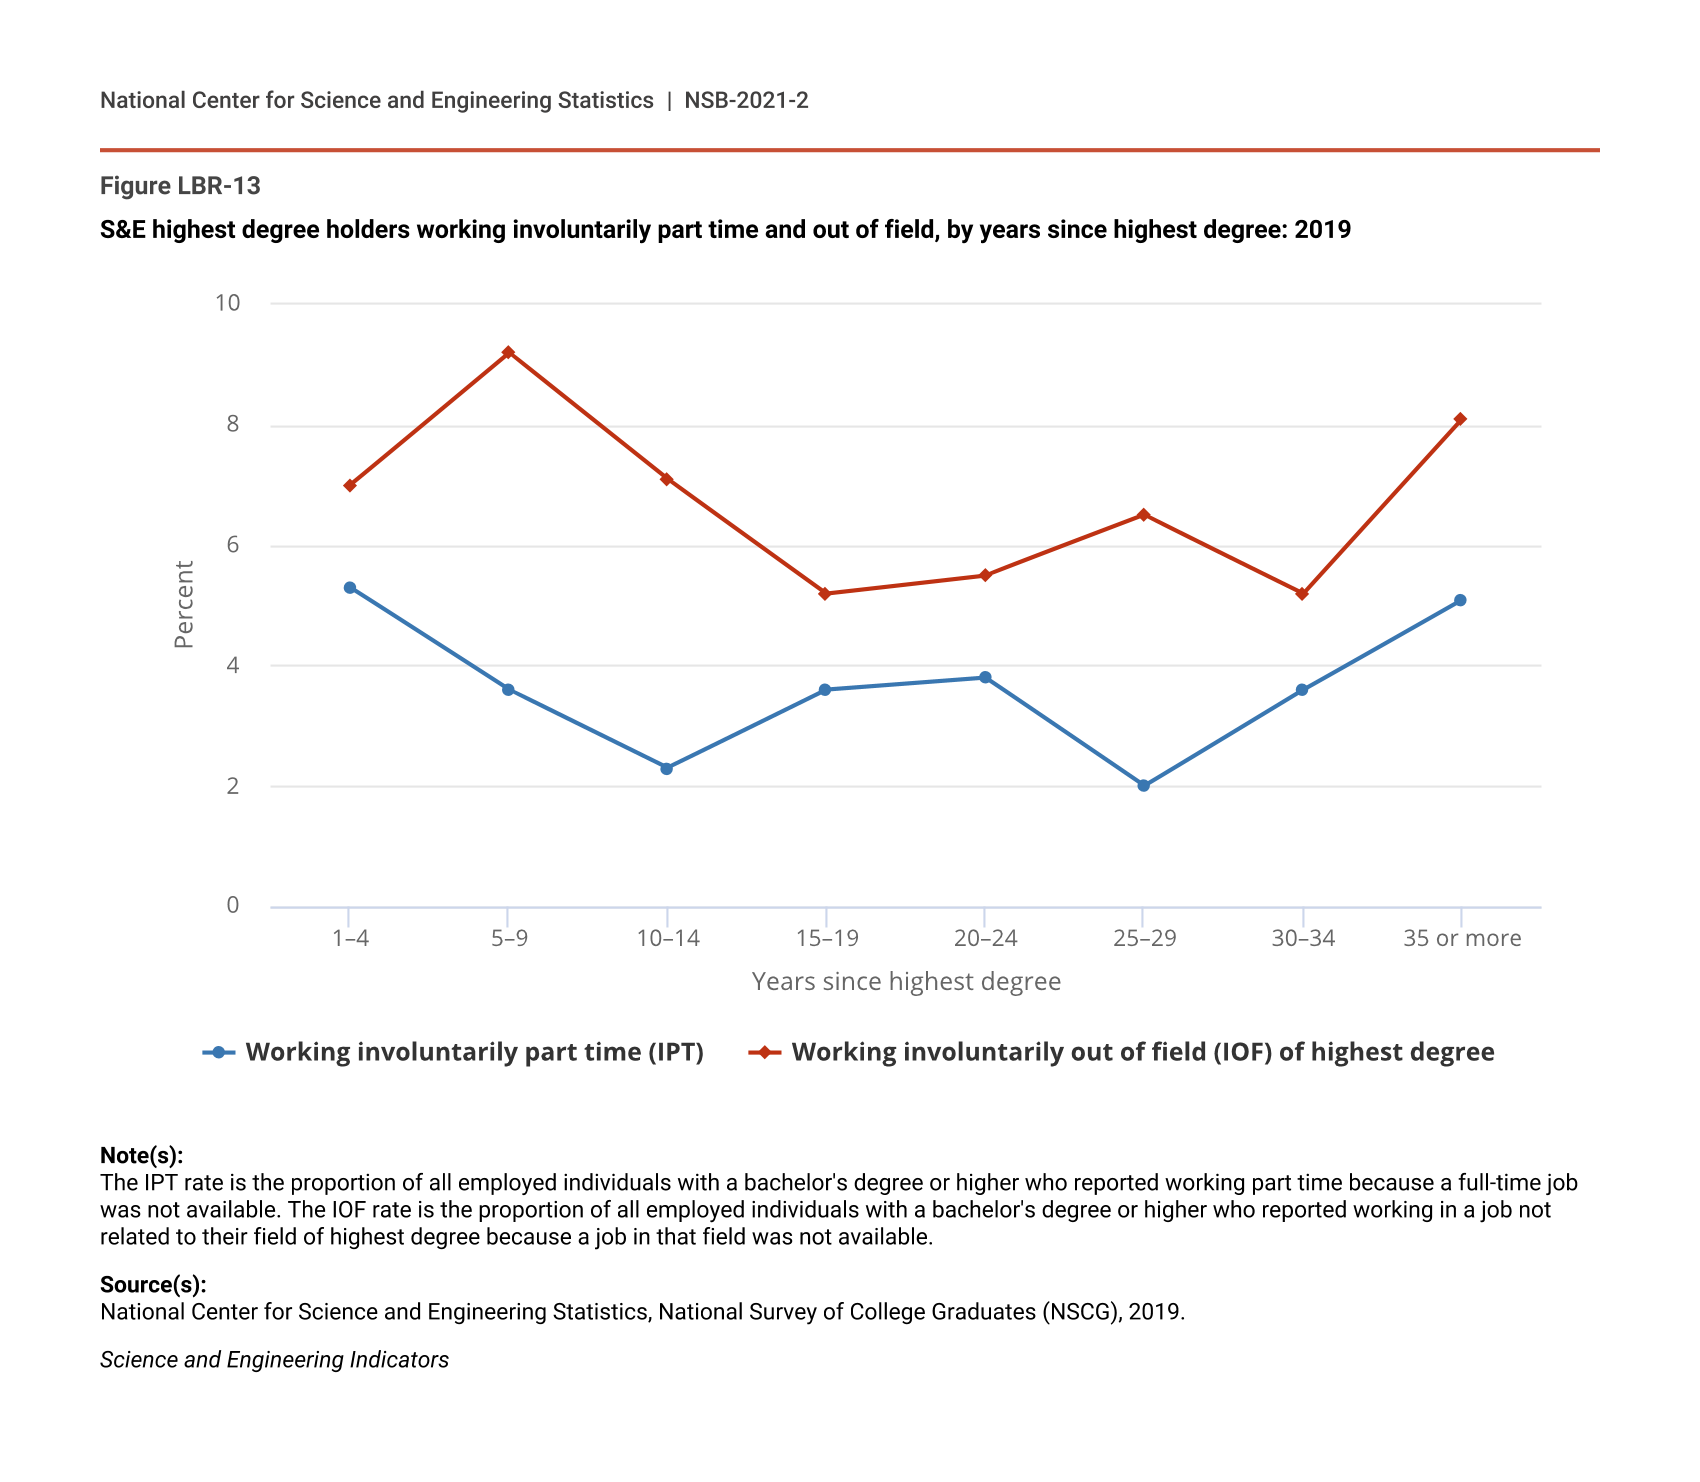
In 2019, about 4% of S&E highest degree holders were IPT, and 7% were IOF. Although the IPT rates have been fairly stable since 2010, the IOF rates have declined (Table SLBR-8). Similar to other labor market outcomes, IOF rates vary by degree levels and S&E fields of study. Those with their highest degree in engineering or computer and mathematical sciences have lower IOF rates than those with their highest degree in physical, life, or social sciences. Additionally, those with their highest degree in engineering have a lower IPT rate than all other fields. For all S&E highest degree holders, the IOF rate and IPT rate are generally stable across most of the career cycle (Figure LBR-13).
S&E highest degree holders working involuntarily part time and out of field, by years since highest degree: 2019
| Years since highest degree | Working involuntarily part time (IPT) | Working involuntarily out of field (IOF) of highest degree |
|---|---|---|
| 1–4 | 5.3 | 7.0 |
| 5–9 | 3.6 | 9.2 |
| 10–14 | 2.3 | 7.1 |
| 15–19 | 3.6 | 5.2 |
| 20–24 | 3.8 | 5.5 |
| 25–29 | 2.0 | 6.5 |
| 30–34 | 3.6 | 5.2 |
| 35 or more | 5.1 | 8.1 |
Note(s):
The IPT rate is the proportion of all employed individuals with a bachelor's degree or higher who reported working part time because a full-time job was not available. The IOF rate is the proportion of all employed individuals with a bachelor's degree or higher who reported working in a job not related to their field of highest degree because a job in that field was not available.
Source(s):
National Center for Science and Engineering Statistics, National Survey of College Graduates (NSCG), 2019.
Science and Engineering Indicators
Earnings
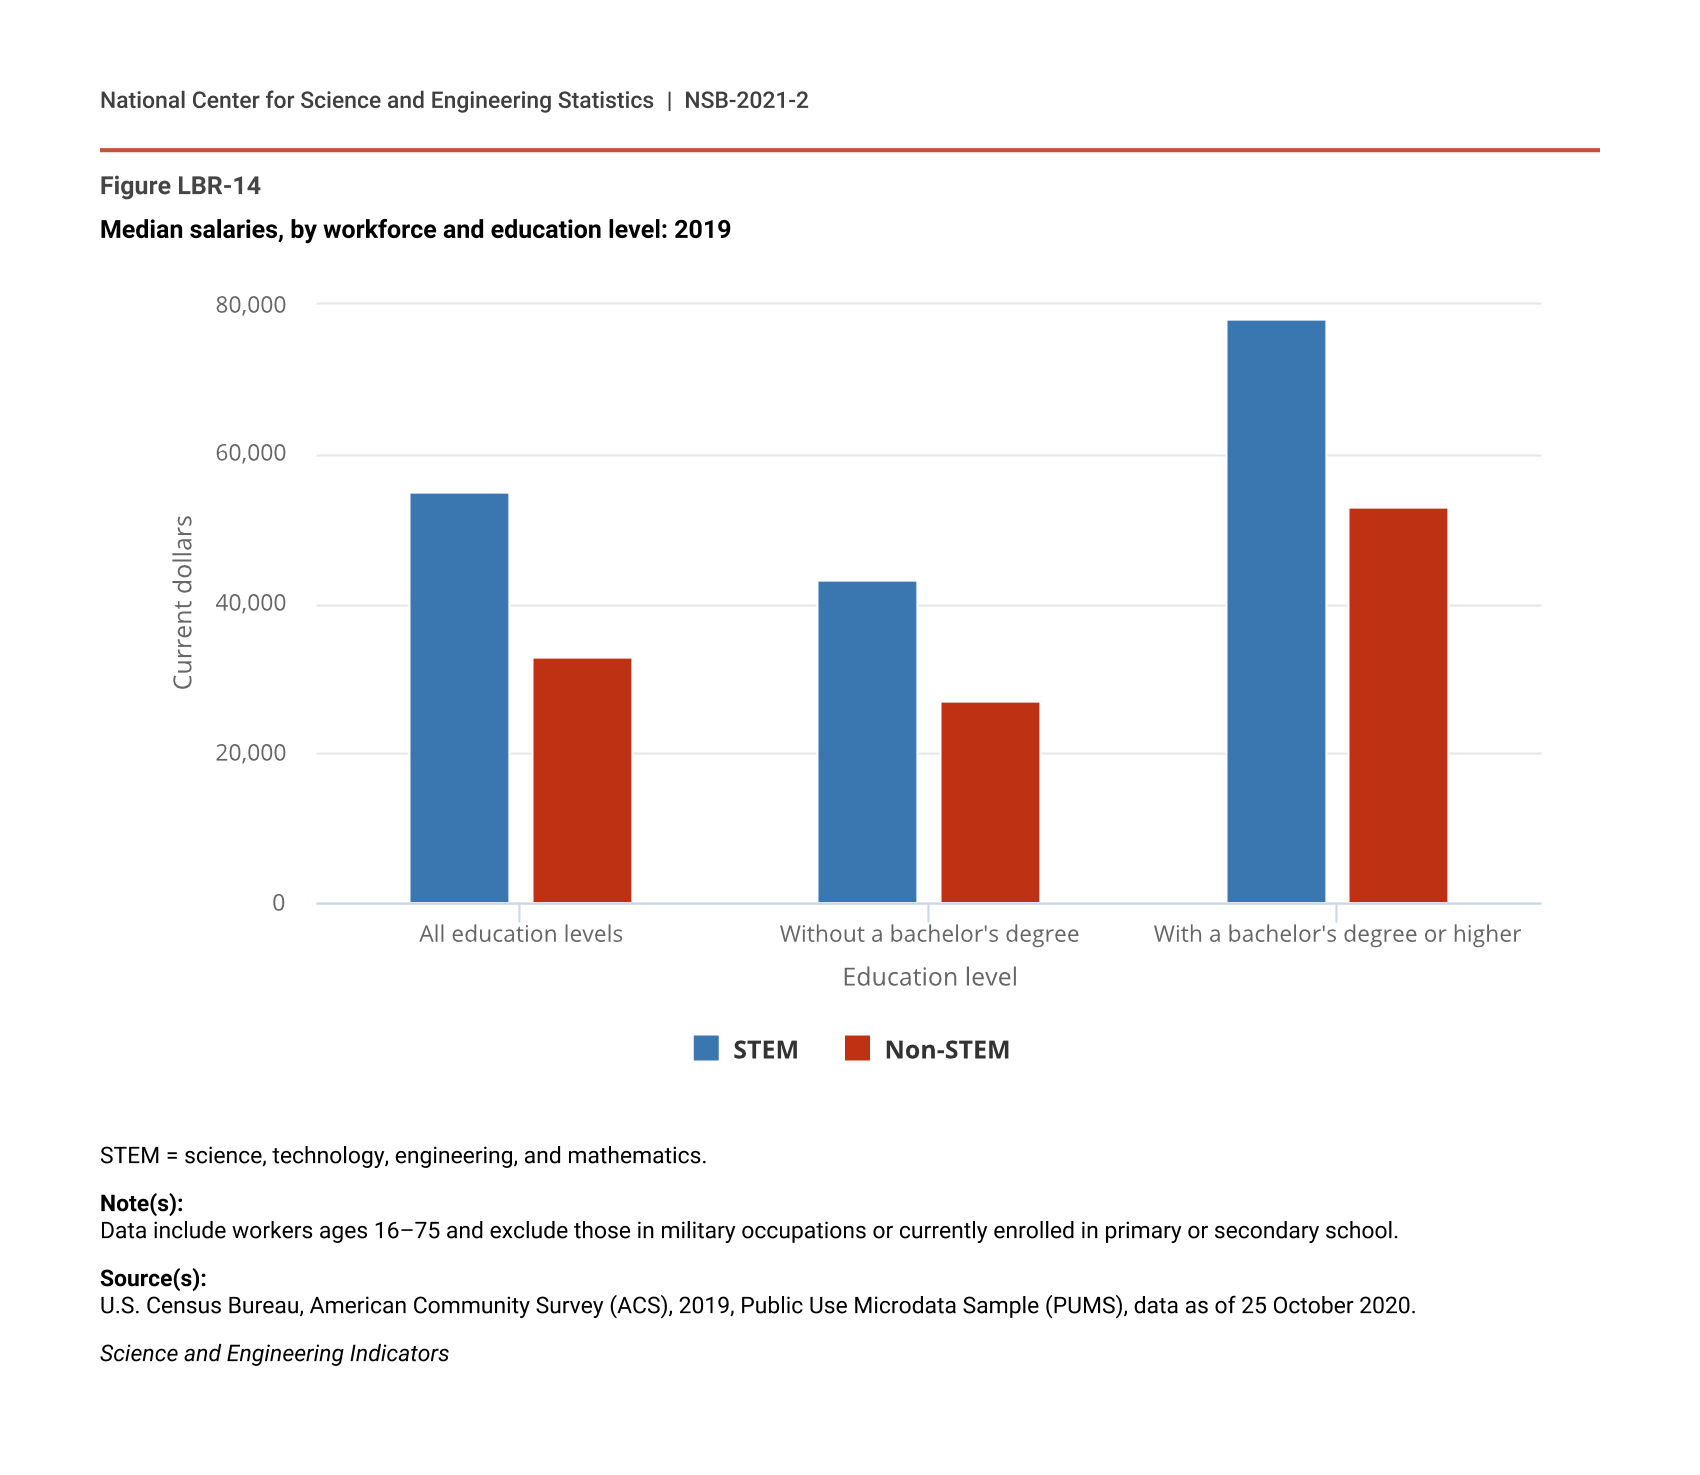
The wages that people earn fuel the economy and give workers the ability to support themselves and their families. STEM workers have higher median salaries than their non-STEM counterparts ($55,000 compared to $33,000) (Figure LBR-14). Data from the ACS show that this pattern holds regardless of education level. STEM workers with a bachelor’s degree or higher have a median salary that is 47% greater than that of non-STEM workers with a bachelor’s degree or higher. The STW earns 60% more at the median than non-STEM workers without a bachelor’s degree.
Median salaries, by workforce and education level: 2019
| Education level | STEM | Non-STEM |
|---|---|---|
| All education levels | 55,000 | 33,000 |
| Without a bachelor's degree | 43,200 | 27,000 |
| With a bachelor's degree or higher | 78,000 | 53,000 |
STEM = science, technology, engineering, and mathematics.
Note(s):
Data include workers ages 16–75 and exclude those in military occupations or currently enrolled in primary or secondary school.
Source(s):
U.S. Census Bureau, American Community Survey (ACS), 2019, Public Use Microdata Sample (PUMS), data as of 25 October 2020.
Science and Engineering Indicators
Across all educational levels, the BLS (2017, 2020c) Occupational Employment Statistics (OES) show that workers in S&E occupations earn considerably more than the overall workforce. The median annual salary in 2019 for all workers in S&E occupations (regardless of education level or field) was $88,720, which is more than double the median for all U.S. workers ($39,810) (Table LBR-3). This reflects the high level of formal education and technical skills associated with S&E occupations.
Annual salaries in S&E and S&E-related occupations: 2016–19
STEM = science, technology, engineering, and mathematics.
Note(s):
Occupational Employment Statistics (OES) Survey employment data do not cover employment in some sectors of the agriculture, forestry, fishing, and hunting industry; in private households; or among self-employed individuals. As a result, the data do not represent total U.S. employment. Non-S&E occupations include middle-skill and non-STEM occupations. Other S&E-related workers include actuaries, architects (except naval), postsecondary architecture teachers, and cartographers and photogrammetrists.
Source(s):
Bureau of Labor Statistics, special tabulations (2017 and 2020) of the 2016 and 2019 OES Survey.
Science and Engineering Indicators
Salaries of S&E and S&E-related workers varied across detailed occupational categories. Among workers in S&E occupations, those in computer and mathematical science had the highest median salaries in 2019 at $103,900 (Table LBR-3). Salaries for workers in S&E-related occupations displayed similar patterns of higher earnings compared to the overall workforce. Health-related occupations, the largest segment of S&E-related occupations, cover a wide variety of workers ranging from physicians, surgeons, and practitioners to nurses, therapists, pharmacists, and health technicians. As a result, these occupations display a large variation in salary levels from a median of $73,300 to $205,590.
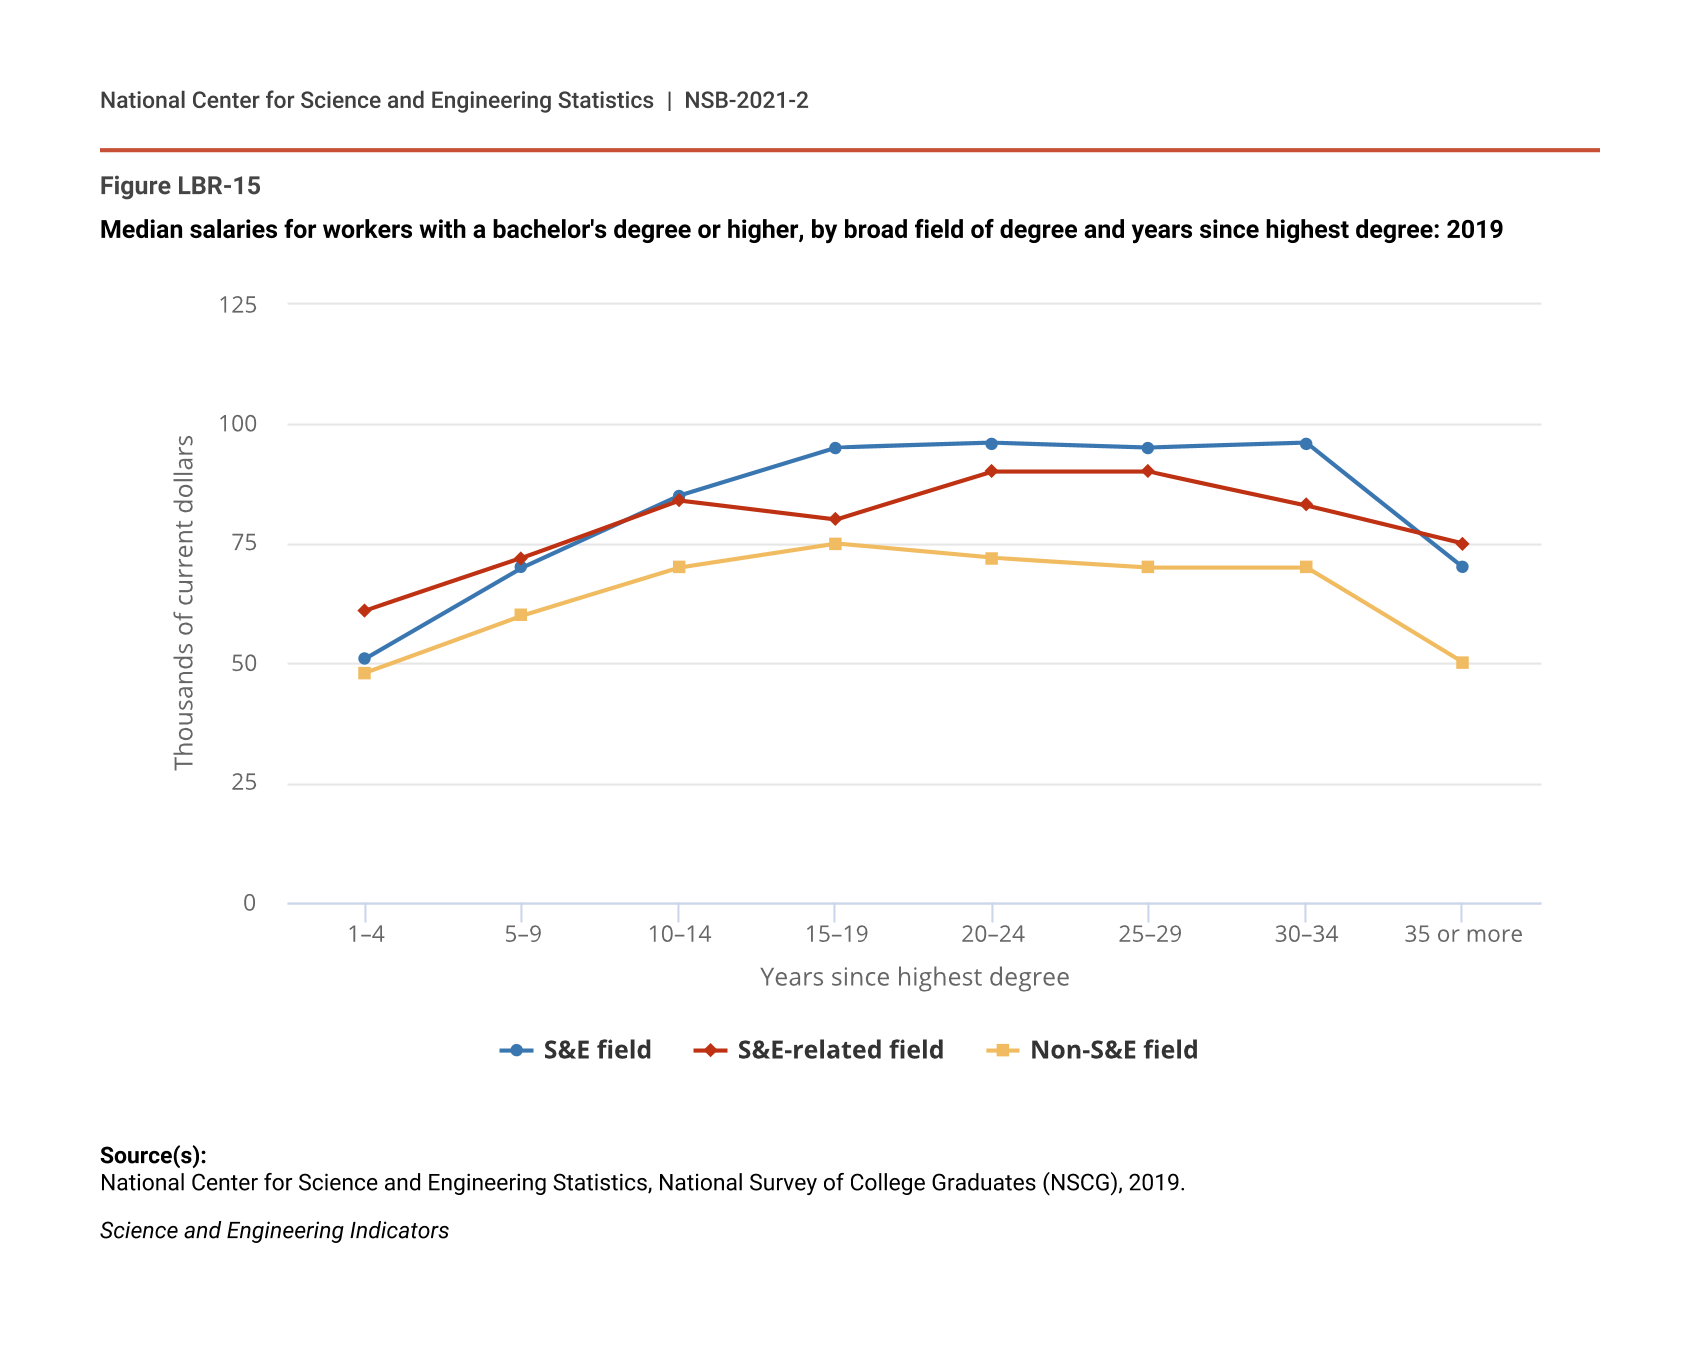
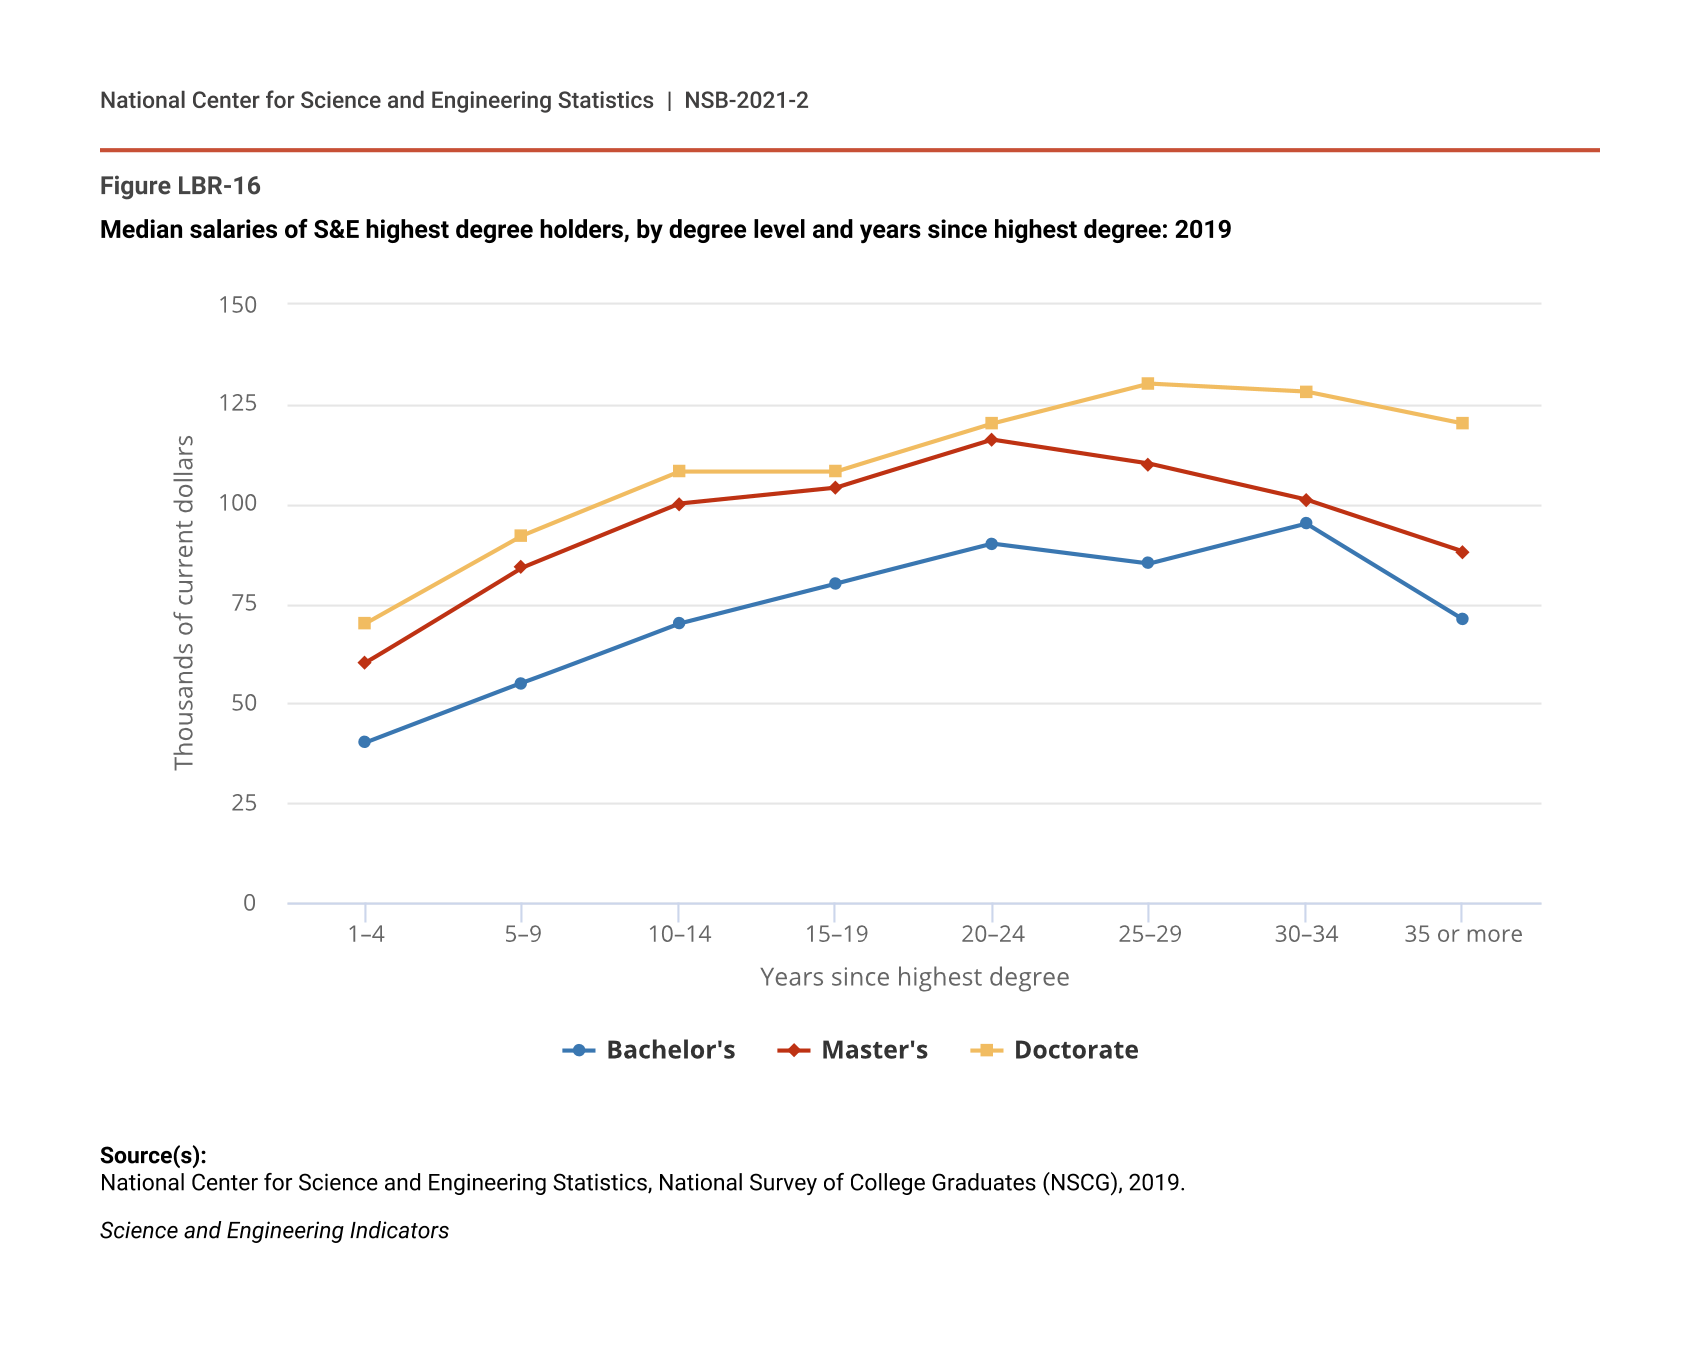
Across broad degree fields reported in the NSCG, workers with an S&E or S&E-related degree earn more across most career stages compared to workers with a non-S&E degree (Figure LBR-15). This earning premium, as measured by median salaries, varies by degree level with S&E master’s and doctoral degree holders earning more at nearly all stages of the career cycle compared to bachelor’s degree holders (Figure LBR-16). Additionally, the earnings premium of doctoral degree holders remains high at the end of the career cycle, whereas bachelor’s degree or master’s degree holders have mostly decreased earnings at the end of the career cycle.
Median salaries for workers with a bachelor's degree or higher, by broad field of degree and years since highest degree: 2019
| Years since highest degree | S&E field | S&E-related field | Non-S&E field |
|---|---|---|---|
| 1–4 | 51 | 61 | 48 |
| 5–9 | 70 | 72 | 60 |
| 10–14 | 85 | 84 | 70 |
| 15–19 | 95 | 80 | 75 |
| 20–24 | 96 | 90 | 72 |
| 25–29 | 95 | 90 | 70 |
| 30–34 | 96 | 83 | 70 |
| 35 or more | 70 | 75 | 50 |
Source(s):
National Center for Science and Engineering Statistics, National Survey of College Graduates (NSCG), 2019.
Science and Engineering Indicators
Median salaries of S&E highest degree holders, by degree level and years since highest degree: 2019
| Years since highest degree | Bachelor's | Master's | Doctorate |
|---|---|---|---|
| 1–4 | 40 | 60 | 70 |
| 5–9 | 55 | 84 | 92 |
| 10–14 | 70 | 100 | 108 |
| 15–19 | 80 | 104 | 108 |
| 20–24 | 90 | 116 | 120 |
| 25–29 | 85 | 110 | 130 |
| 30–34 | 95 | 101 | 128 |
| 35 or more | 71 | 88 | 120 |
Source(s):
National Center for Science and Engineering Statistics, National Survey of College Graduates (NSCG), 2019.
Science and Engineering Indicators
Recent Graduates
The current economy is marked by rapid information flow and development of new knowledge, products, and processes. Thus, demand for certain skills and abilities may change fast. The employment outcomes of recent graduates—defined in this section as those between 1 year and 5 years since receiving their highest degree—are an important indicator of labor market conditions for more current entrants to the labor market.
Recent S&E graduates experience different labor market outcomes from more established graduates, and this experience differs between degree levels and broad fields. In 2019, the NSCG shows that recent S&E graduates had a higher unemployment rate (4.2%) (Table SLBR-9) than all scientists and engineers (2.6%) (Table SLBR-7). However, the IOF rate was approximately the same for recent S&E graduates (7.1%) (Table SLBR-9) compared to all S&E highest degree holders (6.9%) (Table SLBR-8).
Unemployment and IOF rates for recent doctoral recipients (up to 3 years after receiving a doctorate) vary across SEH fields (Table SLBR-10). For example, according to NCSES’s (2021c) SDR, 2019 unemployment among doctorates in life sciences was 1.4%, and it was 3.7% among those with doctorates in the social sciences. In addition, social sciences doctorates also had a relatively high IOF rate (4.0%) compared to engineering doctorates (1.7%).
Earnings of recent SEH doctorates vary by field as well as by position type and employment sector. For example, median salaries for SEH doctorates who received their doctorate within the past 5 years ranged from $51,000 for postdoctoral positions in 4-year institutions to $110,000 for those employed in the business sector (Table LBR-4). Although each sector exhibited substantial internal variation by SEH field of training, those working in business or industry were the most highly paid within an SEH field.
Median salaries for recent SEH doctorate recipients up to 5 years after receiving degree, by field of degree and employment sector: 2019
s = suppressed for reasons of confidentiality and/or reliability.
SEH = science, engineering, and health.
Note(s):
Salaries are rounded to the nearest $1,000. Data include graduates from 19 months to 60 months prior to the survey reference date. The 2-year or precollege institutions include 2-year colleges and community colleges or technical institutes and also preschool, elementary, middle, or secondary schools. The 4-year institutions include 4-year colleges or universities, medical schools, and university-affiliated research institutes.
Source(s):
National Center for Science and Engineering Statistics, Survey of Doctorate Recipients (SDR), 2019.
Science and Engineering Indicators
Postdoctoral Positions
For many SEH doctoral recipients, a postdoctoral appointment (generally known as a postdoc) is the first position held in the STEM workforce after receiving their doctorate. Postdoc positions are defined as temporary, short-term positions intended primarily for acquiring additional training in an academic, government, industry, or nonprofit setting. Individuals in postdoc positions often perform cutting-edge research and receive valuable training (Dorenkamp and Weiss 2018).
In many SEH fields, faculty positions and nonacademic positions require postdoctoral experience (Sauermann and Roach 2016). However, the extent to which a postdoc appointment is part of an individual’s career path varies greatly across SEH fields. The Survey of Earned Doctorates (SED) shows that postdocs have historically been more common in life sciences and physical sciences than in other fields, such as social sciences and engineering (Table SLBR-11) (NCSES 2020b). Based on the 2019 SDR, salaries for this population up to five years after receiving their doctorate vary by field of doctorate, and the median salary for postdocs ($53,000) was just over half the median salary for individuals in non-postdoc positions ($94,000) (Table LBR-5).
Median salaries for recent SEH doctorate recipients in postdoctoral and non-postdoctoral positions up to 5 years after receiving degree: 2019
SEH = science, engineering, and health.
Note(s):
Data include graduates from 19 months to 60 months before the survey reference date. Salaries are rounded to the nearest $1,000.
Source(s):
National Center for Science and Engineering Statistics, Survey of Doctorate Recipients (SDR), 2019.
Science and Engineering Indicators
The estimated number of postdocs varies depending on the data source used. No single data source measures the entire population of postdocs. NCSES’s (2021e) 2019 Survey of Graduate Students and Postdoctorates in Science and Engineering (GSS) reports that 66,247 doctorates were employed as postdocs and conducting research in SEH fields at U.S. academic institutions and their affiliated research centers and hospitals (NCSES GSS 2019: Table 2-1). This is a 2% increase from 2017, when there were 64,783 postdocs in SEH fields (NCSES GSS 2018: Table 2-1).
Women and temporary visa holders are highly represented in the SEH postdocs. Of the 66,247 academic postdoc positions in SEH fields in 2019, women accounted for 41% (NCSES GSS 2019: Table 2-1). Over half of these postdocs are temporary visa holders. Among postdocs in engineering, however, the proportion of women was only 24%, and the proportion of temporary visa holders was 68% (NCSES GSS 2019: Table 1-2c and Table 1-3c).
Employment Sectors
STEM workers and those with education or training in STEM make contributions across all sectors of the economy, including in the business, education, and government sectors. Data from the 2019 NSCG show that the business sector employs nearly three-fourths of workers with a bachelor’s degree or higher in S&E or S&E-related occupations or with their highest degree in S&E or S&E-related fields. The dominance of the business sector in employment extends to all workers with a bachelor’s degree or higher, regardless of type of occupation (Table SLBR-12).
The education sector, including private and public institutions, is the second largest employer of scientists and engineers (18%). However, among scientists and engineers in the education sector, workers in S&E occupations or with their highest degrees in S&E fields are employed in the education sector at lower proportions (15%–16%) compared to scientists and engineers overall. These differences are largely due to lower proportions of S&E workers and S&E highest degree holders in 2-year and precollege institutions. Sectoral employment of S&E highest degree holders and S&E workers has been quite stable since the early 1990s (Table SLBR-13).
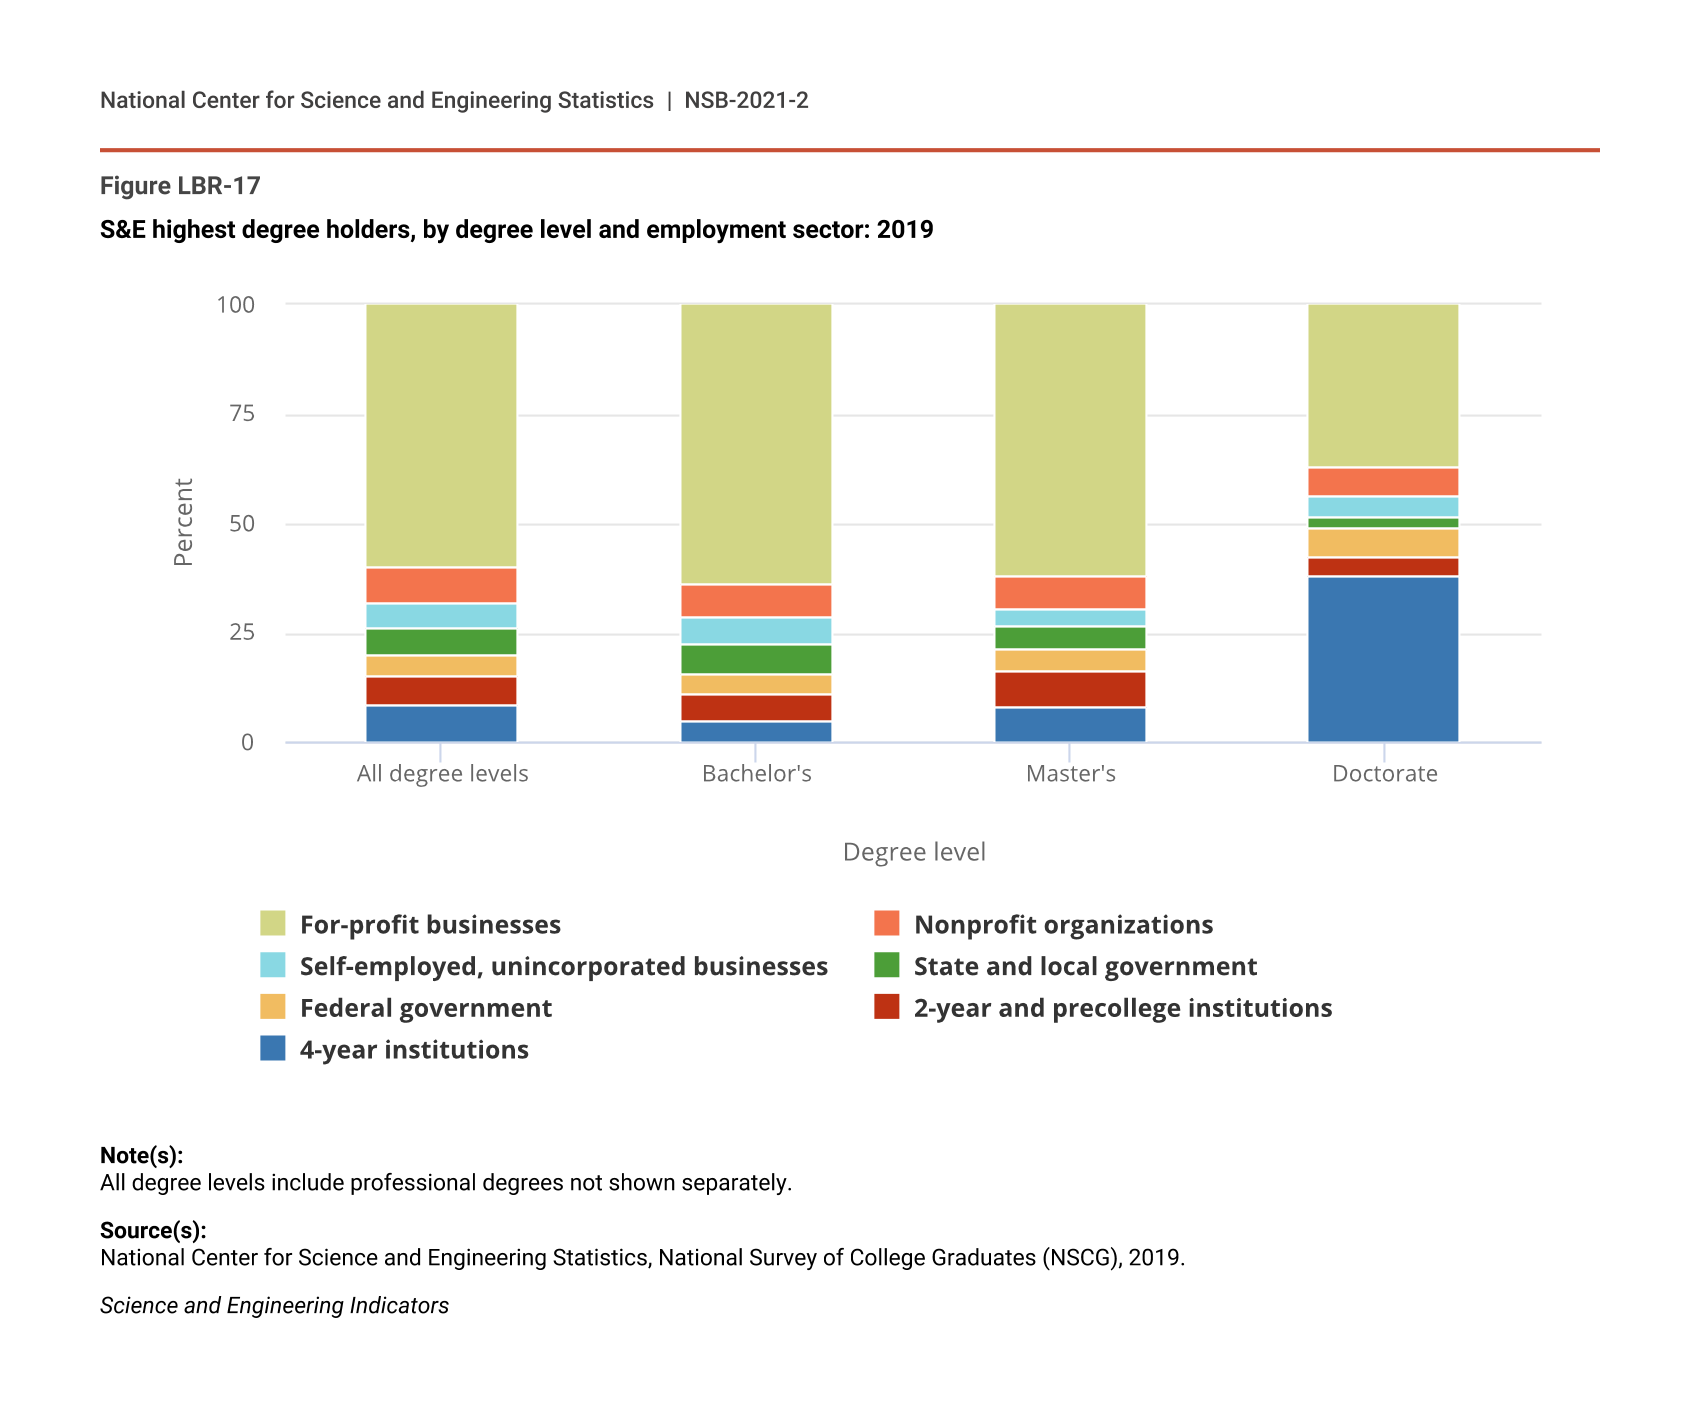
Some differences exist in the concentration of particular groups of S&E workers across employment sectors (Figure LBR-17, Table SLBR-14, Table SLBR-15, Table SLBR-16). For-profit businesses employ 60% or more workers with an S&E highest degree at all degree levels except S&E doctorate holders. Only 37% of S&E highest degree holders at the doctorate level are employed by for-profit businesses, which is similar to the proportion employed by 4-year education institutions (38%) (Figure LBR-17).
S&E highest degree holders, by degree level and employment sector: 2019
| Degree level | 4-year institutions | 2-year and precollege institutions | Federal government | State and local government | Self-employed, unincorporated businesses | Nonprofit organizations | For-profit businesses |
|---|---|---|---|---|---|---|---|
| All degree levels | 8.6 | 6.7 | 4.9 | 6.0 | 5.7 | 8.0 | 60.3 |
| Bachelor's | 5.0 | 6.2 | 4.6 | 6.5 | 6.1 | 8.1 | 63.7 |
| Master's | 8.8 | 9.0 | 6.0 | 5.6 | 4.3 | 8.0 | 68.3 |
| Doctorate | 38.1 | 4.3 | 6.6 | 2.2 | 4.9 | 6.9 | 36.9 |
Note(s):
All degree levels include professional degrees not shown separately.
Source(s):
National Center for Science and Engineering Statistics, National Survey of College Graduates (NSCG), 2019.
Science and Engineering Indicators
Geographic Distribution of the STEM Workforce
The availability of skilled workers is an important indicator of a region’s population, productivity, and technological growth (Carlino, Chatterjee, and Hunt 2001; Glaeser and Saiz 2003). Spatial differences in access to a well-educated workforce and strong innovation sector can contribute to growing inequalities across American communities (Moretti 2013). The BLS (2020c) OES data, which include workers at all education levels, show that the number of STEM workers in S&E occupations varies by geography across the United States. (See forthcoming Indicators 2022 report “Invention, Knowledge Transfer, and Innovation” for more details on geographic distribution of innovation activities.)
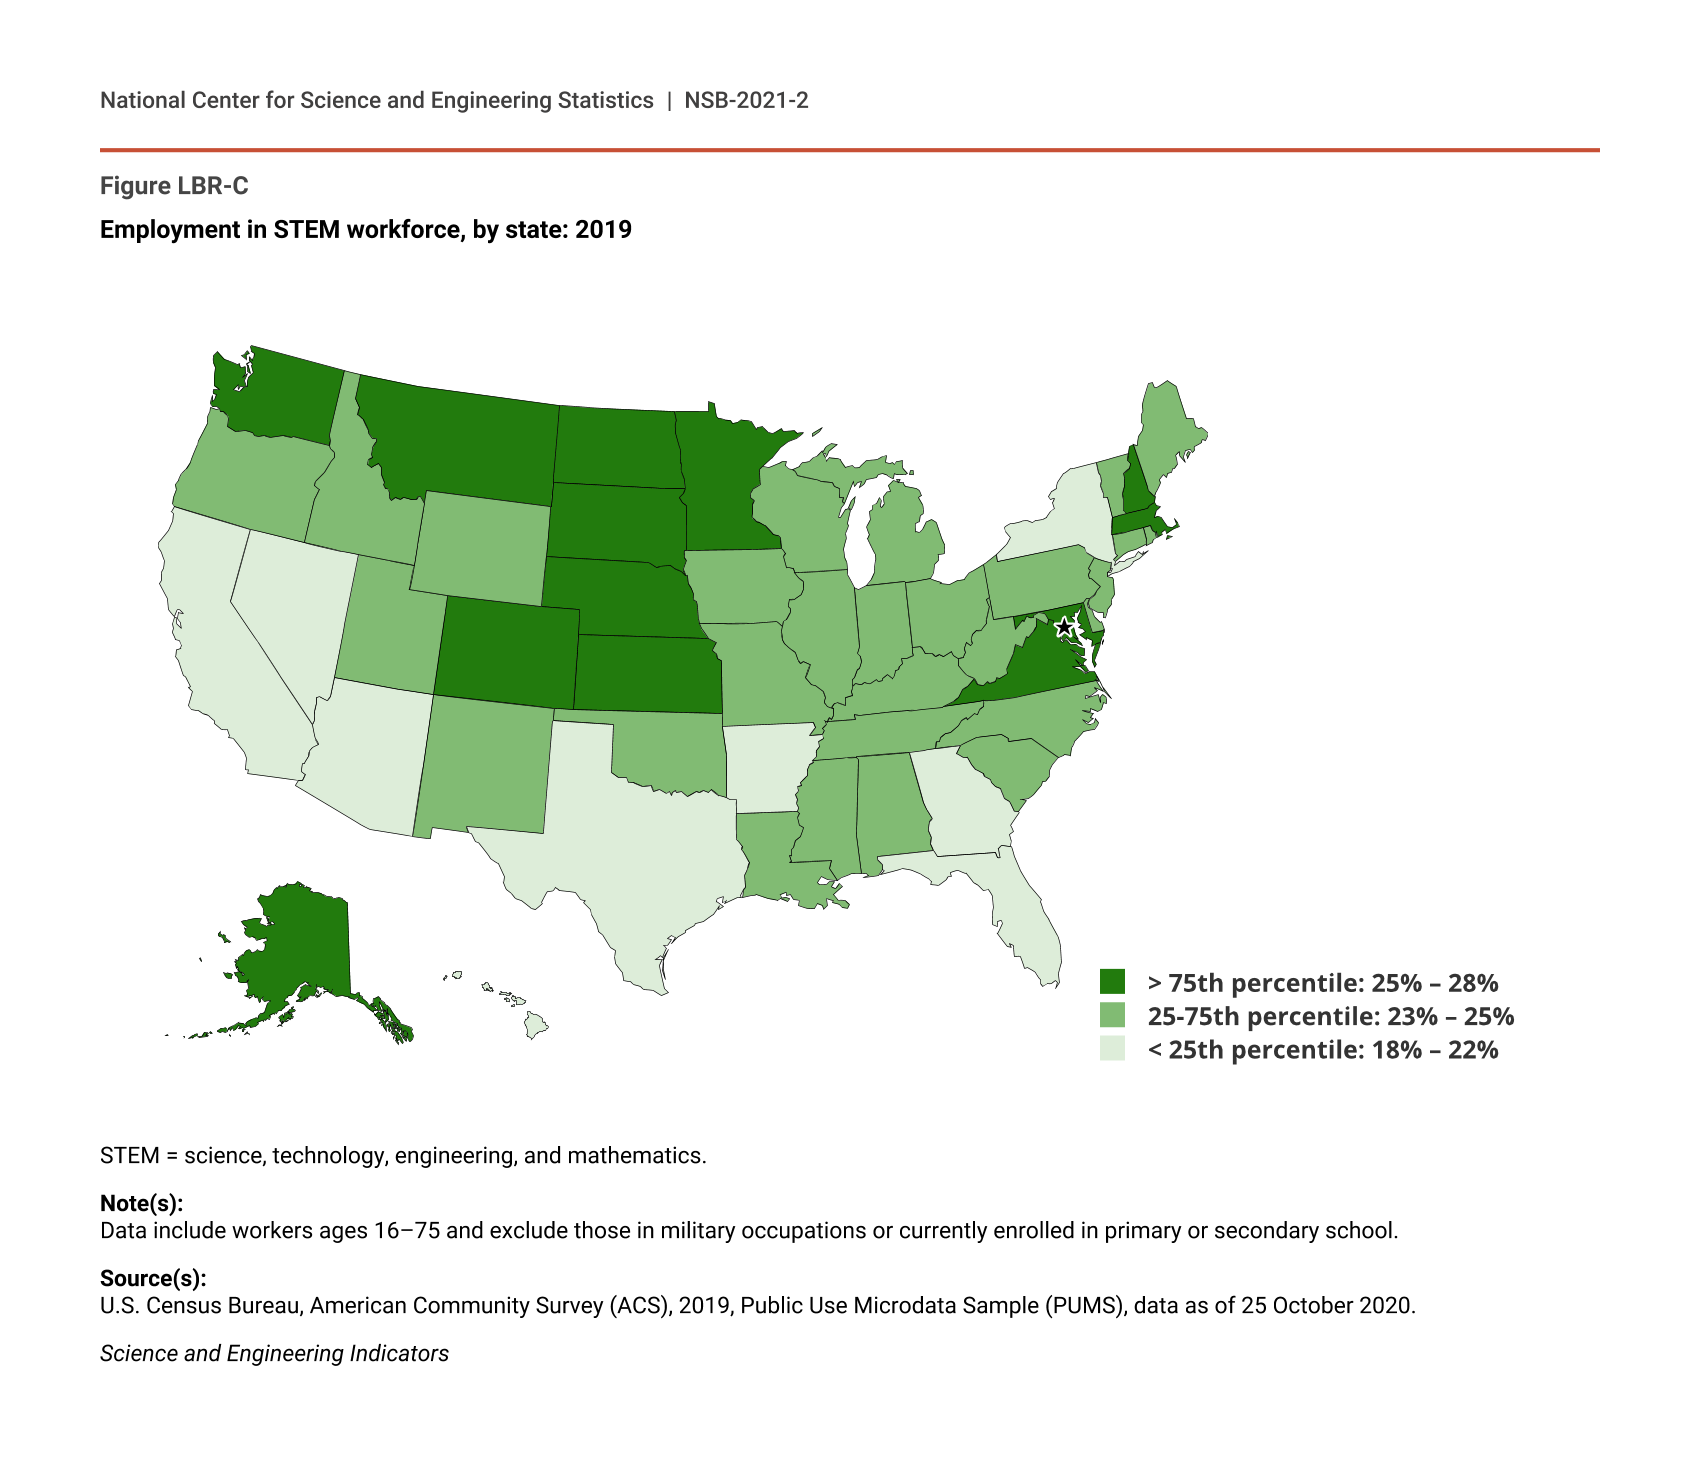
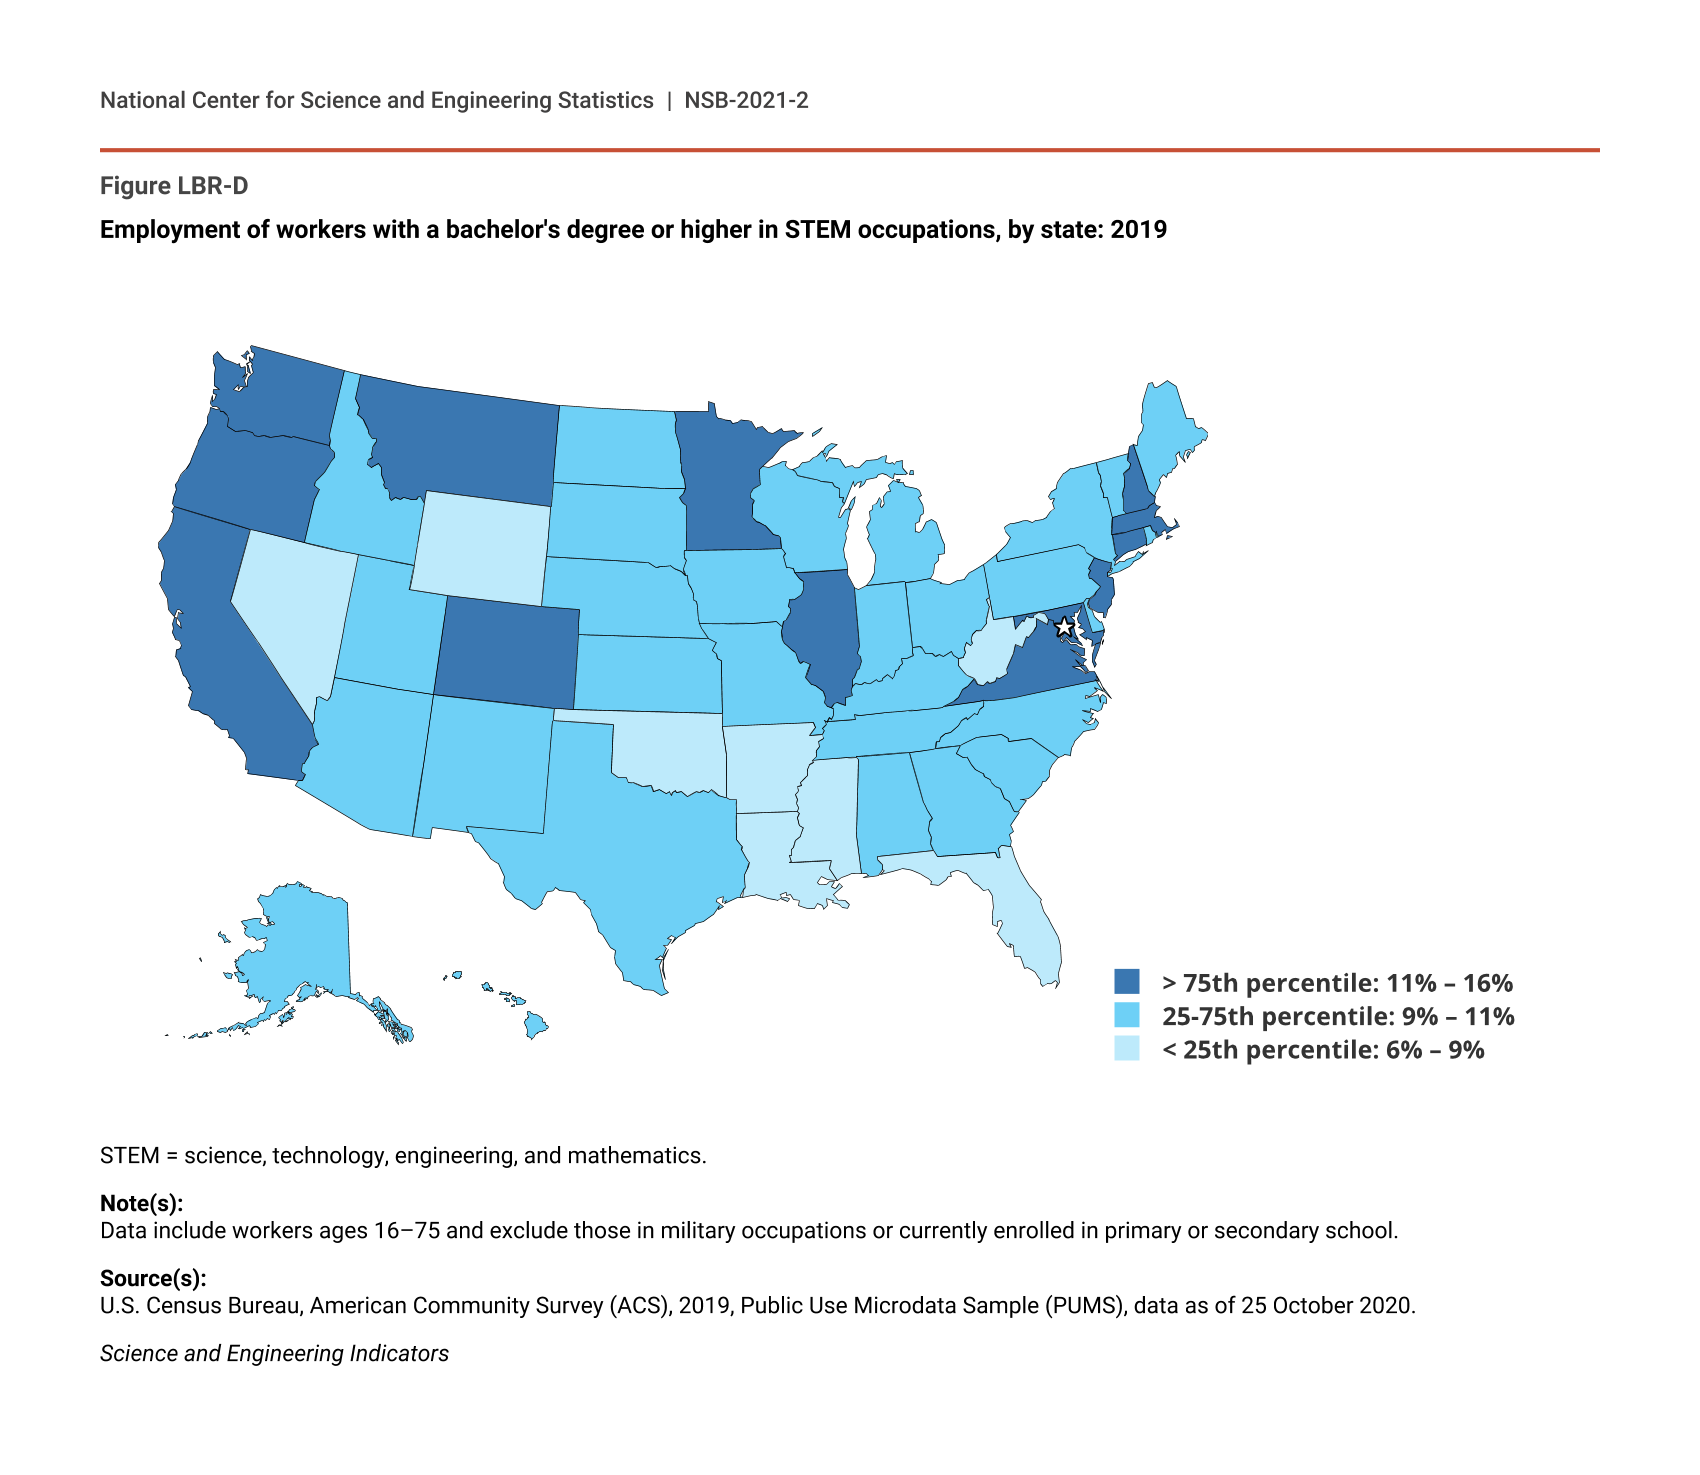
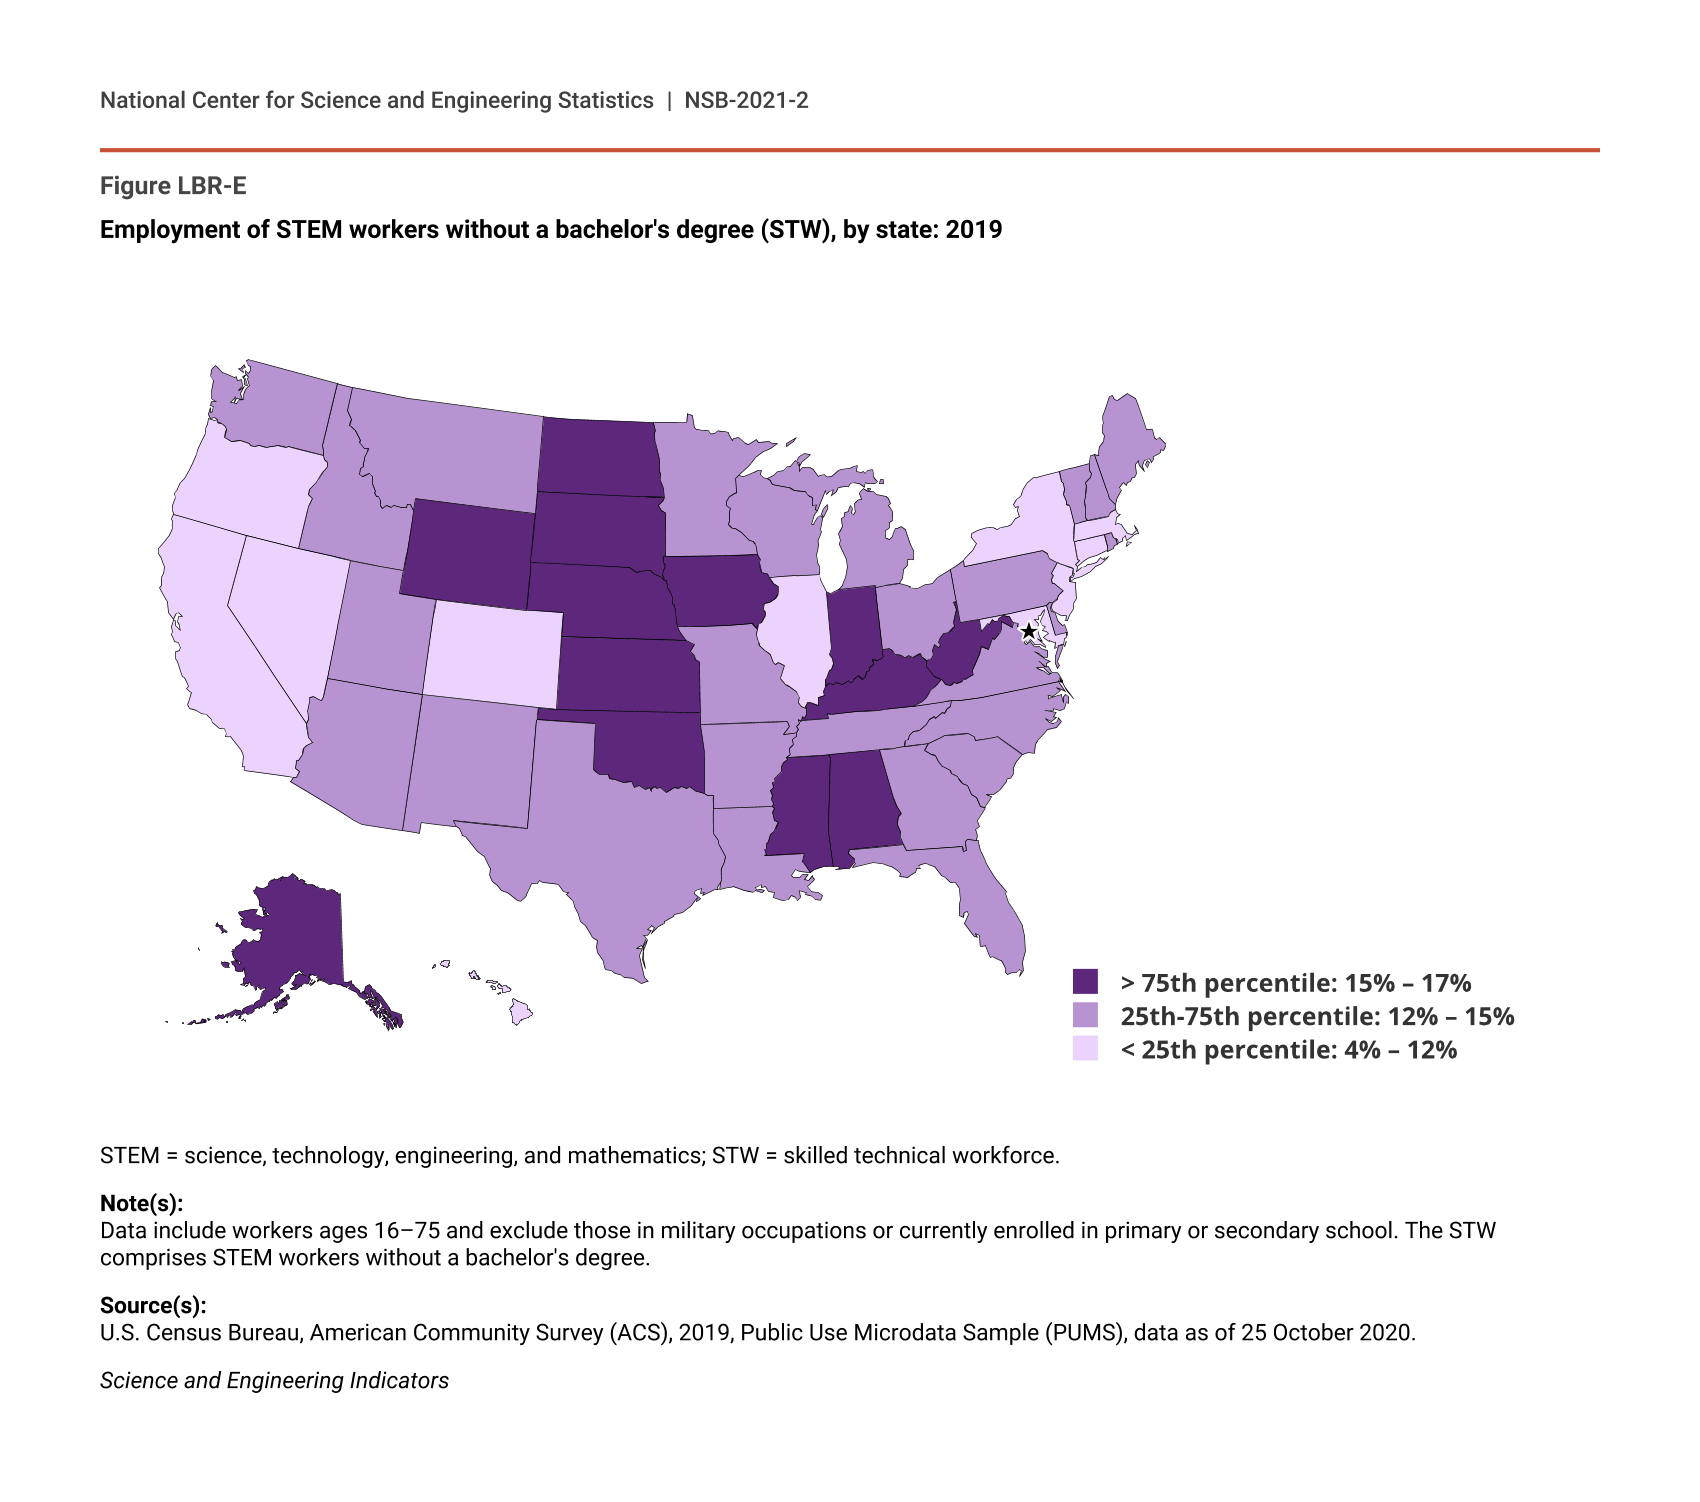
A small number of geographic areas account for a considerable proportion of STEM workers in S&E occupations. For example, 20 metropolitan areas account for 50% of workers in S&E occupations, whereas these same metropolitan areas account for 38% of employment in all occupations (Table SLBR-17). In addition, there are 20 metropolitan areas in which STEM workers employed in S&E occupations comprise 8%–23% of the total workforce compared to the national average of 5% (Table SLBR-18). (For a discussion of the percentage of STEM workers by state, see sidebar Where the U.S. STEM Workers Are: 2019.)
Industry Employment
Across all education levels, the BLS (2020c) OES data show that industries employ S&E workers at various rates. In 2019, five industry groups with the largest numbers of workers in S&E occupations—information; professional, scientific, and technical services; manufacturing; educational services; and government—accounted for nearly three-quarters of industry S&E employment, compared with one-third of total employment (Table SLBR-19). (See the forthcoming Indicators 2022 report “Production and Trade of Knowledge- and Technology-Intensive Industries” for more information about employment in these industries.)
The intensity of employment in S&E occupations, defined as the proportion of an industry’s total employment in S&E occupations, also varied by industry. Industries with low S&E employment intensity (i.e., below the national average of 5%) include large employers such as health care and social assistance, retail trade, and accommodation and food services. Those with high S&E employment intensity include information, utilities, and management of companies and enterprises, among others (Table SLBR-19).
Based on the ACS, STW employment in 2019 was concentrated in three broad industries: construction, manufacturing, and medical industries. In total, these three industry groups accounted for 57% of STW employment, compared with 29% of employment across all industries (Table SLBR-20). STW employment intensity, defined by an industry’s STW employment as a proportion of its total employment, was highest in construction (37%), military (35%), utilities (29%), mining (28%), and agriculture, forestry, fishing, and hunting (26%).
Academic Employment
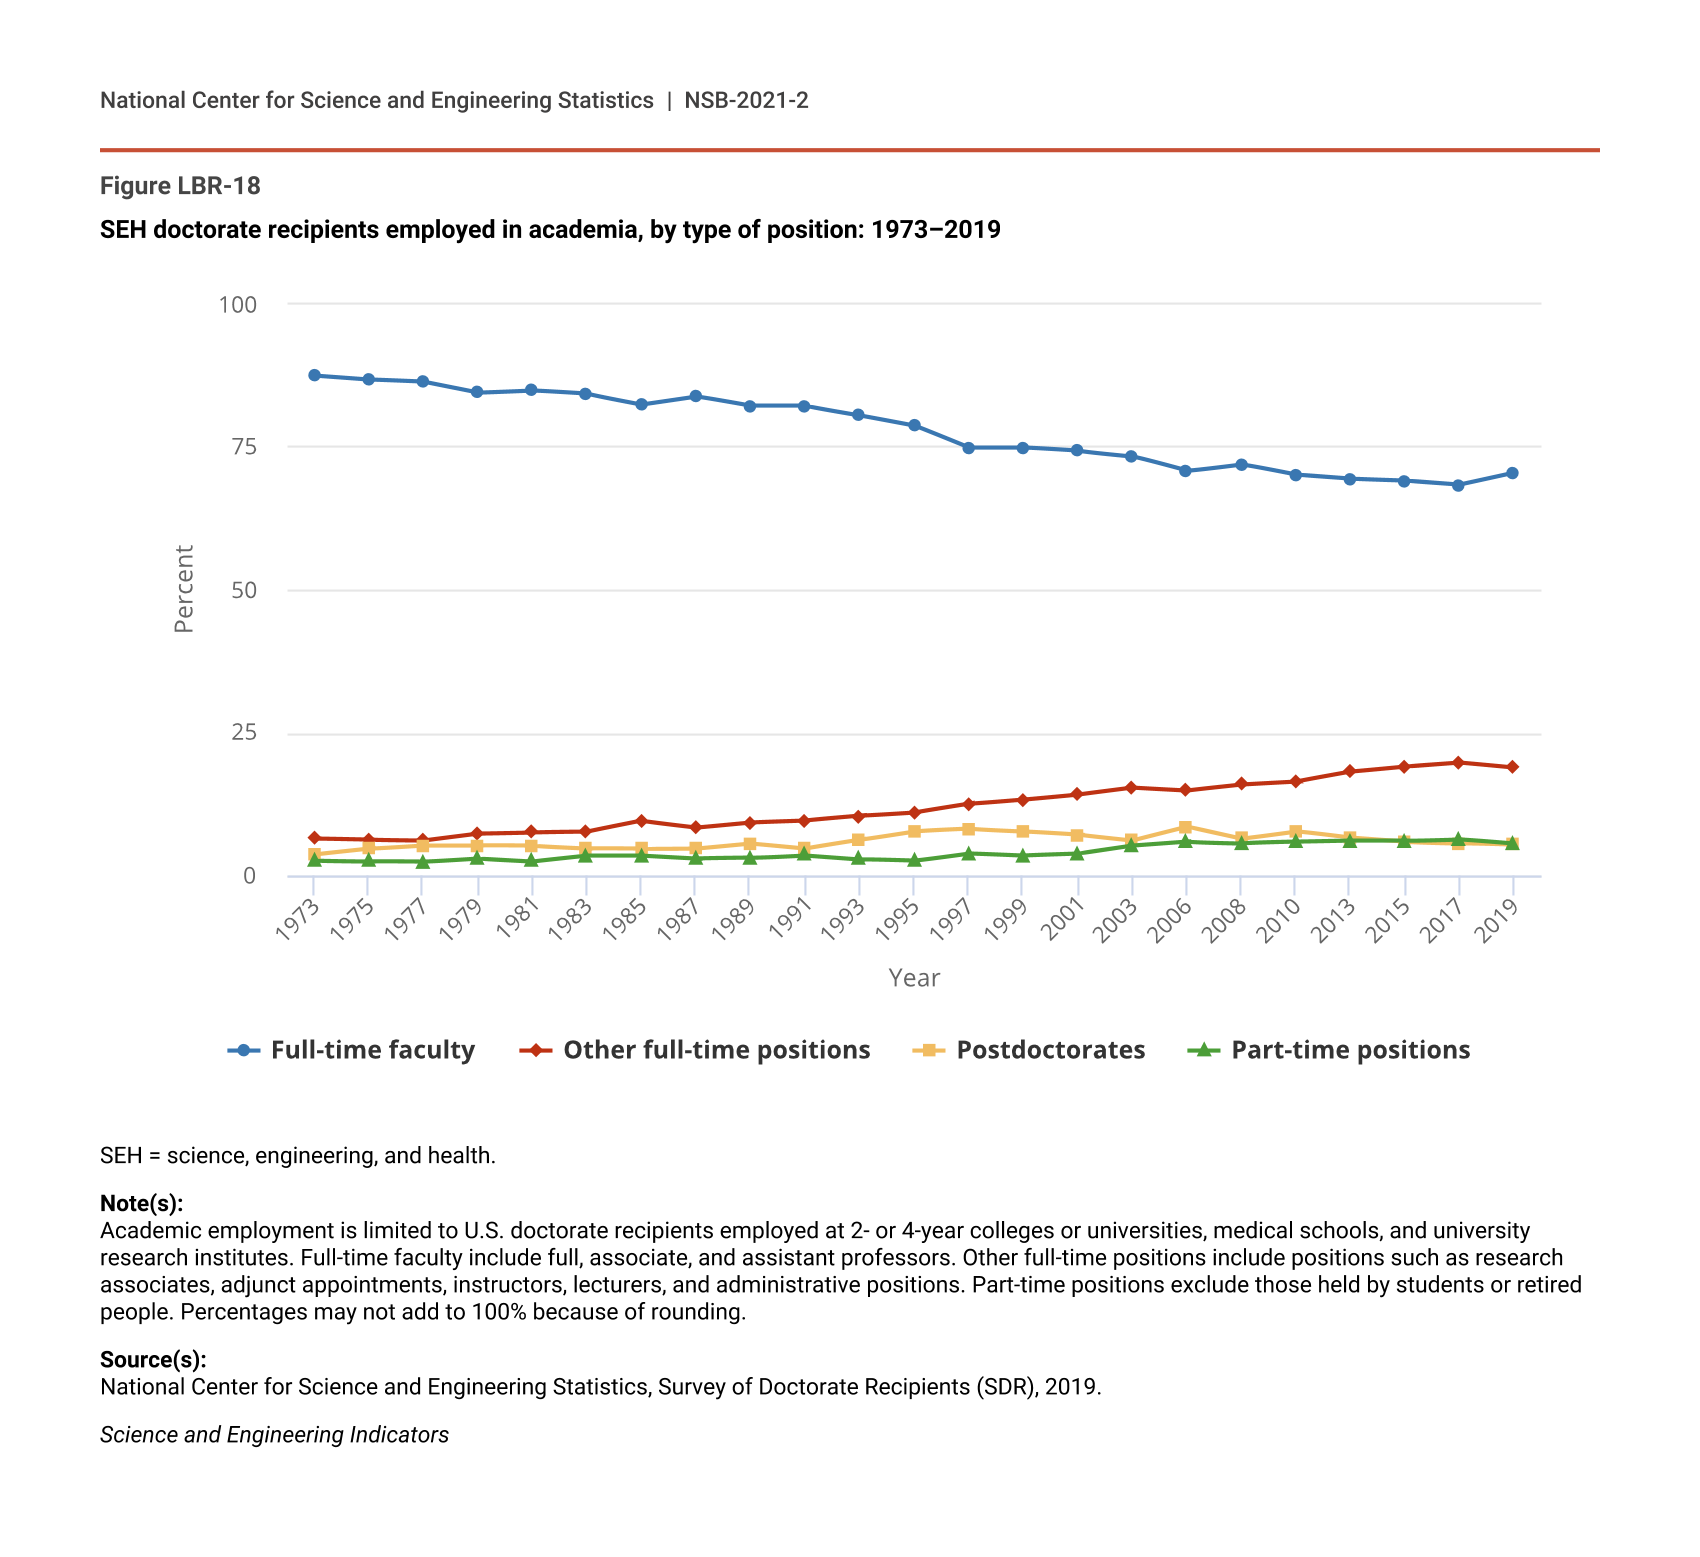
As noted earlier, the education sector is a large employer of SEH doctorate recipients, and the academic doctoral workforce plays an important role in training the next generation of scientists and engineers and advancing the nation’s basic research enterprise. The SDR shows that there were about 350,000 individuals in the academic doctoral workforce in 2019 who received their SEH doctorate in the United States. The majority of SEH doctorate holders are employed as full-time faculty (including tenured and tenure-track positions); however, as a proportion of all academically employed SEH doctorate holders, those employed as full-time faculty have been in steady decline for four decades, decreasing from about 90% in the early 1970s to 70% in 2019 (Figure LBR-18; Table SLBR-21).
SEH doctorate recipients employed in academia, by type of position: 1973–2019
| Year | Full-time faculty | Other full-time positions | Postdoctorates | Part-time positions |
|---|---|---|---|---|
| 1973 | 87.5 | 6.4 | 3.6 | 2.5 |
| 1975 | 86.8 | 6.2 | 4.6 | 2.4 |
| 1977 | 86.4 | 6.1 | 5.2 | 2.3 |
| 1979 | 84.5 | 7.3 | 5.2 | 2.9 |
| 1981 | 84.9 | 7.5 | 5.1 | 2.4 |
| 1983 | 84.3 | 7.6 | 4.7 | 3.4 |
| 1985 | 82.5 | 9.5 | 4.6 | 3.4 |
| 1987 | 83.9 | 8.4 | 4.7 | 2.9 |
| 1989 | 82.2 | 9.3 | 5.6 | 3.0 |
| 1991 | 82.2 | 9.6 | 4.7 | 3.5 |
| 1993 | 80.6 | 10.4 | 6.2 | 2.8 |
| 1995 | 78.8 | 11.0 | 7.7 | 2.5 |
| 1997 | 74.9 | 12.5 | 8.1 | 3.8 |
| 1999 | 74.9 | 13.3 | 7.7 | 3.4 |
| 2001 | 74.3 | 14.2 | 7.1 | 3.7 |
| 2003 | 73.4 | 15.4 | 6.1 | 5.1 |
| 2006 | 70.8 | 14.9 | 8.5 | 5.8 |
| 2008 | 72.0 | 15.9 | 6.4 | 5.6 |
| 2010 | 70.1 | 16.4 | 7.7 | 5.8 |
| 2013 | 69.4 | 18.1 | 6.5 | 6.0 |
| 2015 | 69.1 | 19.0 | 5.8 | 6.0 |
| 2017 | 68.4 | 19.7 | 5.6 | 6.3 |
| 2019 | 70.5 | 18.8 | 5.3 | 5.5 |
SEH = science, engineering, and health.
Note(s):
Academic employment is limited to U.S. doctorate recipients employed at 2- or 4-year colleges or universities, medical schools, and university research institutes. Full-time faculty include full, associate, and assistant professors. Other full-time positions include positions such as research associates, adjunct appointments, instructors, lecturers, and administrative positions. Part-time positions exclude those held by students or retired people. Percentages may not add to 100% because of rounding.
Source(s):
National Center for Science and Engineering Statistics, Survey of Doctorate Recipients (SDR), 2019.
Science and Engineering Indicators
The overall distribution of SEH doctorate holders among for-profit businesses and 4-year educational institutions has also shifted. In 1993, nearly half of SEH doctorate holders (45%) were employed by universities and 4-year colleges, while 31% were employed by private, for-profit businesses (SRS/NSF SDR 1993: Table 20). By 2019, these percentages were closer, with 39% in 4-year educational institutions and 35% in for-profit businesses (NCSES SDR 2019: Table 42).
The SEH doctoral academic workforce is engaged primarily in research and teaching. In 2019, nearly identical shares of U.S.-trained SEH doctorate holders working in academia reported that research or teaching was their primary work activity, or approximately 40% each (Table SLBR-22). Historically, this was not the case; the 1973 share of these doctorate holders engaged in teaching as a primary work activity (62%) far exceeded the share engaged primarily in research (24%). Federal research support holds a prominent role for academically employed SEH doctorate holders. In 2019, about 40% of them had received federal research support in the previous year (Table SLBR-23). (See the forthcoming Indicators 2022 report, “Academic Research and Development” for more details on federal support of R&D conducted in academic institutions.)
Research and Development Activities
R&D creates new types of goods and services that can contribute to economic and productivity growth and enhance living standards. This section uses the NSCG to examine the R&D activity of workers with a bachelor’s degree or higher in S&E or S&E-related occupations. R&D or design activity is defined as the proportion of workers who reported basic or applied research, development, or design as a primary or secondary work activity in their principal job (i.e., activities that rank first or second in total work hours from a list of 14 activities).
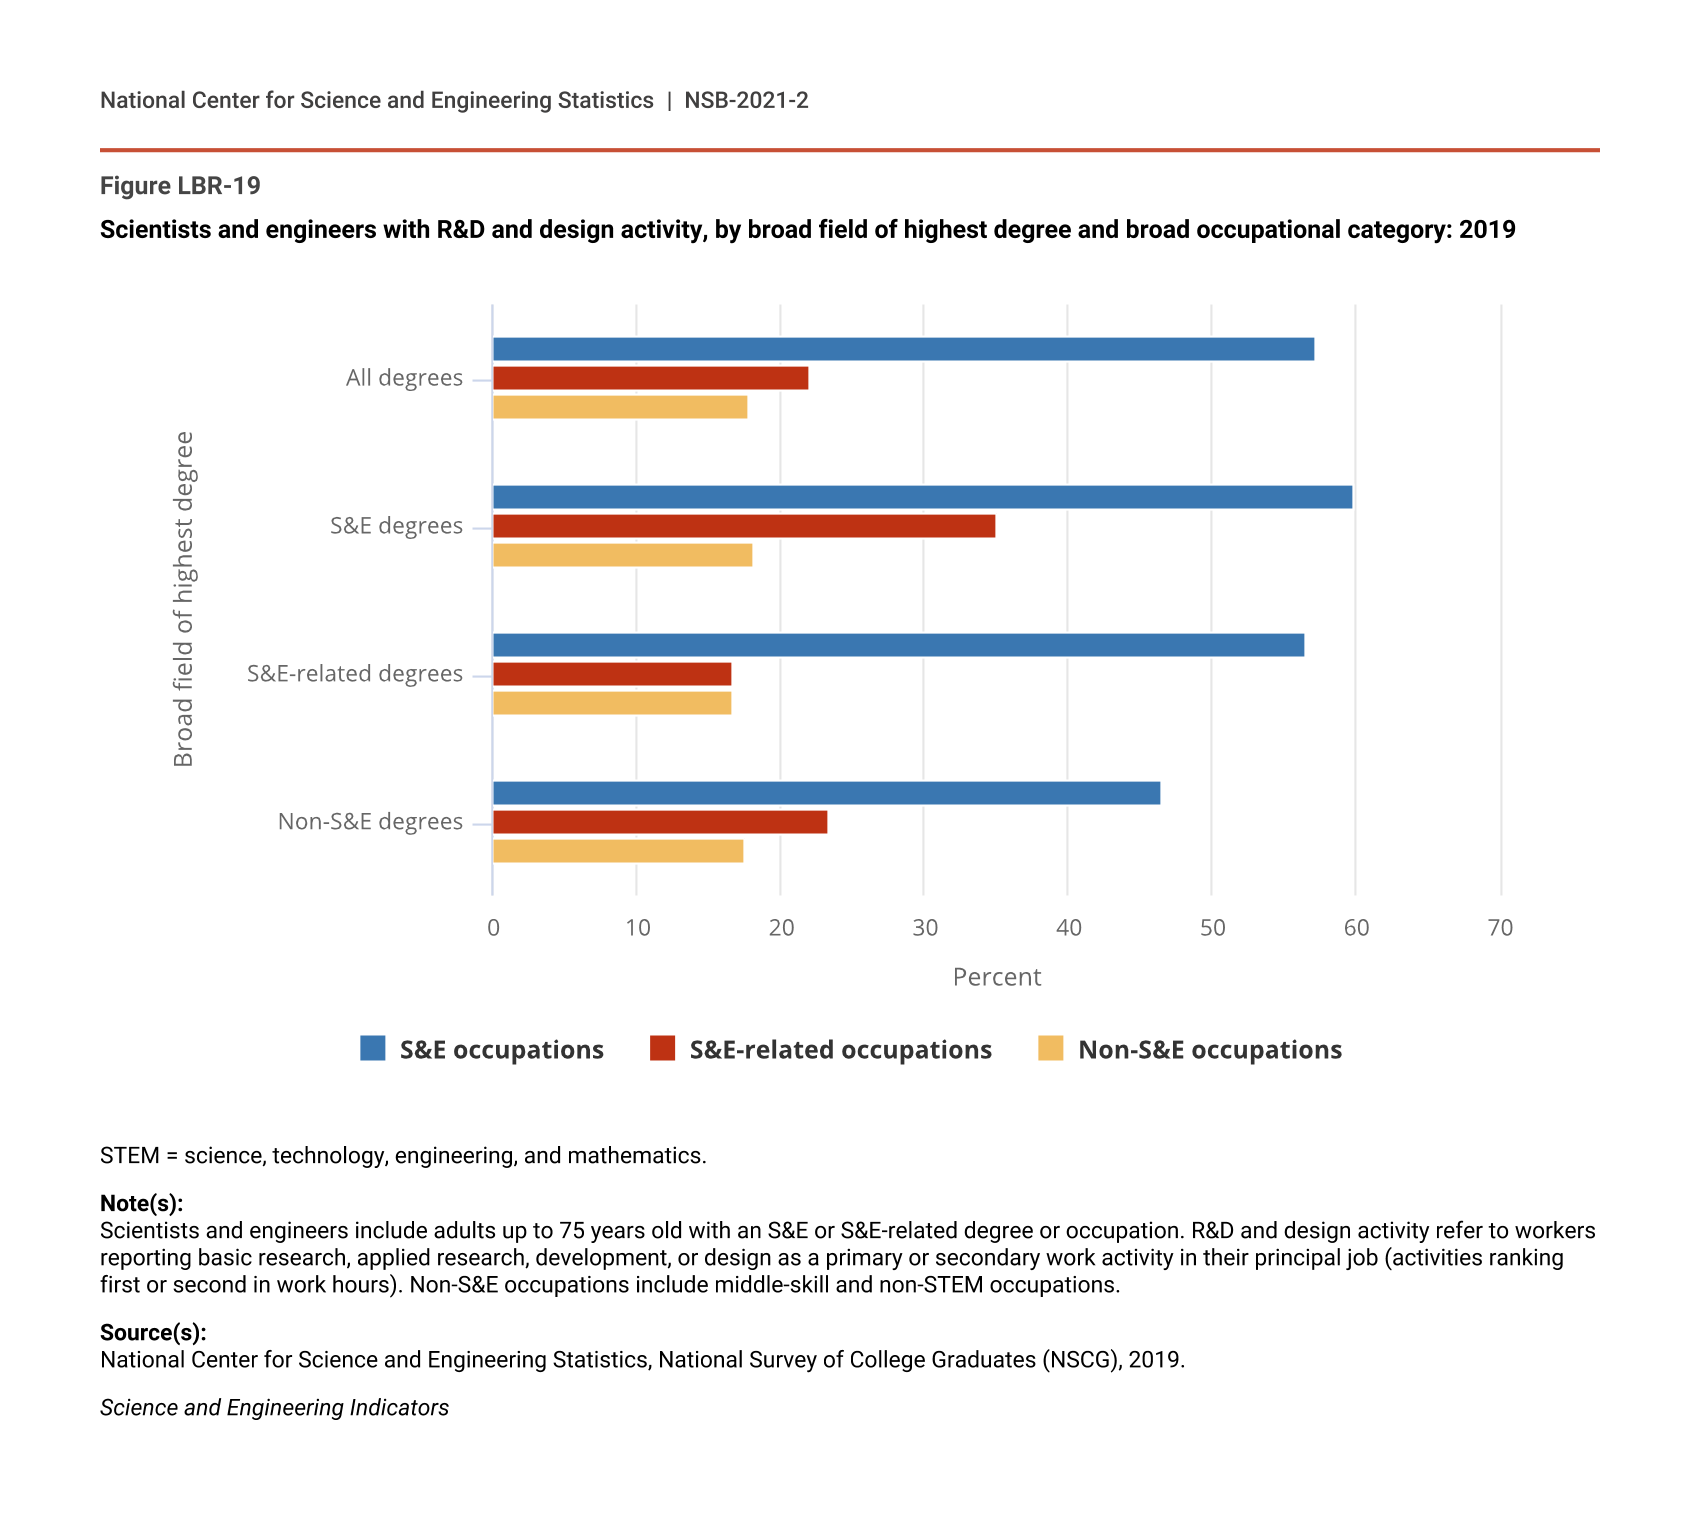
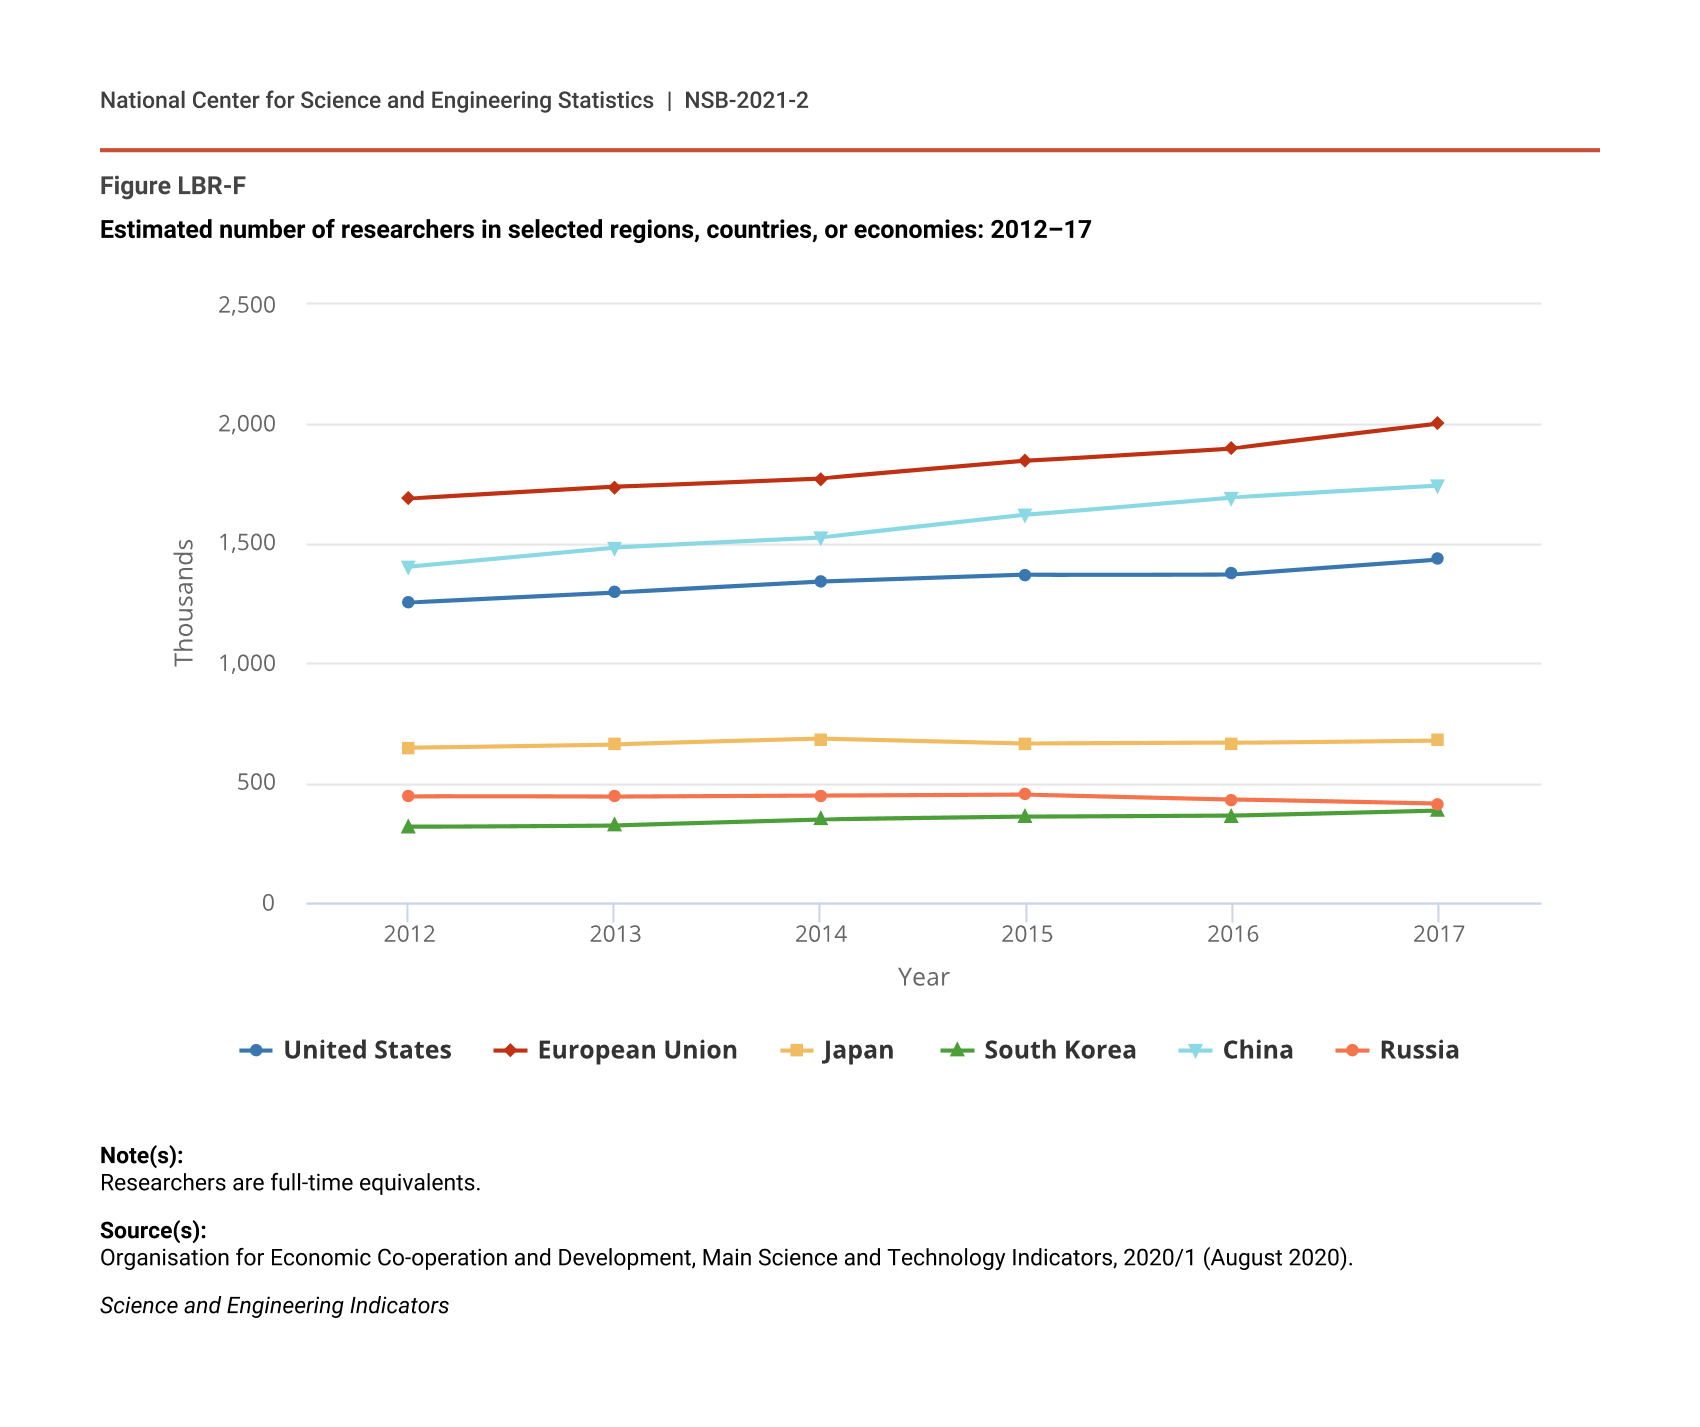
The majority of workers with a bachelor’s degree or higher in S&E occupations (57%) are engaged in R&D or design activity, as are considerable proportions of those in S&E-related (22%) and non-S&E occupations (18%) (Figure LBR-19), suggesting that R&D- and design-based work activities are prevalent in various types of jobs. With the exception of social scientists, doctorate holders in S&E occupations indicated higher rates of R&D or design activity than those with a bachelor’s or master’s degree as their highest degree (Table LBR-6). (See sidebar Global S&E Labor Force for a comparison of the researchers in selected countries.)
Scientists and engineers with R&D and design activity, by broad field of highest degree and broad occupational category: 2019
| Broad field of highest degree | S&E occupations | S&E-related occupations | Non-S&E occupations |
|---|---|---|---|
| All degrees | 57.2 | 22.1 | 17.8 |
| S&E degrees | 59.8 | 35.1 | 18.1 |
| S&E-related degrees | 56.5 | 16.6 | 16.7 |
| Non-S&E degrees | 46.5 | 23.3 | 17.6 |
STEM = science, technology, engineering, and mathematics.
Note(s):
Scientists and engineers include adults up to 75 years old with an S&E or S&E-related degree or occupation. R&D and design activity refer to workers reporting basic research, applied research, development, or design as a primary or secondary work activity in their principal job (activities ranking first or second in work hours). Non-S&E occupations include middle-skill and non-STEM occupations.
Source(s):
National Center for Science and Engineering Statistics, National Survey of College Graduates (NSCG), 2019.
Science and Engineering Indicators
R&D and design activity of scientists and engineers employed in S&E occupations, by broad occupational category and highest degree level: 2019
Note(s):
Scientists and engineers include adults up to 75 years old with an S&E or S&E-related degree or occupation. R&D and design activity refer to the share of workers reporting basic research, applied research, development, or design as a primary or secondary work activity in their principal job (activities ranking first or second in work hours). All degree levels include professional degrees not broken out separately.
Source(s):
National Center for Science and Engineering Statistics, National Survey of College Graduates (NSCG), 2019.
Science and Engineering Indicators