| Fiscal year | Constant 2017 dollars | Current dollars |
|---|---|---|
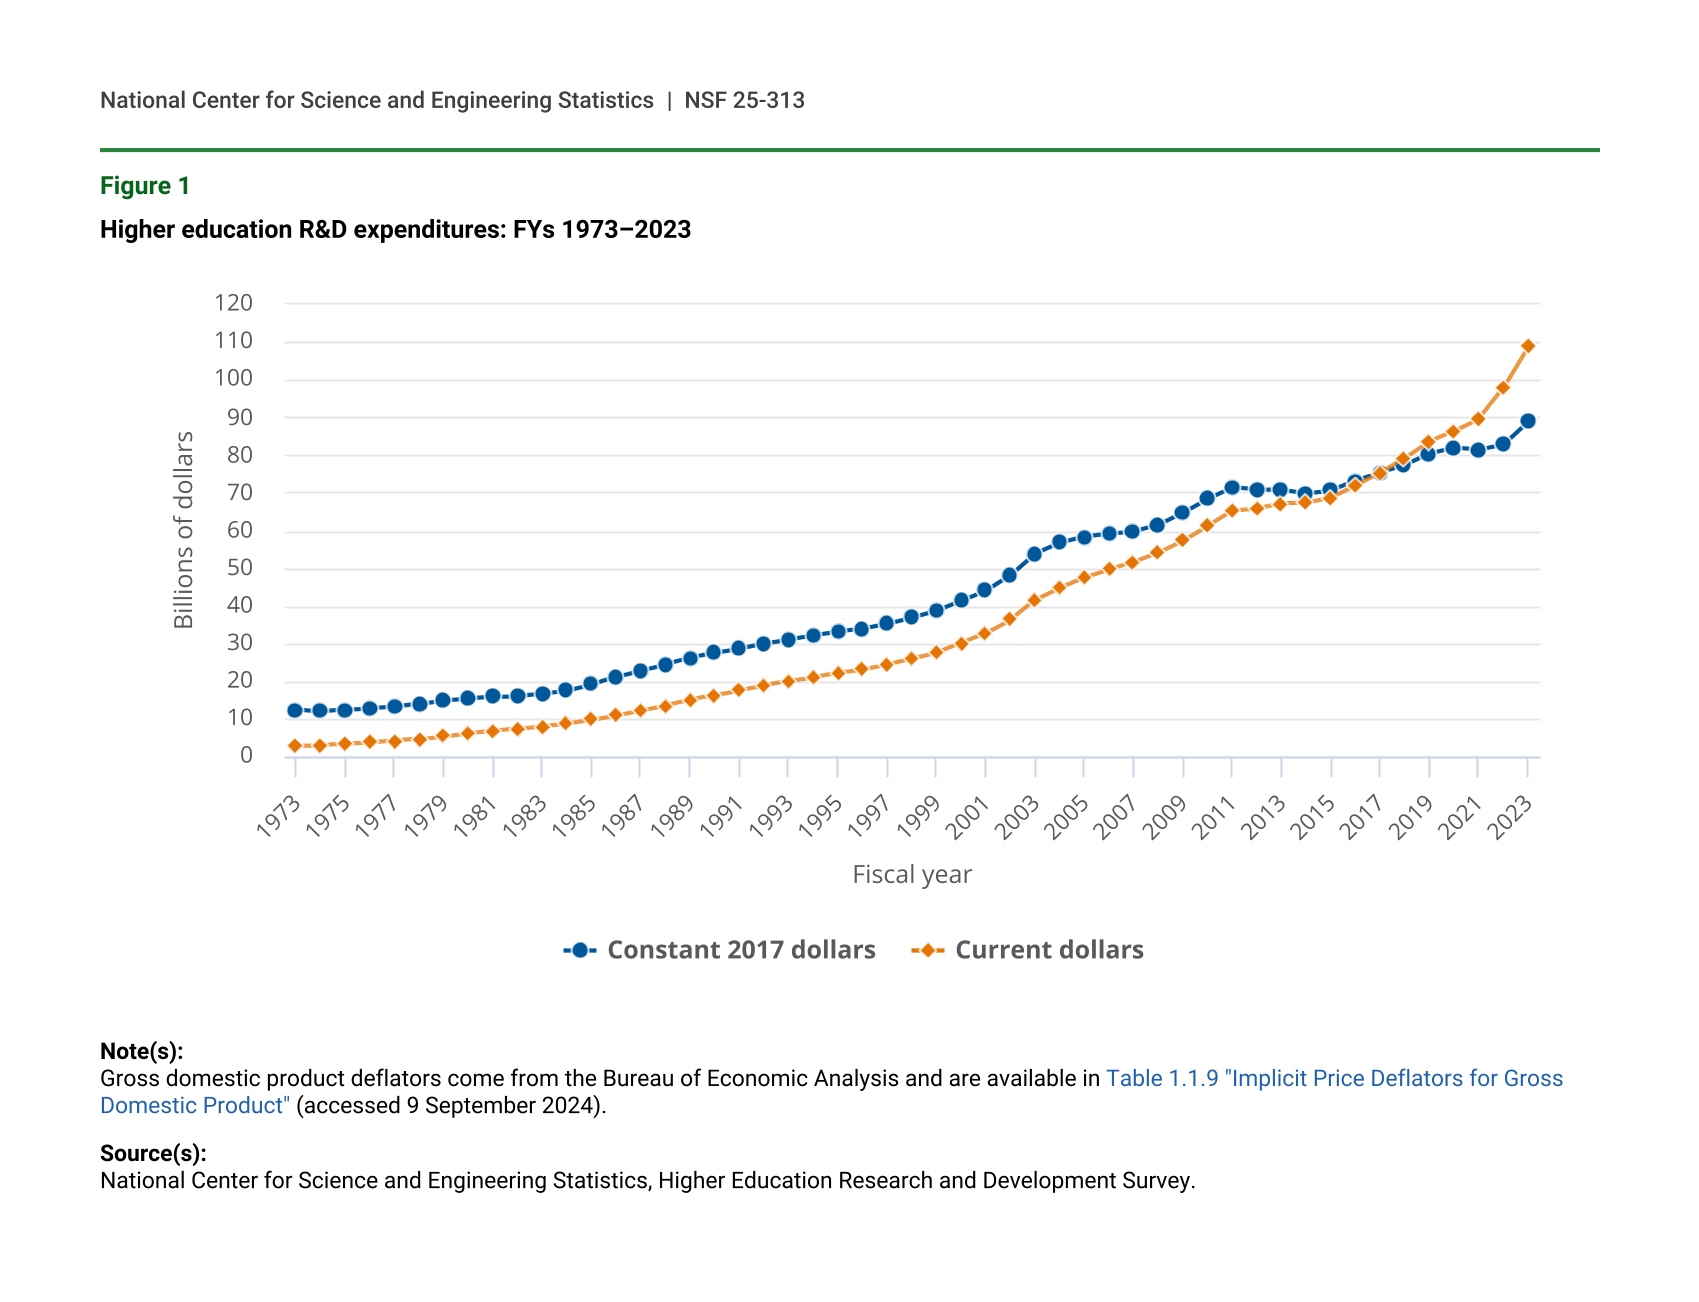
| 1973 | 12.4 | 2.9 |
| 1974 | 11.9 | 3.0 |
| 1975 | 12.3 | 3.4 |
| 1976 | 12.7 | 3.7 |
| 1977 | 13.1 | 4.1 |
| 1978 | 13.9 | 4.6 |
| 1979 | 14.9 | 5.4 |
| 1980 | 15.4 | 6.1 |
| 1981 | 15.9 | 6.8 |
| 1982 | 16.0 | 7.3 |
| 1983 | 16.6 | 7.9 |
| 1984 | 17.5 | 8.6 |
| 1985 | 19.1 | 9.7 |
| 1986 | 21.1 | 10.9 |
| 1987 | 22.9 | 12.2 |
| 1988 | 24.5 | 13.5 |
| 1989 | 26.2 | 15.0 |
| 1990 | 27.5 | 16.3 |
| 1991 | 28.7 | 17.6 |
| 1992 | 30.0 | 18.8 |
| 1993 | 31.1 | 20.0 |
| 1994 | 32.1 | 21.0 |
| 1995 | 33.1 | 22.2 |
| 1996 | 33.8 | 23.1 |
| 1997 | 35.2 | 24.4 |
| 1998 | 36.9 | 25.9 |
| 1999 | 38.7 | 27.5 |
| 2000 | 41.4 | 30.1 |
| 2001 | 44.1 | 32.8 |
| 2002 | 48.2 | 36.4 |
| 2003 | 53.9 | 41.5 |
| 2004 | 56.7 | 44.8 |
| 2005 | 58.3 | 47.5 |
| 2006 | 59.1 | 49.6 |
| 2007 | 59.7 | 51.6 |
| 2008 | 61.5 | 54.1 |
| 2009 | 64.7 | 57.3 |
| 2010 | 68.4 | 61.3 |
| 2011 | 71.4 | 65.3 |
| 2012 | 70.7 | 65.9 |
| 2013 | 70.8 | 67.1 |
| 2014 | 69.8 | 67.3 |
| 2015 | 70.6 | 68.7 |
| 2016 | 73.2 | 71.9 |
| 2017 | 75.3 | 75.3 |
| 2018 | 77.4 | 79.2 |
| 2019 | 80.4 | 83.6 |
| 2020 | 82.0 | 86.4 |
| 2021 | 81.5 | 89.8 |
| 2022 | 82.9 | 97.8 |
| 2023 | 89.0 | 108.8 |
Gross domestic product deflators come from the Bureau of Economic Analysis and are available in Table 1.1.9 "Implicit Price Deflators for Gross Domestic Product" (accessed 9 September 2024).
National Center for Science and Engineering Statistics, Higher Education Research and Development Survey.