 An official website of the United States government
 Information Sources and Involvement
Where and to what extent have Americans encountered information about science? Aside from encounters with news stories about S&T, are they involved in any informal activities (i.e., activities outside of a formal school setting) that could affect their understanding or perceptions of science? Recent data offer insights on both questions. (Related thematic reports explore Americans’ formal STEM training through educational institutions; see Indicators 2022 report “Elementary and Secondary STEM Education” and Indicators 2022 report “Higher Education in Science and Engineering.”)
Sources of Information about Science
American adults tend to learn about science from general news sources rather than from specialized information sources dedicated to science. Funk, Gottfried, and Mitchell (2017) investigated where Americans were encountering information about science (and allowed respondents to note multiple sources). They found that 54% of Americans who were surveyed had reported regularly getting science information from general news outlets. Another 25% reported getting their information from print or online science magazines, and 12% said they got information from S&T centers or museums. This breakdown is notable because the content typically covered by general news outlets differs substantively from content offered by specialized science information venues. Specific details about study limitations that appear in an original, peer-reviewed article may not be reported in news coverage or highlighted in social media posts. Few local news outlets have staff who specialize in covering science, and even large news outlets often rely on press releases about new developments as sources for science news rather than offering continuing, thematic discussion of how scientific research occurs over time or covering research topics without highly publicized research results (Schafer 2017). Moreover, in the contemporary American information environment, items reported in general news outlets compete for audience attention with numerous other stories not directly related to science (Lupia 2013).
Especially in the past decade, Americans also have cited social media platforms as a source of information. In a 2020 report, for example, the Pew Research Center estimated that 18% of adults get most of their news about politics from social media using survey data collected in October and November 2019 (Mitchell et al. 2020). Social media platforms offer users a mix of user comments and shared links to online news sources external to the platform. Whether Americans who rely on social media as a primary information source for topics such as politics are regularly engaging with science journalism or science-related content online is currently unclear. Those social media users who primarily get political news from social media have tended not to closely follow recent national and international science news on the COVID-19 pandemic; only 23% of those who most commonly get information on politics from social media in a June 2020 Pew Research Center study reported following COVID-19 news “very closely” (Mitchell et al. 2020).
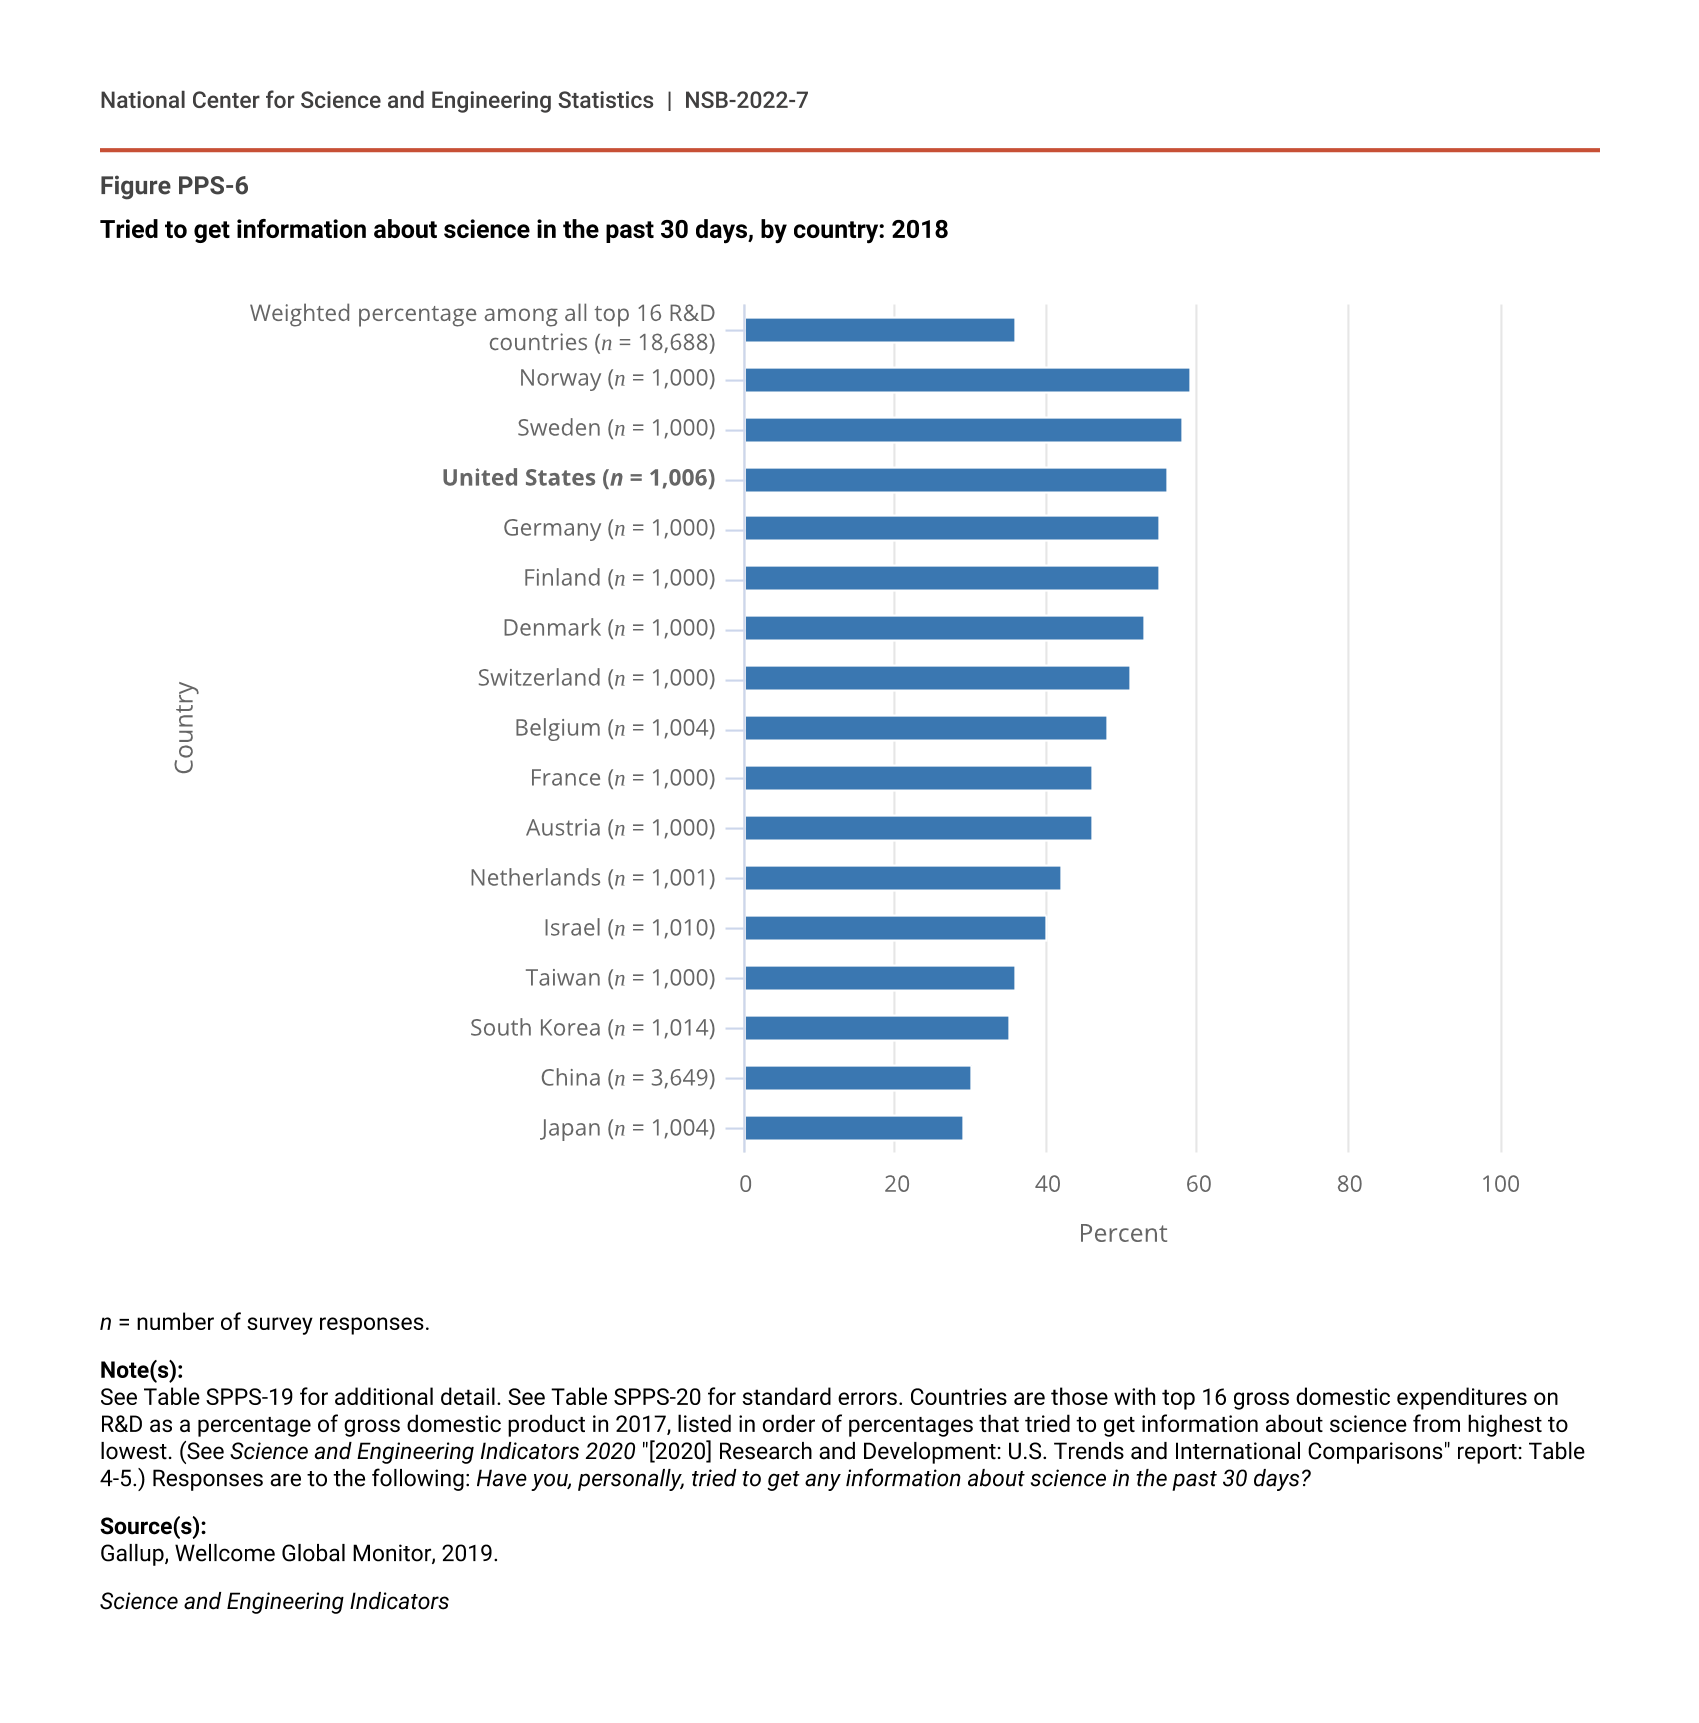
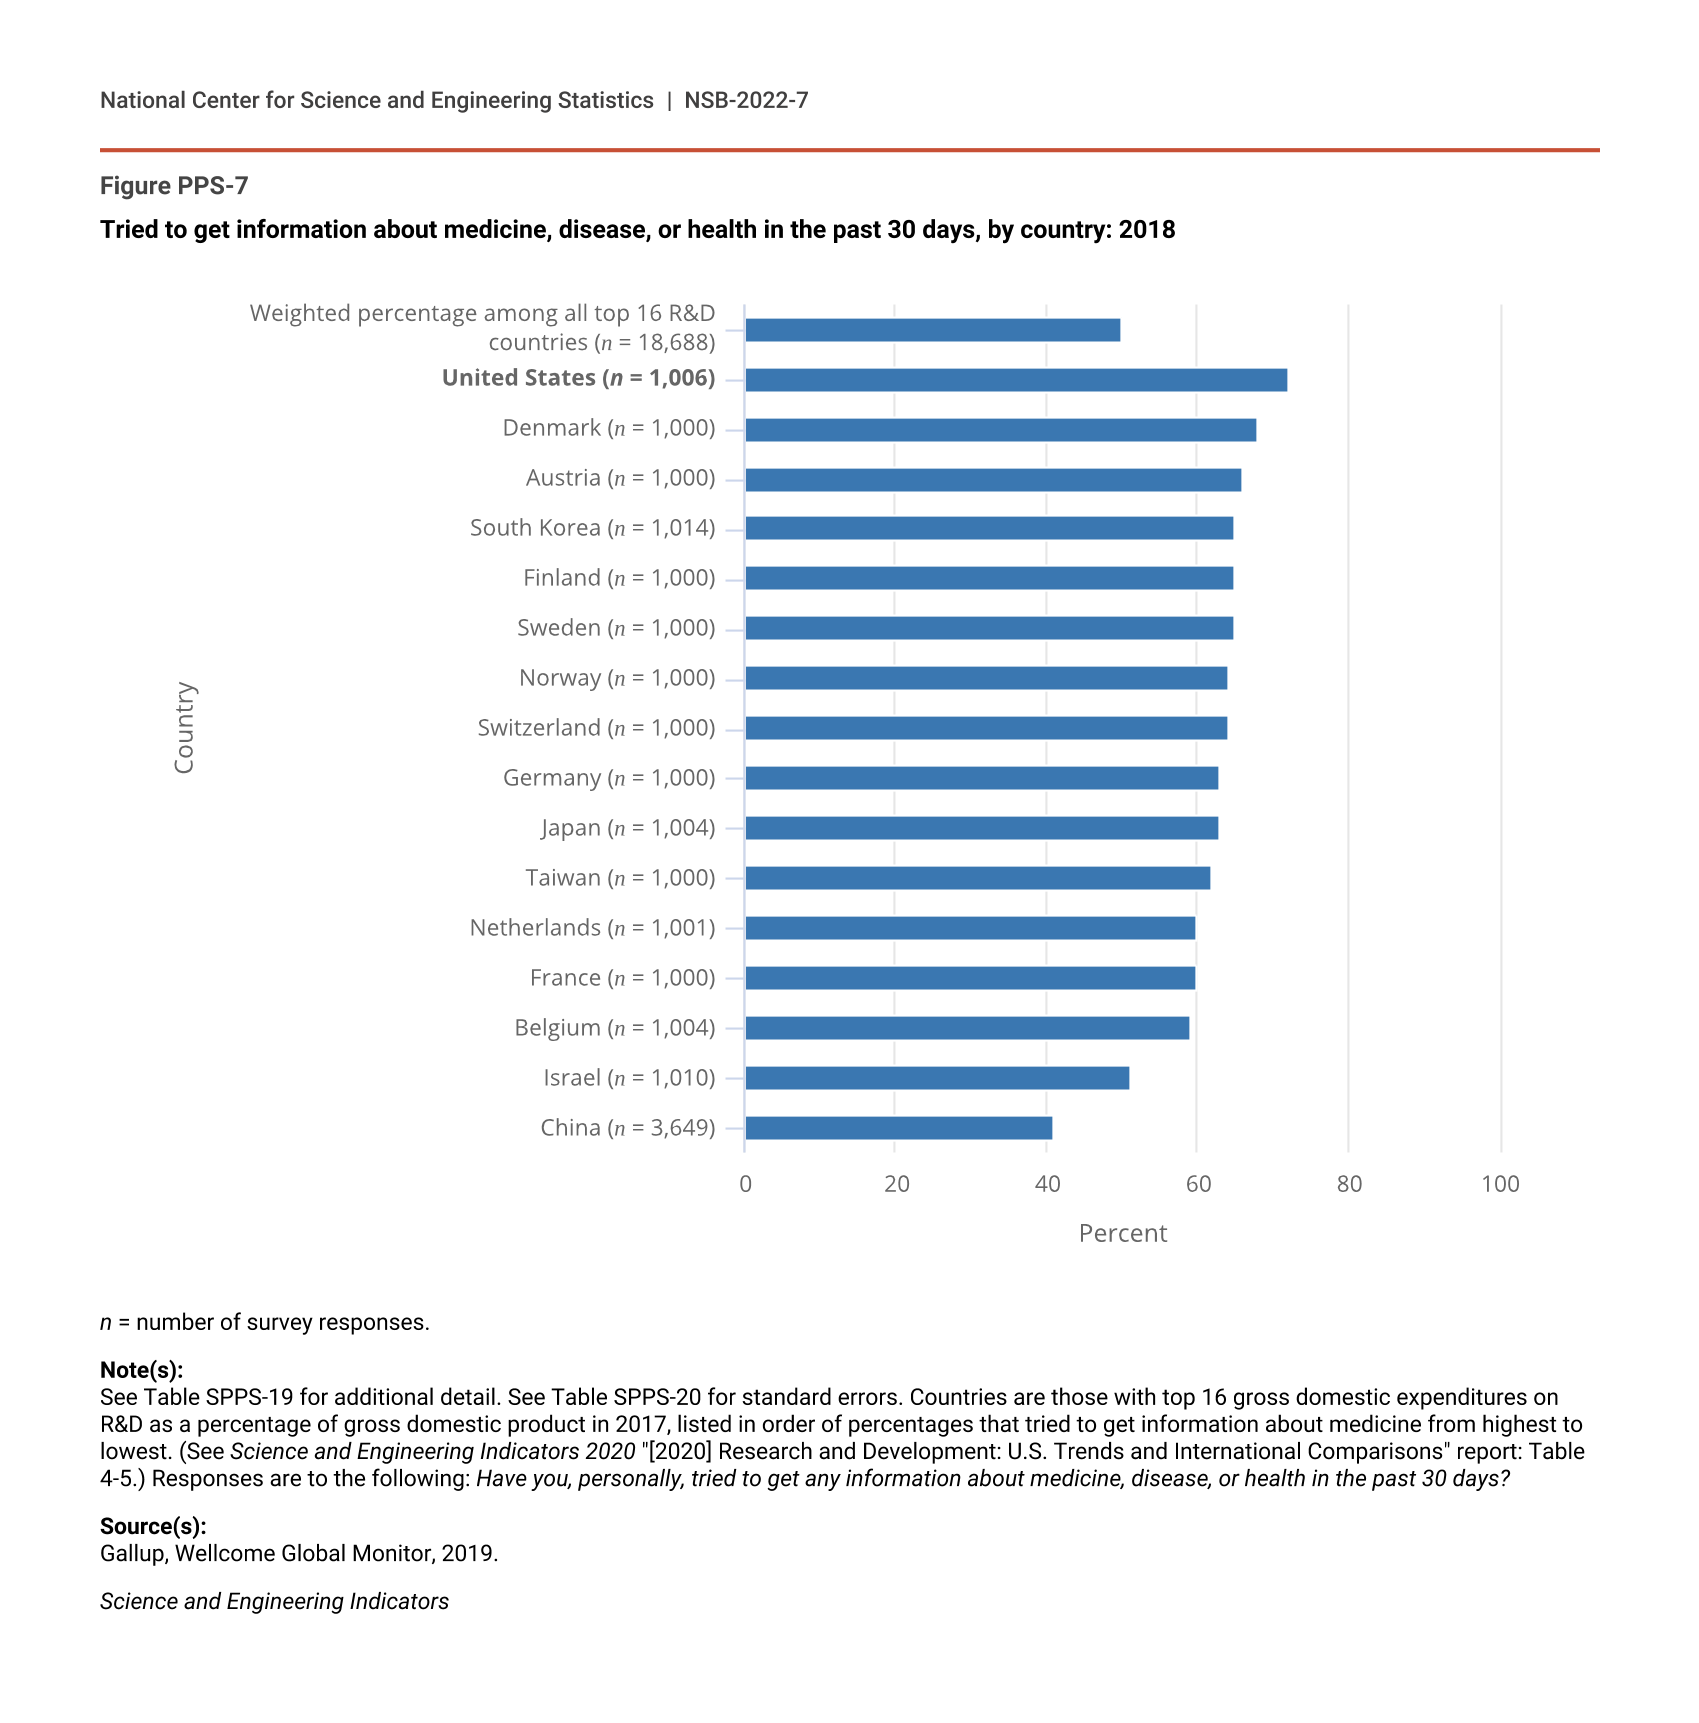
Data indicate that most Americans do look for S&T-related information—at least occasionally—on their own. The 2018 Wellcome Global Monitor survey highlighted the extent to which people around the world had attempted to get information about science in the 30 days before the survey. The majority of Americans surveyed (56%) reported having sought such information (Figure PPS-6)—a significantly higher percentage than most of their counterparts in 15 other countries that, like the United States, make substantial investments in S&T R&D. For example, only 29% of Japanese adults who responded to the Wellcome Global Monitor survey had attempted to get information about science in the previous 30 days. Americans also had sought information about medicine and disease at higher rates than citizens of any other nation in the survey, with 72% having looked for information on medicine, disease, or health in the previous month; the average for citizens seeking similar content in all nations was 50% (Figure PPS-7).
Tried to get information about science in the past 30 days, by country: 2018
| Country | Tried to get information about science in the past 30 days |
|---|---|
| Weighted percentage among all top 16 R&D countries (n = 18,688) | 36 |
| Norway (n = 1,000) | 59 |
| Sweden (n = 1,000) | 58 |
| United States (n = 1,006) | 56 |
| Germany (n = 1,000) | 55 |
| Finland (n = 1,000) | 55 |
| Denmark (n = 1,000) | 53 |
| Switzerland (n = 1,000) | 51 |
| Belgium (n = 1,004) | 48 |
| France (n = 1,000) | 46 |
| Austria (n = 1,000) | 46 |
| Netherlands (n = 1,001) | 42 |
| Israel (n = 1,010) | 40 |
| Taiwan (n = 1,000) | 36 |
| South Korea (n = 1,014) | 35 |
| China (n = 3,649) | 30 |
| Japan (n = 1,004) | 29 |
n = number of survey responses.
Note(s):
See Table SPPS-19 for additional detail. See Table SPPS-20 for standard errors. Countries are those with top 16 gross domestic expenditures on R&D as a percentage of gross domestic product in 2017, listed in order of percentages that tried to get information about science from highest to lowest. (See Science and Engineering Indicators 2020 "Research and Development: U.S. Trends and International Comparisons" report: Table 4-5.) Responses are to the following: Have you, personally, tried to get any information about science in the past 30 days?
Source(s):
Gallup, Wellcome Global Monitor, 2019.
Science and Engineering Indicators
Tried to get information about medicine, disease, or health in the past 30 days, by country: 2018
| Country | Tried to get information about medicine, disease, or health in the past 30 days |
|---|---|
| Weighted percentage among all top 16 R&D countries (n = 18,688) | 50 |
| United States (n = 1,006) | 72 |
| Denmark (n = 1,000) | 68 |
| Austria (n = 1,000) | 66 |
| South Korea (n = 1,014) | 65 |
| Finland (n = 1,000) | 65 |
| Sweden (n = 1,000) | 65 |
| Norway (n = 1,000) | 64 |
| Switzerland (n = 1,000) | 64 |
| Germany (n = 1,000) | 63 |
| Japan (n = 1,004) | 63 |
| Taiwan (n = 1,000) | 62 |
| Netherlands (n = 1,001) | 60 |
| France (n = 1,000) | 60 |
| Belgium (n = 1,004) | 59 |
| Israel (n = 1,010) | 51 |
| China (n = 3,649) | 41 |
n = number of survey responses.
Note(s):
See Table SPPS-19 for additional detail. See Table SPPS-20 for standard errors. Countries are those with top 16 gross domestic expenditures on R&D as a percentage of gross domestic product in 2017, listed in order of percentages that tried to get information about medicine from highest to lowest. (See Science and Engineering Indicators 2020 "Research and Development: U.S. Trends and International Comparisons" report: Table 4-5.) Responses are to the following: Have you, personally, tried to get any information about medicine, disease, or health in the past 30 days?
Source(s):
Gallup, Wellcome Global Monitor, 2019.
Science and Engineering Indicators
Despite survey results showing a majority of Americans seeking general scientific information on occasion, a minority of Americans have self-reported high levels of interest in various scientific topics. The 2020 Indicators report (NSB Indicators 2020: Science and Technology: Public Attitudes, Knowledge, and Interest) noted that 41% of 2018 GSS respondents said that they were “very interested” in new scientific discoveries. Disjuncture between the everyday concerns of many Americans and framing of science news content could help explain that pattern of Americans’ interest; one recent content analysis of science news stories in the U.S. found most stories reported a specific finding but did not discuss the process of scientific inquiry to address societal concerns, including topics such as past hypothesis test failures, disagreements by scientists, or the implications of specific findings for future work (Ophir and Jamieson 2021). Authors of the 2009 National Research Council (NRC) report on science learning in informal environments noted that the tremendous potential of informal science activities to allow citizens to reflect on science as a “way of knowing” will be fully realized only when such content places science in context and reflects the “everyday language, ideas, concerns, worldviews, and histories” of various potential audiences (NRC 2009:4–7).
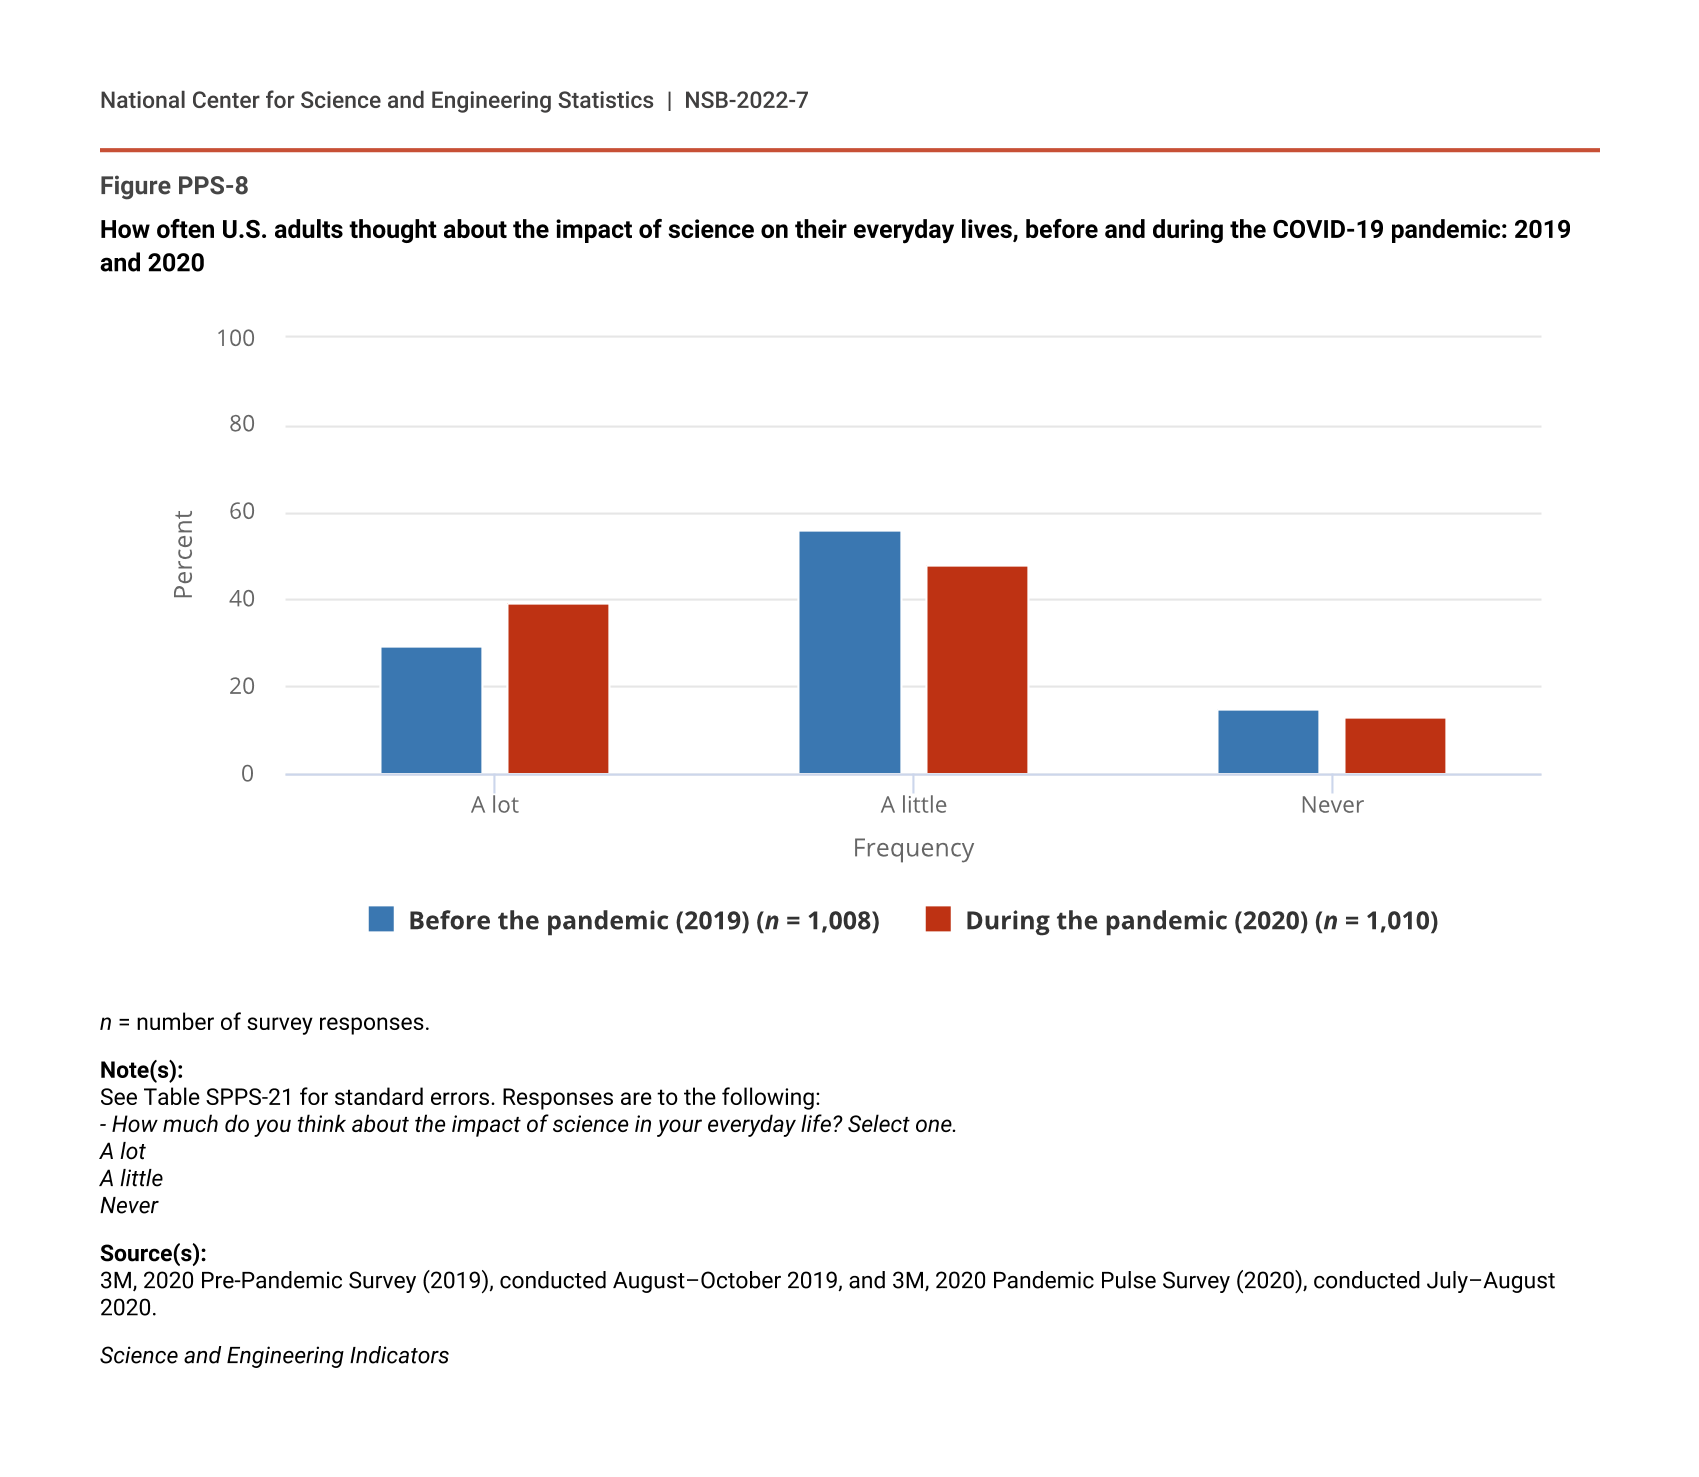
Factors such as media attention on COVID-19-related scientific research and personal experiences during the pandemic may have recently elevated the relevance of science in the everyday life experiences of Americans—at least temporarily. For their 2020 State of Science Index Survey, 3M collected data from around the world—both just before the nationwide spread of COVID-19 (August–October 2019) and during the pandemic (July and August 2020) (3M 2020). In late 2019, 29% of respondents who were asked about how much they “think about the impact of science in your everyday life” responded that they thought about that topic “a lot”; in 2020, however, that figure jumped to 39% (Figure PPS-8).
How often U.S. adults thought about the impact of science on their everyday lives, before and during the COVID-19 pandemic: 2019 and 2020
| Frequency | Before the pandemic (2019) (n = 1,008) | During the pandemic (2020) (n = 1,010) |
|---|---|---|
| A lot | 29 | 39 |
| A little | 56 | 48 |
| Never | 15 | 13 |
n = number of survey responses.
Note(s):
See Table SPPS-21 for standard errors. Responses are to the following:
- How much do you think about the impact of science in your everyday life? Select one.
A lot
A little
Never
Source(s):
3M, 2020 Pre-Pandemic Survey (2019), conducted August–October 2019, and 3M, 2020 Pandemic Pulse Survey (2020), conducted July–August 2020.
Science and Engineering Indicators
Engagement with Science Activities
The extent to which American adults participate in science activities indicates one dimension of their direct opportunity to learn about scientific logic and processes. Available survey data depict low participation rates among American adults, yet recent academic literature describes various active science engagements, sometimes labeled citizen science or community science efforts.
The U.S. governmental website CitizenScience.gov has described citizen science as public participation in the scientific process in ways that might include forming research questions, conducting experiments, collecting or analyzing data, or interpreting results (FedCCS 2019). Bonney (2021) notes that some projects have begun to use the phrase community science instead of citizen science in recent years in an effort to encourage inclusivity in participation. An example of this approach is the annual bird count organized by the Audubon Society in which volunteers report counts of various birds (Soykan et al. 2016).
At least some American adults have had opportunities to generate S&E knowledge through citizen science initiatives (Brossard, Lewenstein, and Bonney 2005; Pandya and Dibner 2018). Population-level evidence of the reach of citizen science activities nonetheless has been limited to date. For more information about the state of citizen science and the role of federal agencies as sponsors of citizen science, see the Indicators 2022 report “Invention, Knowledge Transfer, and Innovation” "Sidebar: Citizen Science in Federal Agencies and Departments."
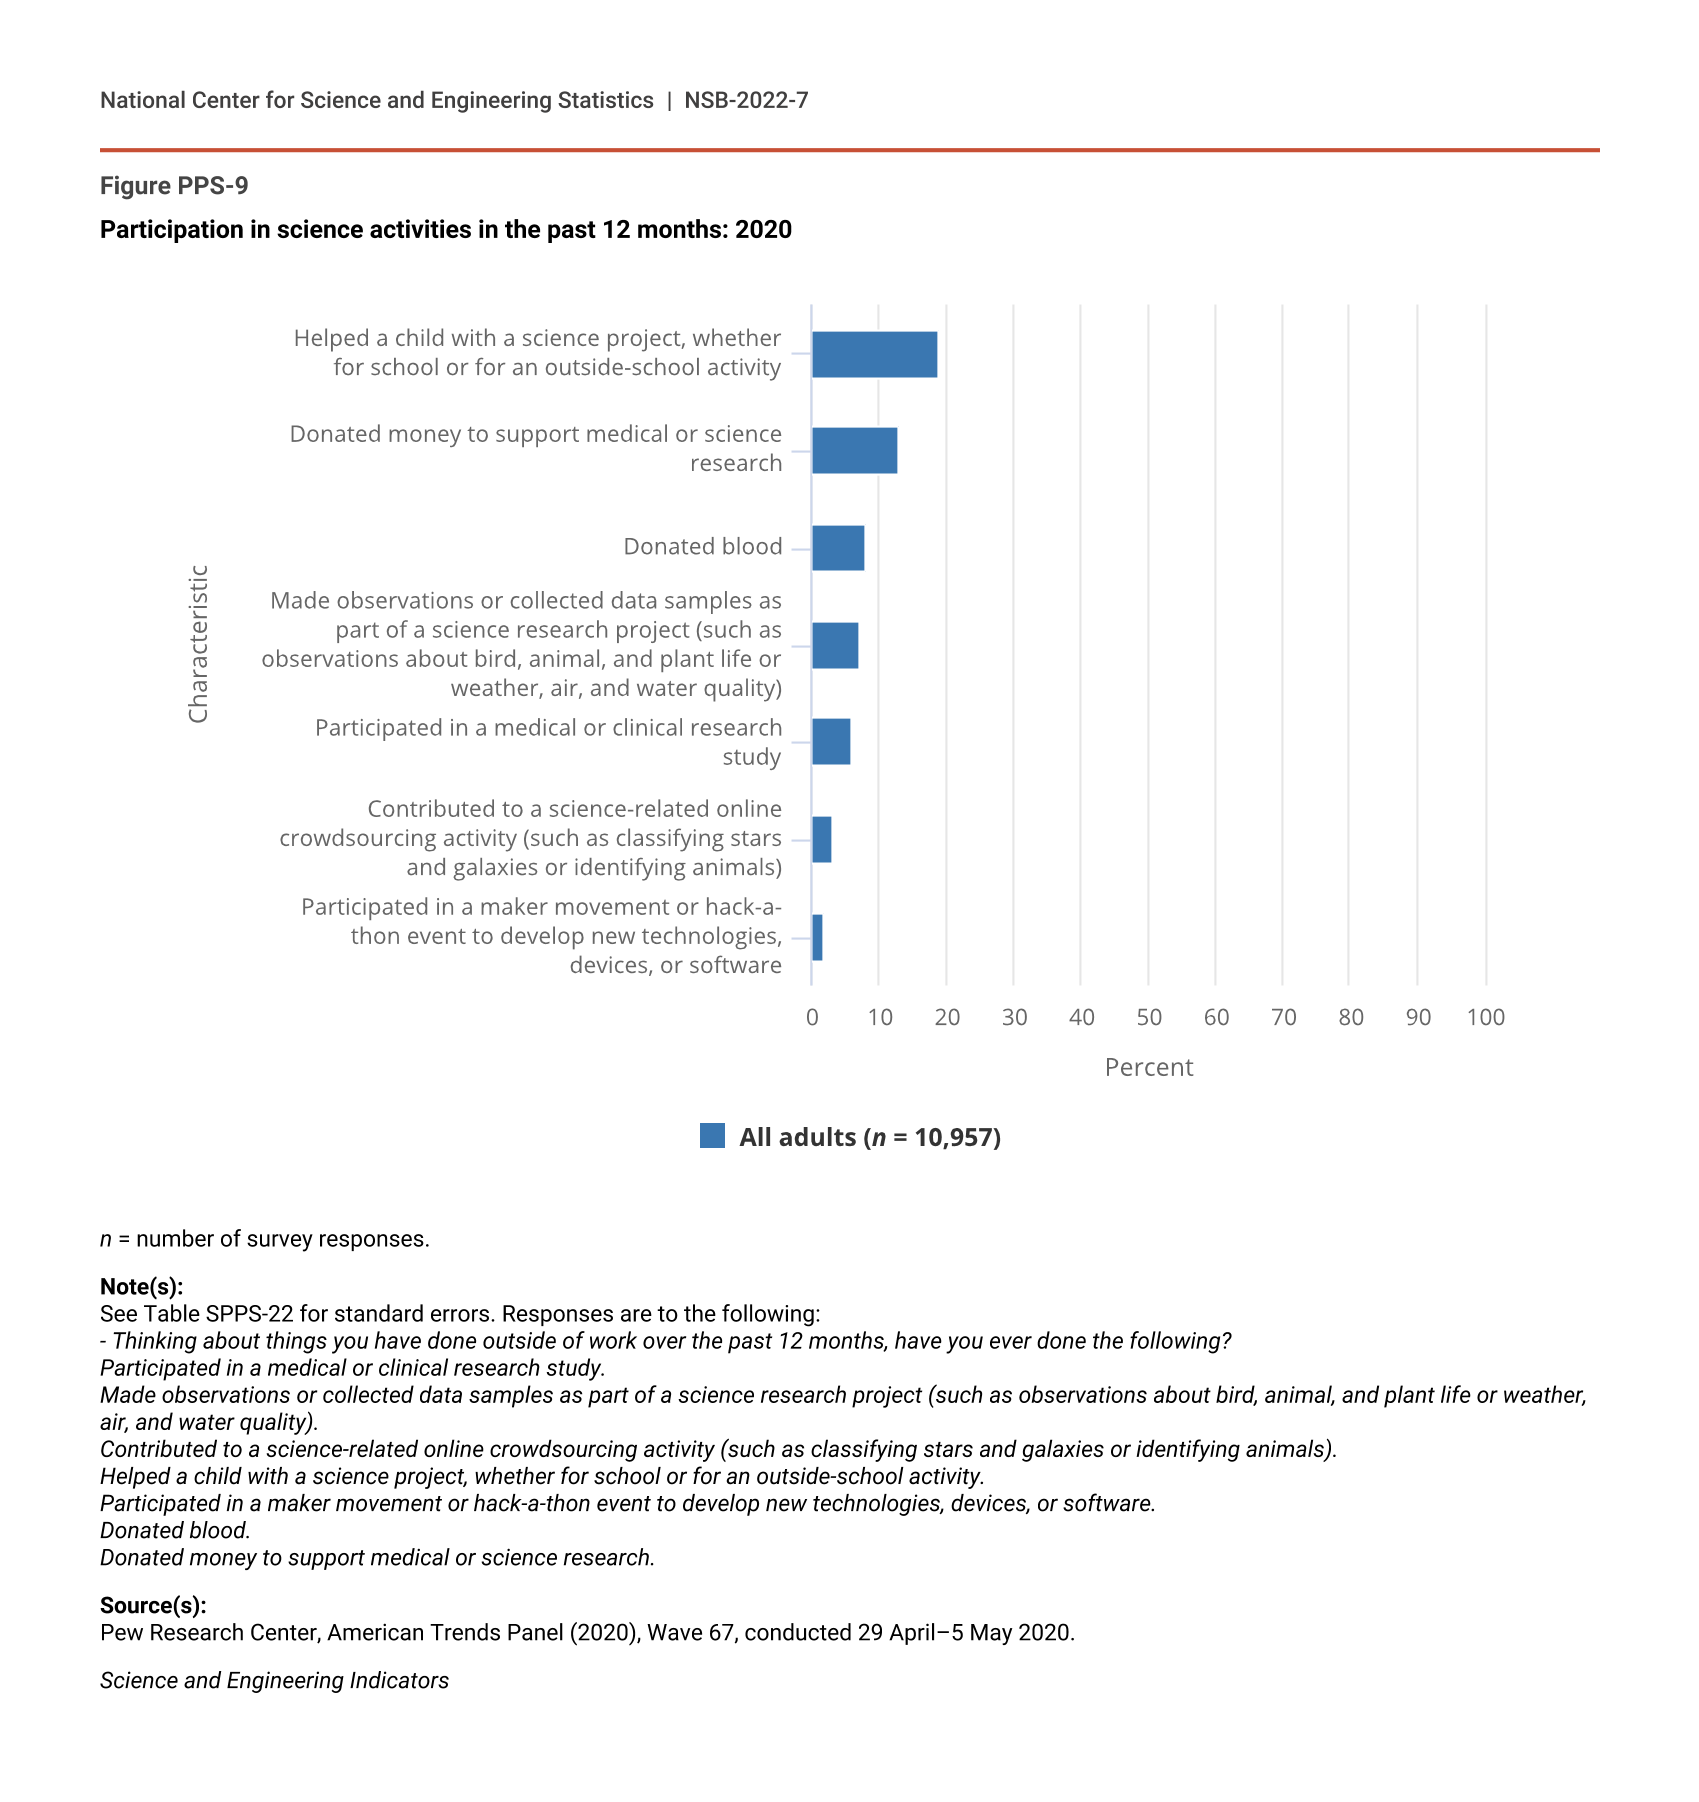
November 2020 data from the Pew Research Center’s American Trends Panel highlight the recent lack of direct experience with science activities among American adults. The American Trends Panel survey included questions about whether respondents had participated in a medical or clinical research study, made observations or collected data for a science research project, contributed to online crowdsourcing for a science project, or helped a child with a science project, among other activities. In November 2020, only a small percentage of U.S. adults had participated in each of those science activities in the past 12 months (Figure PPS-9; Table PPS-5). For example, 3% of U.S. adults reported contributing to online crowdsourcing for activities such as identifying animals, and 7% made observations or collected data samples for a science research project. Approximately 19% had helped a child with a science project either for school or outside of school, suggesting that exposure to science activities through children in the household offers involvement in science for some U.S. adults.
Participation in science activities in the past 12 months: 2020
| Characteristic | All adults (n = 10,957) |
|---|---|
| Participated in a maker movement or hack-a-thon event to develop new technologies, devices, or software | 2 |
| Contributed to a science-related online crowdsourcing activity (such as classifying stars and galaxies or identifying animals) | 3 |
| Participated in a medical or clinical research study | 6 |
| Made observations or collected data samples as part of a science research project (such as observations about bird, animal, and plant life or weather, air, and water quality) | 7 |
| Donated blood | 8 |
| Donated money to support medical or science research | 13 |
| Helped a child with a science project, whether for school or for an outside-school activity | 19 |
n = number of survey responses.
Note(s):
See Table SPPS-22 for standard errors. Responses are to the following:
- Thinking about things you have done outside of work over the past 12 months, have you ever done the following?
Participated in a medical or clinical research study.
Made observations or collected data samples as part of a science research project (such as observations about bird, animal, and plant life or weather, air, and water quality).
Contributed to a science-related online crowdsourcing activity (such as classifying stars and galaxies or identifying animals).
Helped a child with a science project, whether for school or for an outside-school activity.
Participated in a maker movement or hack-a-thon event to develop new technologies, devices, or software.
Donated blood.
Donated money to support medical or science research.
Source(s):
Pew Research Center, American Trends Panel (2020), Wave 67, conducted 29 April–5 May 2020.
Science and Engineering Indicators
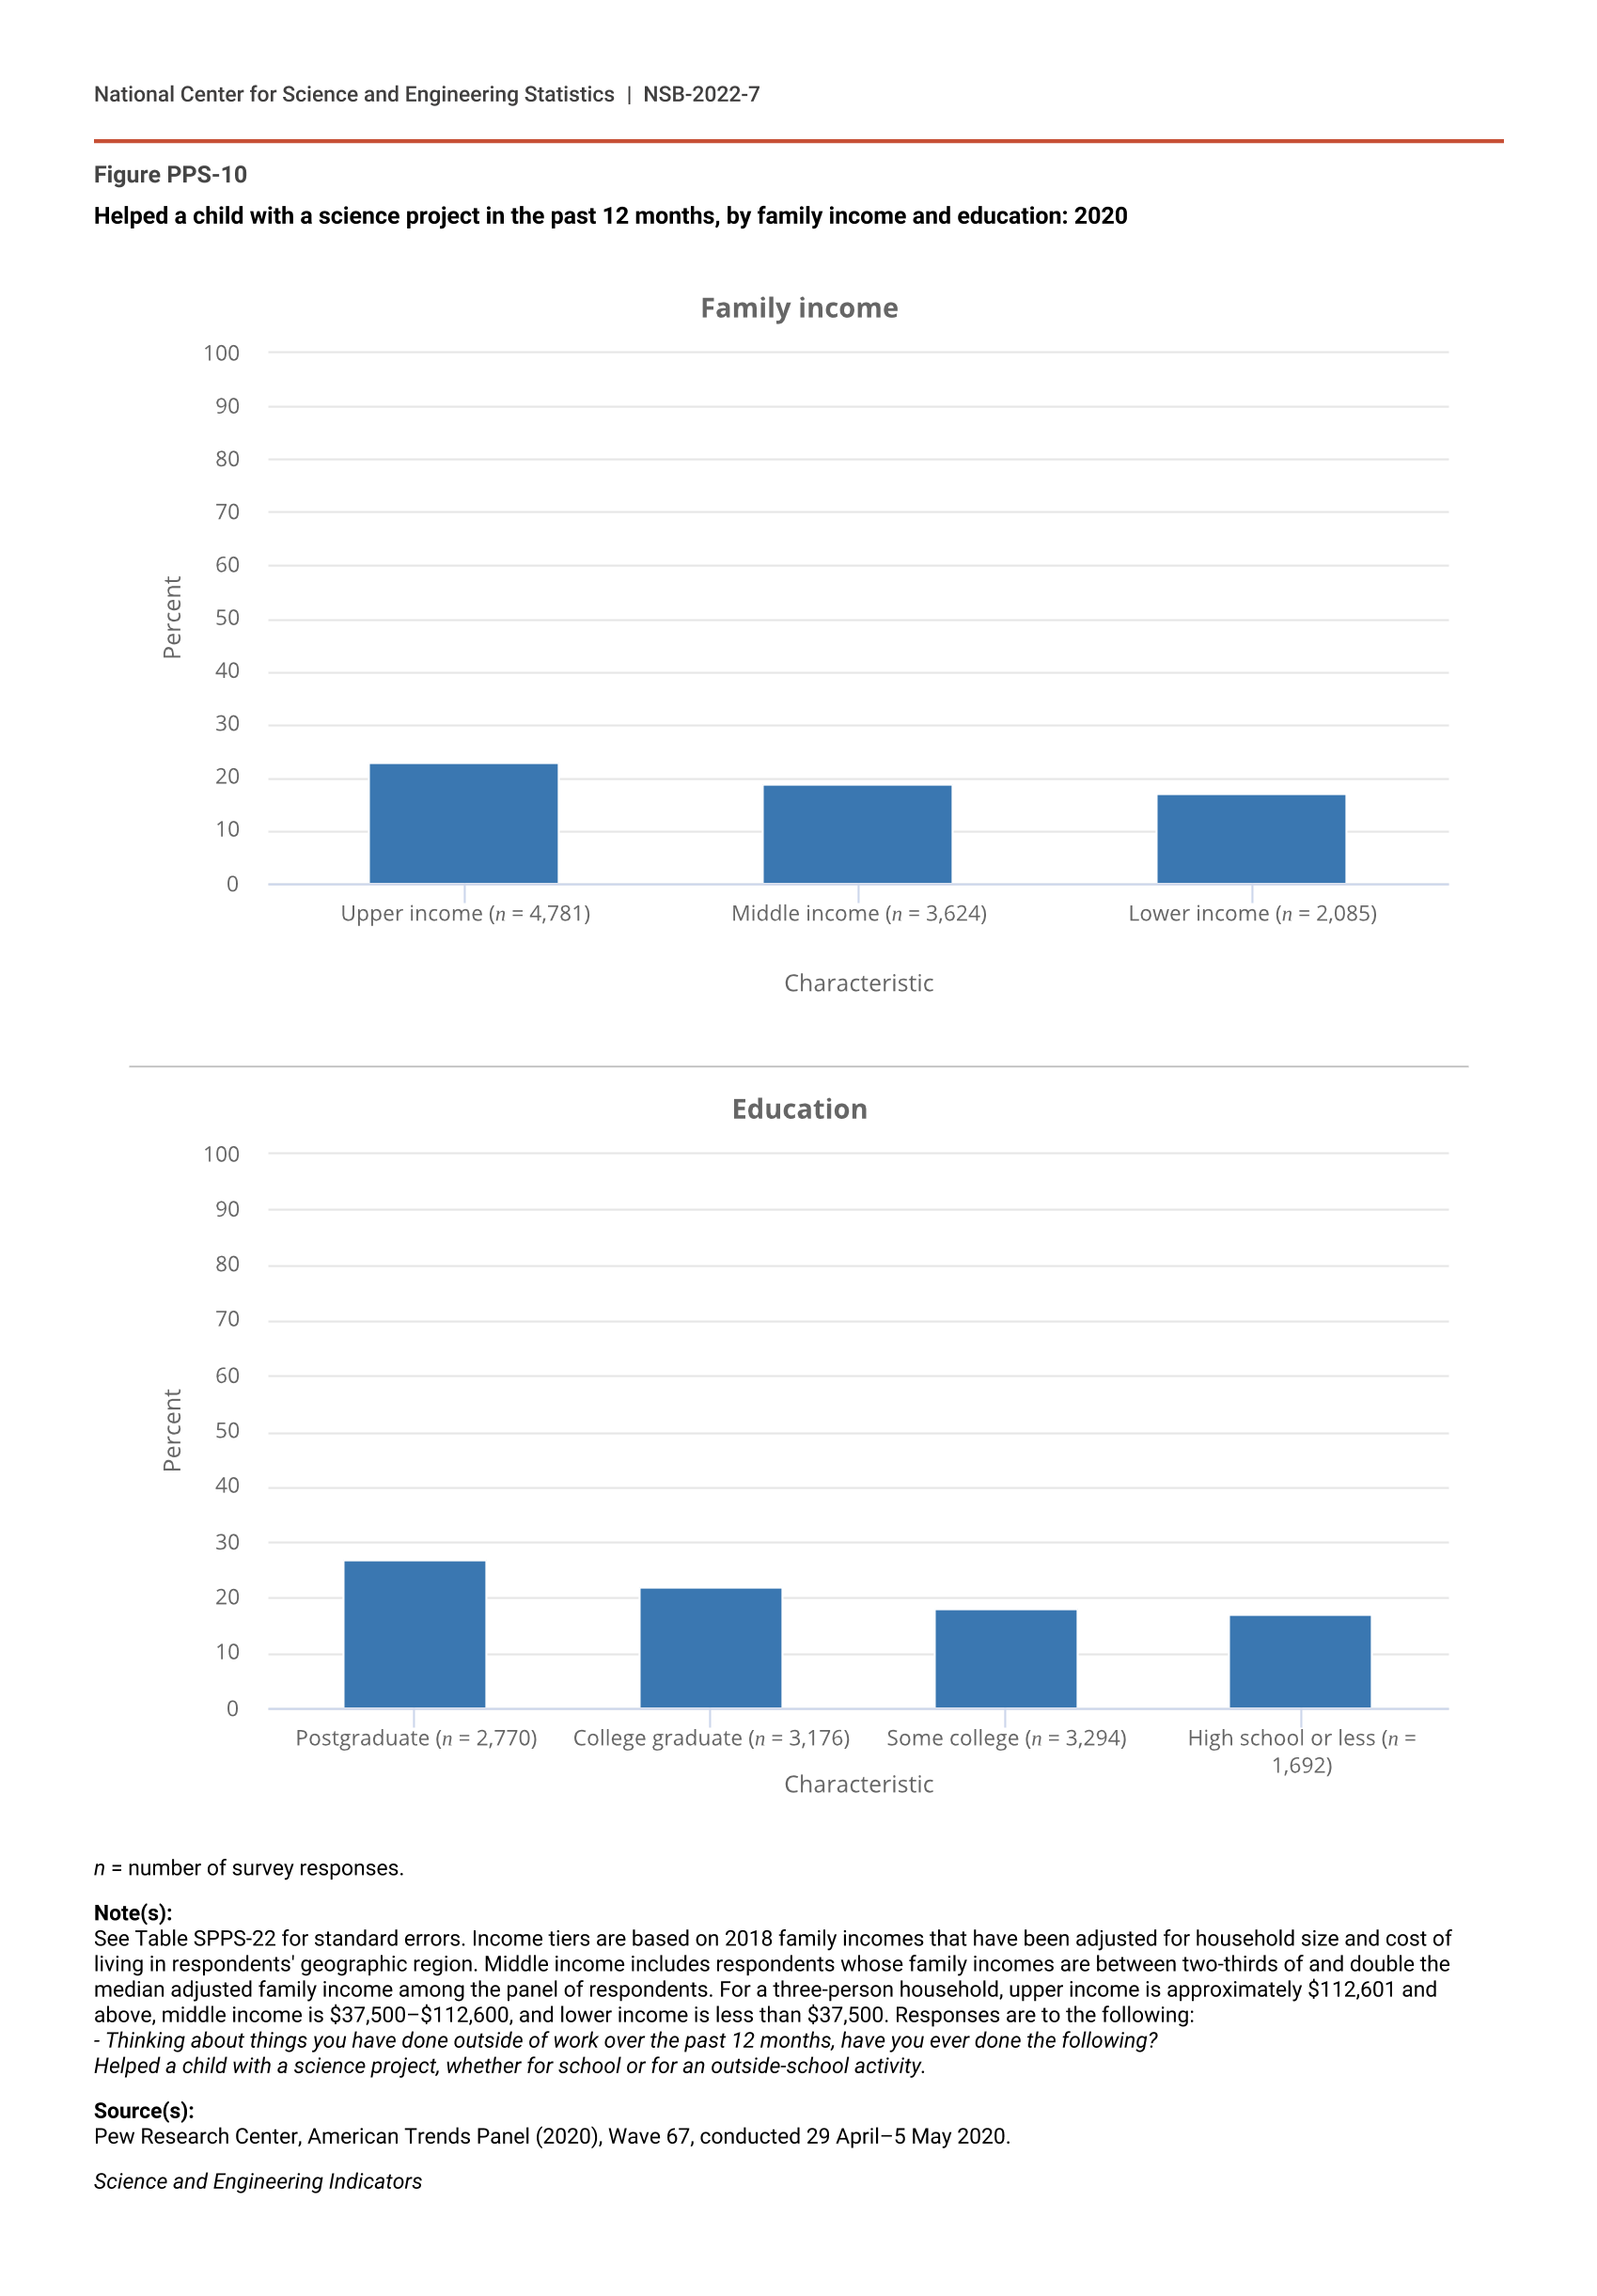
Although a minority of Americans recently participated in science activities, this participation varies as a function of income and education. According to 2020 Pew Research Center data, the level of household engagement with a child for a science project differed based on income or formal education (Table PPS-5; Figure PPS-10). A higher percentage of Americans with a postgraduate degree reported participating in such a project compared to those with a high school degree or less. Similarly, a higher percentage of Americans in the upper income category in the study (who earn more than $112,600 a year) reported participating in such a project than did Americans in the lower income category (who earn less than $37,500). In other words, adults in households with relatively low incomes or with less formal education report less exposure to science activities via school projects with household children. Such differences might reflect inequity in time availability or scientific literacy (Kalil and Ryan 2020).
Participation in science activities in the past 12 months, by family income and education: 2020
n = number of survey responses.
a Income tiers are based on 2018 family incomes that have been adjusted for household size and cost of living in respondents' geographic region. Middle income includes respondents whose family incomes are between two-thirds of and double the median adjusted family income among the panel of respondents. For a three-person household, upper income is approximately $112,601 and above, middle income is $37,500–$112,600, and lower income is less than $37,500.
Note(s):
See Table SPPS-22 for standard errors. Responses are to the following:
- Thinking about things you have done outside of work over the past 12 months, have you ever done the following?
Participated in a medical or clinical research study.
Made observations or collected data samples as part of a science research project (such as observations about bird, animal, and plant life or weather, air, and water quality).
Contributed to a science-related online crowdsourcing activity (such as classifying stars and galaxies or identifying animals).
Helped a child with a science project, whether for school or for an outside-school activity.
Participated in a maker movement or hack-a-thon event to develop new technologies, devices, or software.
Donated blood.
Donated money to support medical or science research.
Source(s):
Pew Research Center, American Trends Panel (2020), Wave 67, conducted 29 April–5 May 2020.
Science and Engineering Indicators
Helped a child with a science project in the past 12 months, by family income and education: 2020
| Characteristic | Helped a child with a science project, whether for school or for an outside-school activity |
|---|---|
| Upper income (n = 4,781) | 23 |
| Middle income (n = 3,624) | 19 |
| Lower income (n = 2,085) | 17 |
| Characteristic | Helped a child with a science project, whether for school or for an outside-school activity |
|---|---|
| Postgraduate (n = 2,770) | 27 |
| College graduate (n = 3,176) | 22 |
| Some college (n = 3,294) | 18 |
| High school or less (n = 1,692) | 17 |
n = number of survey responses.
Note(s):
See Table SPPS-22 for standard errors. Income tiers are based on 2018 family incomes that have been adjusted for household size and cost of living in respondents' geographic region. Middle income includes respondents whose family incomes are between two-thirds of and double the median adjusted family income among the panel of respondents. For a three-person household, upper income is approximately $112,601 and above, middle income is $37,500–$112,600, and lower income is less than $37,500. Responses are to the following:
- Thinking about things you have done outside of work over the past 12 months, have you ever done the following?
Helped a child with a science project, whether for school or for an outside-school activity.
Source(s):
Pew Research Center, American Trends Panel (2020), Wave 67, conducted 29 April–5 May 2020.
Science and Engineering Indicators
Outside the classroom, there are many opportunities for informal science education in the United States. (The most recent previous version of this report discusses topics such as visits to museums and zoos; for information, see Indicators 2020 report Science and Technology: Public Attitudes, Knowledge, and Interest.) For example, an exhaustive NRC report (2009) found thousands of organizations producing science content in the United States. Whether the availability of that informal content has had a robust effect on Americans’ perceptions of science over time, however, is an important empirical question, as is the question of whether Americans experience equity in informal science education access.