 An official website of the United States government
 U.S. and Global Science and Technology Capabilities
Investment in R&D and a workforce equipped to perform technologically advanced activities enables scientific discovery, which produces new S&E knowledge useful for enhancing science and technology (S&T) capabilities. S&T capability, as indicated by publications output, patent activity, and KTI industry output, continues to grow globally. The United States continues to serve as a leader and collaborator in advancing S&T capabilities around the world while middle-income countries, such as China and India, are rapidly developing their S&T capabilities.
Research Publications
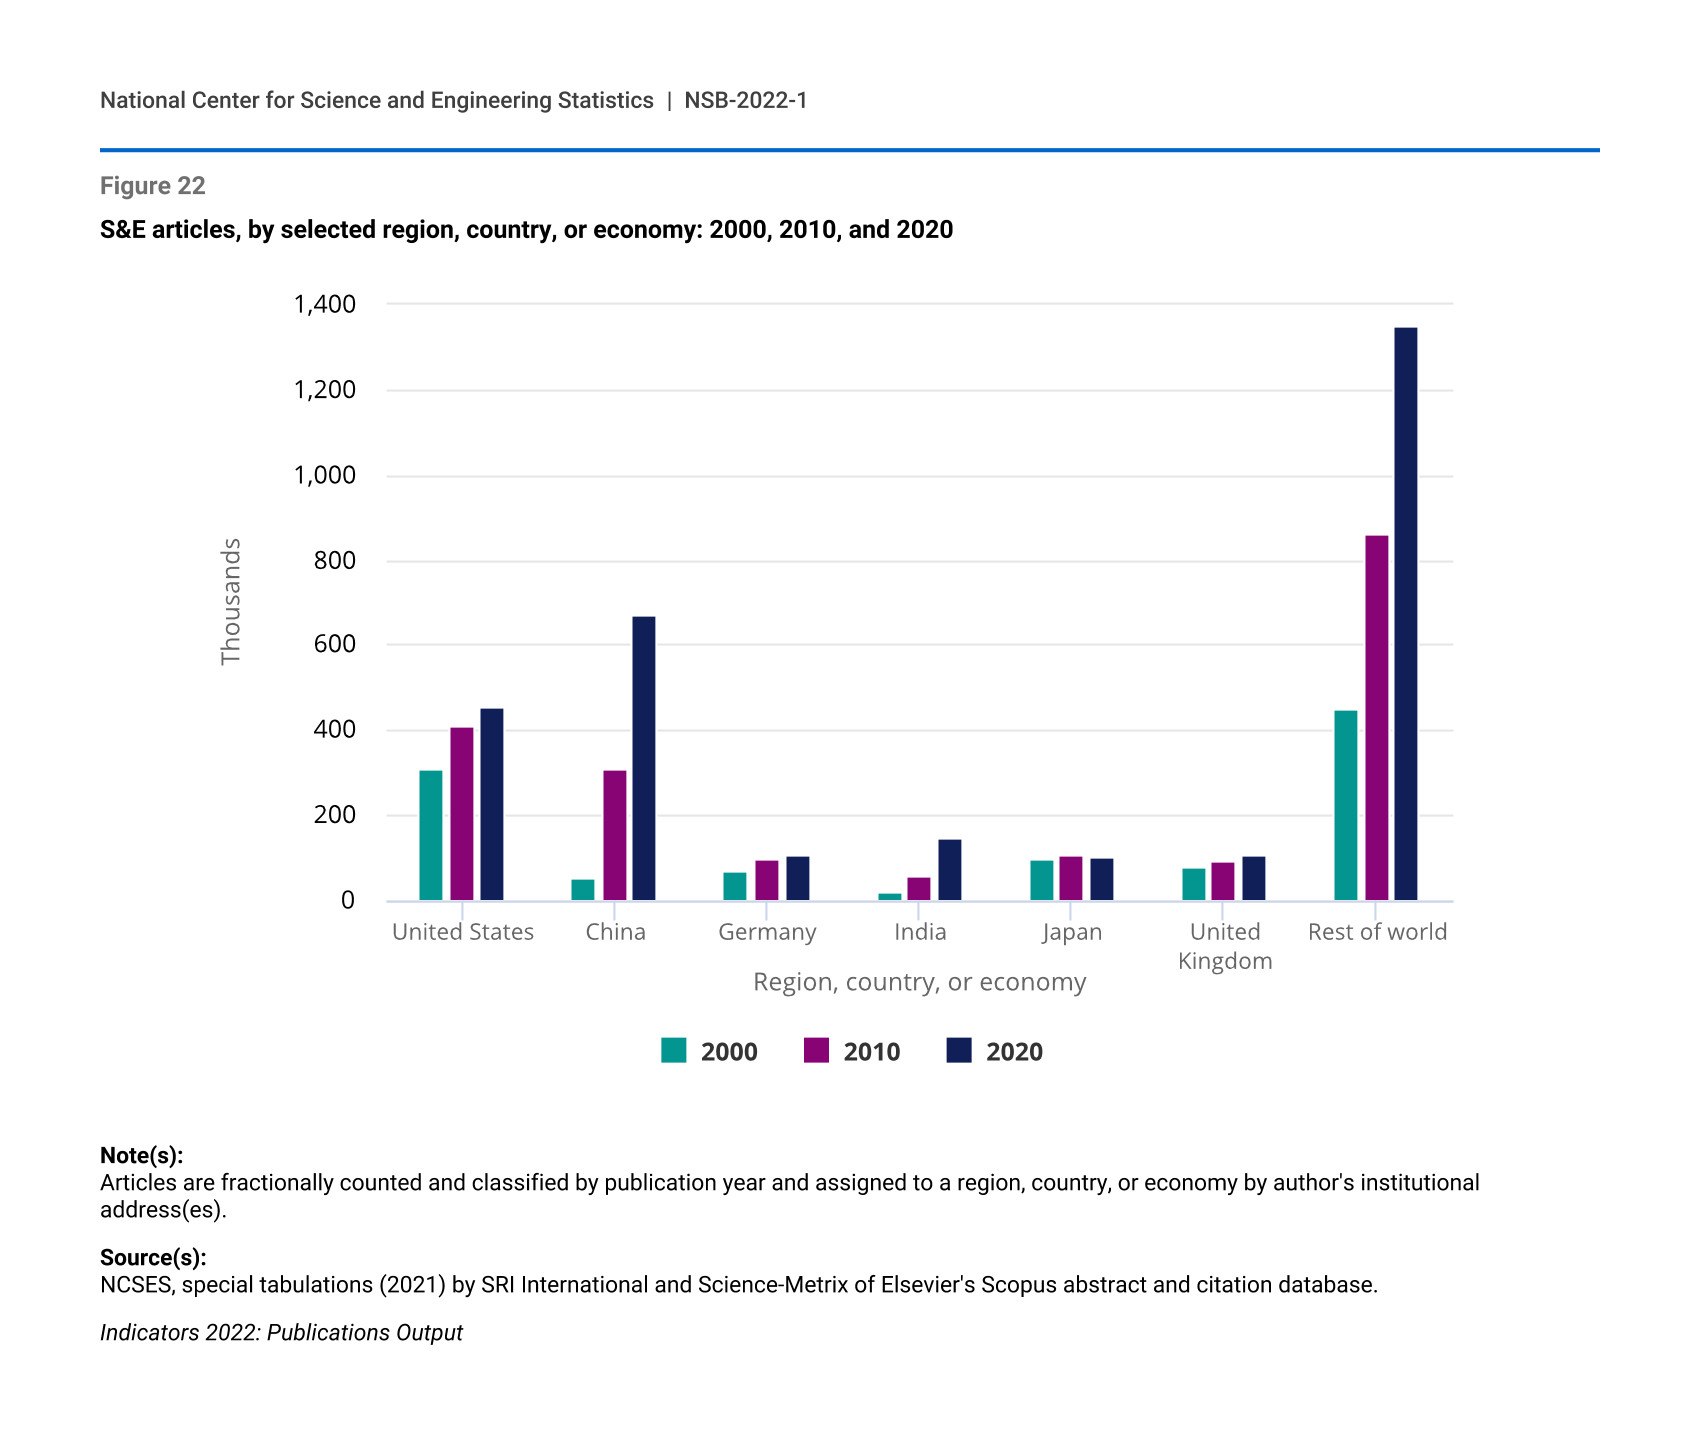
Publication of research in peer-reviewed literature is a primary mechanism for disseminating new S&E knowledge, enabling the use of discoveries for invention and innovation to expand S&T output. Globally, six countries produce more than 50% of the worldwide peer-reviewed S&E publications: China (23%), the United States (16%), India (5%), Germany (4%), the United Kingdom (4%), and Japan (3%) (Figure 22). From 2000 to 2020, publication output growth for high-income countries, such as the United States, Germany, and the United Kingdom, was slower than that of upper middle-income countries, such as China, Russia, and Brazil (see Glossary section for definition of high- and middle-income countries). However, upper middle income countries’ publication output grew from a smaller base compared to high income countries. Overall, publication output of the upper middle-income countries grew at an annual average rate of 11% from 2000 to 2020, while output for high-income countries grew at an annual average rate of 3%.
The distribution of publications by field and region, country, or economy is one indicator of research priorities and capabilities. In the United States, the European Union (EU-27), the United Kingdom, and Japan, the largest proportion of journal articles was in the field of health sciences (see Glossary section for definition of EU-27). In China, the largest proportion was in engineering. In India, the largest proportion was in computer and information sciences.
S&E articles, by selected region, country, or economy: 2000, 2010, and 2020
| Region, country, or economy | 2000 | 2010 | 2020 |
|---|---|---|---|
| United States | 306.5 | 409.5 | 455.9 |
| China | 53.3 | 308.8 | 669.7 |
| Germany | 69.7 | 97.3 | 109.4 |
| India | 21.4 | 60.6 | 149.2 |
| Japan | 96.6 | 108.5 | 101.0 |
| United Kingdom | 78.0 | 94.1 | 105.6 |
| Rest of world | 451.2 | 859.4 | 1,350.0 |
Note(s):
Articles are fractionally counted and classified by publication year and assigned to a region, country, or economy by author's institutional address(es).
Source(s):
NCSES, special tabulations (2021) by SRI International and Science-Metrix of Elsevier's Scopus abstract and citation database.
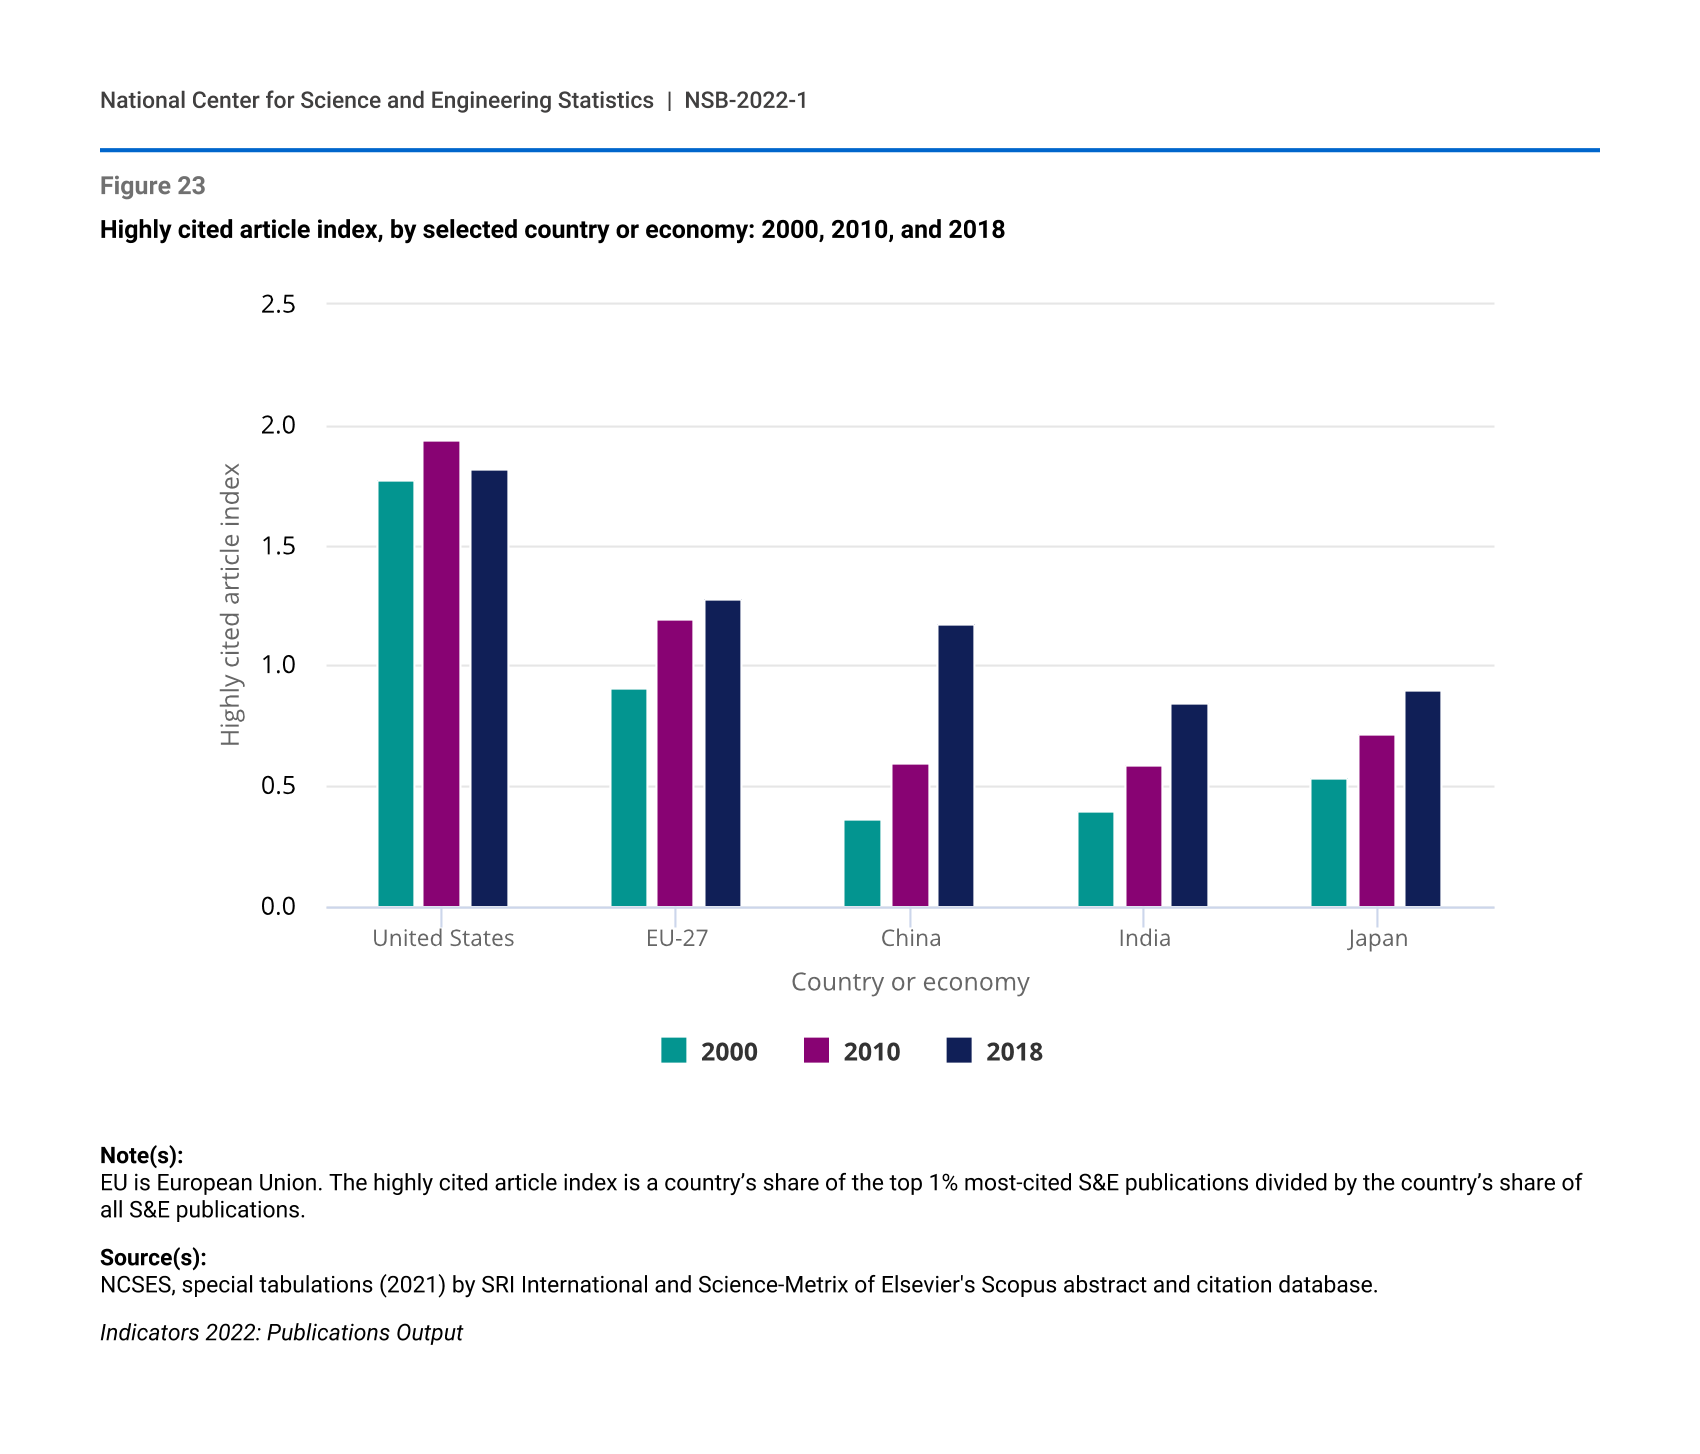
U.S. publications are highly impactful, as measured by citations. From 2000 to 2018, the index of highly cited articles (see Glossary section for definition of index of highly cited articles) for the United States was stable at around 1.8. This means that the United States contributed nearly twice as many highly cited articles as would be expected given the overall publication output of the United States (Figure 23). In contrast, during the same period, the index increased for other countries; specifically, the index for the EU-27 increased from 0.9 to 1.3, and China’s index increased from 0.4 to 1.2.
Highly cited article index, by selected country or economy: 2000, 2010, and 2018
| Country or economy | 2000 | 2010 | 2018 |
|---|---|---|---|
| United States | 1.77 | 1.94 | 1.82 |
| EU-27 | 0.91 | 1.19 | 1.28 |
| China | 0.36 | 0.60 | 1.18 |
| India | 0.40 | 0.59 | 0.85 |
| Japan | 0.54 | 0.72 | 0.90 |
Note(s):
EU is European Union. The highly cited article index is a country’s share of the top 1% most-cited S&E publications divided by the country’s share of all S&E publications.
Source(s):
NCSES, special tabulations (2021) by SRI International and Science-Metrix of Elsevier's Scopus abstract and citation database.
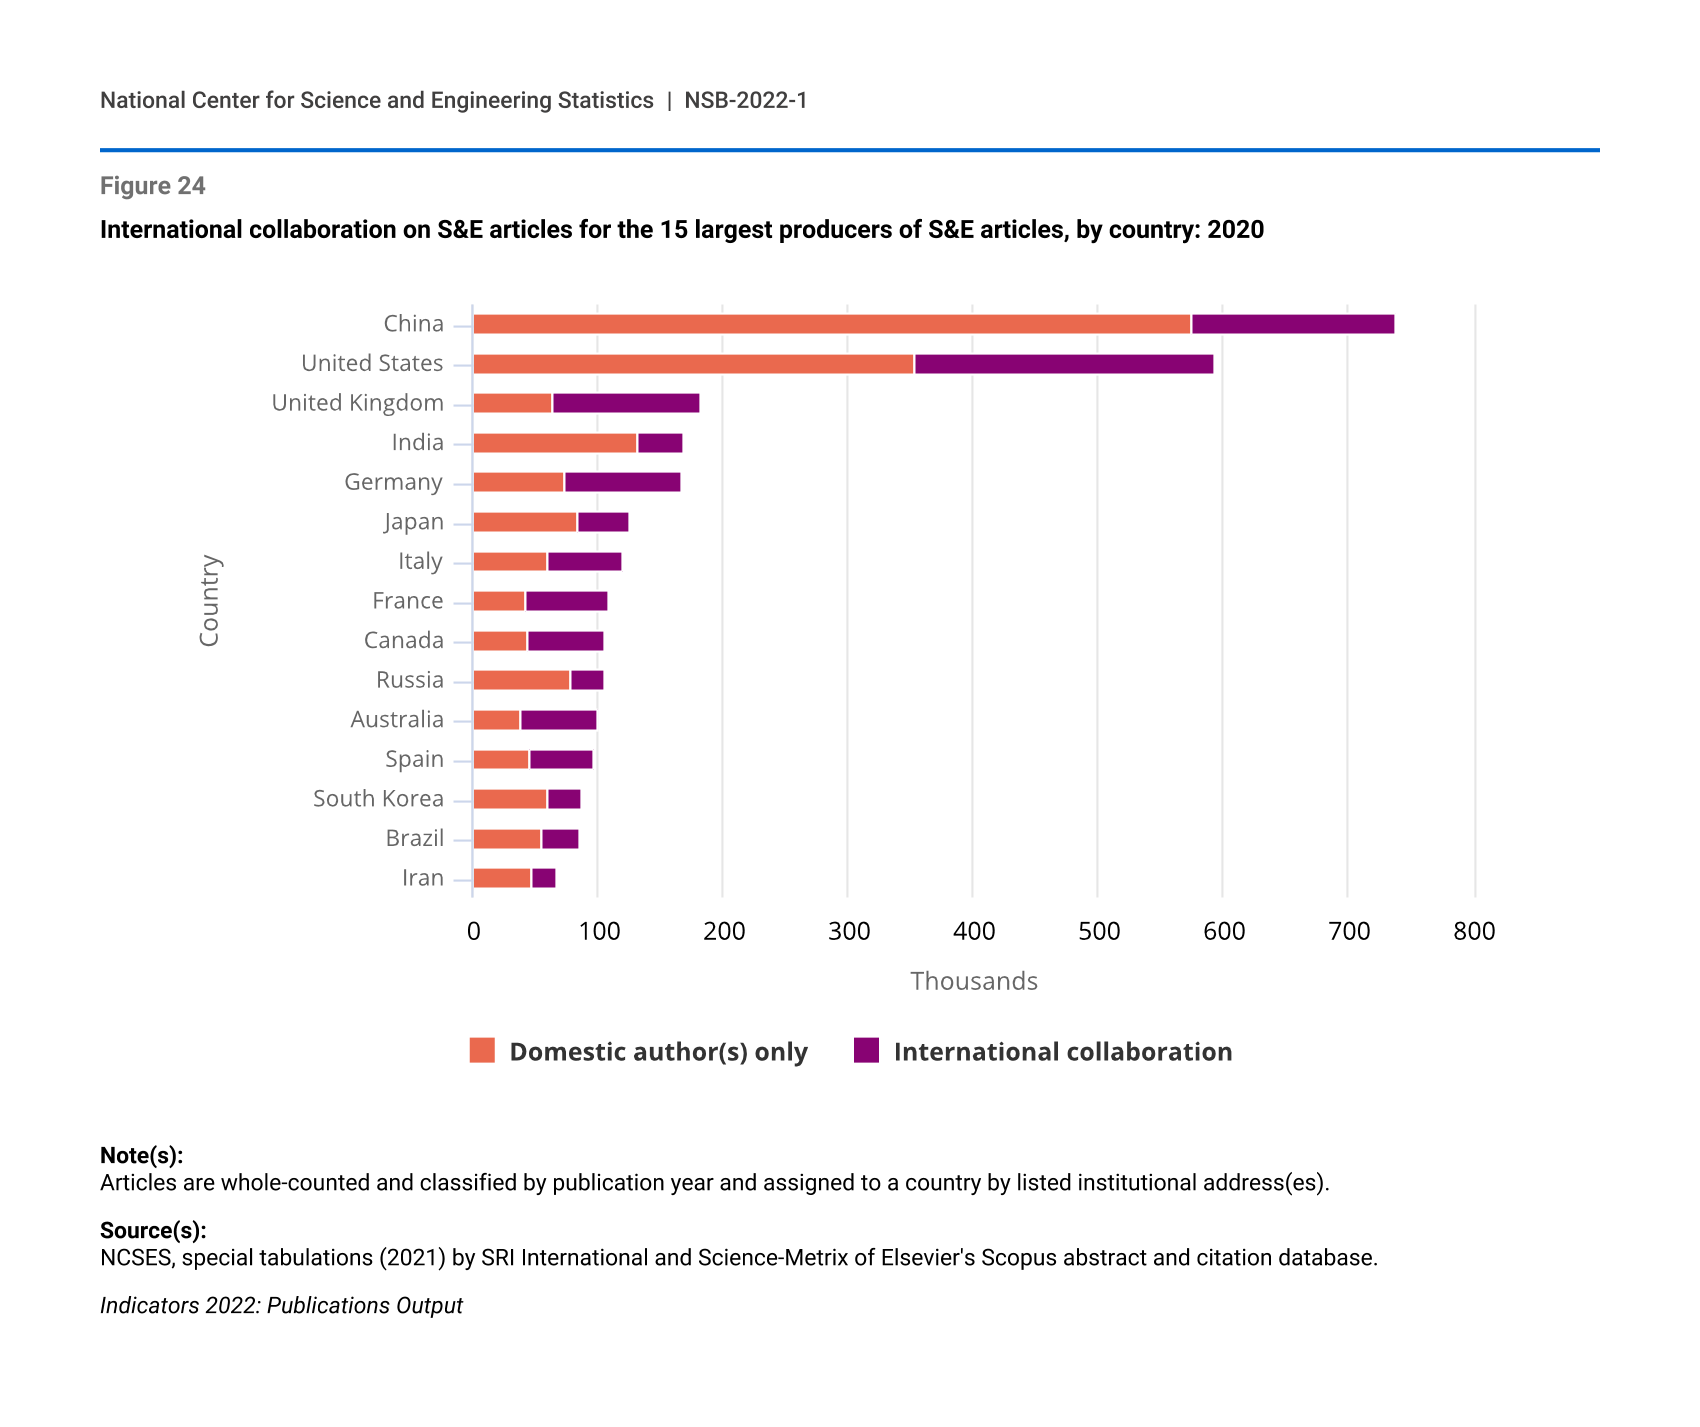
Another indicator of the influence of the United States is reflected by international collaboration in publication coauthorship. In 2020, 35% of the world’s S&E articles with authors from multiple countries included a U.S. author. Authors from China, the United States, the United Kingdom, and Germany coauthored the most S&E publications with other countries (Figure 24). Among the 15 largest producers of S&E articles, the United States, China, the United Kingdom, Germany, France, Australia, Canada, Italy, and Spain had a majority of their S&E articles with international collaboration. Although the United States had international collaboration rates that were lower than the ones in these countries, U.S. publications with international collaboration increased from 19% in 2000 to 40% in 2020.
International collaboration on S&E articles for the 15 largest producers of S&E articles, by country: 2020
| Country | Domestic author(s) only | International collaboration |
|---|---|---|
| China | 575 | 163 |
| United States | 354 | 239 |
| United Kingdom | 64 | 118 |
| India | 131 | 37 |
| Germany | 74 | 92 |
| Japan | 84 | 41 |
| Italy | 60 | 60 |
| France | 42 | 66 |
| Canada | 44 | 61 |
| Russia | 79 | 26 |
| Australia | 38 | 62 |
| Spain | 45 | 51 |
| South Korea | 60 | 27 |
| Brazil | 55 | 30 |
| Iran | 46 | 21 |
Note(s):
Articles are whole-counted and classified by publication year and assigned to a country by listed institutional address(es).
Source(s):
NCSES, special tabulations (2021) by SRI International and Science-Metrix of Elsevier's Scopus abstract and citation database.
Invention and Innovation
The global S&E enterprise regularly produces new basic knowledge and other outputs with direct benefits for society and the economy. These outputs include inventions (creation of new and useful products and processes as well as their improvement) and innovations (implementation of a new or improved product or business process that differs significantly from previous products or processes). Patents are one way governments support invention by providing legal mechanisms for intellectual property protection. Patent documents provide detailed information that is widely used to understand invention activity.
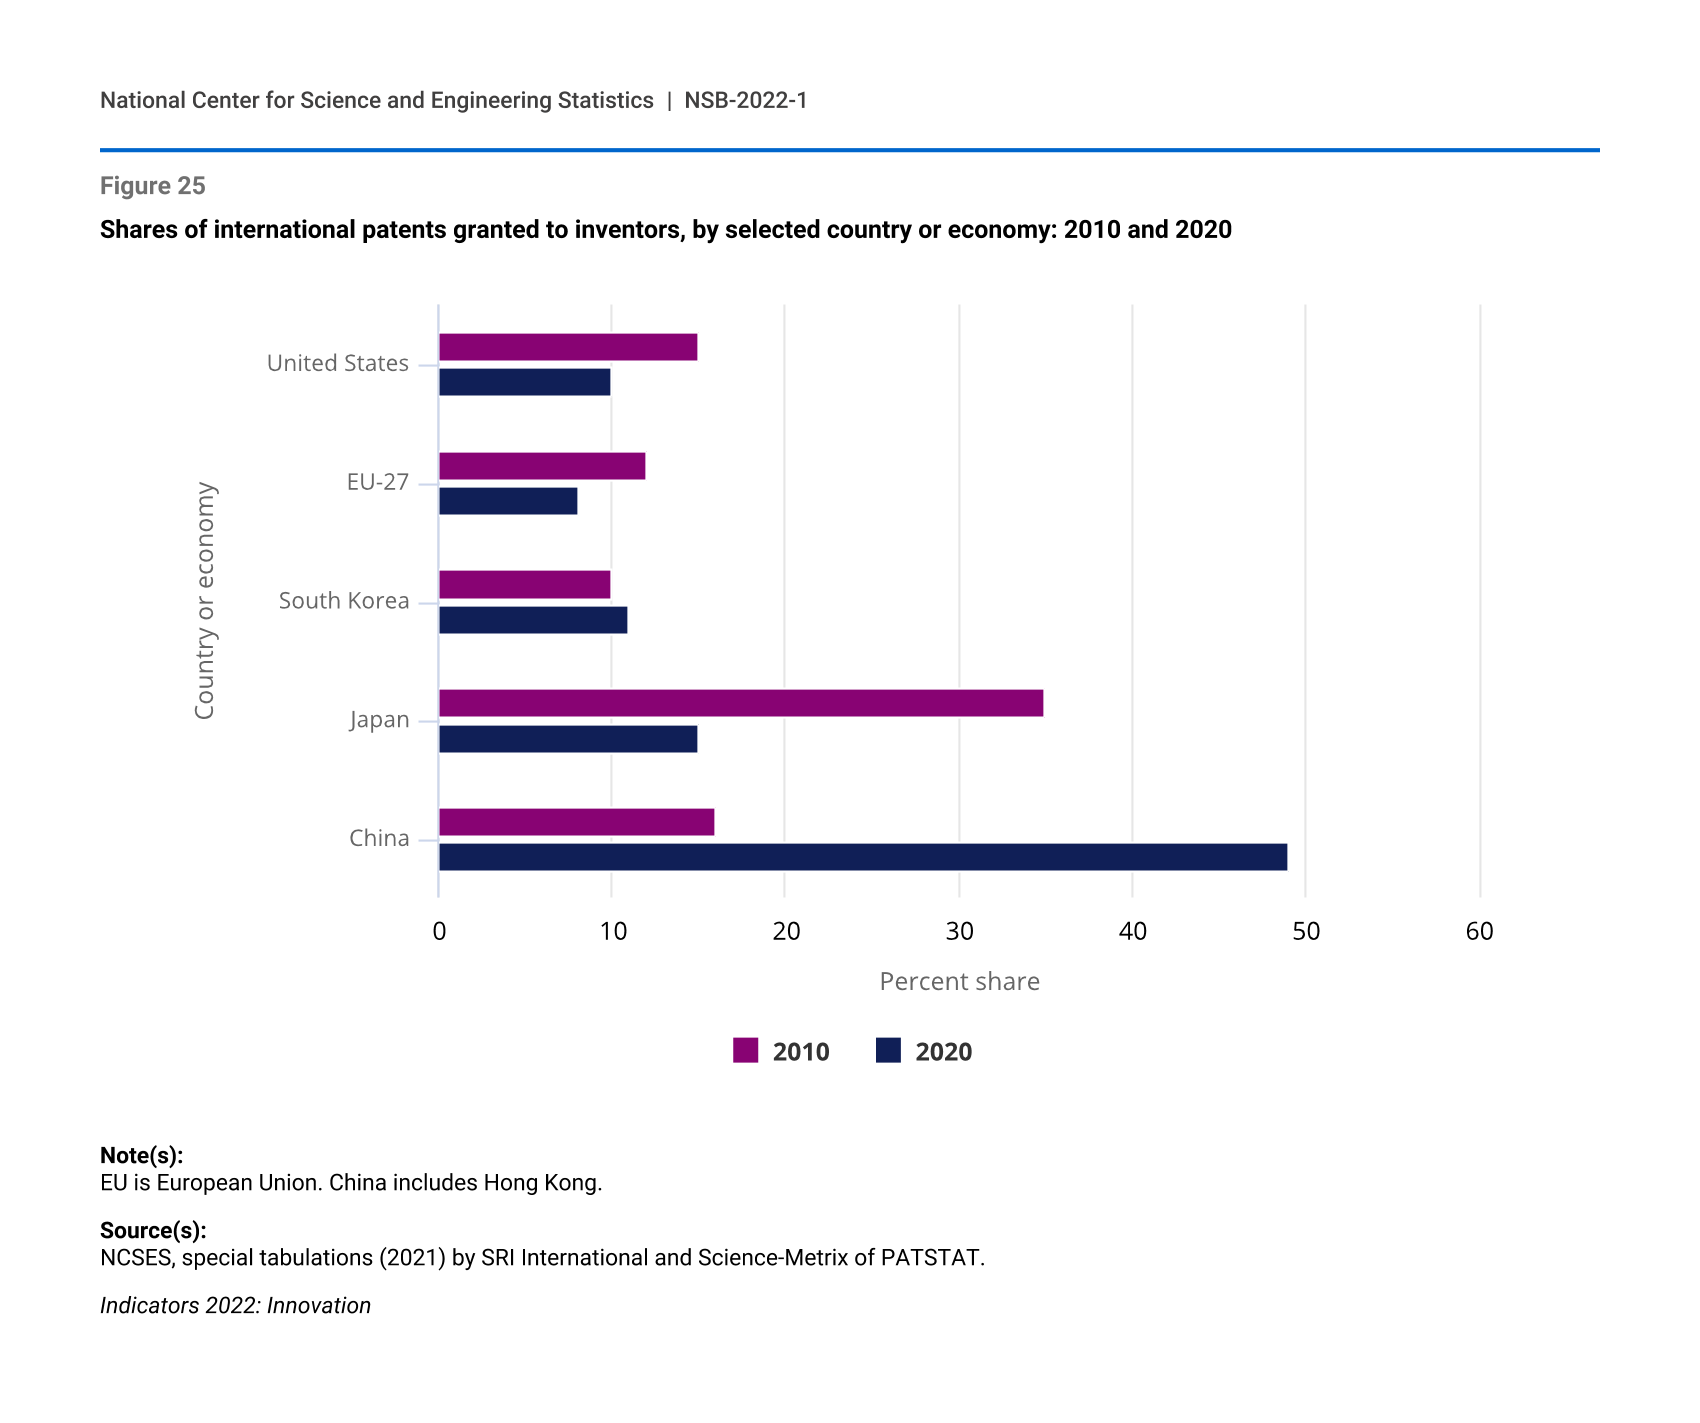
Many middle-income countries, led by China (see Glossary section for definition of middle-income countries), continue to increase patenting activities, resulting in a shift in patenting away from high-income countries like the United States. From 2010 to 2020, the proportion of international patents (see Glossary section for definition of international patents) granted to inventors from high-income countries fell from 78% to 48%. The U.S. share of international patents declined from 15% to 10%. The same share declined from 35% to 15% for Japan and 12% to 8% for the EU-27 (Figure 25). In contrast, China’s share of international patents increased from 16% in 2010 to 49% in 2020.
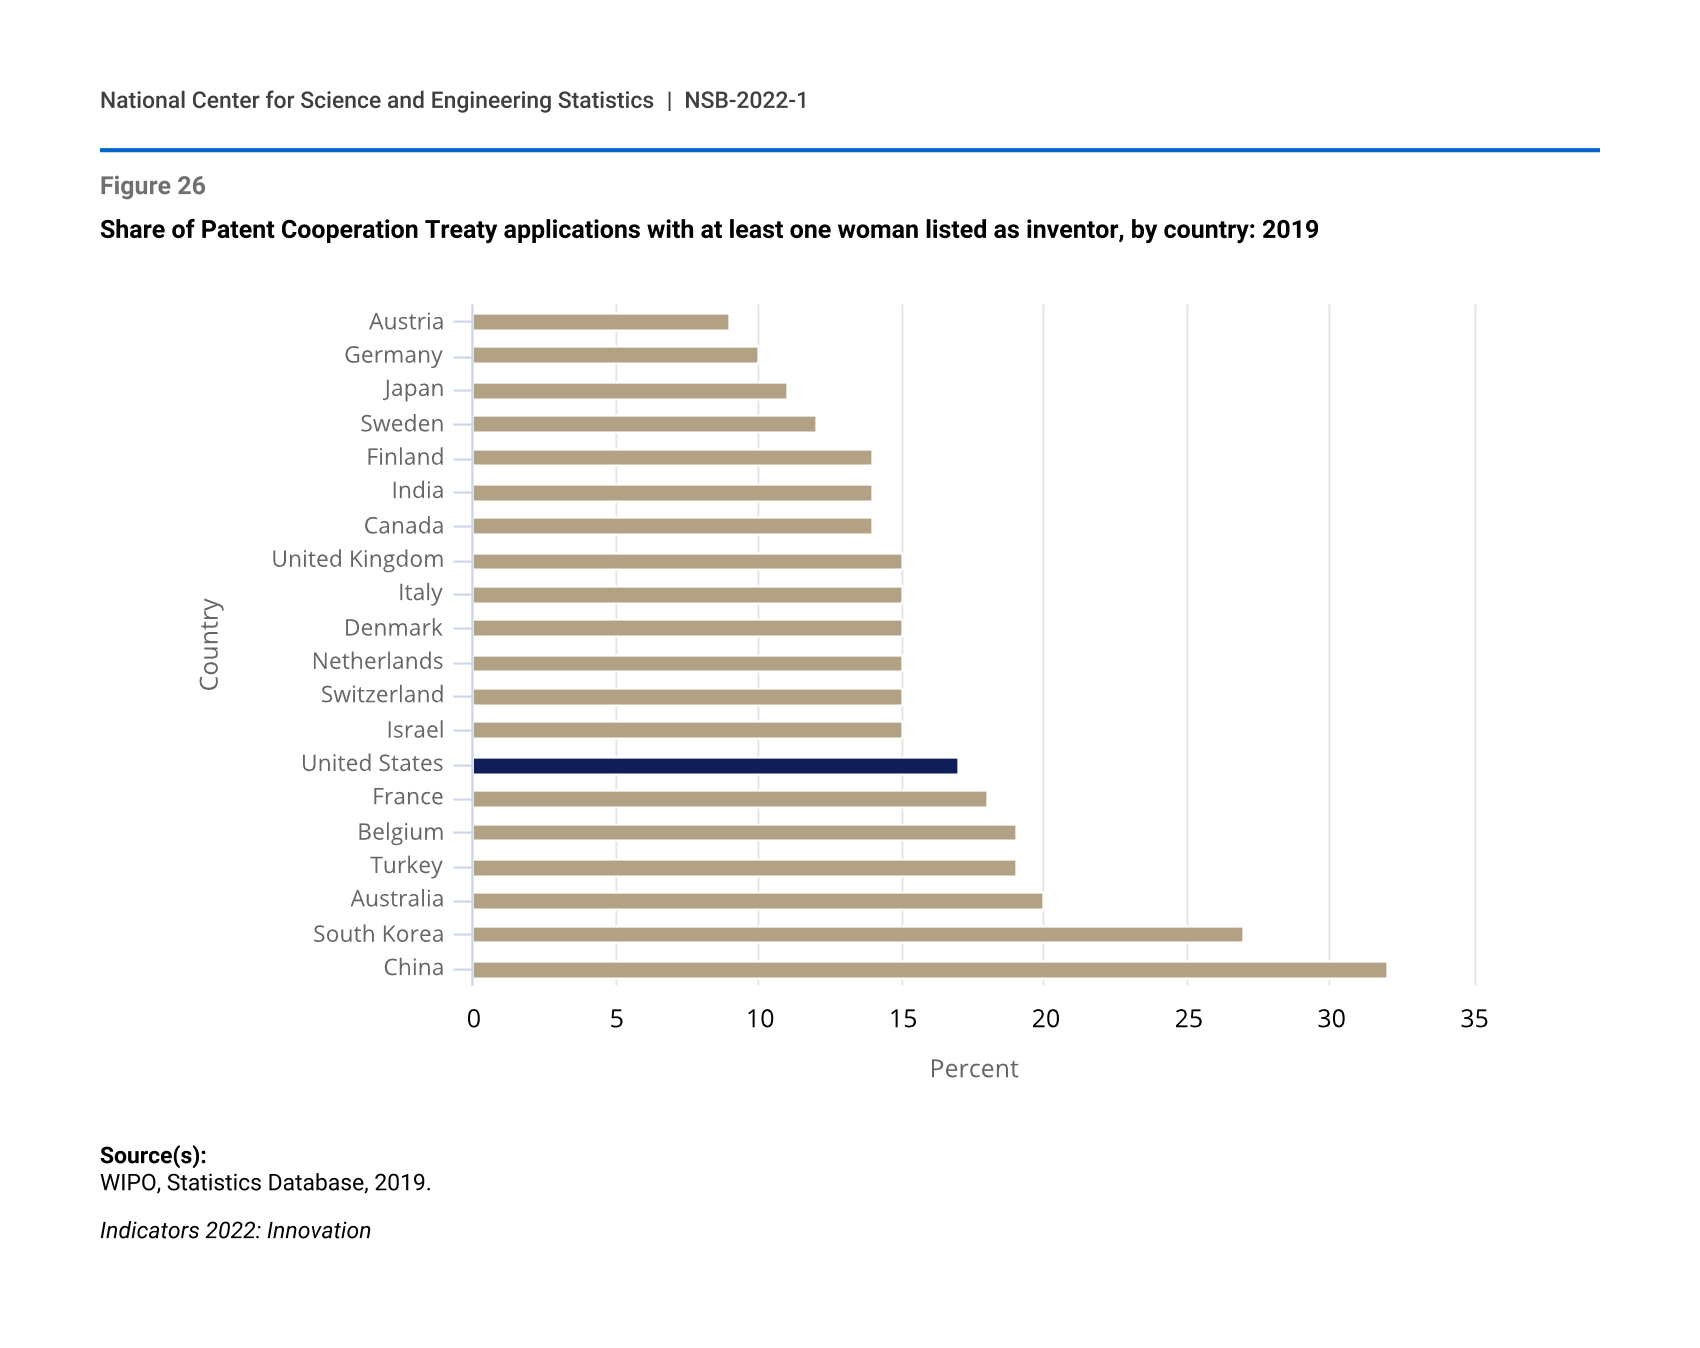
Globally and domestically, patenting activity varies by industry and by inventor demographics. Across all countries, 56% of international patents are related to electrical and mechanical engineering, reflecting the role of these fields in global invention. These two fields of engineering represent 63% of all international patents granted to U.S. inventors in 2020. The high rates of patenting in engineering and the relatively low proportion of U.S. women with engineering degrees or working in engineering occupations are consistent with the low rates of overall patenting activities by female inventors in the United States. In 2019, an estimated 17% of Patent Cooperation Treaty applications (see Glossary section for Patent Cooperation Treaty application) in the United States included at least one woman as an inventor (Figure 26). China (32%) and South Korea (27%) had the highest estimated proportion of patent applications with at least one woman inventor.
Patents granted by the U.S. Patent and Trademark Office (USPTO) have increased both to domestic inventors and to inventors residing in other countries (see Glossary section for definition of USPTO patents). Patents granted to U.S. inventors by the USPTO increased from 107,000 in 2010 to 164,000 in 2020. Reflecting the geographic distribution of STEM workers, domestic patenting intensity (see Glossary section for definition of patent intensity) was higher along both coasts, in areas around the Great Lakes, in the Rocky Mountain West, and in parts of Texas. Despite the increase in USPTO patents granted to U.S. inventors from 2010 to 2020, the proportion of patents granted to inventors in foreign countries increased from 51% in 2010 to 54% in 2020.
Shares of international patents granted to inventors, by selected country or economy: 2010 and 2020
| Country or economy | 2010 | 2020 |
|---|---|---|
| United States | 15 | 10 |
| EU-27 | 12 | 8 |
| South Korea | 10 | 11 |
| Japan | 35 | 15 |
| China | 16 | 49 |
Note(s):
EU is European Union. China includes Hong Kong.
Source(s):
NCSES, special tabulations (2021) by SRI International and Science-Metrix of PATSTAT.
U.S. universities frequently leverage their intellectual property by licensing protected discoveries to outside entities, often to newly established startup companies spun off from university research activity. In 2019, U.S. universities executed almost 8,000 new technology licenses or options, with 19% of them executed with startup companies and 59% with small companies (those with fewer than 500 employees). New university-associated startups increased from 388 in 2000 to 1,029 in 2019.
Share of Patent Cooperation Treaty applications with at least one woman listed as inventor, by country: 2019
| Country | Share with at least one woman inventor |
|---|---|
| China | 32 |
| South Korea | 27 |
| Australia | 20 |
| Turkey | 19 |
| Belgium | 19 |
| France | 18 |
| United States | 17 |
| Israel | 15 |
| Switzerland | 15 |
| Netherlands | 15 |
| Denmark | 15 |
| Italy | 15 |
| United Kingdom | 15 |
| Canada | 14 |
| India | 14 |
| Finland | 14 |
| Sweden | 12 |
| Japan | 11 |
| Germany | 10 |
| Austria | 9 |
Source(s):
WIPO, Statistics Database, 2019.
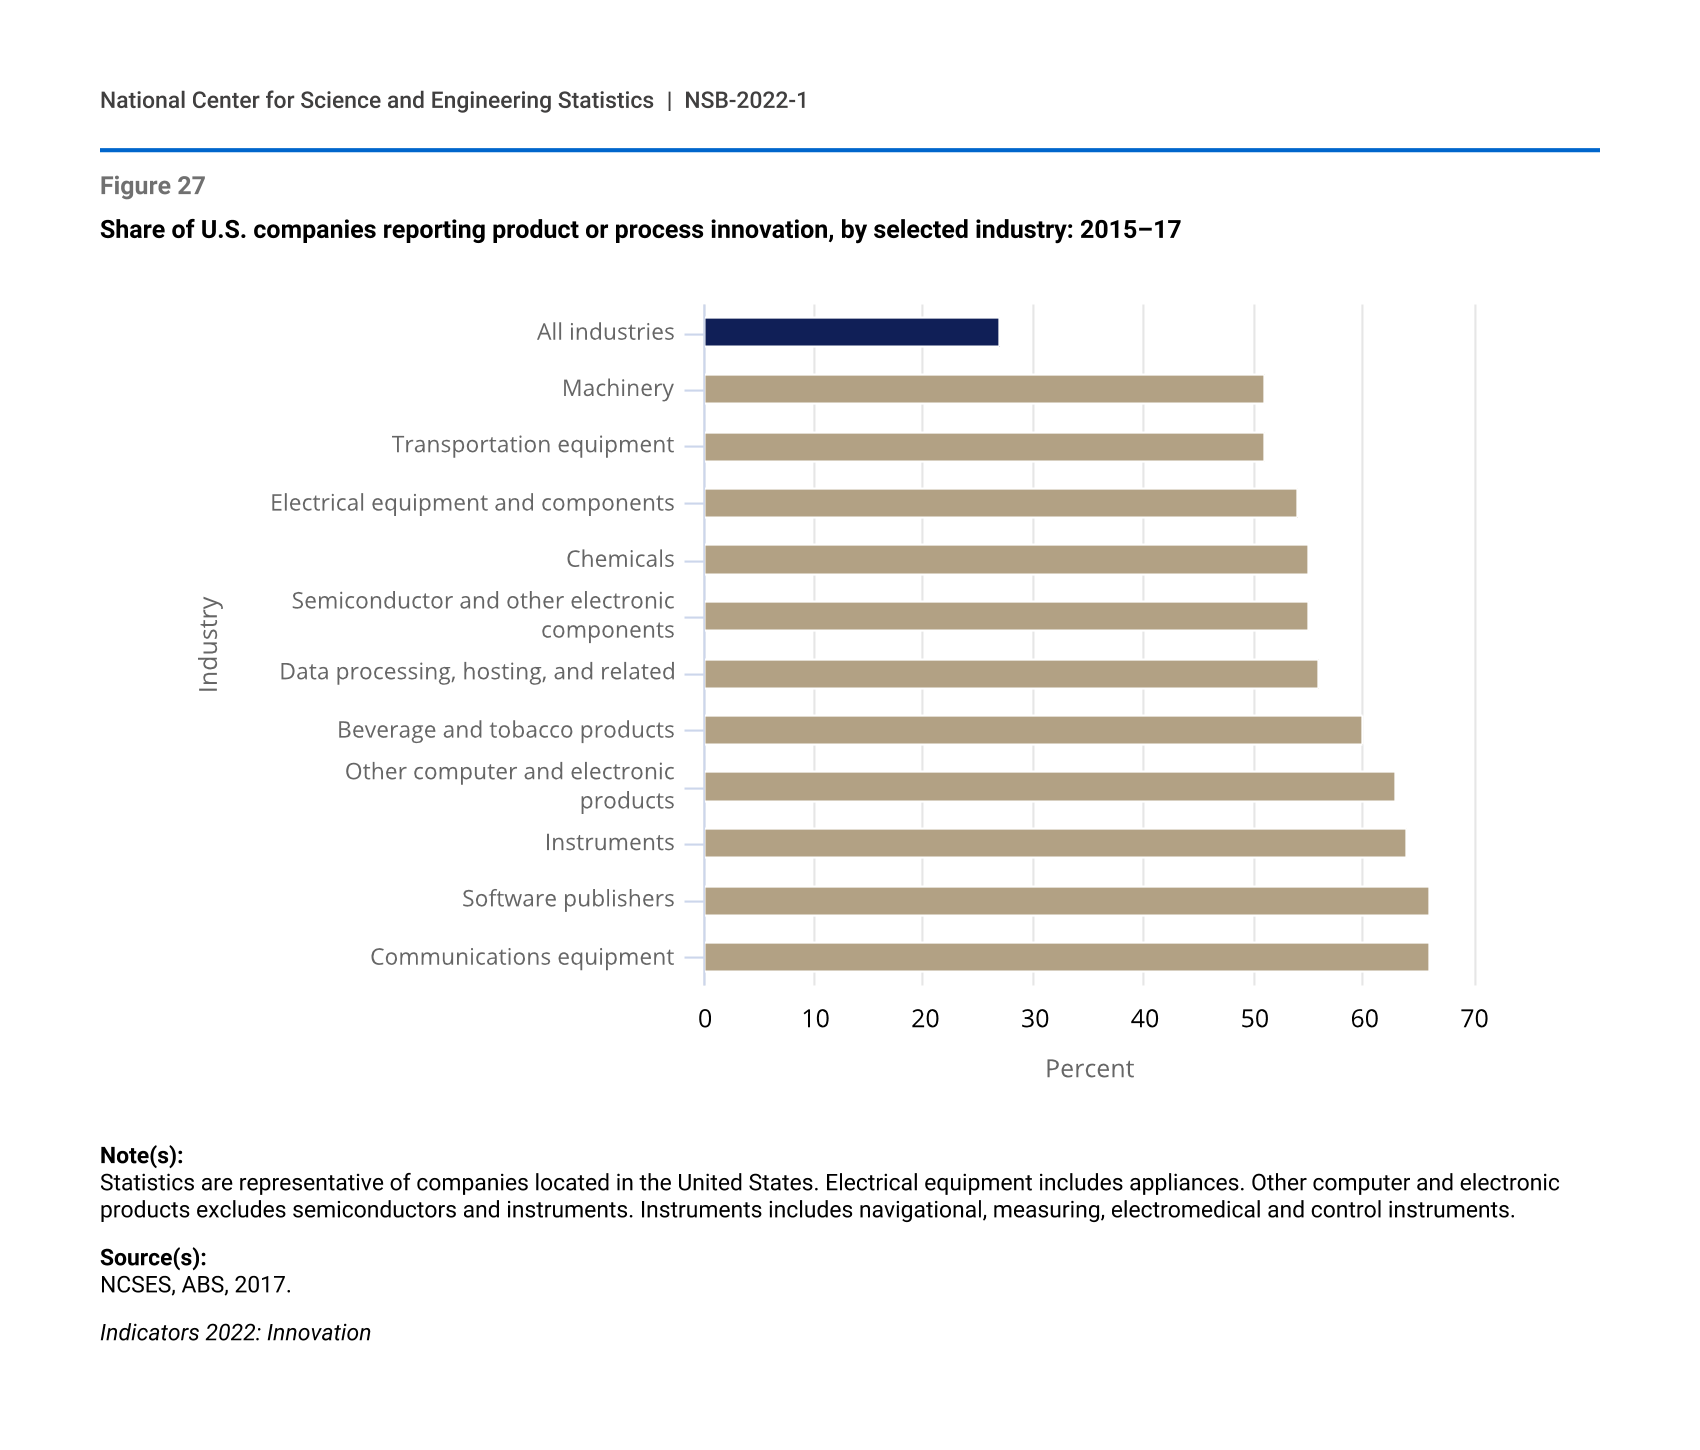
While invention is the creation of something new and useful, innovation is its implementation. An average of 26.5% of businesses introduced a new product or process from 2015 to 2017 (Figure 27). Most of the industries with the highest innovation rates are among those that rely most heavily on R&D, including information and communication technology (ICT) industries (see Glossary section for definition of ICT industries).
Similar to their underrepresentation in the S&E education and STEM workforce, women, Blacks, and Hispanics represent a small proportion of business owners in the United States. From 2015 to 2017, firms with majority ownership by women accounted for 20% of all firms, those with majority ownership by Blacks accounted for 2%, and those with such ownership by Hispanics accounted for 5%. Notwithstanding these low rates of business ownership, businesses owned by these groups reported higher rates of product or process innovation than the average for all businesses. Innovations were reported to be introduced by 27.5% of majority woman-owned businesses, 28.7% of majority Hispanic-owned businesses, and 28.0% of majority Black-owned business. This compares with 26.5% for all businesses.
The United States received 47% ($129 billion) of global venture capital in 2020, financing that is essential to translate new knowledge into innovations. Although this amount is large, the U.S. share of global venture capital dropped from 76% in 2000–05 as China and South Asia (particularly India) increasingly received more venture capital funding. Global venture capital investment in China was $60 billion dollars in 2020, rebounding after steep declines between 2018 and 2019 that broke a decade-long trend of rapid growth. Venture capital in the United States was focused primarily in ICT and healthcare industries (e.g., healthcare devices and supplies, health services, healthcare technology systems, and pharmaceuticals and biotechnology). In China, ICT industries received the most venture capital funding (40%) in 2020.
Share of U.S. companies reporting product or process innovation, by selected industry: 2015–17
| Industry | Company share reporting innovation |
|---|---|
| All industries | 27 |
| Machinery | 51 |
| Transportation equipment | 51 |
| Electrical equipment and components | 54 |
| Chemicals | 55 |
| Semiconductor and other electronic components | 55 |
| Data processing, hosting, and related | 56 |
| Beverage and tobacco products | 60 |
| Other computer and electronic products | 63 |
| Instruments | 64 |
| Software publishers | 66 |
| Communications equipment | 66 |
Note(s):
Statistics are representative of companies located in the United States. Electrical equipment includes appliances. Other computer and electronic products excludes semiconductors and instruments. Instruments includes navigational, measuring, electromedical and control instruments.
Source(s):
NCSES, ABS, 2017.
Knowledge- and Technology-Intensive Industry Output
Production of output by KTI industries—that is, industries that globally have high R&D intensities (see Glossary section for definition of R&D intensity)—indicates the translation of S&E capabilities into the marketplace. In addition, output of KTI industries is a significant source of U.S. productivity. The value-added output (see Glossary section for definition of value-added output) produced by these industries is the additional value created from transforming inputs at different stages of the production process.
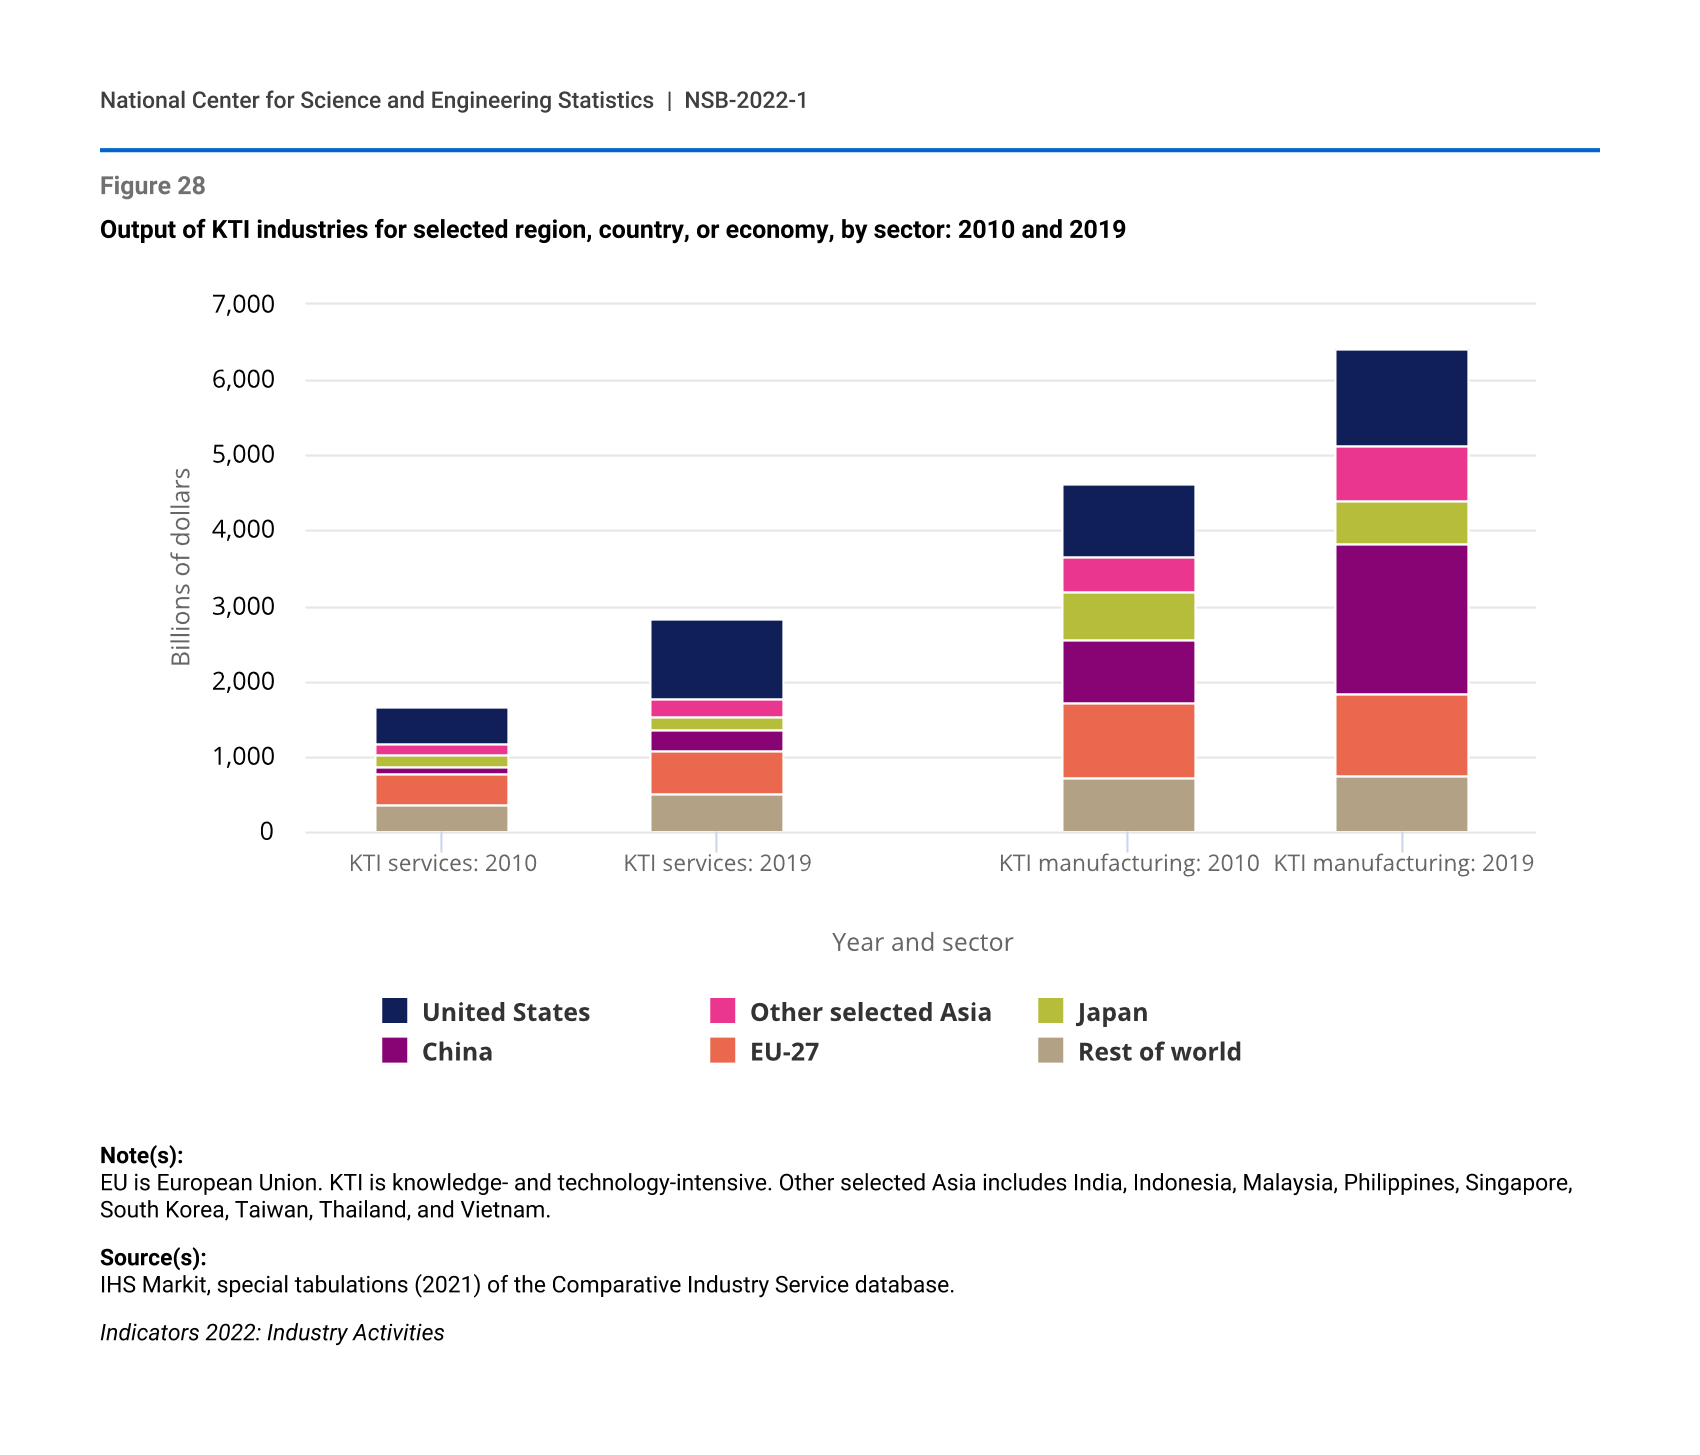
Globally, KTI industry value-added output more than doubled from 2002 ($3.4 trillion) to 2019 ($9.2 trillion). In 2019, $2.8 trillion was produced by KTI services industries (information technology [IT] services, scientific R&D services, and software publishing) and $6.4 trillion was produced by KTI manufacturing industries (aircraft; computer, electronic and optical products; pharmaceuticals; chemicals [excluding pharmaceuticals]; transportation equipment [excluding aircraft]; electrical and other machinery and equipment; and scientific instruments) (Figure 28).
Output of KTI industries for selected region, country, or economy, by sector: 2010 and 2019
| Year and sector | Rest of world | EU-27 | China | Japan | Other selected Asia | United States |
|---|---|---|---|---|---|---|
| KTI services: 2010 | 367.8 | 396.7 | 94.8 | 158.8 | 131.4 | 508.3 |
| KTI services: 2019 | 484.2 | 598.6 | 285.5 | 147.9 | 261.9 | 1,034.5 |
| KTI manufacturing: 2010 | 729.6 | 976.4 | 852.6 | 629.5 | 459.7 | 975.7 |
| KTI manufacturing: 2019 | 750.3 | 1,075.3 | 1,981.9 | 582.4 | 715.9 | 1,301.7 |
Note(s):
EU is European Union. KTI is knowledge- and technology-intensive. Other selected Asia includes India, Indonesia, Malaysia, Philippines, Singapore, South Korea, Taiwan, Thailand, and Vietnam.
Source(s):
IHS Markit, special tabulations (2021) of the Comparative Industry Service database.
China surpassed the United States to become the world’s largest producer of KTI manufacturing output in 2011, and China has been the driving force behind the rapid increase of this output for many KTI industries over the past decade. China’s global share of KTI manufacturing output has increased from 18% in 2010 to 31% in 2019. Although U.S. KTI manufacturing output continues to increase and the United States continues to be the largest global producer of output of three KTI manufacturing industries (aircraft, medical equipment, and pharmaceuticals), its global share has fluctuated between 19% and 21% since 2010. During this period, the United States has increased its global share of KTI services output from 31% in 2010 to 37% in 2019, and it is currently the largest producer of IT services, the largest global KTI industry.
U.S. KTI output is highly concentrated and specialized across the United States. California (25%), Texas (8%), Washington (6%), and New York (5%) contribute the most to total U.S. domestic production of KTI output. However, the contribution of KTI output to each state’s gross domestic product (GDP) varies widely across states. U.S. KTI industry output contributes 11% to U.S. GDP, whereas output of these industries contributes 13%–24% to the economies in Oregon, North Carolina, Michigan, Indiana, Massachusetts, California, and Washington.
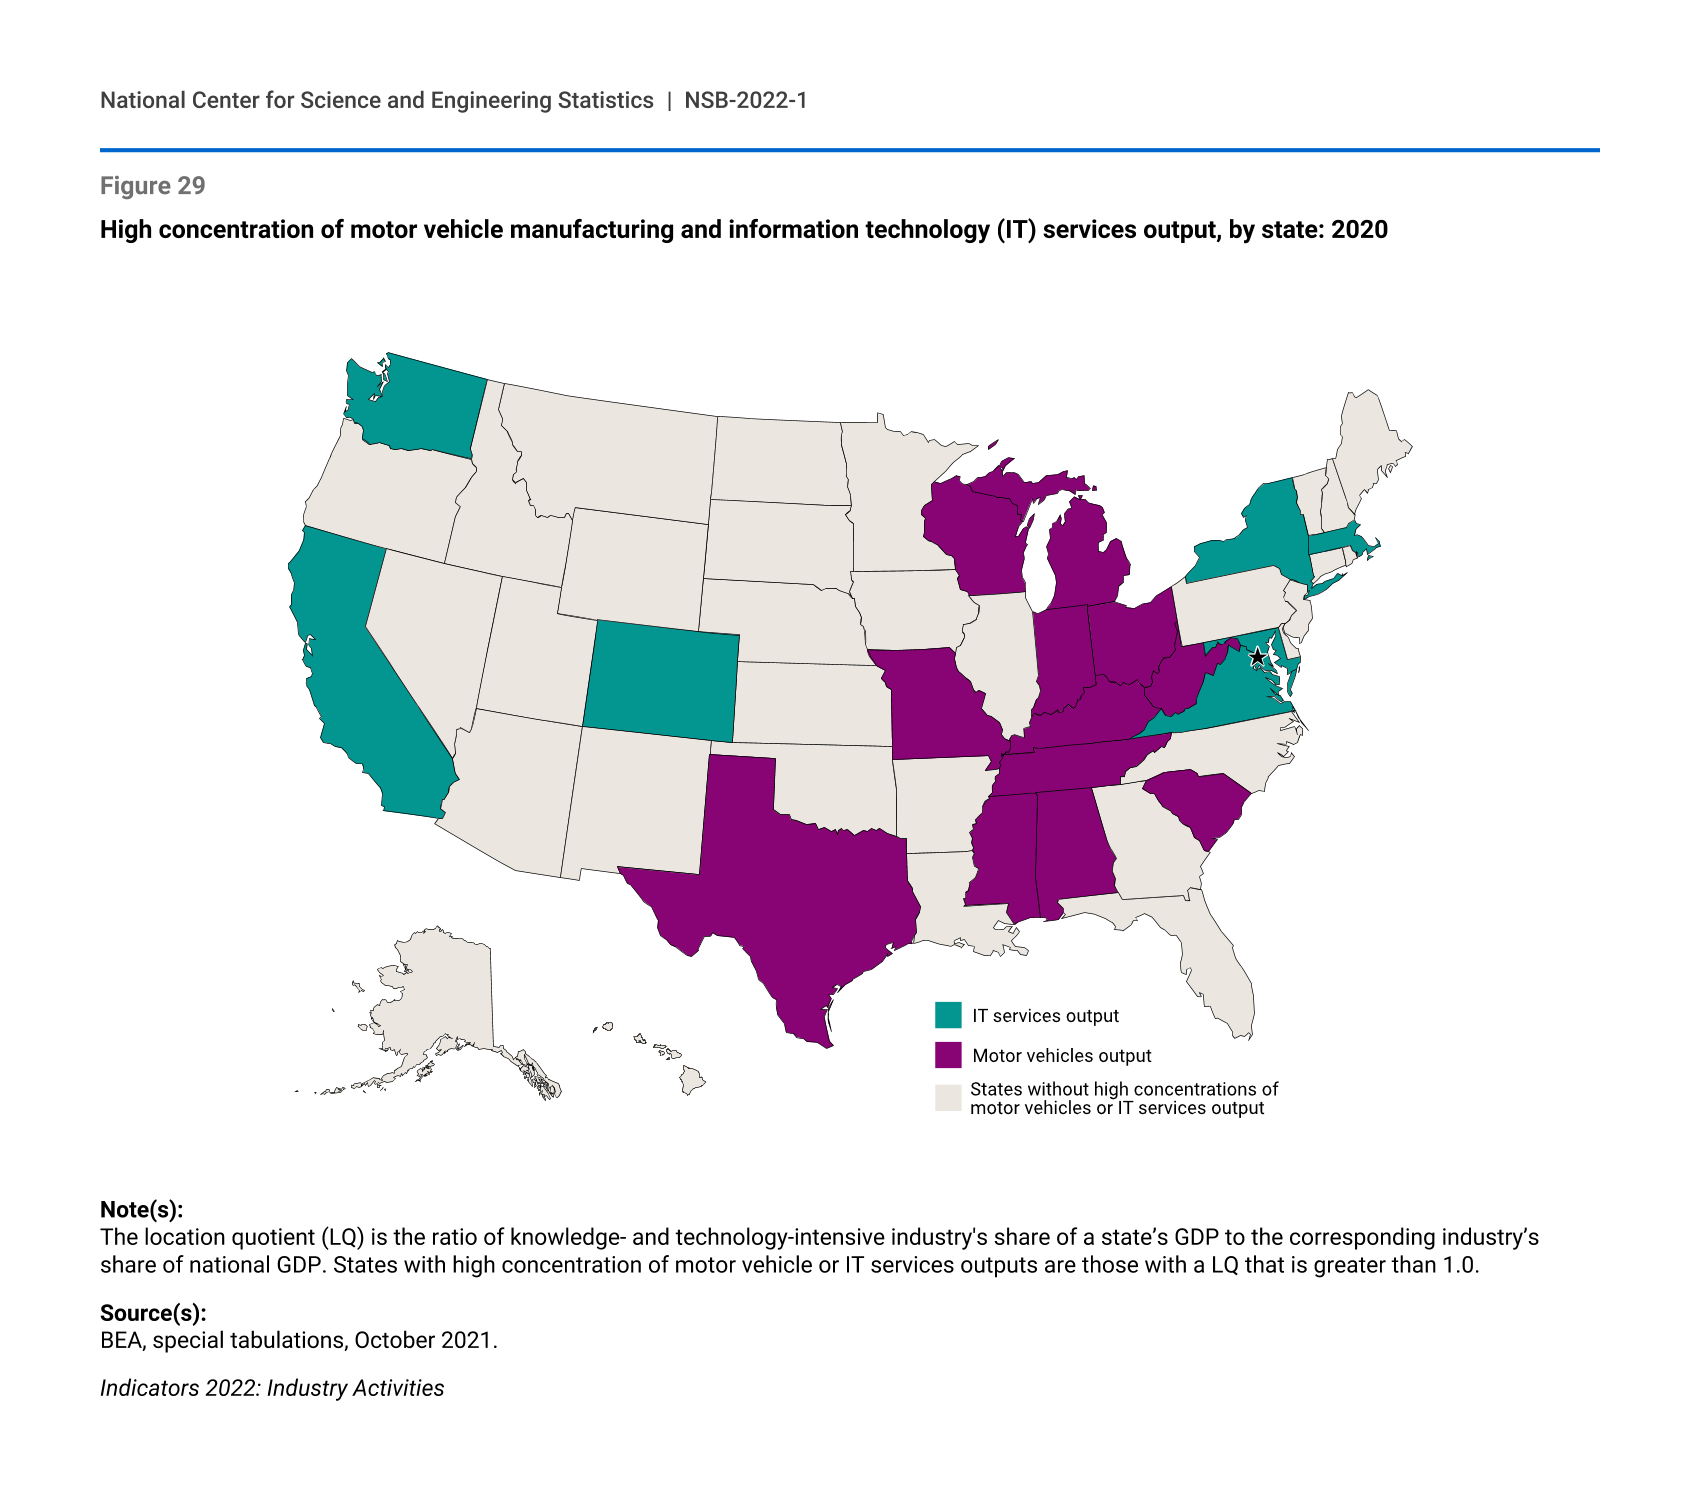
Specialization in production of KTI industry output also varies by state (Figure 29). The location quotient (LQ) measures each state’s specialization in KTI industry output (see Glossary for definition of location quotient). The LQ analysis reveals that states on the coasts are relatively more specialized in IT services, and those in the Midwest are more specialized in the production of motor vehicles. In particular, California’s IT services output as a share of its GDP is more than two times the national average. Virginia and Washington produce IT services output as a share of their GDPs close to twice that of the national average. Michigan, Indiana, Kentucky, Tennessee, and Alabama produce motor vehicle manufacturing output as a share of their GDPs at more than three times the national average; South Carolina, Mississippi and Ohio produce two to three times the national average.
High concentration of motor vehicle manufacturing and information technology (IT) services output, by state: 2020
Note(s):
The location quotient (LQ) is the ratio of knowledge- and technology-intensive industry's share of a state’s GDP to the corresponding industry’s share of national GDP. States with high concentration of motor vehicle or IT services outputs are those with a LQ that is greater than 1.0.
Source(s):
BEA, special tabulations, October 2021.